Submitted:
28 April 2023
Posted:
04 May 2023
You are already at the latest version
Abstract
Epstein-Barr virus (EBV)-encoded RNAs (EBERs) are structurally conserved small, noncoding RNAs constitutively expressed in EBV infection. Although primarily localised in the nucleus, EBERs are found in the cytoplasm and exosomes. However, the mechanism(s) of EBERs transport is not known. This study aimed to investigate the structural impact of EBER1 on its transport. EBER1 stem-loop (SL) deletion mutants (ΔSL1, ΔSL3 and ΔSL4) were created and stably transfected into HEK293T cells. The expression of EBER1 was quantified in total cell, nuclear, cytoplasmic and exosomal fractions. The quantification was performed in the presence of physiological expression of RPL22 and La, and after silencing them. These proteins are believed to be involved in EBER1 transport and secretion. Compared to the wildtype EBER1 transfectants, the expression level of EBER1 gene in all mutants was significantly lower in the total cell, cytoplasmic and exosomal fractions. However, ΔSL3 mutant showed significant nuclear retention. Silencing RPL22 resulted in increased nuclear-cytoplasmic trafficking of EBER1. Silencing La protein did not affect EBER1 secretion. Alternatively, the store-operated intracellular Ca2+ was found to correlate with EBER1 expression in exosomes. Taken together, EBER1 structure and its interaction with RPL22 appeared to be important in the nuclear-cytoplasmic transport of the RNA.
Keywords:
EBER1
; Intracellular transport
; RPL22
; Secretion
; Structure
1. Introduction
Epstein-Barr virus (EBV) is an oncogenic virus that infects and establishes latency in >90% of the human population worldwide [1,2]. EBV infection is divided into lytic and latent infection [1,3]. During latency, up to a dozen viral latent products are expressed, namely, six nuclear antigens (EBNAs), three membrane proteins (LMP) and a number of noncoding RNAs. Depending on the pattern of latent gene expression, EBV latency is subdivided into four programs referred to as latency 0, I, II and III [2]. In type 0 latency, EBV shuts down the production of all its latent products except the noncoding RNAs, most notably EBV-encoded RNAs (EBERs) [4,5,6]. EBERs are two small, structurally conserved transcripts that are constitutively expressed at >106 copies per EBV-infected cell [7]. Despite their abundant expression, the role of EBERs in EBV biology or associated pathogenesis remains poorly understood. EBERs are believed to be involved in many pathogenic processes, including the spread of EBV through improved cell-cell communication via exosomes [8]. Although EBERs are primarily localised in the nucleus, a proportion is detected in the cytoplasm and exosomes [9,10]. However, the mechanisms involved in the intracellular transport and secretion of EBERs remain to be elucidated.
The transport of EBERs from the nucleus to other subcellular compartments and their extracellular secretion could be related to their structure. This is because the structure of an RNA is known to influence its functions [11,12,13]. For instance, in EBV, mutations in EBER genes were linked to reduced cell proliferation [14]. Likewise, disrupting the structure of EBER2 abolished more than 20% of its ability to induce gene expression [15]. Similarly, the structure of RNA has been shown to affect transport in plants. The systemic transport of potato spindle tuber viroid was influenced by several stem-loops of its RNA [16]. A single-nucleotide mutation in the extracellular NH2-terminal β1 domain of murine class II I-A transmembrane glycoprotein caused cytoplasmic accumulation of the glycoprotein and abolished its secretion [17]. Thus, the structure of an RNA appears to be important in its intracellular transport and secretion in many different biological systems.
Secondly, the interaction of RNA with proteins is associated with their cellular transport and secretion [8]. EBERs exist in cells as ribonucleoproteins, interacting with several cellular proteins. These protein interactions are also linked to the biological effects of EBERs [14,18], including conferring resistance to innate immune antiviral processes [19,20,21], regulating cellular and EBV gene expressions [15,20], and facilitating cell transformation [18,20,22]. For example, the interaction of EBER1 with ribosomal protein L22 (RPL22) has been shown to be crucial for EBER1 proliferative advantage [14]. Similarly, EBER1 interaction with RPL22 and Lupus antigen (La) is presumed to be responsible for its intracellular transport and secretion into exosomes, respectively [8,10].
Thirdly, the secretion of vesicles, including exosomes, is one mechanism by which cells maintain homeostasis. This physiological process is prone to be hijacked by viruses to promote infection by transmitting pathogen-related molecules [23]. While the mechanism of EBERs secretion into exosomes is not known, it has been suggested that intracellular calcium ion ([Ca2+]i) could be involved. This is because the secretion of vesicles can be triggered and controlled by Ca2+ release from intracellular Ca2+ stores [24,25,26]. Furthermore, EBER1 was shown to increase Ca2+ influx in transfected cells compared to the control cells [27]. Taking all these observations into consideration, investigating the mechanisms of EBERs transport is crucial for a proper understanding of their role in EBV biology and associated diseases. Therefore, the aim of this study was to investigate the structural impact and mechanisms of nuclear-cytoplasmic transport and secretion of EBER1.
2. Materials and Methods
2.1. Generation of EBER1 stem-loop mutants, cloning and transfection
Sequences corresponding to stem-loop (SL) 1, 3, and 4 were individually deleted from EBER1 to create three mutants: ∆SL1, ∆SL3, ∆SL4 deletion mutants. EBER1 SL mutants were generated using spliced overlap extension PCR [28]. To generate full-length EBER1 mutant, EBER1 outer primers (forward and reverse) (Supplementary Table S1) were used. Similarly, the EBER1 outer primers were used for all subsequent PCRs for all mutants and the wildtype. EBER1 outer primers were flanked with HindIII and BglII restriction enzymes in the forward and reverse primer, respectively, to control the orientation of the insert. Cloning was done using T4 DNA ligase (NEB, UK) according to the manufacturer’s instructions. The clones were transfected into HEK293T cells using calcium phosphate [29]. Hygromycin B was used as the selection marker. Stable clones were confirmed by RT-PCR and in situ hybridisation [30,31].
2.2. Determination of plasmid copy number
Plasmid copy number was determined to account for the number of plasmids present and their gene expression efficiency in the transfected cells. This is important to eliminate (if any) interference of EBER1 copies with its structural impact. Both EBER1 and Hygromycin B genes were used in determining the plasmid copy number.
We made a tenfold serial dilution of the purified EBER1 recombinant plasmid for each construct (wildtype, SL1, SL3, SL4) [32]. EBER1 gene was amplified from these plasmid dilutions by qPCR using Power SYBR® Green PCR master mix (Applied Biosystems, USA) to generate a standard calibration curve [32]. qPCR reactions were performed in duplicates. Melt curve analysis was performed. All dilution(s) with multiple or nonspecific peaks were excluded from the analysis. The copies of EBER1 in each plasmid dilution were calculated using Avogadro’s formula [33]. A standard calibration graph was then generated by plotting the mean CT values of each plasmid dilution against the LOG10 of its copies.
Next, EBER1 gene was amplified using qPCR from 10-fold serial dilutions of cDNA and gDNA isolated from the transfected cells. Plasmid copies in the transfected cells were extrapolated from the slope and intercept of the standard calibration graph. The plasmid copy number obtained using cDNA was divided by the plasmid copy number obtained using its corresponding gDNA. This ratio was calculated to account for the transcription efficiency.
The same plasmid copy number process was repeated by amplifying Hygromycin B gene. Therefore, plasmid copy number in each cell line was obtained from the mean copy number calculated from EBER1 gene and Hygromycin B gene and presented per microlitre of DNA.
2.3. Cell culture
HEK293T cells were cultured in Dulbecco Modified Eagle’s Medium (DMEM), supplemented with 10% FBS, 0.1% Gentamycin, 1% Penicillin-streptomycin (100units/mL and 100 μg/mL, respectively). HEK293T cell lines with stable transfection of pHebo, EBER1 wildtype, or EBER1 deletion mutants, 150 µg/mL of Hygromycin B (Gibco, USA) was added to the media. Cells were grown for 2-3 days (>90% confluence) at 37℃, 5% CO2.
2.4. Isolation and characterization of exosomes
Exosomes were isolated from cell culture media by differential ultracentrifugation and visualised under transmission electron microscopy (TEM) [34]. Biophysical properties of the exosomes were analysed using a Zeta/nanoparticle analyser (NanoPlus 3, Japan) based on the principles of dynamic light scattering [35,36]. This was done by measuring the dynamic light scattering from the exosomal particles. Briefly, exosomes were resuspended in 1 mL 1xPBS, and the particle sizes (based on both intensity and volume) and polydispersity index were measured for 70 sec at an angle of 45° and a temperature of 25℃. Zeta potential was measured at five frequencies, between -1 to +1. Finally, each physical property was overlayed to compare the transfectants (wildtype EBER1 and mutants). Exosomal proteins, flotillin 1 and CD63, were detected by Western blot using anti-flotillin 1 monoclonal antibody (ab133497, Abcam, UK), and anti-CD63 monoclonal antibody (ab8219, Abcam, UK), respectively. Similarly, exosomal RNA, RNU6 was amplified by PCR. Primer details are provided in Supplementary Table S1.
2.5. Isolation of total and subcellular nucleic acids and qRT-PCR
Genomic DNA was isolated using Qiagen DNA extraction kit (QIAamp®, Germany) according to the manufacturer’s instructions. RNA was isolated using TRIzol Reagent (Invitrogen, USA) protocols. Subcellular fractions (nucleus and cytoplasm) were purified using the method of Greenberg & Bender [37] as previously described [38]. A total of 5 µg RNA was DNase treated and reverse transcribed to cDNA using Promega A3500 kit (Thermo Fisher Scientific, USA) according to the manufacturer’s instructions. A total of 100 ng of gDNA/cDNA was amplified using power SYBR® Green PCR master mix (Applied Biosystems, UK) in a 40-cycle reaction using QuantStudioTM 7 Flex System Applied Biosystems, Germany). Melt curve analysis was performed. Spliced and unspliced β–actin was used to check for the quality of the fractionation. β–actin and spliced β–actin was used as loading controls and for the normalization of qRT-PCR data for total cellular and subcellular, respectively. The list of primers used in this study is presented in Supplementary Table S1.
2.6. Isolation of total and subcellular proteins and Western Blot
Total cellular proteins were isolated by radioimmunoprecipitation assay (RIPA) buffer. Subcellular proteins were purified according to the protocol of Baghirova et al. [39]. Since our interest was in the nuclear-cytoplasmic movement of EBER1, proteins from the cytosol and membrane-bound organelles were mixed in a 1:1 ratio and used as cytoplasmic proteins. Protein concentration was determined using the Bradford assay by measuring the absorbance at 595 nm wavelength. A total of 25–50 µg of proteins were separated on 10–12 % SDS-polyacrylamide gel electrophoresis (PAGE) and transferred onto a nitrocellulose membrane [40]. The membrane was blocked in 5 % BSA and immunoblotted with the desired antibody. A horseradish peroxide-conjugated secondary antibody specific to the primary antibody was then used for detection. Membranes were developed with ECL Western blotting substrate kit (Azure Biosystems, USA) according to the manufacturer’s instructions and imaged (Azure Biosystems, USA). The list of primary antibodies used in this study is presented in Supplementary Table S2.
2.7. In silico prediction of RNA structure and protein-RNA interactions
2D secondary structures of the EBER1 wildtype and mutants were predicted with minimum free energy using mfold server (http://www.unafold.org/mfold/applications/rna-folding-form-v2.php). The mfold structural prediction was then validated by Computational Recognition of Secondary Structure (CROSS). We used the Global-Score consensus, specifically trained PARS-Human algorithms [13,41]. The CROSS structure was interpreted as double-stranded regions if the score was greater than 0 [41]. In silico interaction of EBER1 with cellular proteins, RPL22 and La, was performed using RPISeq (http://pridb.gdcb.iastate.edu/RPISeq/). Furthermore, catRAPID omics were used to compute the interaction propensities of the nucleic acid binding proteomes of EBER1 versus RPL22 and La [41]. The catRAPID analysis was computed against the Homo sapiens RNA-binding sub-proteome model.
2.8. siRNA silencing of RPL22 and La proteins
A total of 2x10⁵ cells were cultured overnight in 1 mL DMEM (Gibco, USA) supplemented with 10% FBS and Hygromycin B, without the other antibiotics. The cells were then transfected in opti-MEM (Gibco, USA) with either RPL22-specific or La-specific siRNA (Santa Cruz Biotechnology, USA) for 48 hours following the manufacturer’s instructions. Non-silencing siRNA (scrambled) and no siRNA (mock) were used as negative controls. Cells were harvested by centrifugation at 2000 xg for 10 min and resuspended in PBS for the isolation of total and subcellular RNA and proteins. Exosomes were isolated from the supernatants of the same cultures using ExoQuick-TC kit (System Bioscience, USA) according to the manufacturer’s instructions.
2.9. Evaluation of the intracellular calcium influx via the SOCE
Cells were grown in 2.5% FBS-supplemented media for 24 hours and prepared for intracellular Ca2+ ([Ca2+]i) imaging. Briefly, cells were washed in physiological saline solution (PSS) and loaded in 1 mL solution of PSS containing 10 mM Fluo-8/AM, 0.25% pluronic F-127, and 2 mM probenecid for 1 hour in the dark at room temperature. A standard Ca2+ re-addition protocol [42] was used to evaluate the store-operated calcium entry (SOCE) after Ca2+ depletion of the endoplasmic reticulum (ER) by inhibiting the SERCA pump with 1 µM thapsigargin. The [Ca2+]i concentration was measured using a cooled EM CCD camera (Andor Technology, UK) connected to a fluorescence microscope (Zeiss Axiovert 405M). Data acquisition was performed using iQ 1.8 software (Andor Technology, UK). IgorPro 7 (Wavemetrics, USA) was used for data analysis and graphing purposes.
2.10. Statistical analysis
Experiments were performed in duplicates and repeated at least three times, unless otherwise stated. Data were expressed as means ± standard error of the mean (SEM) calculated using Microsoft Excel (Microsoft, USA). The difference between wildtype EBER1 and each of the mutants was determined using a two-tailed student t-test assuming equal variance. P-values of less than or equal to 0.05 were considered statistically significant and presented in the figures. Graphs were generated using Microsoft Excel (Microsoft, Redmond, WA, USA), GraphPad Prism 8 (GraphPad Prism, USA) or Igor Pro 7 (Wavemetrics, USA).
3. Results
3.1. Prediction of RNA structure, confirmation of mutation and transfection, and determination of plasmid copy number
Mutations in EBER1 were created by deleting sequences corresponding to SL1, SL3 and SL4 in wildtype EBER1. The mutations were confirmed by Sanger sequencing. Multiple sequence alignment revealed the deletion of 22 nt at position 13-34, 26 nt at position 59-84, and 43 nt at position 84-126, of ΔSL1, ΔSL3 and ΔSL4 mutants, respectively [43]. The mutants were predicted to have similar structural folding to the wildtype EBER1 with their respective SL missing (Figure 1). The predicted structure of EBER1 wildtype accurately maps to the chemically-probed established structure of EBER1 [44]. Minimum energies of formation were -70.60, -63.10, -57.00 and -53.53 kcal/mol for the wildtype EBER1, ΔSL1, ΔSL3 and ΔSL4 mutants, respectively.
All EBER1 (wildtype and mutants) stable cell lines grew in hygromycin B-supplemented media. EBER1-specific in situ hybridisation showed strong nuclear EBER1 signal in the EBV-infected cell line, B95.8 used as positive control (Figure 2a). Cells transfected with pHebo (plasmid without the EBER1 insert) and the untransfected cells were clearly negative for EBER1 expression (Figure 2b,c). However, cells transfected with EBER1 were positive (Figure 2d,e,f). ΔSL4 mutant contains deletion in the probe binding region, so, we could not confirm its transfection using ISH. Therefore, we independently verified the transfection by RT-PCR. EBER1 and hygromycin B expression were observed in all EBER1 cell lines (Figure 2g). pHebo cells expressed hygromycin B but not EBER1 (Figure 2g), indicating the presence of the plasmid without EBER1 insert.
Next, we determined the plasmid copy number in the EBER1 transfected cells. Based on the calibration graphs generated using qRT-PCR analysis of the purified plasmids, we extrapolated that there were 0.81, 9.88, 2.49 and 15.13 EBER1 copies/µL of DNA in the wildtype, ΔSL1, ΔSL3 and ΔSL4 transfected cells, respectively. Since there are differences in the plasmid copy number, we normalised (by dividing) the subsequent EBER1 quantifications with these copy numbers to eliminate (if any) interference of EBER1 copies with its structural impact on its transport.
3.2. Characterisation of exosomes and subcellular fractionations
The exosomal fractions under TEM showed particles of 50-120 nm in size and cup-shaped to round morphology, typical of exosomes (Figure 3a,b) [10]. Furthermore, these vesicles expressed exosomal proteins, flotillin 1 and exosomal RNA, RNU6 (Figure 3c) [45,46,47]. The physical properties of these particles indicated that they have a monodispersed size that peaked between 70-130 nm in diameter (Figure 3d). In addition, they were negatively charged, as evidenced by their zeta potentials (Table 1). This corresponds to the net charge of exosomes [48]. The polydispersity index and zeta potentials were similar in all cells, with around 0.2 indexes and -100 to -300 mV, respectively (Figure 3e). The quality of the subcellular fractionations for RNA isolation was confirmed by spliced and unspliced β–actin. Spliced β–actin RNA was amplified in both nuclear and cytoplasmic fractions, whereas the unspliced β–actin was found only in the nuclear fraction (Figure 3f). This is in line with the general concept that only spliced and mature mRNA is transported to the cytoplasm [49,50]. Similarly, the subcellular fractionation for protein isolation was confirmed by Western blotting for Histone 3 and GAPDH as nuclear and cytoplasmic markers, respectively (Figure 3g).
3.3. The conserved structure of EBER1 influences its nuclear-cytoplasmic transport but not its secretion into exosomes
After normalizing to the plasmid copy number, all three mutants had significantly lower expression of EBER1 in total cellular, cytoplasmic and exosomal fractions compared to the wildtype (Figure 4a,c,d). However, in the nuclear fraction, ΔSL3 mutant showed significantly increased expression (Figure 4b). Since EBERs are primarily localized in the nucleus, we set the nuclear expression as 100% to calculate the relative percentage of nuclear-cytoplasmic transport in each cell line. We found that less than 20% of the nuclear EBER1 was transported to the cytoplasm (Table 2). Interestingly, the ΔSL3 mutant had the least percentage of nuclear-cytoplasmic transport (only 9.32%). This indicates that SL3 could be important in the nuclear-cytoplasmic trafficking of EBER1. Similarly, the cytoplasmic expression was set at 100% for each cell line to calculate the relative percentage of EBER1 secreted into exosomes. Only around 5-6% of cytoplasmic EBER1 were secreted out in exosomes, and there was no significant difference between the wildtype EBER1 and the mutants (Table 2).
3.4. In silico analysis of EBER1-protein interactions
In addition to its structure, EBER1 interaction with proteins, particularly RPL22 and La, has been hypothesized to be involved in its transport [8,10,51]. In our study design, we cloned the EBER1 gene alone, without any other EBV genes. To address if EBER1 directly interacts with these proteins, we performed in silico predictions to model for these interactions. RPISeq interaction propensities predicted the interaction of EBER1 (wildtype and mutants) with RPL22 protein. By contrast, the interaction with La protein was weakly predicted, especially in ΔSL1 and ΔSL3 mutants (Table 3). These predictions were validated with catRAPID omics. The catRAPID algorithm predicted 57 human cellular proteins that possibly interact with EBER1 (Supplementary Table S3). Of these, 15 were ribosomal proteins, including RPL22. The analysis predicted RPL22 to bind to EBER1 with 99% interaction strength, 91% discrimination power, and a 0.55 Z-score. On the other hand, La protein was not among the 57 predicted EBER1-binding proteins.
RPISeq predicts RNA–protein interactions based on two nonredundant benchmark datasets classifiers; Support Vector Machine (SVM) and Random Forest (RF). RPISeq generates interaction probabilities that range from 0 to 1, with 0.5 being the threshold that indicates the likelihood of interaction between the RNA and the corresponding protein [52].
3.5. Interaction of EBER1 with RPL22 affects its nuclear-cytoplasmic transport
To investigate the hypothesised involvement of RPL22 in the transport of EBERs, we silenced the protein using siRNA technique. Treating cells with siRNA specific for RPL22 successfully silenced RPL22 protein (Figure 5a,b and Supplementary Figure S1a). The total cellular expression of RPL22 after siRNA treatment was observed to correlate with EBER1 expression (Supplementary Figure S1a,b). Since we observed a direct correlation of RPL22 and EBER1 expressions in the whole cell, we then fractionated the cells to investigate if RPL22 silencing affects the subcellular distribution of EBER1. We found less than 20% expression of both RPL22 and EBER1 genes in the nucleus of cells transfected with wildtype EBER1 and ΔSL1 (Figure 5c and Table 4). These cells had more than 80% cytoplasmic expression of both genes (Figure 5d and Table 4). This correlation suggests that the nuclear-cytoplasmic transport of EBER1 could be related to the localization of RPL22. In ΔSL3 and ΔSL4 mutants, however, both genes were expressed at higher levels of 80-90% in the nucleus (Figure 5c and Table 4). Surprisingly, these mutants had a high cytoplasmic expression (up to 40%) of EBER1 gene but not RPL22 (Figure 5d and Table 4). This indicates that although silencing RPL22 protein may affect EBER1 transport to the cytoplasm, the structure of EBER1 could also have an impact. So, we compared the cytoplasmic expression of EBER1 observed in ΔSL3 and ΔSL4 mutants after RPL22 silencing (Figure 5c) to their expression in the presence of normal physiological levels of RPL22 (Figure 4c). We found that the RPL22 silenced cells had increased EBER1 expression in the cytoplasm compared to the physiologically normal cells. This further suggests the involvement of RPL22 in the nuclear-cytoplasmic transport of EBER1. Furthermore, there may be an alternative mechanism of EBER1 transport to the cytoplasm. Since we observed higher expression of EBER1 but not RPL22 in the cytoplasmic fractions of SL3 and SL4 mutants. Statistically, the subcellular expression of RPL22 and EBER1 genes showed a direct positive correlation in both the nucleus (p=0.0388) and cytoplasm (Supplementary Figure S2).
3.6. Silencing cellular La protein does not correlate to the expression of EBER1 in the exosomes
EBER1-La interaction was hypothesised to sort cytoplasmic EBER1 into exosomes [8,10]. Here, we quantified the expression of EBER1 in the total cellular and exosomal fractions after silencing the La protein using La-specific siRNA. siRNA-treated cells had reduced expression of cellular La protein (Figure 6a, and Supplementary Figure S3e); however, this did not affect the secretion of the protein into the exosomes (Figure 6b and Supplementary Figure S3f). Similarly, qRT-PCR analysis showed that La expression does not directly correlate with EBER1 expression in both cellular and exosomal fractions (Figure 6c,d and Supplementary Figure S3a–d).
3.7. Intracellular influx of [Ca2+]i could be involved in the secretion of EBER1 into exosomes
Since the previously hypothesised involvement of EBER1-La interaction in the secretion of EBER1 into exosomes did not yield a correlation in our hands, we explored the store-operated Ca2+ entry (SOCE) as a potential mechanism controlling the EBER1 secretion. It is known that Ca2+ release from intracellular Ca2+ stores triggers and controls exocytosis [24]. Furthermore, EBER1 was shown to increase the store-depletion induced Ca2+ influx into cells [27]. In this study, we found a correlation between [Ca2+]i and the exosomal expression of EBER1. Compared to the pHebo negative control cells, there was an increased [Ca2+]i entry in cells transfected with the wildtype EBER1, ΔSL3 and ΔSL4 mutants (Figure 7a,b). This increase in [Ca2+]i is related to the SOCE since it corresponds to increased expression of the endoplasmic reticulum (ER) Ca2+ sensor, STIM1 (Figure 7c,d). STIM1 is a gene responsible for triggering SOCE channels after ER depletion. Similarly, the expression of SERCA2 Ca2+ pump, a gene that mediates the ER Ca2+ store refilling, was high in pHebo compared to the wildtype (Figure 7c,d). ΔSL1 mutant had a lower expression of SERCA2 (Figure 7c,d), implying that it may not have a higher Ca2+ ER refilling rate. Thus, ΔSL1 may have higher cytosolic Ca2+, which may lead to the increased secretion of cytoplasmic EBER1-containing vesicles into exosomes. This proposed mechanism could be responsible for the slightly higher percentage of EBER1 secretion in this mutant (Table 2).
4.0. Discussion
RNA is a versatile and dynamic macromolecule that encodes for both genetic and functional information. The sequence of an RNA determines its secondary structure [13], which in turn can influence its biological functions [11,12]. These functions include cellular transport and secretion [16,17]. In this study, we deleted the stem-loop forming sequences of EBER1 to investigate the impact of its structure on its intracellular transport and secretion. Notably, all three EBER1 mutants investigated in this study folded into secondary structures similar to the chemically-probed established structure of the wildtype EBER1 [44]. The structure of EBERs involves the formation of dsRNA by intramolecular self-complementarity [44], which is conserved in all EBV strains [19]. The conserved structure of these RNAs [19] implies that it could be important for their functions. The findings of this study showed that the sequence of EBER1 is indeed important in its intracellular transport. For example, in ΔSL3 mutant, we observed nuclear retention and a corresponding decrease in the percentage of nuclear-cytoplasmic trafficking of the RNA. This could be explained by two possible scenarios; the intracellular transport of EBER1 is linked to its conserved structure, and/or the mutation may have led to conformational changes in the RNA that affected its binding to protein(s) involved in its transport.
It is known that EBERs exist as ribonucleoproteins (RNP) [7,53]. Their existence as RNPs has been shown to be linked to their various biological functions [18,19]. These functions include conferring resistance to innate immune antiviral processes [19,20], facilitating cell transformation [18,20,22], and regulating viral and cellular gene expression [20,54]. EBERs have also been reported to relocalize cellular proteins [19,51]. As a result, EBER1-protein interaction was hypothesised to be involved in the transport and secretion of the RNA [8,10]. We tested this hypothesis. We considered the transport of EBERs to exosomes as a two-step movement; (1) nuclear-cytoplasmic trafficking and (2) secretion from the cytoplasm into exosomes. In EBER1 particularly, these steps were presumed to be facilitated by the interaction of the RNA with RPL22 and La. Upon EBV infection, RPL22 translocates from the nucleoli to the nucleoplasm, and the protein interacts with EBER1 [8,51]. Therefore, we thought the protein could be involved in the initial steps for the transport of EBER1 to the cytoplasm. Subsequently, EBER1-La interaction was hypothesised to facilitate the secretion of cytoplasmic EBER1 into exosomes [8,10]. In addition to the mutations, the two EBER1-binding proteins, RPL22 and La, were silenced to shed light on the possible mechanisms involved.
Given the increased cytoplasmic expression of EBER1 after the silencing of RPL22, our data indicate that EBER1-RPL22 interaction retains the RNA in the nucleus. Since the cellular function of RPL22 is still not well established, it is challenging to project the function linked to its interaction with EBER1 and the importance of this interaction in the EBV life cycle or associated diseases. Nonetheless, EBER1-RPL22 interaction is shown to be crucial for EBER1-induced proliferation [14]. Moreover, from our data, the nuclear retention of EBER1 could perhaps be part of the functions of nuclear RPL22 and the reason for its relocation to nucleoplasm during EBV infection [20,51]. Thus, it could be that the nuclear RPL22 functions as a cell defence mechanism by hindering the spread of pathogen or pathogen-related products. Since RPL22 silencing led to varying degrees of increased cytoplasmic expression of EBER1 in the mutants, it could be possible that the nuclear-cytoplasmic transport of EBER1 is a combined effect of its structure and interaction with RPL22. In ΔSL3 mutant, for instance, silencing RPL22 resulted in approximately 43% EBER1 expression in the cytoplasm as opposed to only about 9% in the presence of normal physiological expression of the protein.
On the EBER1-La interaction, however, our data did not indicate a correlation between silencing cellular La protein and the expression of EBER1 in exosomes. This lack of correlation suggests that La protein may not be directly involved in the secretion of EBER1 in exosomes. Nevertheless, both La protein and EBER1 were present in the exosomes, as previously reported [10,53,55]. Alternatively, the two (EBER1 and La) could be sorted independently into exosomes. In their study, Baglio and colleagues [53] pointed out the possibility of EBER1 being sorted into exosomes without La. Rather, they suggested that EBERs’ interaction with La protein helps the RNA evade cytosolic immune sensors [53].
As an alternative strategy to understand the mechanism of EBER1 secretion into exosomes, we explored the intracellular Ca2+ signalling pathway. Ca2+ release from intracellular Ca2+ stores is known to trigger and control the secretion of vesicles [24]. We found that the expression of EBER1 in the exosomes correlated with the levels of SOCE. However, further studies are required to understand the role of [Ca2+]i signalling pathway in the secretion of EBER1-containing vesicles. Similarly, whether the secretion of La in exosomes has any link to EBER1 secretion or if the two are totally independent events also requires further investigations.
5. Conclusions
The findings from this study indicate that the conserved structure of EBER1, especially ΔSL3, is crucial in its nuclear-cytoplasmic trafficking. RPL22 appears to play a role in retaining EBER1 in the nucleus. This could explain why EBERs are primarily localized to the nucleus in EBV-infected cells. The findings also indicate that although both EBER1 and La are released in exosomes, La does not appear to be directly involved in the secretion of EBER1 in exosomes. We found that the intracellular Ca2+ mediated by SOCE correlates with the exosomal expression of EBER1. Hence, cytosolic Ca2+ could be involved in sorting/secreting EBERs into exosomes. However, further studies are required to elucidate the mechanism(s) involved.
Supplementary Materials
The following supporting information can be downloaded at the website of this paper posted on Preprints.org. Figure S1: Impact of RPL22 silencing on EBER1 expression; Figure S2: Statistical correlation analysis of the impact of RPL22 silencing on the subcellular expression of EBER1; Figure S3: Impact of La silencing on EBER1 expression; Table S1: List of primers used in this study; Table S2: List of antibodies used in this study; Table S3: 57 predicted human proteins that interact with EBER.
Author Contributions
Conceptualisation, Z.H. and G.K.; Methodology, Z.H., P.P., B.B., M.K.A., A.S. and G.K.; Software, Z.H., P.P., B.B., M.K.A. and A.S.; Data Analysis, Z.H., P.P., B.B., M.K.A., A.S. and G.K.; Interpretation, Z.H., P.P., and G.K.; Resources, A.S. and G.K.; Supervision, G.K., A.S., M.K.A.; Funding acquisition, G.K. Writing – Original Draft Preparation, Z.H., and G.K.; Writing – Review & Editing, Z.H., P.P., B.B., M.K.A., A.S. and G.K. All authors have read and approved the final version of the manuscript.
Funding
This research was funded by UAE University, College of Medicine and Health Sciences Grant, grant number 12M091 and Al Jalila Foundation, grant number 21M118.
Institutional Review Board Statement
Not applicable.
Informed Consent Statement
Not applicable.
Acknowledgments
We appreciate the assistance of Dr Farah Mustafa of the Department of Biochemistry and Molecular Biology, College of Medicine and Health Sciences, United Arab Emirates University, during the analysis of the plasmid copy number.
Conflicts of Interest
The authors declare no conflict of interest.
References
- Thorley-Lawson, D.A.; Allday, M.J. The Curious Case of the Tumour Virus: 50 Years of Burkitt’s Lymphoma. Nature Reviews Microbiology 2008 6:12 2008, 6, 913–924. [Google Scholar] [CrossRef] [PubMed]
- Kieff, E.; Rickinson, A.B. Epstein-Barr Virus and Its Replication. In Fields Virology; Lippincott Williams & Wilkins, Philadelphia, 2007; pp. 2603–2654.
- Lorenzetti, M.A.; de Matteo, E.; Gass, H.; Vazquez, P.M.; Lara, J.; Gonzalez, P.; Preciado, M.V.; Chabay, P.A. Characterization of Epstein Barr Virus Latency Pattern in Argentine Breast Carcinoma. PLoS ONE 2010, 5, 1–7. [Google Scholar] [CrossRef] [PubMed]
- Ahmed, W.; Philip, P.S.; Tariq, S.; Khan, G. Epstein-Barr Virus-Encoded Small RNAs ( EBERs ) Are Present in Fractions Related to Exosomes Released by EBV-Transformed Cells. PloS one 2014, 9, e99163. [Google Scholar] [CrossRef]
- Iwakiri, D.; Takada, K. Role of EBERs in the Pathogenesis of EBV Infection. In Advances in Cancer Research; Elsevier: Amsterdam, The Netherlands, 2010; pp. 119–136. [Google Scholar]
- Herbert, K.M.; Pimienta, G. Consideration of Epstein-Barr Virus-Encoded Noncoding RNAs EBER1 and EBER2 as a Functional Backup of Viral Oncoprotein Latent Membrane Protein 1. MBio 2016, 7, e01926–15. [Google Scholar] [CrossRef] [PubMed]
- Lerner, M.R.; Andrews, N.C.; Miller, G.; Steitz, J.A. Two Small RNAs Encoded by Epstein-Barr Virus and Complexed with Protein Are Precipitated by Antibodies from Patients with Systemic Lupus Erythematosus. Proceedings of the National Academy of Sciences of the United States of America 1981, 78, 805–809. [Google Scholar] [CrossRef]
- Chavez-Calvillo, G.; Martin, S.; Hamm, C.; Sztuba-solinska, J. The Structure-To-Function Relationships of Gammaherpesvirus-Encoded Long RNAs and Their Contributions to Viral Pathogenesis. Non-coding 2018, 4. [Google Scholar] [CrossRef]
- Schwemmle, M.; Clemens, M.J.; Hilse, K.; Pfeifer, K.; Tröster, H.; Müller, W.E.; Bachmann, M. Localization of Epstein-Barr Virus-Encoded RNAs EBER-1 and EBER-2 in Interphase and Mitotic Burkitt Lymphoma Cells. Proc. Natl. Acad. Sci. USA 1992, 89, 10292–10296. [Google Scholar] [CrossRef]
- Ahmed, W.; Tariq, S.; Khan, G. Tracking EBV-Encoded RNAs (EBERs) from the Nucleus to the Excreted Exosomes of B-Lymphocytes. Scientific Reports 2018, 8, 1–11. [Google Scholar] [CrossRef]
- Weeks, K.M. Advances in RNA Secondary and Tertiary Structure Analysis by Chemical Probing. Current Opinion in Structural Biology 2010, 20, 295–304. [Google Scholar] [CrossRef]
- Swadling, J.B.; Ishii, K.; Tahara, T.; Kitao, A. Origins of Biological Function in DNA and RNA Hairpin Loop Motifs from Replica Exchange Molecular Dynamics Simulation. Physical Chemistry Chemical Physics 2018, 20, 2990–3001. [Google Scholar] [CrossRef]
- Wan, Y.; Qu, K.; Zhang, Q.C.; Flynn, R.A.; Manor, O.; Ouyang, Z.; Zhang, J.; Spitale, R.C.; Snyder, M.P.; Segal, E.; et al. Landscape and Variation of RNA Secondary Structure across the Human Transcriptome. Nature 2014, 505, 706–709. [Google Scholar] [CrossRef] [PubMed]
- Houmani, J.L.; Davis, C.I.; Ruf, I.K. Growth-Promoting Properties of Epstein-Barr Virus EBER-1 RNA Correlate with Ribosomal Protein L22 Binding. J Virol. 2009, 83, 9844–9853. [Google Scholar] [CrossRef] [PubMed]
- Eilebrecht, S.; Pellay, F.X.; Odenwälder, P.; Brysbaert, G.; Benecke, B.J.; Benecke, A. EBER2 RNA-Induced Transcriptome Changes Identify Cellular Processes Likely Targeted during Epstein Barr Virus Infection. BMC Research Notes 2008, 1, 11–14. [Google Scholar] [CrossRef] [PubMed]
- Wang; Li, X. ; Zhang, X.; Wang, Q.; Liu, W.; Lu, X.; Gao, S.; Liu, Z.; Liu, M.; Gao, L.; et al. RNA Motifs and Modification Involve in RNA Long-Distance Transport in Plants. Frontiers in Cell and Developmental Biology 2021, 9, 1–10. [Google Scholar] [CrossRef]
- Glimcher, L.H. Structural Mutation Affecting Intracellular Transport and Cell Surface Expression of Murine Class II Molecules. J. Exp. Med. 1988, 167, 541–555. [Google Scholar]
- Yajima, M.; Kanda, T.; Takada, K. Critical Role of Epstein-Barr Virus (EBV)-Encoded RNA in Efficient EBV-Induced B-Lymphocyte Growth Transformation. Journal of Virology 2005, 79, 4298–4307. [Google Scholar] [CrossRef]
- Iwakiri, D. Epstein-Barr Virus-Encoded RNAs: Key Molecules in Viral Pathogenesis. Cancers 2014, 6, 1615–1630. [Google Scholar] [CrossRef]
- Gregorovic, G.; Bosshard, R.; Karstegl, C.E.; White, R.E.; Pattle, S.; Chiang, A.K.S.; Dittrich-breiholz, O.; Kracht, M.; Russ, R.; Farrell, P.J. Cellular Gene Expression That Correlates with EBER Expression in Epstein-Barr Virus-Infected Lymphoblastoid Cell Lines. Journal 2011, 85, 3535–3545. [Google Scholar] [CrossRef]
- Parameswaran, P.; Sklan, E.; Wilkins, C.; Burgon, T.; Samuel, M.A.; Fire, A.Z. Six RNA Viruses and Forty-One Hosts : Viral Small RNAs and Modulation of Small RNA Repertoires in Vertebrate and Invertebrate Systems. PLoS pathogens 2010, 6, e1000764. [Google Scholar] [CrossRef]
- Wu, Y.; Maruo, S.; Yajima, M.; Kanda, T.; Takada, K. Epstein-Barr Virus (EBV)-Encoded RNA 2 (EBER2) but Not EBER1 Plays a Critical Role in EBV-Induced B-Cell Growth Transformation. J Virol. 2007, 80, 11236–11245. [Google Scholar] [CrossRef]
- Zhang; Jiang1, X. ; Bao, J.; Wang, Y.; Liu, H.; Tang, L. Exosomes in Pathogen Infections: A Bridge to Deliver Molecules and Link Functions. Frontiers in Immunology 2018, 9, 90. [Google Scholar] [CrossRef] [PubMed]
- Low, J.T.; Shukla, A.; Behrendorff, N.; Thorn, P. Exocytosis, Dependent on Ca2+ Release from Ca2+ Stores, Is Regulated by Ca2+ Microdomains. Journal of Cell Science 2010, 123, 3201–3208. [Google Scholar] [CrossRef] [PubMed]
- Hansen, N.J.; Antonin, W.; Edwardson, J.M. Identification of SNAREs Involved in Regulated Exocytosis in the Pancreatic Acinar Cell *. Journal of Biological Chemistry 1999, 274, 22871–22876. [Google Scholar] [CrossRef] [PubMed]
- Gaisano, H.Y.; Ghai, M.; Malkus, P.N.; Sheu, L.; Bouquillon, A.; Bennett, M.K.; Trimble, W.S. Distinct Cellular Locations of the Syntaxin Family of Proteins in Rat Pancreatic Acinar Cells. Molecular biology of the cell 1996, 7, 2019–2027. [Google Scholar] [CrossRef] [PubMed]
- Ahmed, W.; Hassan, Z.; Abdelmowla, Y.A.A.; Philip, P.S.; Shmygol, A.; Khan, G. Epstein-Barr Virus Noncoding Small RNA (EBER1) Induces Cell Proliferation by up-Regulating Cellular Mitochondrial Activity and Calcium Influx. Virus Research 2021, 305, 198550. [Google Scholar] [CrossRef] [PubMed]
- Heckman, K.L.; Pease, L.R. Gene Splicing and Mutagenesis by PCR-Driven Overlap Extension. Nature Protocols 2007, 2, 924–932. [Google Scholar] [CrossRef] [PubMed]
- Akhlaq, S.; Panicker, N.G.; Philip, P.S.; Ali, L.M.; Dudley, J.P.; Rizvi, T.A.; Mustafa, F. A Cis-Acting Element Downstream of the Mouse Mammary Tumor Virus Major Splice Donor Critical for RNA Elongation and Stability. J Mol Biol 2018, 430, 4307–4324. [Google Scholar] [CrossRef]
- Khan, G.; Coates, P.J.; Kangro, H.O.; Slavin, G. Epstein Barr Virus ( EBV ) Encoded Small RNAs : Targets for Detection by in Situ Hybridisation with Oligonucleotide Probes. J clin pathol 1992, 45, 616–620. [Google Scholar] [CrossRef]
- Weiss, L.M.; Chen, Y.-Y.; Liu, X.-F.; Shibata, D. Epstein-Barr Virus and Hodgkin’s Disease A Correlative In Situ Hybridization and Polymerase Chain Reaction Study. American Journal of Pathology 1991, 139. [Google Scholar]
- Ryan, J.L.; Fan, H.; Glaser, S.L.; Schichman, S.A.; Raab-Traub, N.; Gulley, M.L. Epstein-Barr Virus Quantitation by Real-Time PCR Targeting Multiple Gene Segments : A Novel Approach to Screen for the Virus in Paraffin-Embedded Tissue and Plasma. The Journal of molecular diagnostics 2004, 6, 378–385. [Google Scholar] [CrossRef]
- Pauling, L. Elements and Compounds. Atomic and Molecular Masses. In General Chemistry, reprinted by Courier in 2014; 992 pages; 1970; p. 96 ISBN 9780486134659.
- Théry, C.; Amigorena, S.; Raposo, G.; Clayton, A. Isolation and Characterization of Exosomes from Cell Culture Supernatants and Biological Fluids. Current Protocols in Cell Biology 2006, 30, 3–22. [Google Scholar] [CrossRef] [PubMed]
- Stetefeld, J.; McKenna, S.A.; Patel, T.R. Dynamic Light Scattering: A Practical Guide and Applications in Biomedical Sciences. Biophysical Reviews 2016, 8, 409. [Google Scholar] [CrossRef] [PubMed]
- Pecora, R. Doppler Shifts in Light Scattering from Pure Liquids and Polymer Solutions. The Journal of Chemical Physics 2004, 40, 1604. [Google Scholar] [CrossRef]
- Greenberg, M.E.; Bender, T.P. Identification of Newly Transcribed RNA. In Curr Protoc Mol Biol; 2007.
- Liao, J.; Ma, L.; Guo, Y.; Zhang, Y.; Zhou, H.; Shao, P.; Chen, Y. Deep Sequencing of Human Nuclear and Cytoplasmic Small RNAs Reveals an Unexpectedly Complex Subcellular Distribution of MiRNAs and TRNA 3 9 Trailers. PLoS One 2010, 5, e10563. [Google Scholar] [CrossRef] [PubMed]
- Baghirova, S.; Hughes, B.G.; Hendzel, M.J.; Schulz, R. Sequential Fractionation and Isolation of Subcellular Proteins from Tissue or Cultured Cells. MethodsX 2015, 2, e440–e445. [Google Scholar] [CrossRef]
- Towbin, H.; Staehelin, T.; Gordon, J. Electrophoretic Transfer of Proteins from Polyacrylamide Gels to Nitrocellulose Sheets: Procedure and Some Applications. Proceedings of the National Academy of Sciences of the United States of America 1979, 76, 4350–4354. [Google Scholar] [CrossRef]
- Sanchez de Groot, N.; Armaos, A.; Graña-Montes, R.; Alriquet, M.; Calloni, G.; Vabulas, R.M.; Tartaglia, G.G. RNA Structure Drives Interaction with Proteins. Nature Communications 2019, 10, 1–13. [Google Scholar] [CrossRef]
- Tong, J.; McCarthy, T. V.; MacLennan, D.H. Measurement of Resting Cytosolic Ca2+ Concentrations and Ca2+ Store Size in HEK-293 Cells Transfected with Malignant Hyperthermia or Central Core Disease Mutant Ca2+ Release Channels. Journal of Biological Chemistry 1999, 274, 693–702. [Google Scholar] [CrossRef]
- Hassan, Z.; Philip, P.S.; Khan, G. The Impact of Deleting Stem-Loop 1 of Epstein – Barr Virus-Encoded RNA 1 on Cell Proliferation. Viruses 2022, 14. [Google Scholar] [CrossRef]
- Glickman, J.N.; Howe, J.G.; Steitz, J.A. Structural Analyses of EBERI and EBER2 Ribonucleoprotein Particles Present in Epstein-Barr Virus-Infected Cells. J. Virol. 1988, 62, 902–911. [Google Scholar] [CrossRef]
- Ha, D.; Yang, N.; Nadithe, V. Exosomes as Therapeutic Drug Carriers and Delivery Vehicles across Biological Membranes : Current Perspectives and Future Challenges. Acta Pharmaceutica Sinica B 2016, 6, 287–296. [Google Scholar] [CrossRef] [PubMed]
- Urbanelli, L.; Magini, A.; Buratta, S.; Brozzi, A.; Sagini, K.; Polchi, A.; Tancini, B.; Emiliani, C. Signaling Pathways in Exosomes Biogenesis, Secretion and Fate. Genes 2013, 4, 152–170. [Google Scholar] [CrossRef] [PubMed]
- Vlassov, A. V.; Magdaleno, S.; Setterquist, R.; Conrad, R. Exosomes: Current Knowledge of Their Composition, Biological Functions and Diagnostic and Therapeutic Potentials. Biochim Biophys Acta 2012, 1820, 940–948. [Google Scholar] [CrossRef] [PubMed]
- Midekessa, G.; Godakumara, K.; Ord, J.; Viil, J.; Lättekivi, F.; Dissanayake, K.; Kopanchuk, S.; Rinken, A.; Andronowska, A.; Bhattacharjee, S.; et al. Zeta Potential of Extracellular Vesicles: Toward Understanding the Attributes That Determine Colloidal Stability. ACS Omega 2020, 5, 16701–16710. [Google Scholar] [CrossRef] [PubMed]
- Hilleren, P.; McCarthy, T.; Rosbash, M.; Parker, R.; Jensen, T.H. Quality Control of MRNA 3′-End Processing Is Linked to the Nuclear Exosome. Nature 2001, 413, 538–542. [Google Scholar] [CrossRef] [PubMed]
- Ohno, M.; Segref, A.; Kuersten, S.; Mattaj, I.W. Identity Elements Used in Export of MRNAs. Molecular Cell 2002, 9, 659–671. [Google Scholar] [CrossRef] [PubMed]
- Toczyski, D.P.; Matera, A.G.; Ward, D.C.; Steitz, J.A. The Epstein–Barr Virus (EBV) Small RNA EBER1 Binds and Relocalizes Ribosomal Protein L22 in EBV-Infected Human B Lymphocytes. PNAS 1994, 91, 3463–3467. [Google Scholar] [CrossRef] [PubMed]
- Muppirala, U.K.; Honavar, V.G.; Dobbs, D. Predicting RNA-Protein Interactions Using Only Sequence Information. BMC Bioinformatics 2011, 12, 489. [Google Scholar] [CrossRef]
- Baglio, S.R.; Eijndhoven, M.A.J. van; Koppers-Lalic, D.; Berenguer, J.; Lougheed, S.M.; Gibbs, S.; Léveillé, N.; Rinkel, R.N.P.M.; Hopmans, E.S.; Swaminathan, S.; et al. Sensing of Latent EBV Infection through Exosomal Transfer of 5′pppRNA. Proceedings of the National Academy of Sciences 2016, 113, E587–E596. [Google Scholar] [CrossRef]
- Gregorovic, G.; Boulden, E.A.; Bosshard, R.; Elgueta Karstegl, C.; Skalsky, R.; Cullen, B.R.; Gujer, C.; Rämer, P.; Münz, C.; Farrell, P.J.; et al. Epstein-Barr Viruses (EBVs) Deficient in EBV-Encoded RNAs Have Higher Levels of Latent Membrane Protein 2 RNA Expression in Lymphoblastoid Cell Lines and Efficiently Establish Persistent Infections in Humanized Mice. Journal of Virology 2015, 89, 11711–11714. [Google Scholar] [CrossRef]
- Kapsogeorgou, E.K.; Abu-Helu, R.F.; Moutsopoulos, H.M.; Manoussakis, M.N. Salivary Gland Epithelial Cell Exosomes: A Source of Autoantigenic Ribonucleoproteins. Arthritis and Rheumatism 2005, 52, 1517–1521. [Google Scholar] [CrossRef] [PubMed]
Figure 1.
Predicted secondary structure of EBER1 wildtype and mutants. Stem-loops 1, 3 and 4 were deleted in EBER1 to create ∆SL1, ∆SL3 and ∆SL4 mutants, as indicated with dotted lines. The mutants have deletion of sequences corresponding to nucleotide positions 13-34 (22 nt), 59-84 (26 nt), and 84-126 (43 nt) of the EBER1 wildtype. These mutants fold into structures similar to the wildtype with the deletion of their respective SL as the most obvious difference. Secondary structures of EBER1 and its mutants were predicted using the mfold web server and probed at the nucleotide level using Global-Score CROSS. Double-stranded regions are indicated in red arrows, while green arrows show single-stranded areas. Arrows are displayed at five nucleotides apart, starting from nucleotide position 5. Structures were based on their minimum free energies of formation.
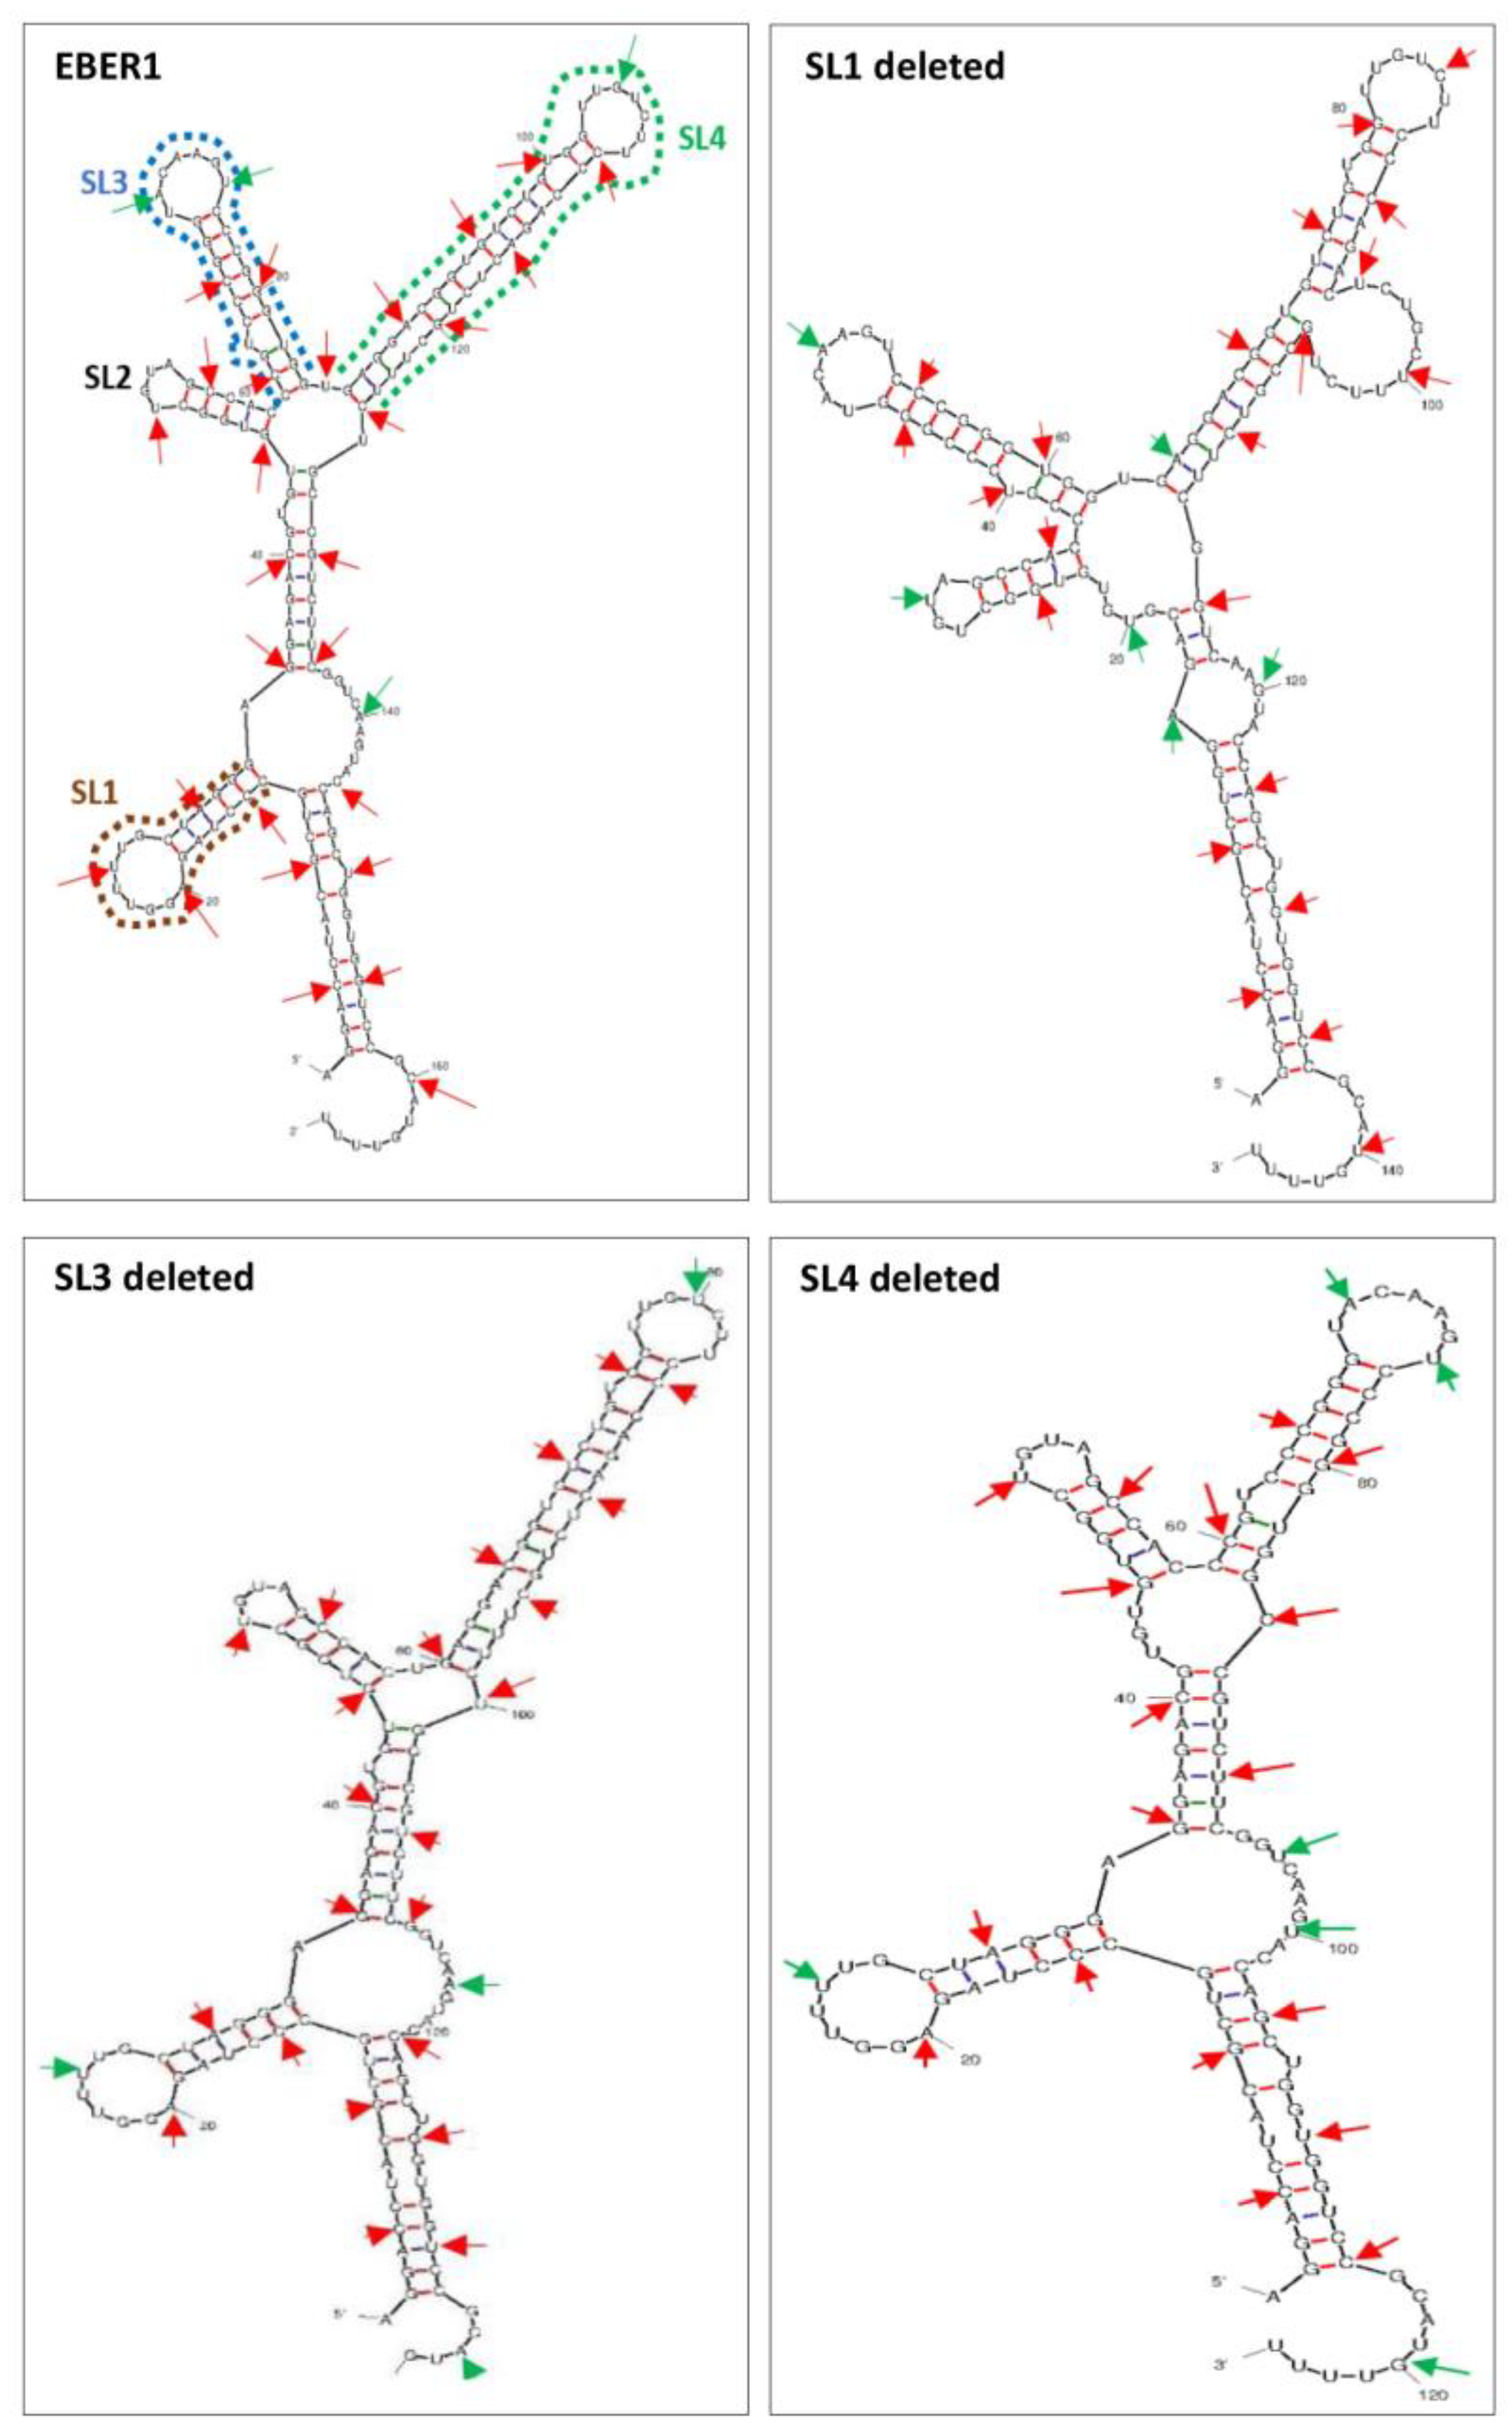
Figure 2.
Confirmation of successful transfection. EBER1 expression in transfected HEK293T cells was confirmed by EBER1-specific in situ hybridization. (a) Strong nuclear signal (brown) was observed in EBV infected cell line, B95.8, used as a positive control. (b) Untransfected cells or (c) cells transfected with pHebo (plasmid without EBER1 insert) were clearly negative for EBER1 expression (blue/purple). Cell transfected with (d) wildtype EBER1 or (e) with ∆SL1 or (f) ∆SL3 were also clearly positive for EBER1. (g) RT-PCR was used to independently confirm the uptake of the plasmid. No-template reaction was used as negative control (-C), whereas cDNA from B95.8 cells was used as positive control (+C). Total cellular RNA was isolated using the TRIzol method and treated with DNase to prevent DNA contamination. 5 µg of the DNase-treated sample was reverse transcribed to cDNA, and 50 ng was used for the RT-PCR to amplify EBER1 gene, Hygromycin B gene, and β–actin – housekeeping and loading controls.
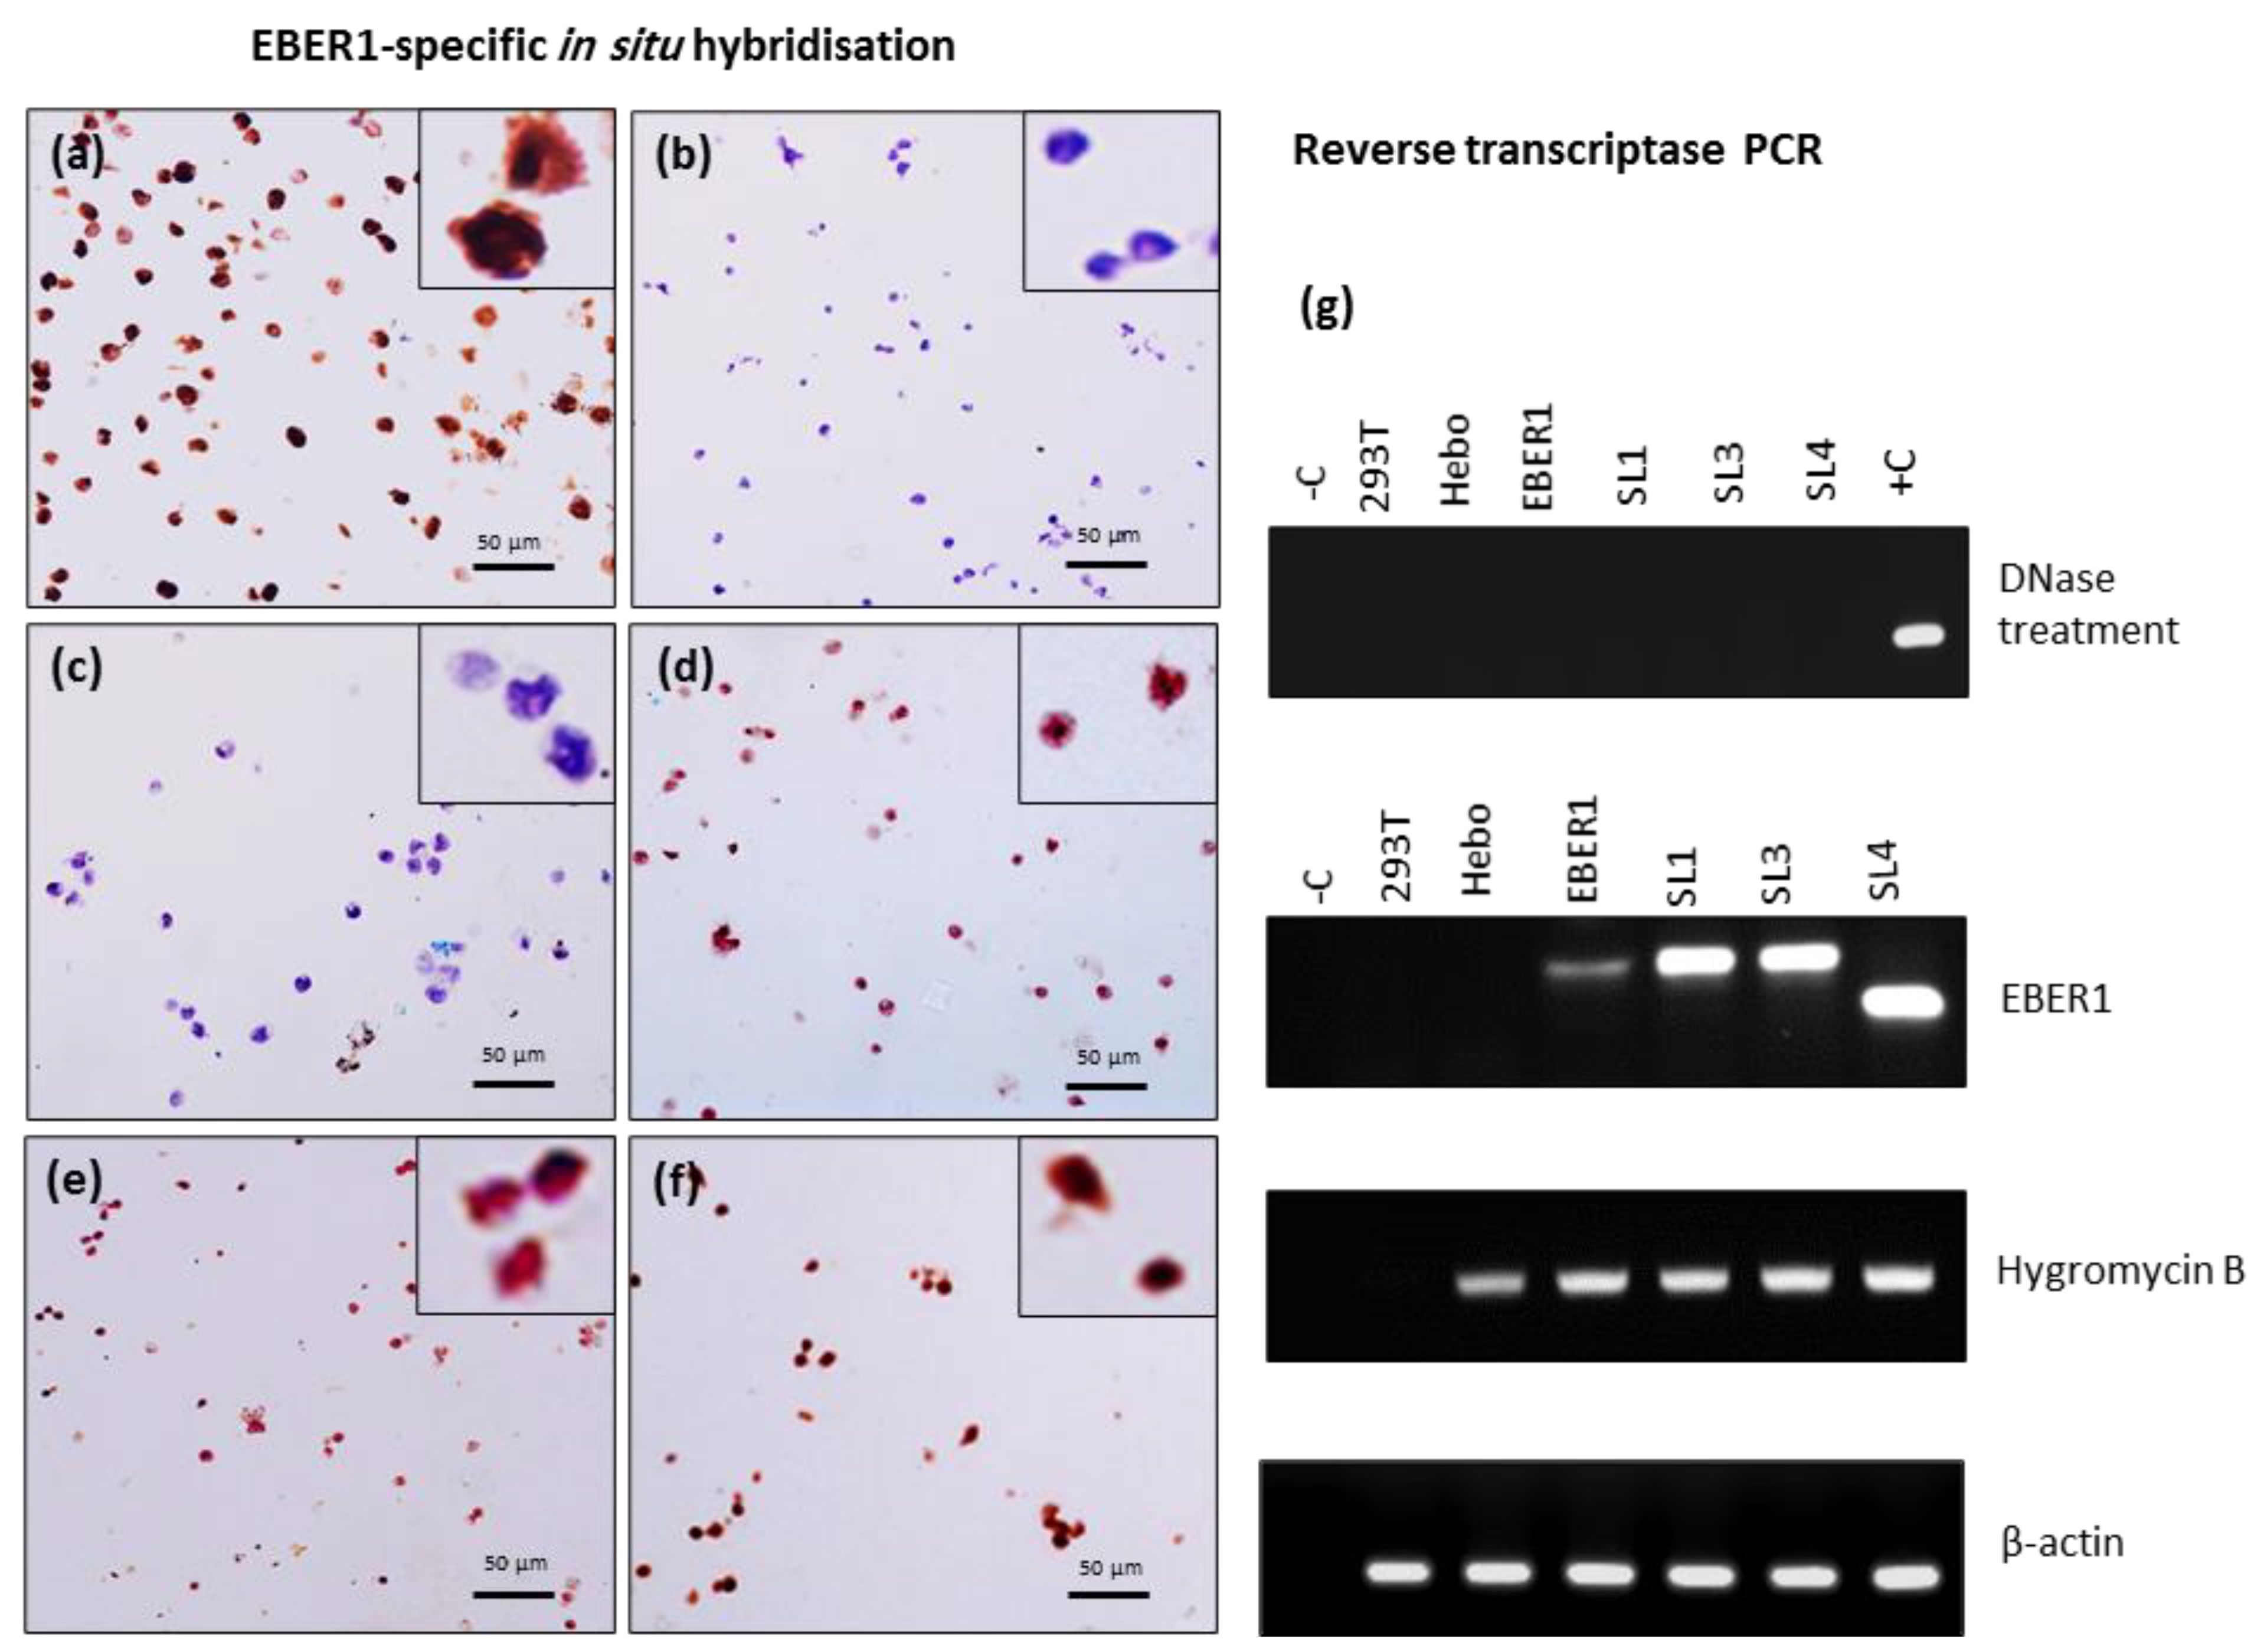
Figure 3.
Characterization of exosomes and subcellular fractionations. TEM showed nanovesicles with typical size (50–120 nm) and exosomal morphology in the extracellular fractions from HEK293T cells transfected with (a) wildtype EBER1, (b) ∆SL1 mutant. These vesicles also expressed the exosomal protein, flotillin and the RNA, RNU6 as determined by (c) Western blot and RT-PCR respectively. Nanoparticle analysis revealed nanovesicles of (d) 70–130 nm sizes and (e) zeta potential of -100 to -300 mV. Subcellular fractionations were of good quality, as shown by the nuclear and cytoplasmic markers (f) for RNA and (g) for protein isolation.
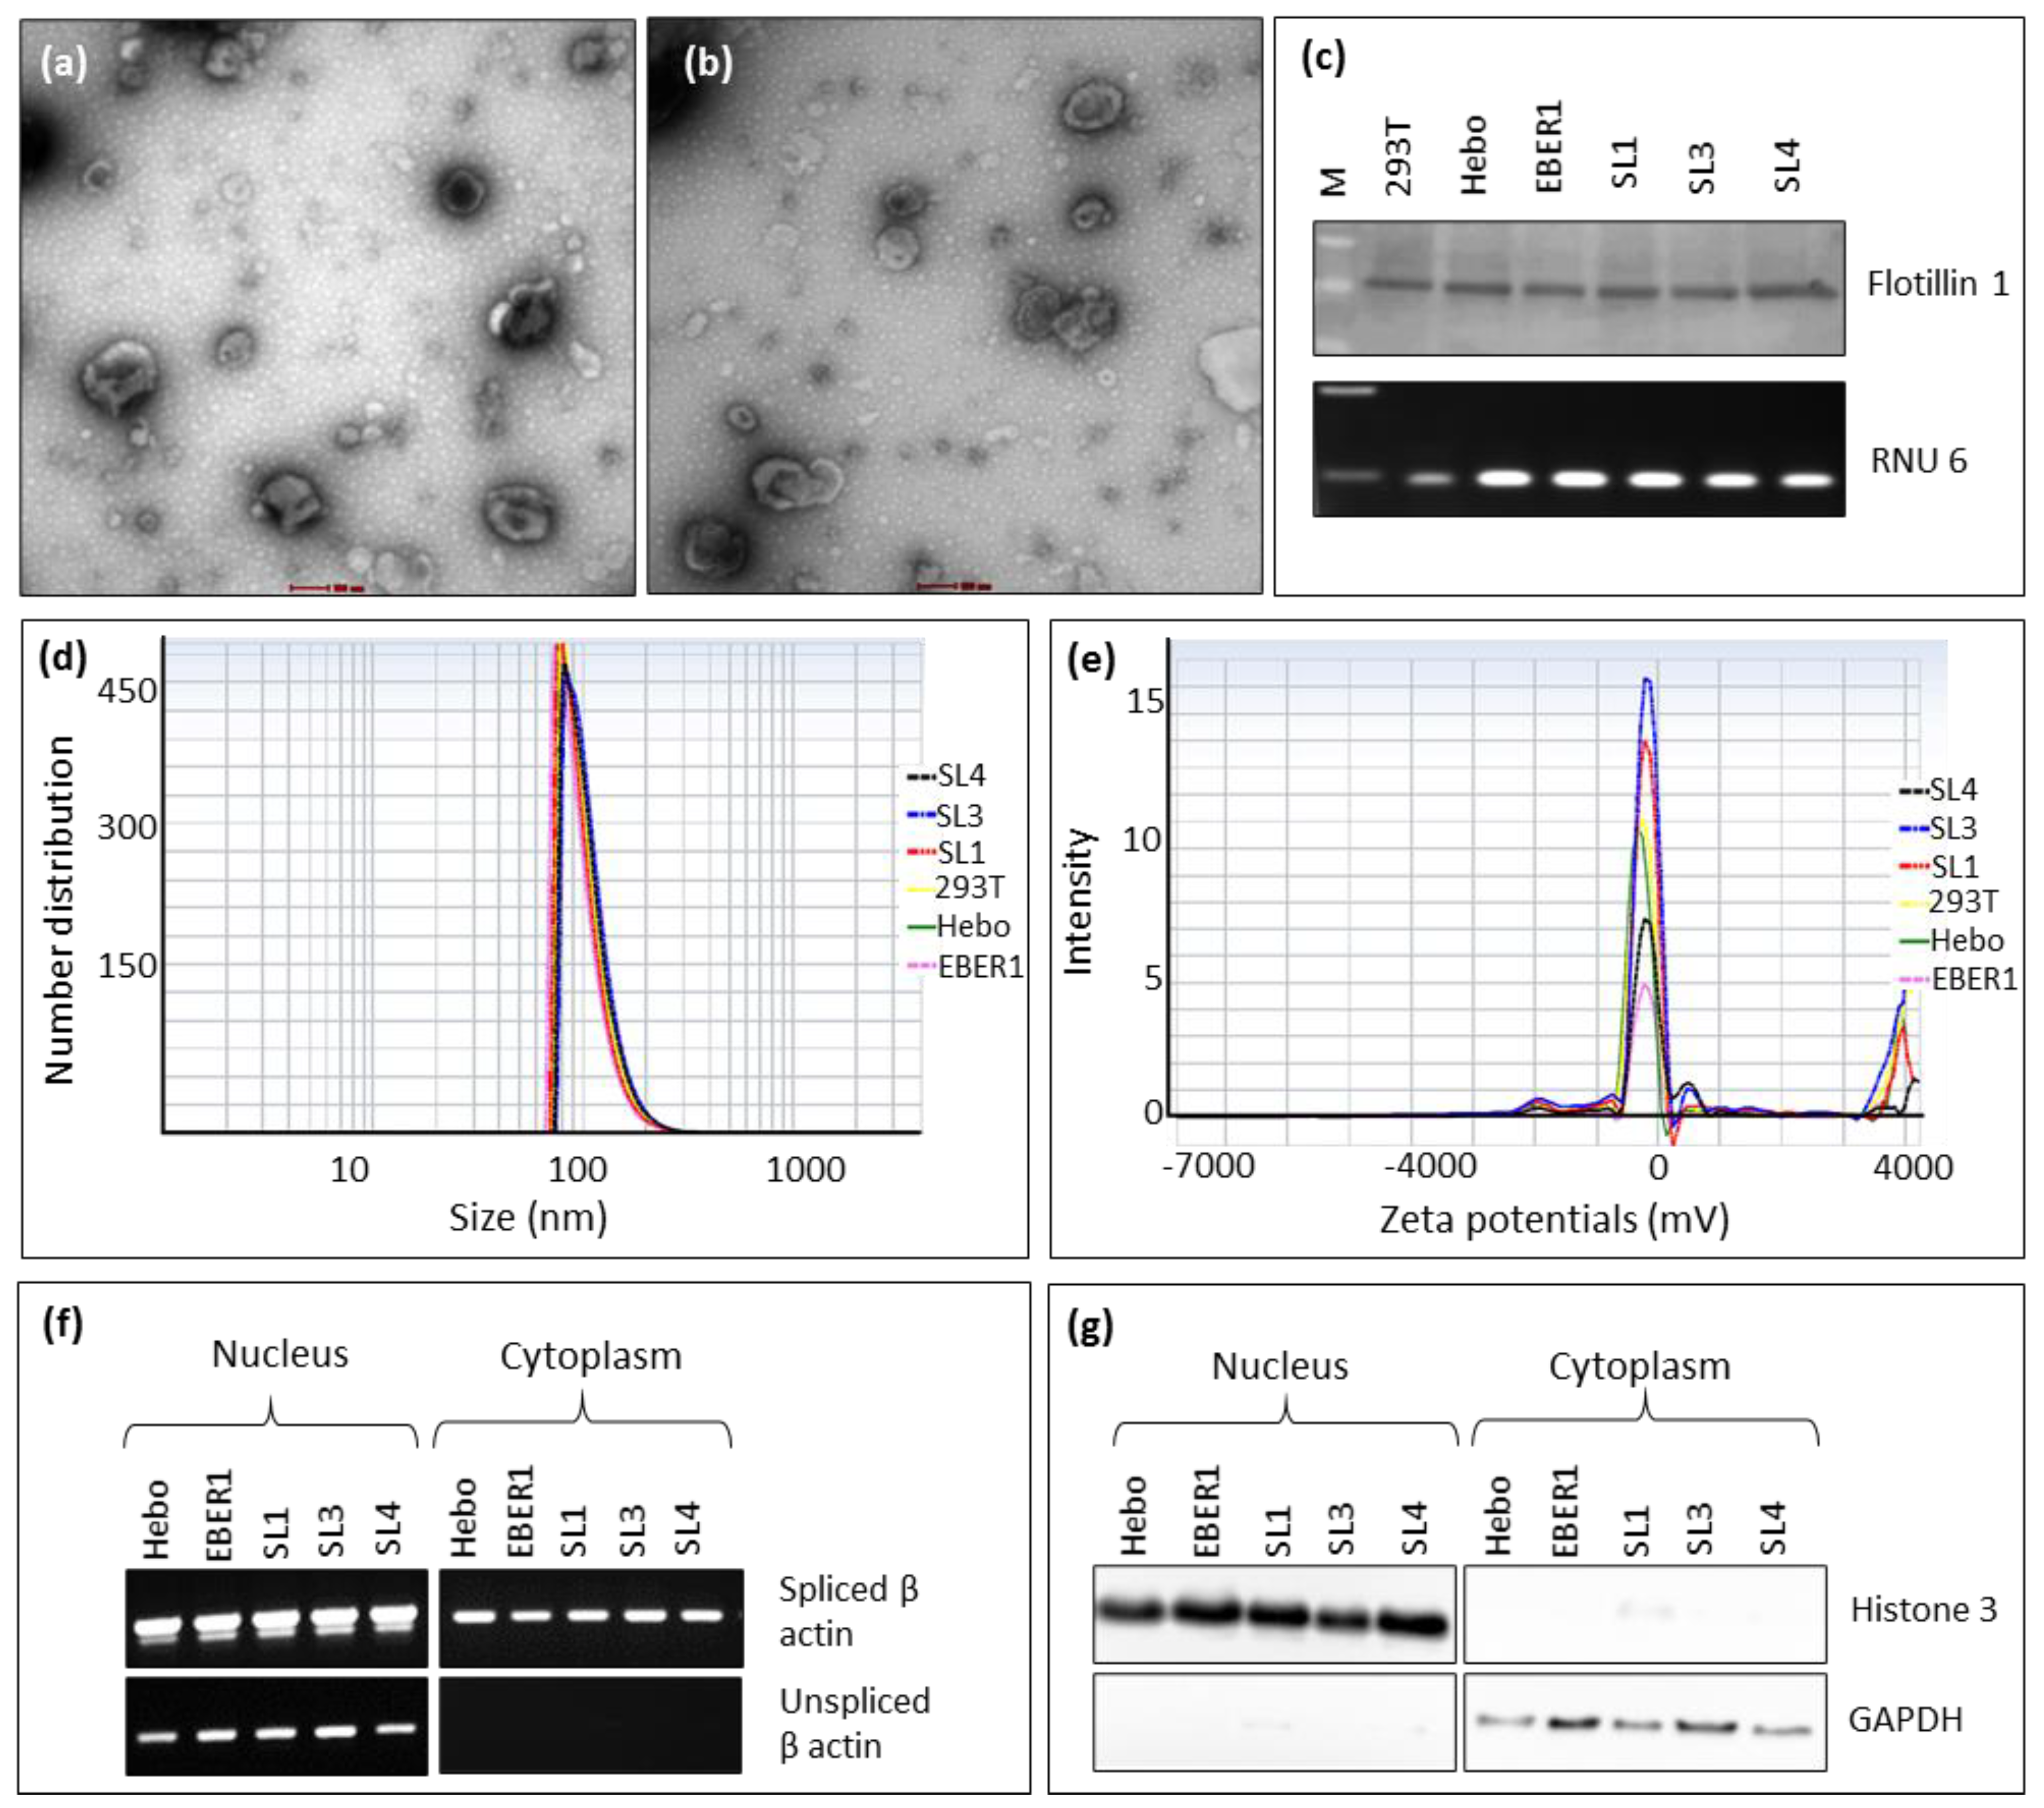
Figure 4.
Structural impact of EBER1 on its transport. qRT-PCR was performed with 100 ng cDNA, (a) total cellular, (b) nuclear, (c) cytoplasmic and (d) exosomal expression of EBER1. Experiments were performed in duplicates and repeated three times with biological replicates. Relative expression was calculated using the 2-ΔΔCT method. Data are expressed as mean (±SEM) and relative to wildtype EBER1. **= p≤0.01 and ***= p≤0.001.
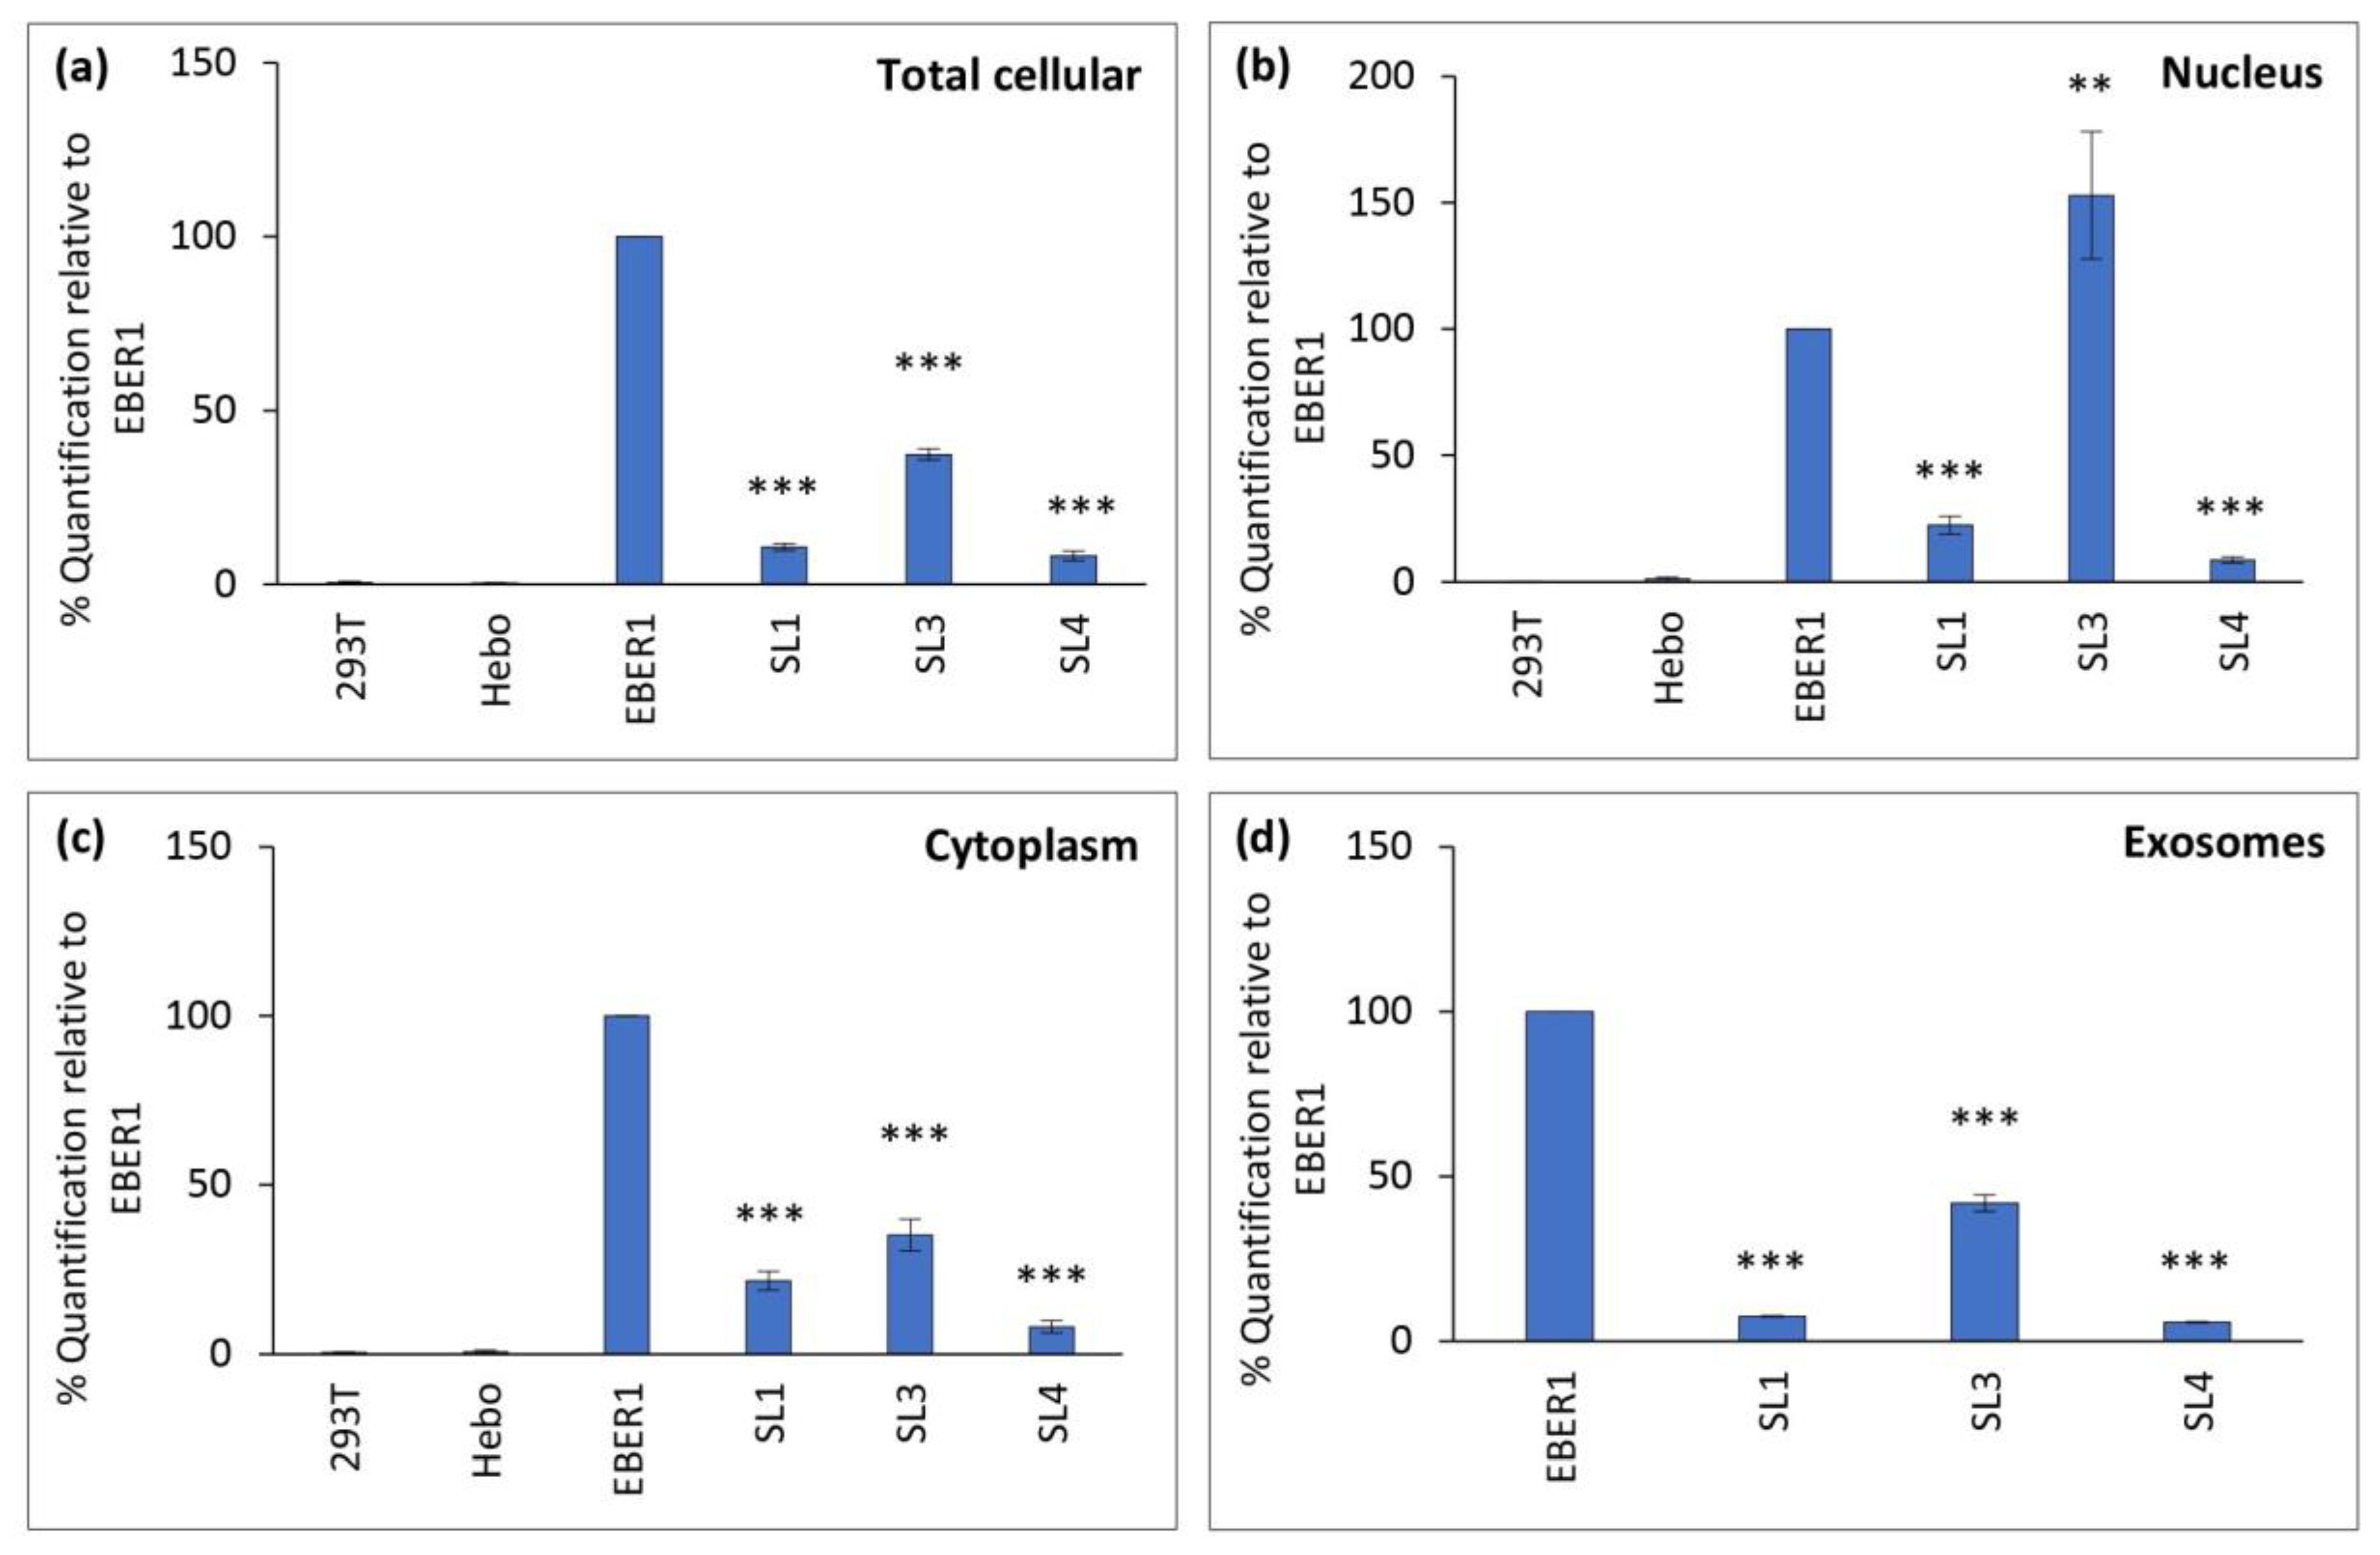
Figure 5.
Impact of silencing RPL22 on the subcellular expression of EBER1. (a) Western blot from total cellular proteins, where cells were treated with (A) RPL22-specific siRNA, (B) scrambled siRNA (non-RPL22-specific), and (C) negative control (no siRNA treatment). qRT-PCR from (b) ImageJ quantification of bands from Western blot. qRT-PCR from (c) nuclear RNA and (d) cytoplasmic RNA. Relative expression was calculated using the 2-ΔΔCT method. Experiments were performed in duplicates and repeated two times. Data are expressed as mean (±SEM) of the two experiments relative to the negative control.
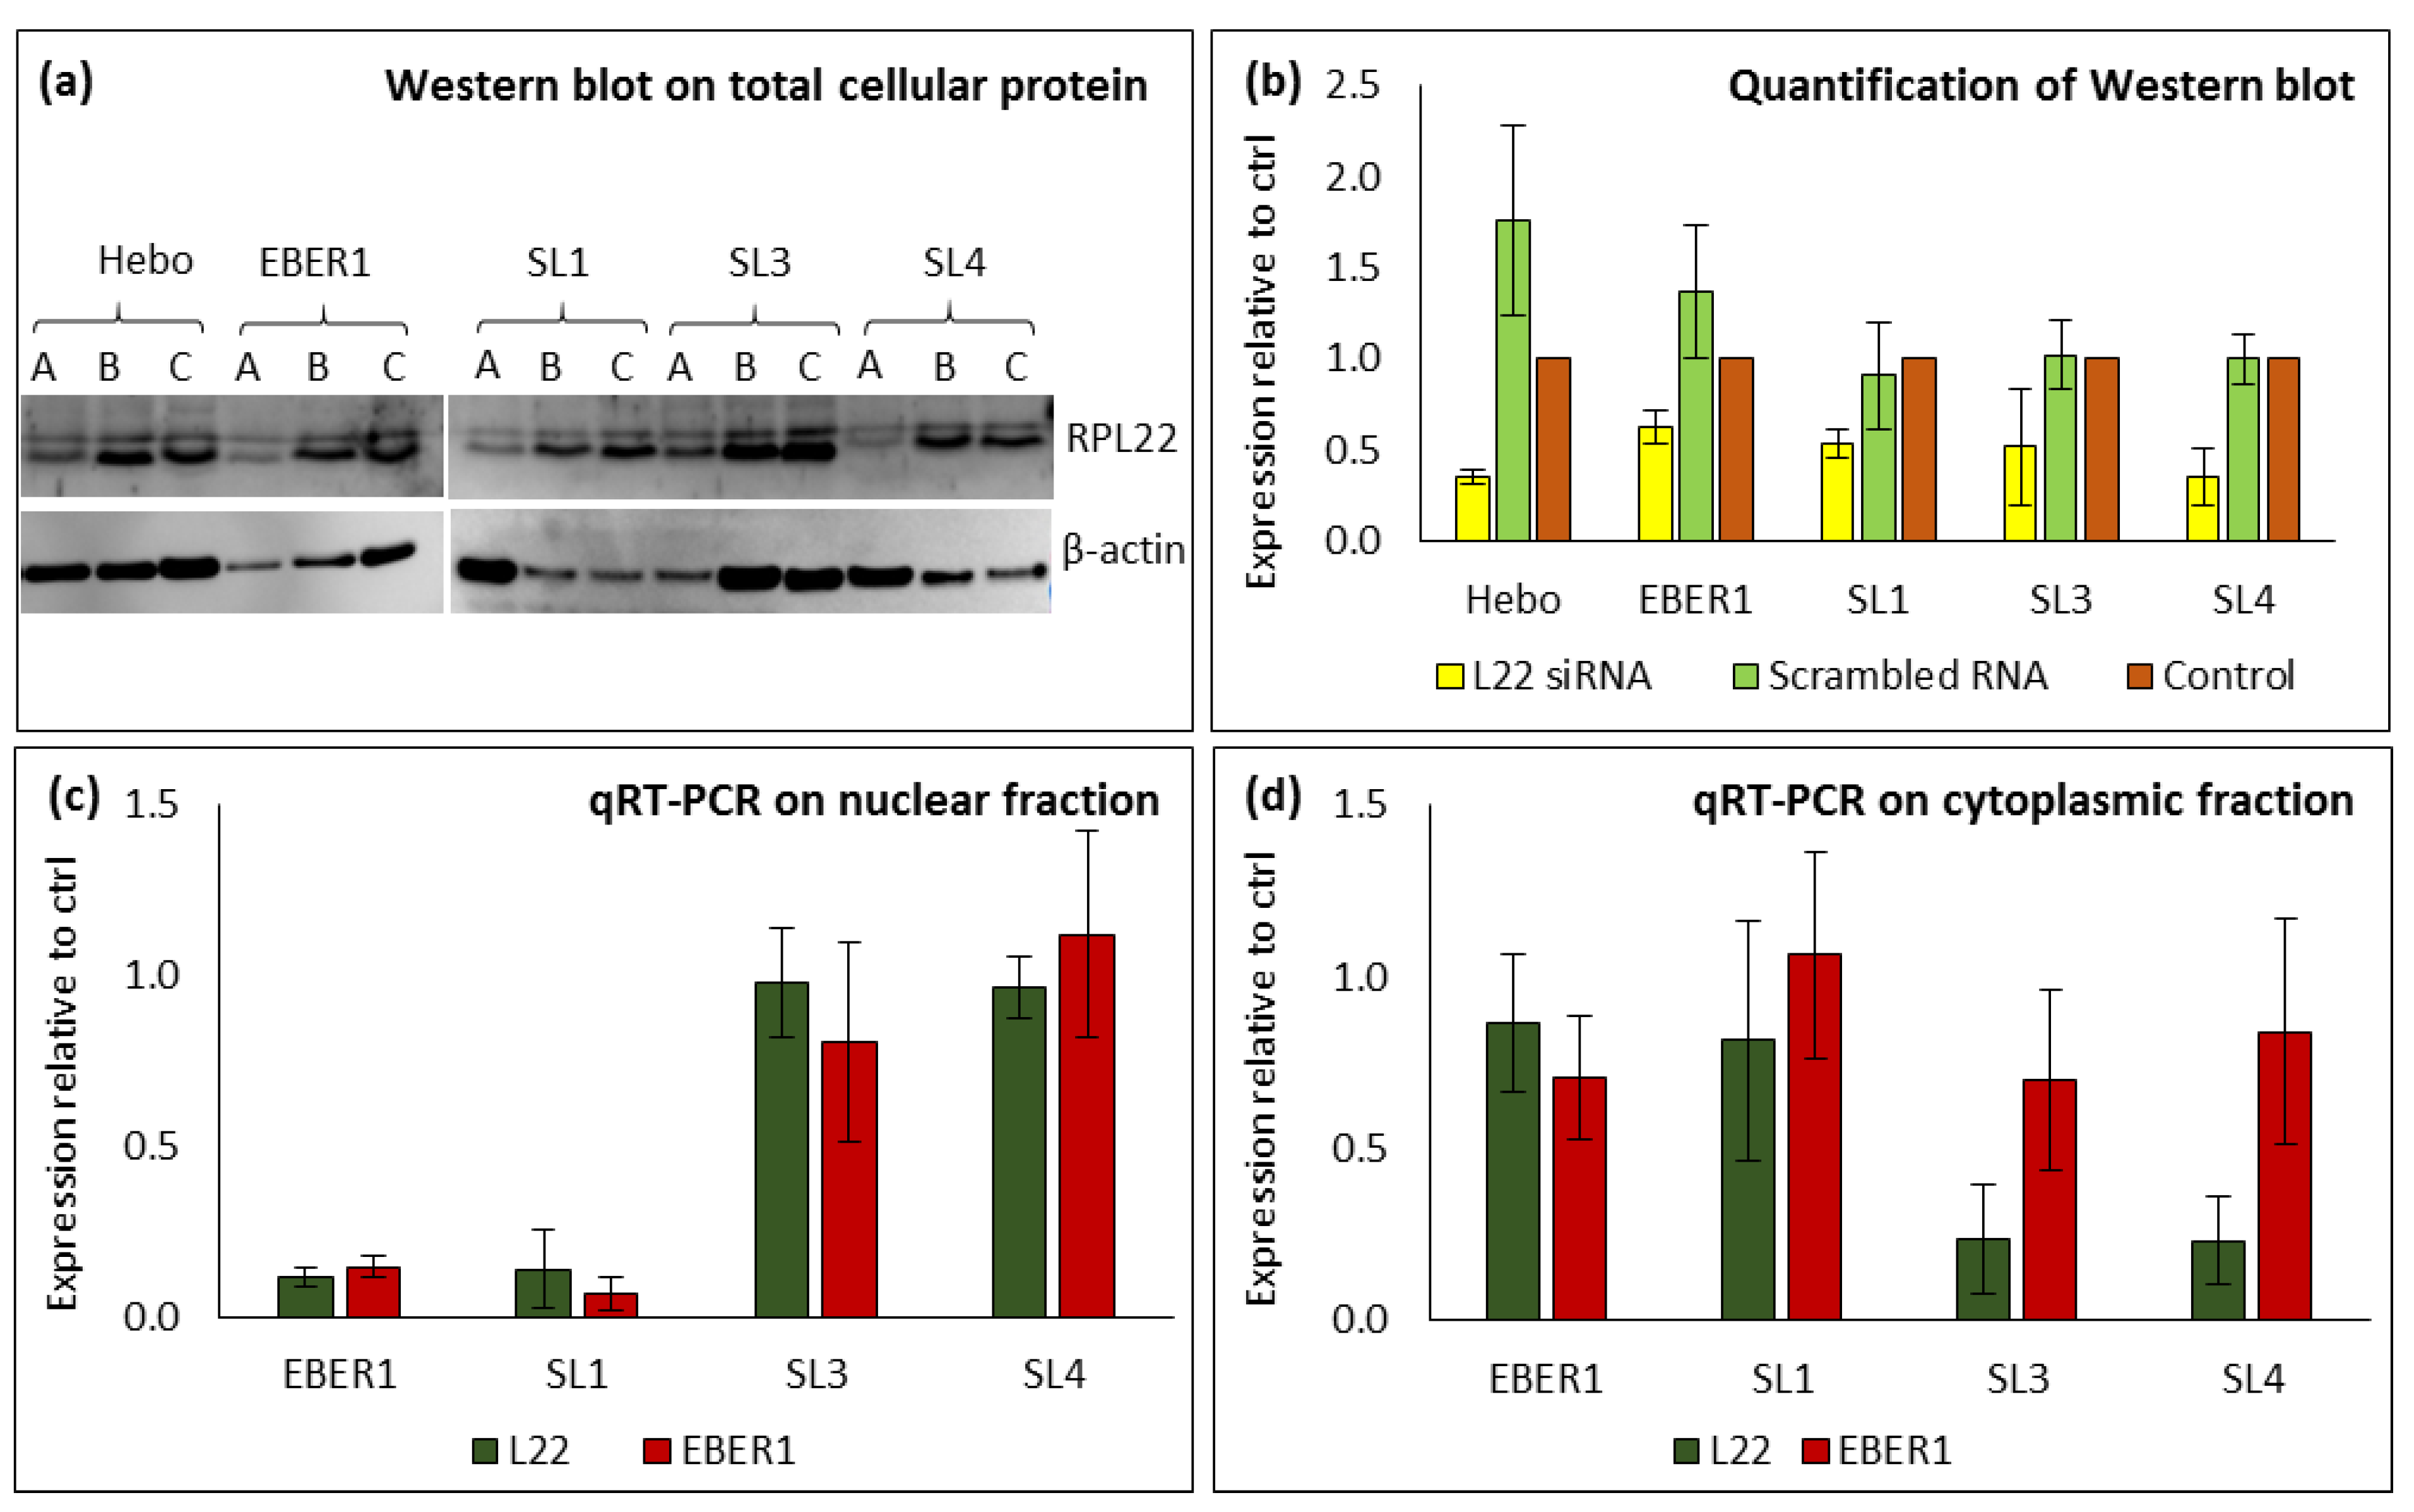
Figure 6.
Impact of silencing La protein on EBER1 secretion. Western blot of (a) total cellular proteins, and (b) exosomal proteins, where cells were treated with (A) La-specific siRNA, (B) scrambled siRNA (non-La specific siRNA), and (C) negative control (no siRNA treatment). qRT-PCR from (c) cellular RNA (d) exosomal RNA. Relative expression to was calculated using the 2-ΔΔCT method. Experiments were performed in duplicates and repeated three times. Data are expressed as mean (±SEM) of the three experiments relative to the negative control.
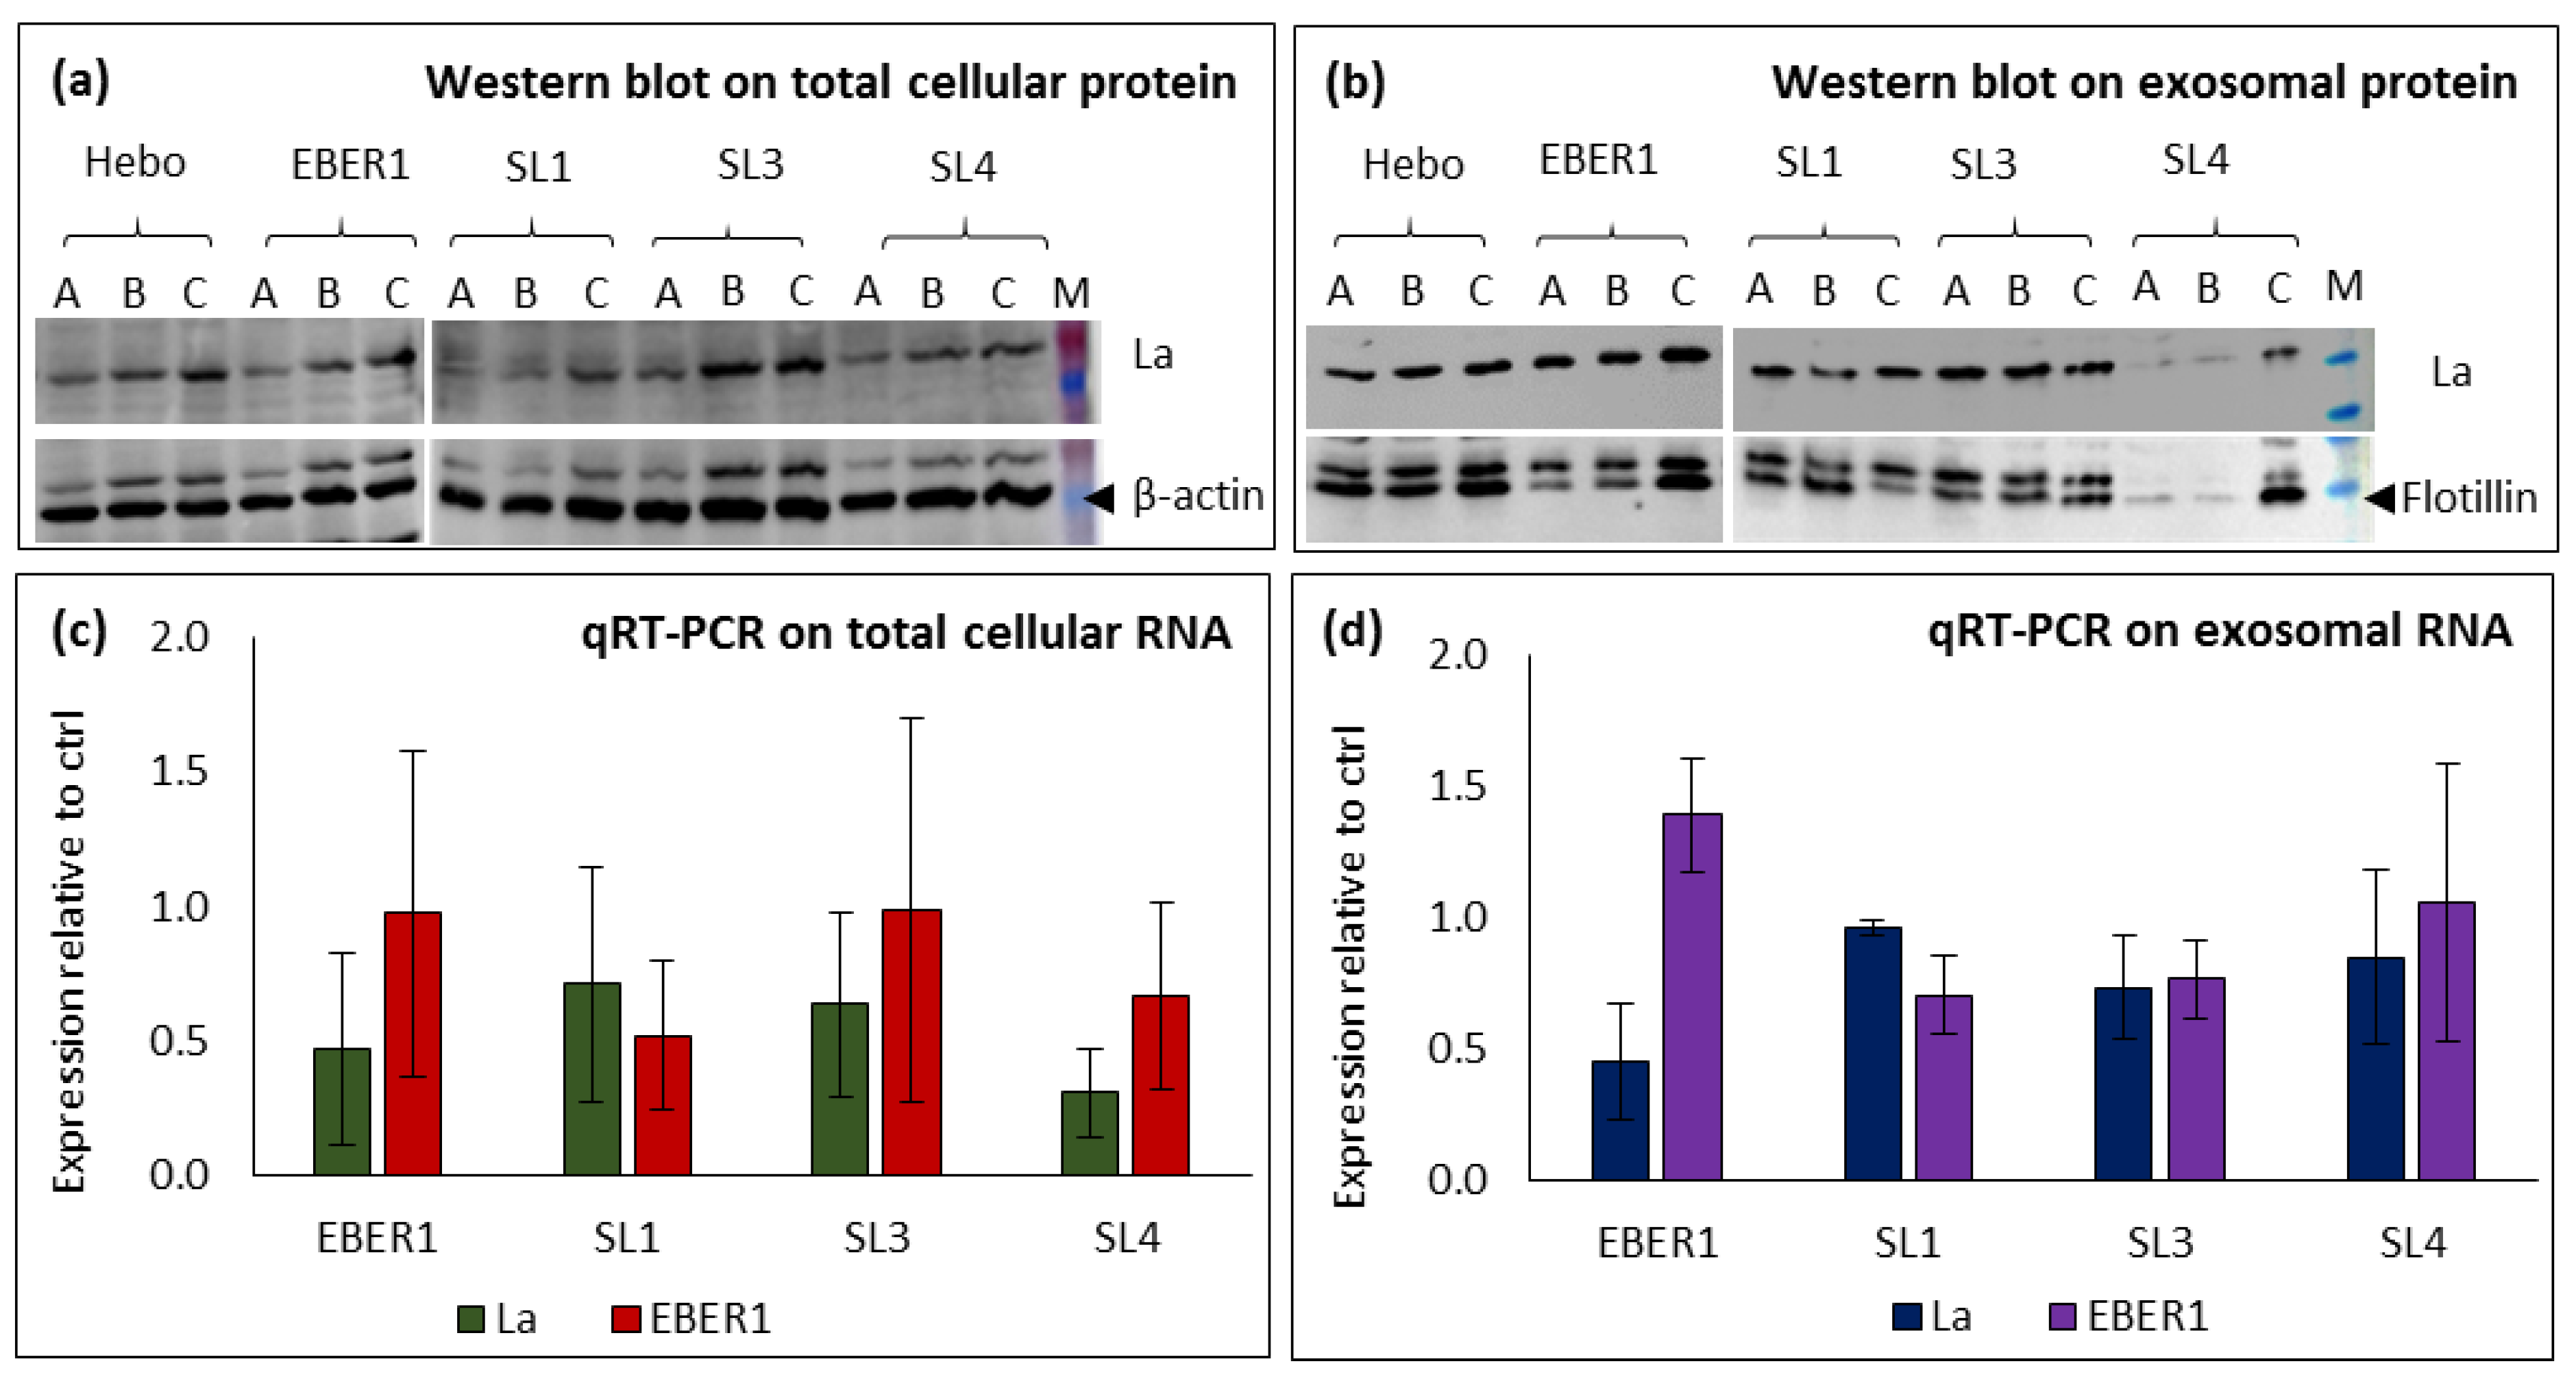
Figure 7.
Evaluation of the intracellular Ca2+ influx via the store-operated Ca2+ channels. (a) Average response of cells to extracellular application of 2mM Ca2+-containing PSS after blocking the ER with 1µM thapsigargin. (b) Mean of SOCE peaks at single-cell analysis, n≥78. (c) Western blot from total cellular protein. (d) ImageJ quantification of bands from Western blot, n=3. Data are expressed as mean (±SEM) and relative to wildtype EBER1.
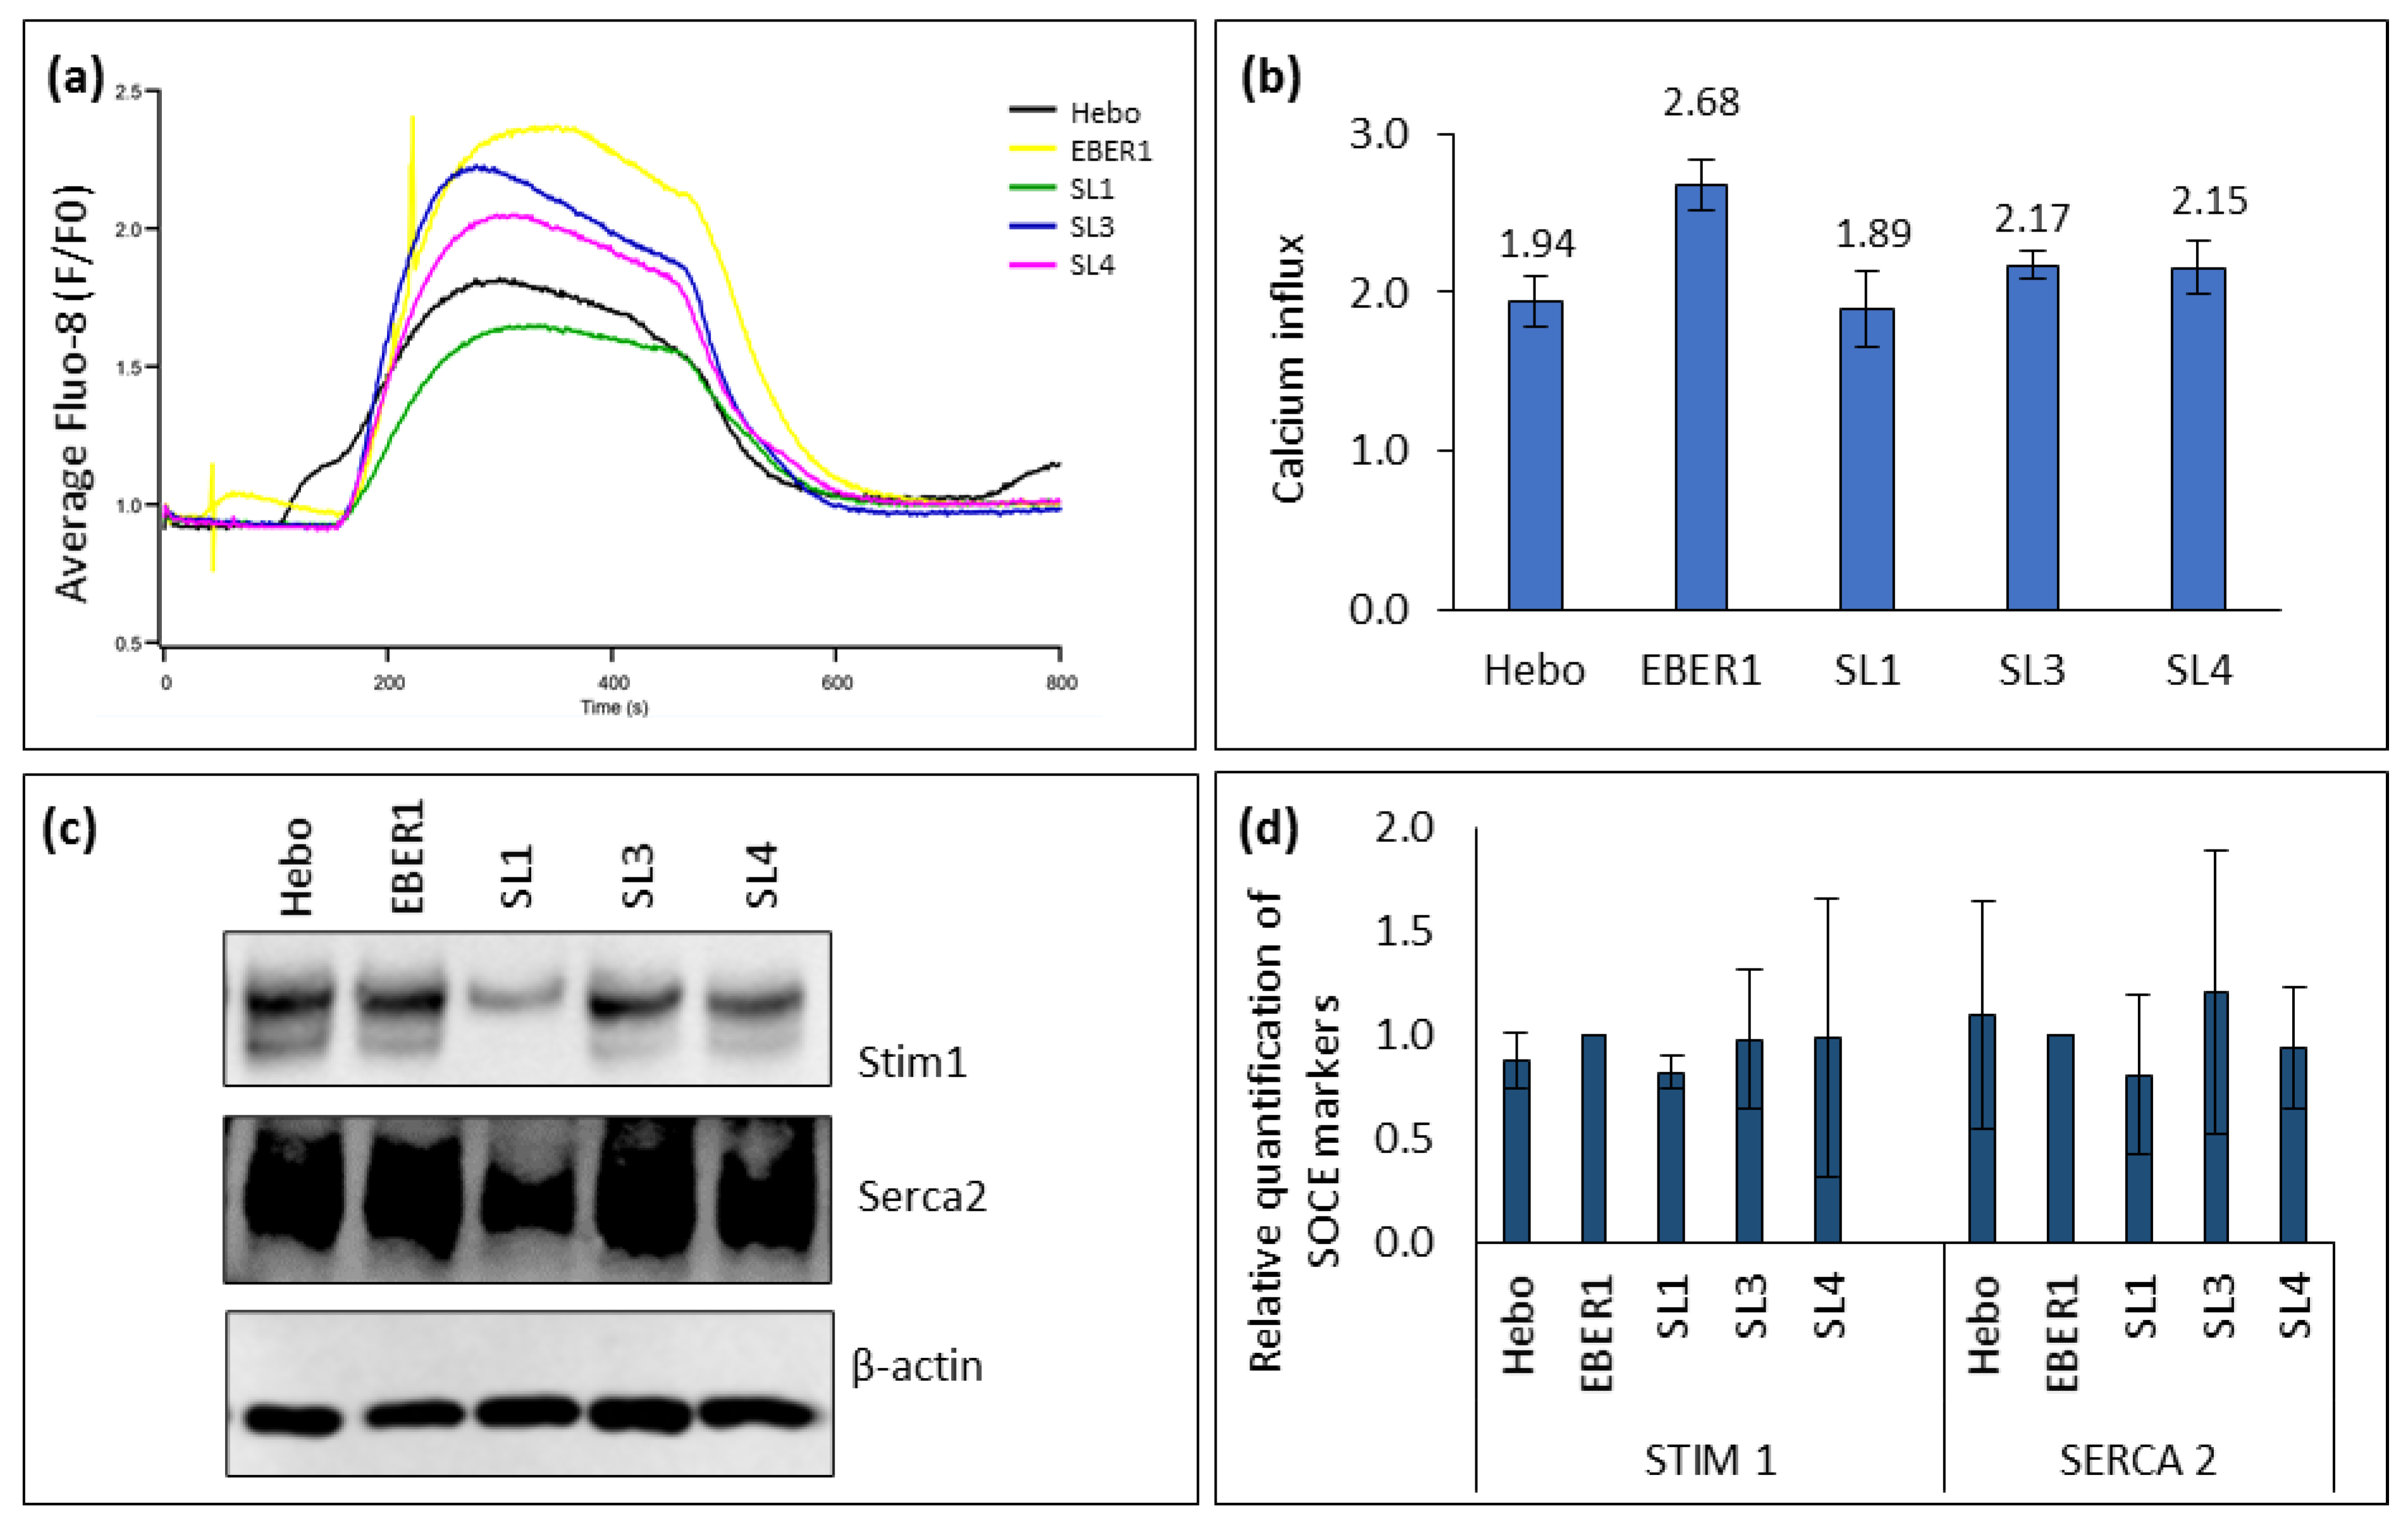

Table 1.
Zeta potentials of exosomes.
| Constructs | Zeta potential |
|---|---|
| Untransfected | -312.44 |
| pHebo | -260.16 |
| Wildtype EBER1 | -214.68 |
| ∆SL1 mutant | -198.52 |
| ∆SL3 mutant | -180.00 |
| ∆SL4 mutant | -190.65 |
Table 2.
Percentage of nuclear-cytoplasmic transport and secretion of EBER1.
| Transport | Wildtype | ∆SL1 | ∆SL3 | ∆SL4 |
|---|---|---|---|---|
| Nuclear-cytoplasmic | 17.12 | 11.78 | 9.32 | 17.85 |
| Cytoplasmic-exosomes | 5.41 | 6.76 | 5.22 | 5.47 |
Table 3.
RPISeq RNA-protein interaction prediction score.
| RNA ID | Interaction with RPL22 | Interaction with La | ||
|---|---|---|---|---|
| RF Classifier | SVM Classifier | RF Classifier | SVM Classifier | |
| Wildtype EBER1 | 0.55 | 0.66 | 0.40 | 0.45 |
| ∆SL1 mutant | 0.55 | 0.56 | 0.40 | 0.37 |
| ∆SL3 mutant | 0.50 | 0.41 | 0.40 | 0.28 |
| ∆SL4 mutant | 0.50 | 0.74 | 0.30 | 0.50 |
Table 4.
Percentage of nuclear and cytoplasmic expression of RPL22 and EBER1 genes.
| EBER1 | SL1 | SL3 | SL4 | |||||
|---|---|---|---|---|---|---|---|---|
| RPL22 | EBER1 | RPL22 | EBER1 | RPL22 | EBER1 | RPL22 | EBER1 | |
| Nucleus | 11.93 | 17.38 | 14.90 | 6.17 | 80.50 | 53.56 | 80.46 | 57.13 |
| Cytoplasm | 88.07 | 82.62 | 85.10 | 93.83 | 19.50 | 46.44 | 19.54 | 42.87 |
Disclaimer/Publisher’s Note: The statements, opinions and data contained in all publications are solely those of the individual author(s) and contributor(s) and not of MDPI and/or the editor(s). MDPI and/or the editor(s) disclaim responsibility for any injury to people or property resulting from any ideas, methods, instructions or products referred to in the content. |
© 2023 by the authors. Licensee MDPI, Basel, Switzerland. This article is an open access article distributed under the terms and conditions of the Creative Commons Attribution (CC BY) license (http://creativecommons.org/licenses/by/4.0/).
Copyright: This open access article is published under a Creative Commons CC BY 4.0 license, which permit the free download, distribution, and reuse, provided that the author and preprint are cited in any reuse.


