
Submitted:
29 April 2023
Posted:
30 April 2023
You are already at the latest version
Abstract
The Nanosecond Pulsed Electric Field (nsPEF) or Nano Pulsed Stimulation (NPS) is a cutting-edge technology that applies a series of high-voltage electric field pulses of extremely short duration, typically on the order of nanoseconds, to cells. This technique induces the formation of nanopores and activate ionic channels, thereby altering cellular activity. Recent simulations suggest that nsPEF also triggers a novel phenomenon, Protein-mediated Electroporation, whereby pores are formed through the voltage-sensing domain of ionic channels. In this study, we employed Molecular Dynamics simulations and machine learning techniques to investigate the Voltage Sensing Domain (VSD) of a cardiac channel under nsPEF stimulation. Specifically, we characterized VSD structures that form pores helping for the understanding of the physical chemistry underlying the defibrillation effect of nsPEF. Our analysis involved the clustering of 142 replicas simulated for 50 ns under the nsPEF stimulus. Subsequently, we identified the representative structures of each cluster and calculated the free energy between them. Our results demonstrate that although VSD structures are ubiquitous among ionic channels, they exhibit distinct responses to nsPEF stimuli. These findings have significant implications for the development of novel nsPEF-based therapies for cardiac diseases.
Keywords:
nsPEF
; NPS
; nanopores
; ionic channels
; VSD
; cholesterol
1. Introduction
nsPEF, a technology that emerged in 1995 [1], has seen a significant surge in research interest since 2005 [2]. nsPEF’s ability to elicit specific cellular effects [3] has resulted in an impressive range of applications, including the activation of neurons [4,5,6,7,8,9] and myocytes [10,11,12,13], wound healing [14,15,16,17], manipulation of phenotype [18], modulation of gene expression [19,20,21,22,23,24], antiparasitic effects [25,26,27], enhancement of immune response [28,29,30,31,32,33], cell proliferation [18,34,35,36], improved fermentation [37,38], sterilization for the food industry [39,40,41], seed germination [42,43,44], and most notably, the development of novel cancer therapies [2]. Recently nsPEF have been proposed for virus inactivation [45].
The nsPEF technique involves delivering high electric field pulses (∼1-300 kV/cm) in nanoseconds or even picoseconds into biological tissues or cells. Molecular Dynamics studies have shown that nsPEF is theoretically capable of forming membrane nanopores [46,47]. Experimental results have also strongly supported the formation of nanopores due to nsPEF stimulus [5,48,49]. While direct evidence of nanopore formation is lacking due to their small size (~2nm) and transient nature, the scientific community largely supports this phenomenon as the primary effect of nsPEF on cells. Further experimental results have shown that the activation of voltage-gated channels (VGCs) is another primary effect of nsPEF [4,8,50,51,52,53]. Therefore, the effects of nsPEF on cells can be broadly divided into two categories: formation of membrane nanopores and activation of VGCs.
However, recent research using molecular dynamics (MD) simulations has suggested an additional effect of nsPEFs: the creation of pores in transmembrane proteins. In 2018, the first study to investigate pore formation in transmembrane proteins (specifically, human aquaporin) using MD simulations was published [54]. Later, in 2020, Rems et al. [55] also used MD simulations to investigate nsPEF-induced pore formation in three distinct voltage-gated channels (a bacterial VGNC, an eukaryotic VGNC, and a human hyperpolarization-activated cyclic nucleotide-gated channel), observing both simple and complex pore formation in the VSD. Complex pores were proposed to be the source of theorized lipidic pores and may be stabilized by the presence of ions and other channel components, such as TMHs [56,57,58]. Recently, our group also observed the formation of complex pores in a VSD of a human VGCC using an MD simulation, under the application of an external electric field of 0.2 V/nm lasting for 50 ns to mimic a nsPEF stimulus [59]. However, there is currently no direct experimental evidence for the formation of nanopores or transmembrane pores due to nsPEF stimulation. Therefore, we strongly encourage further experimental investigation in this area. The potential biotechnological applications for such an nsPEF device capable of creating protein pores are highly intriguing.
Ubiquitous and structurally similar integral membrane proteins, known as voltage-gated channels (VGCs), include Na, Ca, and K channels [60]. While voltage-activated Na and Ca channels consist of monomers with varying auxiliary subunits, voltage-activated K channels are tetramers. All of these channels have four repeated structures, each formed by six -helix, as shown in Figure 1. The VSD is composed of helix S1 to S4, while the pore domain is formed by helix 5 and 6 [61]. Notably, the four VSD structures are present in all Na, Ca and K [62].
In this article, we investigate the formation of simple and complex pores in the VSD of a Nav1.5-E1784K voltage-gated sodium channel (VGNC). Nav1.5 is the primary VGNC channel in the heart, and mutations in Nav1.5 have been linked to various cardiac disorders, including type 3 long QT syndrome (LQT3) and Brugada syndrome (BrS). The E1784K mutation is commonly found in patients with both LQT3 and BrS [63]. The Nav1.5 VGNC used in our study is in its native conformation and is not bound to any external molecule. This mutated VGNC have a structure nearly identical to that of the wild-type human Nav1.5. Interestingly Nav1.5, present S4 helix with three arginines instead of four, as opposed to the four arginines found in most VGCs. These arginines play a crucial role in the activation of VGCs [64,65,66,67,68,69], as they provide a high charge density that can respond to changes in membrane potential. Therefore, investigating the formation of VSD pores with only three arginines in the S4 helix, which is expected to be the driving force for pore formation, is of particular interest. The two existing studies that have explored pore formation due to a nsPEF stimulus have used VSDs with four arginines in their S4 helix [55,59].
Recently, nsPEF stimulation has been proposed as a new defibrillation method to achieve a higher efficiency of defibrillation on the first shock, reduce shock energy, minimize side effects, and lower the probability of reinduction of arrhythmias [70]. According to Azarov et al. [12], applying nsPEF stimulus to cardiomyocytes results in the formation of membrane nanopores, which are less harmful to transmembrane leaks compared to conventional defibrillation using millisecond pulses. In addition, transient inhibition of Na and Ca VGCs [71,72] may aid the antiarrhythmic effect of nsPEF defibrillation. Nevertheless, the mechanism behind nsPEF-induced action potentials generation remains poorly understood. Understanding the formation of VSD pores in cardiomyocytes due to nsPEF stimulus may contribute to comprehending the generation of action potential in these cells. Therefore, studying the formation of VSDs pores in cardiomyocytes may shed light on the biophysics of using nsPEF as a defibrillator.
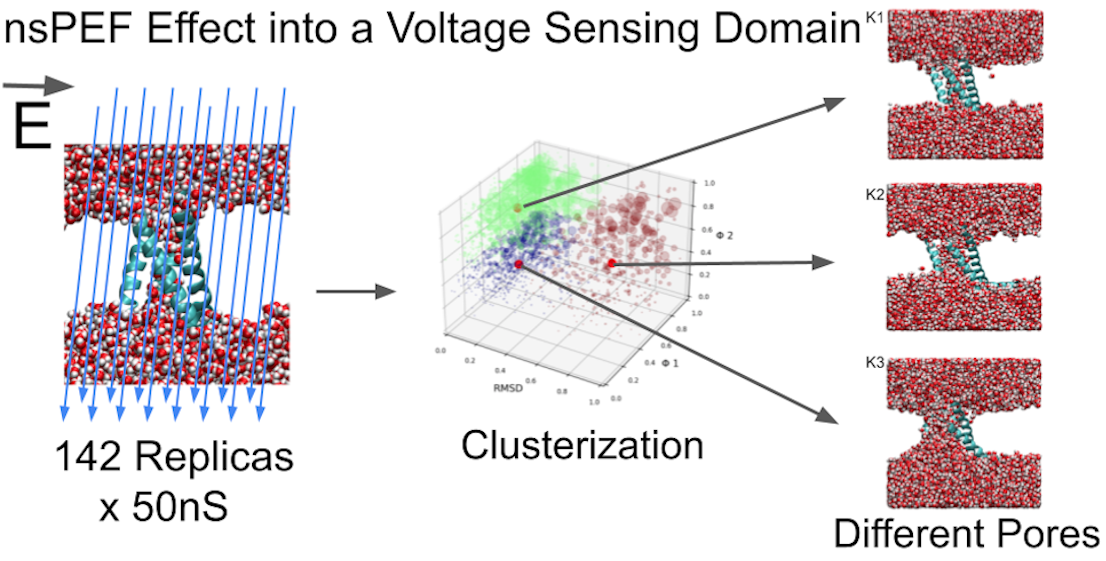
To further investigate the formation of VSD pores, we created a simulation box for molecular dynamics (MD) using a pure 1-palmitoyl-2-oleoyl-sn-glycero-3-phosphocholine (POPC) bilayer, a common phospholipid in MD simulations. The VSD was immersed within the POPC bilayer for subsequent analysis. To determine the external electric field that would best induce a change in VSD conformation to express the most VSD pore-rich amalgam. The simulation box was subjected to various electric fields. The optimal electric field, found to be 0.13 V/nm, and 200 replicates at this electricfield was performed. The resulting structures were clustered with a machine learning tool to identify the most representative ones. This analysis will facilitate further studies of VSD pore formation.
2. MD simulations methods
The simulations were conducted using the GROMACS molecular dynamics package 2020.6 [73], and the CHARMM36 force field was utilized to account for parameters including bond length, angle bending, angle torsions, and non-bonded interactions of the molecular systems [74]. A rectangular simulation box was constructed with a VSD at the center of the bilayer, containing 166 POPC molecules in a bilayer arrangement, 9,713 HO molecules, and 1 K ion to neutralize the system. Prior to the molecular dynamics simulation, a steepest descent minimization algorithm was applied to relax the molecular system, followed by 6 steps of equilibration, as detailed in SI section 1. Box 1 was equilibrated with a size of 7.79 nm x 7.79 nm x 8.50 nm, which ensured that the VSD did not see its periodic images. The leap-frog integrator algorithm was utilized with a time step of 2 fs to integrate Newton’s equations of motion. The Lennard Jones potential (LJ) was used to simulate Van der Waals interactions, and the Particle Mesh Ewald (PME) method was used to calculate long-range electrostatic interactions [75].
The interactions were truncated using a cut-off of 1.2 nm for both the LJ and electrostatic forces. The bond lengths were constrained using the linear constraint solver (LINCS) [76]. The simulations were performed in an NPT ensemble at a temperature of 310 K and a pressure of 1 bar, with coupling to a Nose-Hoover thermostat [77] and a Parrinello-Rahman barostat [78]. Time constants of 1 ps and 5 ps were used for temperature and pressure, respectively. Periodic boundary conditions were applied in all directions. The TIP3P (transferable intermolecular potential with 3 points) water model [79], which assigns charges and Lennard-Jones parameters to each of the 3 atoms in an explicit 3-atom rigid water molecule, was used for all simulations.
The Membrane Builder module of CHARMM-GUI [80] was utilized to embed the VSD in the bilayer. The equilibrated box underwent a 200 ns simulation Figure 2, after which different values of were explored to determine the optimum one capable of creating simple and complex pores in the VSD. Eight replicas of each were simulated, with a range of 0.1 V/nm, 0.12 V/nm, 0.14 V/nm, 0.16 V/nm, 0.18 V/nm, and E0.2 V/nm. The Root Mean Square Deviation (RMSD) of the VSD was analyzed for each , and a of 0.13 V/nm was selected. A continuation of 200 replicas was then simulated at E=0.13 V/nm for 50 ns to explore all phases of the VSD structural changes. The direction of was consistent across all simulations, with the vectorial force aligned antiparallel to the z-axis and perpendicular to the bilayer. The VSD used in the study was obtained from electron microscopy of a human Nav1.5-E1784K channel (PDB ID: 7DTC), with a resolution of 3.30 Å.
3. Simulation Results
3.1. Exploring different external Electric Fields
First, we performed an exploration by applying different strengths along the z-axis to a Box containing an equilibrated cardiac VSD. Our goal was to determine the optimal that would induce the most significant structural changes in the VSD, leading to the formation of both protein pores and complex-pores. The values used ranged from 0.1 V/nm to 0.2 V/nm in increments of 0.02 V/mm. Previous studies have employed voltage-sensitive dyes [81,82] and microelectrodes [83] to determine that a membrane potential of 1.5 V represents the largest potential that the membrane can support before discharging, others studies support this voltage value [82,84,85,86,87,88]. Gumbart et al. [89] calculated that the best approximation for determining membrane potential in molecular dynamics simulations along the z-axis is ,, where represents the length of the simulation box of the z-axis. We therefore explored values up to 0.2 V/nm, given that the membrane potential for an value of 8.5 is 0.17 V, which is above the limit of 1.5 V. We quantified the structural changes in the VSD induced by each value by measuring the RMSD of eight replicas per value.
As evidenced in Figure 3A and Figure 3B, at an electric field strength of =0.10 V/nm and =0.12 V/mn, respectively, the VSD displayed in Figure 3 exhibits negligible changes in RMSD across each of the replicas. This suggests that the internal forces governing the structural integrity of the VSD remain resilient to external stimuli up to a certain threshold. Conversely, when exposed to electric fields of =0.14 V/nm or greater, the majority of replicas displayed higher RMSD values, with a final RMSD of 2.9001150 nm at 50 ns, resulting in a 90°rotation of the membrane and yielding an output structure that lacks biological significance (Figure 3C). This phenomenon was observed across most of the replicas subjected to electric fields beyond =0.14 V/nm (Figure 3D, E, F). In Figure S1 of the Supplementary Information, we illustrate the bilayer’s turning point in response to external electric fields ranging from =0.14 up to 0.20 V/nm. For this reason, we opted to employ clusterization in machine learning analysis of VSD structures forming pores under external electric fields of =0.13 V/nm for 50 ns. We conducted 200 replicas at =0.13 V/nm to ensure complete phase space coverage and obtain the difference in free energy () between clusters. The details of the methodology used to compute are elucidated in the subsequent section. Replicas subjected to an external electric field of =0.13 V/nm and having the highest final RMSD of 2.5705926 nm exhibited a POPC membrane that retained its bilayer arrangement. Therefore, is expected that lowers final RMSD of the rest of the replicas under an external =0.13 V/nm do not turn over it bilayer being consisting for further analysis. Despite replicas under an external =0.13 V/nm ending in higher RMSD not turn over they membrane complete, the encompass a evident membrane rearrangement, as can me observed in Figure 4.
3.2. Clusterization
To identify the most representative conformational changes of the voltage-sensing domain (VSD), we employed a clustering approach based on different replicas. This analysis involved an evaluation of the fraction of native contacts (FNC) and the RMSD of the VSD. Initially, we discarded unstable replicas that did not attain a stable structure. To do so, we assessed the change in the first derivative of the RMSD over the last 10 nanoseconds of the simulation, and only those replicas with a change of less than 15% were retained. We selected 162 stable replicas that met this criterion. We further filtered these replicas to exclude those that ended with an RMSD of less than 0.35 nm and did not form a conclusive VSD pore (as depicted in Figure 5). This filtering step yielded a final set of 142 replicas that were suitable for clusterization. This filtering step improved the quality of the clusterization by ensuring that the resulting structures had full VSD pores. To gain a better understanding of how VSD pores change with the final RMSD, refer to Figure 6. For additional examples of formation of pores see Figure S3. Too have an idea of the kinetic formation of pores, we construct videos of the water density along z axis in the 50 ns of simulation for different replicas with different final RMSD. To see these videos go to
To clusterize the data, we constructed a 3D cube with tuples that contained 3 coordinates, which were represented in a 3D graphic. The first coordinate was defined as the RMSD between two frames. In this context, frames refer to each VSD structure presented during the last 10 ns of simulation of the 142 replicas that were selected.
The second coordinate was defined as the FNC between the initial frame of the replica containing the first frame selected to obtain the RMSD and the first frame used to obtain the RMSD. The third coordinate was defined as the FNC between the initial frame of the replica containing the second frame selected to obtain the RMSD and the second frame used to obtain the RMSD.
A total of 142,000 frames were obtained from the 142 replicas, given that the total time of simulation was 10 ns and frames were extracted every 10 ps. This yielded a total of 142,000=2.86x10 coordinates, which was computationally unmanageable. To address this issue, we reduced the number of frames by obtaining frames every nanosecond, resulting in 10 frames every 10 ns.
Then, we constructed a vector with 1,420 RMSD values and two additional vectors with 1,420 FNC values. We performed combinatorics on the components of each vector to construct the tuples, yielding a total of 2,863,288,000 tuples. To work with this large quantity of tuples, we normalized them, resulting in a reduction to 5,616,518 tuples, each of which had a corresponding weight.
The weight of each tuple was different since tuples could share the same coordinates. We plotted a reasonable quantity of 5,616,518 tuples, Figure S4, which was manageable with our computing power.
. One technique of clusterization involves the unsupervised K-means algorithm, is commonly employed to segregate data into distinct groupings based on shared characteristics. For a comprehensive explanation of the K-means methodology, refer to reference [90]. In essence, K-means is a machine learning algorithm that assigns objects to k clusters based on their features. This clustering procedure involves minimizing the aggregate distance between each object and the centroid of its designated cluster.
The elbow method [91] is a popular technique used to determine the optimal number of clusters in a dataset for unsupervised learning algorithms such as K-means clustering. The method involves plotting the number of clusters against the corresponding values of the Within Cluster Sum of Squares (WCSS), which measures the total distance between data points within each cluster.As the number of clusters increases, the WCSS decreases, indicating a better fit to the data. However, there is a point at which the rate of improvement decreases, resulting in a gradual change in the slope of the plot. This point is called the elbow point, and it represents the optimal number of clusters. The elbow point can be visually identified as the point where the curve starts to flatten out, indicating that the incremental gain in clustering performance is not worth the additional complexity of adding more clusters. The elbow method is a simple yet effective tool for determining the appropriate number of clusters for a given dataset.
The clusterization method yielded 3 clusters, named from 1 to 3 in descending order, with respect to their size. Cluster 1 contains 2,269,895 tuples, cluster 2 contains 2,200,065 tuples and cluster 3 contains 1,146,558 tuples. The cloud of the 5,616,518 tuples was plotted in a 3D graph, and each resulting cluster was coloured differently, additionally each cluster was plotted separated, Figure 7.
When considering the number of executed independent replicas and produced frames, resulting in a 3D data cube with over 5 million points, it can be argued that the phase space describing the conformational changes of the VSD under the influence of external stimuli mimicking nsPEF has been thoroughly sampled. The total set of frames collectively represents the kinetically accessible set of possible conformations of the molecular system. Therefore, it can be assumed that all possible conformations have been sampled, resulting in an equilibrium between clusters. The free energy between clusters can now be computed by relying on established methods. To see how the tuples cover the phase space go to Figure S4.
where R is the molar gas constant, T is the temperature, and in our case and represent the number of tuples on each cluster. The calculated G between all clusters appears in Table 1.
A 2D representation depicting the density of the Tuples for each cluster, considering the RMSD and the FNC, can be seen in Figure 8
From the density profile of each cluster, the closest tuple to the maximum density was obtained using the least squared method. This method was used over a kernel density estimation (KDE) constructed with all tuples using the quadratic error to find the tuple closest to the maximum density point in the KDE. Each of these tuples has an associated frame from the simulations that correspond to the most representative conformation for each cluster. In Figure 9 are represented each representative VSD of each cluster in new-cartoon, seen above the x-y plane and above the z-y plane, and finally are represented each VSD new cartoon with water in van der waals spheres.
4. Discussion
The activation of ionic channels occurs due to the movement or torsion of the S4 helix of voltage-sensing domains (VSDs), which is triggered by a change in the membrane potential. This phenomenon is attributed to the highly charged nature of the S4 helix, which contains four charged arginine residues in its structure. Various models have been proposed to explain the transfer of charge during the activation of ionic channels, and all of them are linked to the movement of the S4 helix [92,93]. These models include the helical screw-sliding model [64,65], the kinetics model [66], and the paddle model [67].
Thus, it is expected that the S4 helix would be the primary factor driving the formation of pores and complex pores in response to a nsPEF stimulus. However, this does not appear to be the case. This study involving a single VSD from the cardiac sodium channel Nav1.5-E1784K, which only contains three arginine residues in the S4 helix (most VSDs have four arginine residues), showed that pores and complex pores were only generated at a membrane potential of =1.1 V. In contrast, other studies using VSDs with four arginine residues required 1.5 V to generate pores and complex pores in the same POPC bilayer [55], and 1.75 V in a more resistant membrane with a cholesterol:POPC ratio of 3:1 [59]. These results strongly suggest that the S4 helix is not the main driver of pore and complex pore formation. This observation raises the question of which VSD properties make them more prone to pore formation. While it is possible that a lower number of arginine residues in the S4 helix may increase the susceptibility to pore or complex pore formation, more studies are required to confirm this conclusion.
One important observation is that the structural changes in the VSD in response to an external electric field are accompanied by a rearrangement of the surrounding membrane, see Figure 4. Considering that membranes can act as allosteric regulators of protein structure and function [94,95], it is hypothesized that the formation of pores and complex pores involves a cooperative rearrangement between the VSD and the membrane. This is supported by a previous study that found pores and complex pores forming in a cholesterol:POPC 3:1 membrane at an electric field strength of =0.2 V/n, but not in a pure POPC membrane [59].
Regarding the density map in Figure 8, cluster 3 appears to be the largest, but this is actually due to the data being more dispersed, as can be observed in Figure 7D.
The clusterization throws 3 structures, two very similar between them that present simple pores. VSD of cluster 2 present a slightly more open VSD that the VSD of cluster 1 letting the pass of more water. The VSD of cluster 3 present a more open pore that form a complex pore.
5. Conclusions
The primary determinant governing the formation of pores in the VSD due to nsPEF stimulation is not the S4 helix, as one might expect intuitively. This specific cardiac VSD, containing only three arginines in the S4 helix, is less resistant to external electric fields compared to similar studies [55,59]. values above 0.14 V/nm, resulting in replicas with membranes rotated by 90°, which are not biologically significant. The final RMSD of the simulated replicas that differentiate between pores and complex pores is approximately 0.8 nm, and above this value, the complex pores are similar, as shown in Figure 6. Full VSD pores start forming at an RMSD greater than 0.35 nm.
The clusterization present 3 cluster, and the most representative VSDs of each cluster are no very different beteewn them, but the water that pass through the is very different. 2 VSDs form a simple pore, and VSD of cluster 3 present a complex pore. The thermal noise of 2.47 kJ/mol indicates that all representative structures of the VSD obtained through clusterization are oscillating in thermal equilibrium with each other
The observation of protein-mediated electroporation through the formation of pores and complex pores in VSDs by nsPEF stimulation, as demonstrated in this MD simulation study, must be considered for a better understanding of the biophysics underlying the effects of nsPEF applications, especially in the case of cardiac VSDs. This newly discovered phenomenon of protein-mediated electroporation due to a nsPEF stimulus is not well-described and should be considered an additional effect of nsPEF in cells. For more information about protein-mediated electroporation go to refer [3] The application of this phenomenon could have significant impacts in various scientific fields. We strongly support the exhortation made by Rems et al. [55] for experimentalists to conduct further investigations on this issue.
Author Contributions
L. Campos, F. Villanelo and Jose Antonio Garate ; formal analysis and paper writing. A.R Ruiz-Fernandez; conceptualization, formal analysis, methodology, investigation, writing original draft preparation. T. Perez-Acle; conceptualization and methodological design, funding, project administration, supervision and writing reviewed version.
Funding
The authors are pleased to acknowledge financial support from FONDECYT 11221268, 1211045 and 1221260. This work was partially supported by the Programa de Apoyo a Centros con Financiamiento Basal FB21008 to Fundación Ciencia & Vida, the Air Force Office of Scientific Research under award number FA9550-20-1-0196. Research was partially sponsored by the Army Research Laboratory and was accomplished under Cooperative Agreement Number W911NF-19-2-0242
Data Availability Statement
All scripts and data can be found in https://github.com/DLab/article_nspef_pores
Acknowledgments
The authors acknowledge computing support from the National Laboratory for High Performance Computing (NLHPC), Universidad de Chile, Powered@NLHPC (ECM-02).
Conflicts of Interest
The authors declare no conflict of interest.
Abbreviations
The following abbreviations are used in this manuscript:
| nsPEF | Nanosecond Pulsed Electric Field |
| NPS | Nano Pulse Stimulation |
| VSD | Voltage Sensing Domain |
| VGC | Voltage-gated ion channels |
| Electric Field | |
| Electric Field in the z axis | |
| POPC | 1-palmitoyl-2-oleoyl-sn-glycero-3-phosphocholine |
| FNC | Fraction of Native Contacts |
| RMSD | Root Mean Square Deviation |
| Free Energy |
References
- Schoenbach, K.H.; Alden, R.W.; Fox, T.J. Biofouling prevention with pulsed electric fields. Proceedings of 1996 International Power Modulator Symposium. IEEE, 1996, pp. 75–78.
- Napotnik, T.B.; Reberšek, M.; Vernier, P.T.; Mali, B.; Miklavčič, D. Effects of high voltage nanosecond electric pulses on eukaryotic cells (in vitro): A systematic review. Bioelectrochemistry 2016, 110, 1–12. [Google Scholar] [CrossRef] [PubMed]
- Ruiz-Fernández, A.R.; Campos, L.; Gutierrez-Maldonado, S.E.; Núñez, G.; Villanelo, F.; Perez-Acle, T. Nanosecond Pulsed Electric Field (nsPEF): Opening the Biotechnological Pandora’s Box. International Journal of Molecular Sciences 2022, 23, 6158. [Google Scholar] [CrossRef]
- Craviso, G.L.; Choe, S.; Chatterjee, P.; Chatterjee, I.; Vernier, P.T. Nanosecond electric pulses: a novel stimulus for triggering Ca 2+ influx into chromaffin cells via voltage-gated Ca 2+ channels. Cellular and molecular neurobiology 2010, 30, 1259–1265. [Google Scholar] [CrossRef]
- Roth, C.C.; Tolstykh, G.P.; Payne, J.A.; Kuipers, M.A.; Thompson, G.L.; DeSilva, M.N.; Ibey, B.L. Nanosecond pulsed electric field thresholds for nanopore formation in neural cells. Journal of biomedical optics 2013, 18, 035005. [Google Scholar] [CrossRef] [PubMed]
- Romanenko, S.; Arnaud-Cormos, D.; Leveque, P.; O’Connor, R.P. Ultrashort pulsed electric fields induce action potentials in neurons when applied at axon bundles. 2016 9th International Kharkiv Symposium on Physics and Engineering of Microwaves, Millimeter and Submillimeter Waves (MSMW). IEEE, 2016, pp. 1–5.
- Casciola, M.; Xiao, S.; Pakhomov, A.G. Damage-free peripheral nerve stimulation by 12-ns pulsed electric field. Scientific Reports 2017, 7, 1–8. [Google Scholar] [CrossRef]
- Pakhomov, A.G.; Semenov, I.; Casciola, M.; Xiao, S. Neuronal excitation and permeabilization by 200-ns pulsed electric field: An optical membrane potential study with FluoVolt dye. Biochimica et Biophysica Acta (BBA)-Biomembranes 2017, 1859, 1273–1281. [Google Scholar] [CrossRef] [PubMed]
- Lamberti, P.; Tucci, V.; Zeni, O.; Romeo, S. Analysis of ionic channel currents under nsPEFs-stimulation by a circuital model of an excitable cell. 2020 IEEE 20th Mediterranean Electrotechnical Conference (MELECON). IEEE, 2020, pp. 411–414.
- Wang, S.; Chen, J.; Chen, M.T.; Vernier, P.T.; Gundersen, M.A.; Valderrábano, M. Cardiac myocyte excitation by ultrashort high-field pulses. Biophysical journal 2009, 96, 1640–1648. [Google Scholar] [CrossRef]
- Semenov, I.; Grigoryev, S.; Neuber, J.U.; Zemlin, C.W.; Pakhomova, O.N.; Casciola, M.; Pakhomov, A.G. Excitation and injury of adult ventricular cardiomyocytes by nano-to millisecond electric shocks. Scientific reports 2018, 8, 1–12. [Google Scholar] [CrossRef]
- Azarov, J.E.; Semenov, I.; Casciola, M.; Pakhomov, A.G. Excitation of murine cardiac myocytes by nanosecond pulsed electric field. Journal of cardiovascular electrophysiology 2019, 30, 392–401. [Google Scholar] [CrossRef]
- Pakhomov, A.G.; Xiao, S.; Novickij, V.; Casciola, M.; Semenov, I.; Mangalanathan, U.; Kim, V.; Zemlin, C.; Sozer, E.; Muratori, C.; others. Excitation and electroporation by MHz bursts of nanosecond stimuli. Biochemical and biophysical research communications 2019, 518, 759–764. [Google Scholar] [CrossRef]
- Zhang, J.; Blackmore, P.F.; Hargrave, B.Y.; Xiao, S.; Beebe, S.J.; Schoenbach, K.H. Nanosecond pulse electric field (nanopulse): a novel non-ligand agonist for platelet activation. Archives of biochemistry and biophysics 2008, 471, 240–248. [Google Scholar] [CrossRef]
- Xiao, S.; Kiyan, T.; Blackmore, P.; Schoenbach, K. Pulsed Power for Wound Healing. 2008 IEEE International Power Modulators and High-Voltage Conference. IEEE, 2008, pp. 69–72.
- Hargrave, B.; Li, F. Nanosecond pulse electric field activation of platelet-rich plasma reduces myocardial infarct size and improves left ventricular mechanical function in the rabbit heart. The journal of extra-corporeal technology 2012, 44, 198. [Google Scholar] [CrossRef] [PubMed]
- Hargrave, B.; Li, F. Nanosecond Pulse Electric Field Activated-Platelet Rich Plasma Enhances the Return of Blood Flow to Large and Ischemic Wounds in a Rabbit Model. Physiological Reports 2015, 3, e12461. [Google Scholar] [CrossRef] [PubMed]
- Vadlamani, R.A.; Nie, Y.; Detwiler, D.A.; Dhanabal, A.; Kraft, A.M.; Kuang, S.; Gavin, T.P.; Garner, A.L. Nanosecond pulsed electric field induced proliferation and differentiation of osteoblasts and myoblasts. Journal of the Royal Society Interface 2019, 16, 20190079. [Google Scholar] [CrossRef] [PubMed]
- Beebe, S.J.; Blackmore, P.F.; White, J.; Joshi, R.P.; Schoenbach, K.H. Nanosecond pulsed electric fields modulate cell function through intracellular signal transduction mechanisms. Physiological measurement 2004, 25, 1077. [Google Scholar] [CrossRef] [PubMed]
- Morotomi-Yano, K.; Uemura, Y.; Katsuki, S.; Akiyama, H.; Yano, K.i. Activation of the JNK pathway by nanosecond pulsed electric fields. Biochemical and Biophysical Research Communications 2011, 408, 471–476. [Google Scholar] [CrossRef] [PubMed]
- Zhang, K.; Guo, J.; Ge, Z.; Zhang, J. Nanosecond pulsed electric fields (nsPEFs) regulate phenotypes of chondrocytes through Wnt/β-catenin signaling pathway. Scientific reports 2014, 4, 5836. [Google Scholar] [CrossRef]
- Guo, S.; Jackson, D.L.; Burcus, N.I.; Chen, Y.J.; Xiao, S.; Heller, R. Gene electrotransfer enhanced by nanosecond pulsed electric fields. Molecular Therapy-Methods & Clinical Development 2014, 1, 14043. [Google Scholar]
- Estlack, L.E.; Roth, C.C.; Thompson, G.L.; Lambert, W.A.; Ibey, B.L. Nanosecond pulsed electric fields modulate the expression of Fas/CD95 death receptor pathway regulators in U937 and Jurkat Cells. Apoptosis 2014, 19, 1755–1768. [Google Scholar] [CrossRef]
- Muratori, C.; Pakhomov, A.G.; Gianulis, E.; Meads, J.; Casciola, M.; Mollica, P.A.; Pakhomova, O.N. Activation of the phospholipid scramblase TMEM16F by nanosecond pulsed electric fields (nsPEF) facilitates its diverse cytophysiological effects. Journal of Biological Chemistry 2017, 292, 19381–19391. [Google Scholar] [CrossRef]
- Zhang, R.; Aji, T.; Shao, Y.; Jiang, T.; Yang, L.; Lv, W.; Chen, Y.; Chen, X.; Wen, H. Nanosecond pulsed electric field (nsPEF) disrupts the structure and metabolism of human Echinococcus granulosus protoscolex in vitro with a dose effect. Parasitology research 2017, 116, 1345–1351. [Google Scholar] [CrossRef]
- Chen, X.; Zhang, R.; Aji, T.; Shao, Y.; Chen, Y.; Wen, H. Novel interventional management of hepatic hydatid cyst with nanosecond pulses on experimental mouse model. Scientific Reports 2017, 7, 1–8. [Google Scholar] [CrossRef]
- Chen, X.; Zhang, R.; Wen, H. Experimental nanopulse ablation of multiple membrane parasite on ex vivo hydatid cyst. BioMed Research International 2018, 2018. [Google Scholar] [CrossRef]
- Nuccitelli, R.; Tran, K.; Lui, K.; Huynh, J.; Athos, B.; Kreis, M.; Nuccitelli, P.; De Fabo, E.C. Non-thermal nanoelectroablation of UV-induced murine melanomas stimulates an immune response. Pigment cell & melanoma research 2012, 25, 618–629. [Google Scholar]
- Chen, R.; Sain, N.M.; Harlow, K.T.; Chen, Y.J.; Shires, P.K.; Heller, R.; Beebe, S.J. A protective effect after clearance of orthotopic rat hepatocellular carcinoma by nanosecond pulsed electric fields. European Journal of Cancer 2014, 50, 2705–2713. [Google Scholar] [CrossRef]
- Nuccitelli, R.; Berridge, J.C.; Mallon, Z.; Kreis, M.; Athos, B.; Nuccitelli, P. Nanoelectroablation of murine tumors triggers a CD8-dependent inhibition of secondary tumor growth. PLoS one 2015, 10, e0134364. [Google Scholar] [CrossRef] [PubMed]
- Nuccitelli, R.; McDaniel, A.; Anand, S.; Cha, J.; Mallon, Z.; Berridge, J.C.; Uecker, D. Nano-Pulse Stimulation is a physical modality that can trigger immunogenic tumor cell death. Journal for immunotherapy of cancer 2017, 5, 32. [Google Scholar] [CrossRef]
- Guo, S.; Jing, Y.; Burcus, N.I.; Lassiter, B.P.; Tanaz, R.; Heller, R.; Beebe, S.J. Nano-pulse stimulation induces potent immune responses, eradicating local breast cancer while reducing distant metastases. International journal of cancer 2018, 142, 629–640. [Google Scholar] [CrossRef] [PubMed]
- Skeate, J.G.; Da Silva, D.M.; Chavez-Juan, E.; Anand, S.; Nuccitelli, R.; Kast, W.M. Nano-Pulse Stimulation induces immunogenic cell death in human papillomavirus-transformed tumors and initiates an adaptive immune response. PloS one 2018, 13, e0191311. [Google Scholar] [CrossRef] [PubMed]
- Dong, F.; Liu, Z.; Zhang, J.; Fang, J.; Guo, J.; Zhang, Y. Nspefs Promoting the Proliferation of Piec Cells: an in Vitro Study. 2017 IEEE International Conference on Plasma Science (ICOPS). IEEE, 2017, pp. 1–1.
- Zhang, Y.; Dong, F.; Liu, Z.; Guo, J.; Zhang, J.; Fang, J. Nanosecond pulsed electric fields promoting the proliferation of porcine iliac endothelial cells: An in vitro study. PloS one 2018, 13, e0196688. [Google Scholar] [CrossRef] [PubMed]
- Buchmann, L.; Frey, W.; Gusbeth, C.; Ravaynia, P.S.; Mathys, A. Effect of nanosecond pulsed electric field treatment on cell proliferation of microalgae. Bioresource technology 2019, 271, 402–408. [Google Scholar] [CrossRef] [PubMed]
- Guo, J.; Ma, R.; Su, B.; Li, Y.; Zhang, J.; Fang, J. Raising the avermectins production in Streptomyces avermitilis by utilizing nanosecond pulsed electric fields (nsPEFs). Scientific Reports 2016, 6, 25949. [Google Scholar] [CrossRef]
- Rajabi, F.; Gusbeth, C.; Frey, W.; Maisch, J.; Nick, P. Nanosecond pulsed electrical fields enhance product recovery in plant cell fermentation. Protoplasma, 2020, pp. 1–10.
- Prorot, A.; Arnaud-Cormos, D.; Lévêque, P.; Leprat, P. Bacterial stress induced by nanosecond pulsed electric fields (nsPEF): potential applications for food industry and environment. 2011.
- Buchmann, L.; Böcker, L.; Frey, W.; Haberkorn, I.; Nyffeler, M.; Mathys, A. Energy input assessment for nanosecond pulsed electric field processing and its application in a case study with Chlorella vulgaris. Innovative Food Science & Emerging Technologies 2018, 47, 445–453. [Google Scholar]
- Haberkorn, I.; Buchmann, L.; Häusermann, I.; Mathys, A. Nanosecond pulsed electric field processing of microalgae based biorefineries governs growth promotion or selective inactivation based on underlying microbial ecosystems. Bioresource Technology, 2020, p. 124173.
- Eing, C.J.; Bonnet, S.; Pacher, M.; Puchta, H.; Frey, W. Effects of nanosecond pulsed electric field exposure on Arabidopsis thaliana. IEEE Transactions on Dielectrics and Electrical Insulation 2009, 16, 1322–1328. [Google Scholar] [CrossRef]
- Songnuan, W.; Kirawanich, P. Early growth effects on Arabidopsis thaliana by seed exposure of nanosecond pulsed electric field. Journal of Electrostatics 2012, 70, 445–450. [Google Scholar] [CrossRef]
- Su, B.; Guo, J.; Nian, W.; Feng, H.; Wang, K.; Zhang, J.; Fang, J. Early growth effects of nanosecond pulsed electric field (nsPEFs) exposure on Haloxylon ammodendron. Plasma Processes and Polymers 2015, 12, 372–379. [Google Scholar] [CrossRef]
- Ruiz-Fernández, A.; Rosemblatt, M.; Perez-Acle, T. Nanosecond pulsed electric field (nsPEF) and vaccines: a novel technique for the inactivation of SARS-CoV-2 and other viruses? Annals of Medicine 2022, 54, 1749–1756. [Google Scholar] [CrossRef] [PubMed]
- Hu, Q.; Joshi, R.; Schoenbach, K. Simulations of nanopore formation and phosphatidylserine externalization in lipid membranes subjected to a high-intensity, ultrashort electric pulse. Physical Review E 2005, 72, 031902. [Google Scholar] [CrossRef]
- Vernier, P.T.; Ziegler, M.J.; Sun, Y.; Chang, W.V.; Gundersen, M.A.; Tieleman, D.P. Nanopore formation and phosphatidylserine externalization in a phospholipid bilayer at high transmembrane potential. Journal of the American Chemical Society 2006, 128, 6288–6289. [Google Scholar] [CrossRef]
- Pakhomov, A.G.; Bowman, A.M.; Ibey, B.L.; Andre, F.M.; Pakhomova, O.N.; Schoenbach, K.H. Lipid nanopores can form a stable, ion channel-like conduction pathway in cell membrane. Biochemical and biophysical research communications 2009, 385, 181–186. [Google Scholar] [CrossRef]
- Pakhomov, A.G.; Pakhomova, O.N. Nanopores: A distinct transmembrane passageway in electroporated cells. Advanced Electroporation Techniques in Biology in Medicine, 2010; 178–194. [Google Scholar]
- Semenov, I.; Xiao, S.; Kang, D.; Schoenbach, K.H.; Pakhomov, A.G. Cell stimulation and calcium mobilization by picosecond electric pulses. Bioelectrochemistry 2015, 105, 65–71. [Google Scholar] [CrossRef] [PubMed]
- Bagalkot, T.R.; Terhune, R.C.; Leblanc, N.; Craviso, G.L. Different membrane pathways mediate Ca2+ influx in adrenal chromaffin cells exposed to 150–400 ns electric pulses. BioMed research international 2018, 2018. [Google Scholar] [CrossRef] [PubMed]
- Hristov, K.; Mangalanathan, U.; Casciola, M.; Pakhomova, O.N.; Pakhomov, A.G. Expression of voltage-gated calcium channels augments cell susceptibility to membrane disruption by nanosecond pulsed electric field. Biochimica et Biophysica Acta (BBA)-Biomembranes, 2018. [Google Scholar]
- Bagalkot, T.R.; Leblanc, N.; Craviso, G.L. Stimulation or Cancellation of Ca 2+ Influx by Bipolar Nanosecond Pulsed Electric Fields in Adrenal Chromaffin Cells Can Be Achieved by Tuning Pulse Waveform. Scientific Reports 2019, 9, 1–13. [Google Scholar] [CrossRef] [PubMed]
- Marracino, P.; Bernardi, M.; Liberti, M.; Del Signore, F.; Trapani, E.; Garate, J.A.; Burnham, C.J.; Apollonio, F.; English, N.J. Transprotein-electropore characterization: a molecular dynamics investigation on human AQP4. ACS omega 2018, 3, 15361–15369. [Google Scholar] [CrossRef] [PubMed]
- Rems, L.; Kasimova, M.A.; Testa, I.; Delemotte, L. Pulsed electric fields can create pores in the voltage sensors of voltage-gated ion channels. Biophysical journal 2020, 119, 190–205. [Google Scholar] [CrossRef] [PubMed]
- Weaver, J.C. Electroporation: a general phenomenon for manipulating cells and tissues. Journal of cellular biochemistry 1993, 51, 426–435. [Google Scholar] [CrossRef]
- Weaver, J.C.; Vernier, P.T. Pore lifetimes in cell electroporation: Complex dark pores? arXiv 2017, arXiv:1708.07478. [Google Scholar]
- Weaver, J.C.; Barnett, A. Progress toward a theoretical model for electroporation mechanism: membrane electrical behavior and molecular transport. Guide to electroporation and electrofusion. 1992, pp. 91–117.
- Ruiz-Fernández, A.R.; Campos, L.; Villanelo, F.; Gutiérrez-Maldonado, S.E.; Perez-Acle, T. Exploring the Conformational Changes Induced by Nanosecond Pulsed Electric Fields on the Voltage Sensing Domain of a Ca2+ Channel. Membranes 2021, 11, 473. [Google Scholar] [CrossRef]
- Yellen, G. The moving parts of voltage-gated ion channels. Quarterly reviews of biophysics 1998, 31, 239–295. [Google Scholar] [CrossRef]
- Gonzalez, C.; Contreras, G.F.; Peyser, A.; Larsson, P.; Neely, A.; Latorre, R. Voltage sensor of ion channels and enzymes. Biophysical reviews 2012, 4, 1–15. [Google Scholar] [CrossRef]
- Delemotte, L.; Tarek, M.; Klein, M.L.; Amaral, C.; Treptow, W. Intermediate states of the Kv1. 2 voltage sensor from atomistic molecular dynamics simulations. Proceedings of the National Academy of Sciences 2011, 108, 6109–6114. [Google Scholar] [CrossRef]
- Li, Z.; Jin, X.; Wu, T.; Zhao, X.; Wang, W.; Lei, J.; Pan, X.; Yan, N. Structure of human Nav1. 5 reveals the fast inactivation-related segments as a mutational hotspot for the long QT syndrome. Proceedings of the National Academy of Sciences 2021, 118, e2100069118. [Google Scholar] [CrossRef]
- Catterall, W.A. Voltage-dependent gating of sodium channels: correlating structure and function. Trends in Neurosciences 1986, 9, 7–10. [Google Scholar] [CrossRef]
- GuY, H.R.; Seetharamulu, P. Molecular model of the action potential sodium channel. Proceedings of the National Academy of Sciences 1986, 83, 508–512. [Google Scholar] [CrossRef]
- Bezanilla, F. The voltage sensor in voltage-dependent ion channels. Physiological reviews 2000, 80, 555–592. [Google Scholar] [CrossRef] [PubMed]
- Jiang, Y.; Ruta, V.; Chen, J.; Lee, A.; MacKinnon, R. The principle of gating charge movement in a voltage-dependent K+ channel. Nature 2003, 423, 42–48. [Google Scholar] [CrossRef] [PubMed]
- Jiang, Y.; Lee, A.; Chen, J.; Ruta, V.; Cadene, M.; Chait, B.T.; MacKinnon, R. X-ray structure of a voltage-dependent K+ channel. nature 2003, 423, 33. [Google Scholar] [CrossRef] [PubMed]
- Chanda, B.; Asamoah, O.K.; Blunck, R.; Roux, B.; Bezanilla, F. Gating charge displacement in voltage-gated ion channels involves limited transmembrane movement. Nature 2005, 436, 852–856. [Google Scholar] [CrossRef]
- Varghese, F.; Neuber, J.U.; Xie, F.; Philpott, J.M.; Pakhomov, A.G.; Zemlin, C.W. Low-energy defibrillation with nanosecond electric shocks. Cardiovascular Research 2017, 113, 1789–1797. [Google Scholar] [CrossRef]
- Nesin, V.; Pakhomov, A.G. Inhibition of voltage-gated Na+ current by nanosecond pulsed electric field (nsPEF) is not mediated by Na+ influx or Ca2+ signaling. Bioelectromagnetics 2012, 33, 443–451. [Google Scholar] [CrossRef] [PubMed]
- Nesin, V.; Bowman, A.M.; Xiao, S.; Pakhomov, A.G. Cell permeabilization and inhibition of voltage-gated Ca2+ and Na+ channel currents by nanosecond pulsed electric field. Bioelectromagnetics 2012, 33, 394–404. [Google Scholar] [CrossRef] [PubMed]
- Spoel, V.D.; others. GROMACS 2020.6 Source code. Zenodo.
- Huang, J.; MacKerell Jr, A.D. CHARMM36 all-atom additive protein force field: Validation based on comparison to NMR data. Journal of computational chemistry 2013, 34, 2135–2145. [Google Scholar] [CrossRef] [PubMed]
- Darden, T.; York, D.; Pedersen, L. Particle mesh Ewald: An Nlog (N) method for Ewald sums in large systems. The Journal of chemical physics 1993, 98, 10089–10092. [Google Scholar] [CrossRef]
- Hess, B.; Bekker, H.; Berendsen, H.J.; Fraaije, J.G. LINCS: a linear constraint solver for molecular simulations. Journal of computational chemistry 1997, 18, 1463–1472. [Google Scholar] [CrossRef]
- Evans, D.J.; Holian, B.L. The nose–hoover thermostat. The Journal of chemical physics 1985, 83, 4069–4074. [Google Scholar] [CrossRef]
- Parrinello, M.; Rahman, A. Polymorphic transitions in single crystals: A new molecular dynamics method. Journal of Applied physics 1981, 52, 7182–7190. [Google Scholar] [CrossRef]
- Jorgensen, W.L.; Chandrasekhar, J.; Madura, J.D.; Impey, R.W.; Klein, M.L. Comparison of simple potential functions for simulating liquid water. The Journal of chemical physics 1983, 79, 926–935. [Google Scholar] [CrossRef]
- Jo, S.; Kim, T.; Iyer, V.G.; Im, W. CHARMM-GUI: a web-based graphical user interface for CHARMM. Journal of computational chemistry 2008, 29, 1859–1865. [Google Scholar] [CrossRef]
- Hibino, M.; Shigemori, M.; Itoh, H.; Nagayama, K.; Kinosita Jr, K. Membrane conductance of an electroporated cell analyzed by submicrosecond imaging of transmembrane potential. Biophysical journal 1991, 59, 209–220. [Google Scholar] [CrossRef]
- Frey, W.; White, J.; Price, R.; Blackmore, P.; Joshi, R.; Nuccitelli, R.; Beebe, S.; Schoenbach, K.; Kolb, J. Plasma membrane voltage changes during nanosecond pulsed electric field exposure. Biophysical journal 2006, 90, 3608–3615. [Google Scholar] [CrossRef] [PubMed]
- Benz, R.; Conti, F. Reversible electrical breakdown of squid giant axon membrane. Biochimica et Biophysica Acta (BBA)-Biomembranes 1981, 645, 115–123. [Google Scholar] [CrossRef]
- Teissie, J.; Tsong, T.Y. Electric field induced transient pores in phospholipid bilayer vesicles. Biochemistry 1981, 20, 1548–1554. [Google Scholar] [CrossRef] [PubMed]
- Marszalek, P.; Liu, D.; Tsong, T.Y. Schwan equation and transmembrane potential induced by alternating electric field. Biophysical journal 1990, 58, 1053–1058. [Google Scholar] [CrossRef] [PubMed]
- Sugar, I.P.; Neumann, E. Stochastic model for electric field-induced membrane pores electroporation. Biophysical chemistry 1984, 19. [Google Scholar] [CrossRef] [PubMed]
- Popescu, D.; Rucǎreanu, C.; Victor, G. A model for the appearance of statistical pores in membranes due to selfoscillations. Journal of Electroanalytical Chemistry and Interfacial Electrochemistry 1991, 320, 91–103. [Google Scholar] [CrossRef]
- Gowrishankar, T.R.; Esser, A.T.; Vasilkoski, Z.; Smith, K.C.; Weaver, J.C. Microdosimetry for conventional and supra-electroporation in cells with organelles. Biochemical and biophysical research communications 2006, 341, 1266–1276. [Google Scholar] [CrossRef]
- Gumbart, J.; Khalili-Araghi, F.; Sotomayor, M.; Roux, B. Constant electric field simulations of the membrane potential illustrated with simple systems. Biochimica et Biophysica Acta (BBA)-Biomembranes 2012, 1818, 294–302. [Google Scholar] [CrossRef]
- Likas, A.; Vlassis, N.; Verbeek, J.J. The global k-means clustering algorithm. Pattern recognition 2003, 36, 451–461. [Google Scholar] [CrossRef]
- King, G.J.; Richards, R.R.; Zuckerman, J.D.; Blasier, R.; Dillman, C.; Friedman, R.J.; Gartsman, G.M.; Iannotti, J.P.; Murnahan, J.P.; Mow, V.C.; others. A standardized method for assessment of elbow function. Journal of shoulder and elbow surgery 1999, 8, 351–354. [Google Scholar]
- Blaustein, R.O.; Miller, C. Ion channels: shake, rattle or roll? Nature 2004, 427, 499. [Google Scholar] [CrossRef] [PubMed]
- Horn, R. Conversation between voltage sensors and gates of ion channels. Biochemistry 2000, 39, 15653–15658. [Google Scholar] [CrossRef] [PubMed]
- Tonnesen, A.; Christensen, S.M.; Tkach, V.; Stamou, D. Geometrical membrane curvature as an allosteric regulator of membrane protein structure and function. Biophysical journal 2014, 106, 201–209. [Google Scholar] [CrossRef]
- Andersen, O.S.; Koeppe, R.E. Bilayer thickness and membrane protein function: an energetic perspective. Annu. Rev. Biophys. Biomol. Struct. 2007, 36, 107–130. [Google Scholar] [CrossRef] [PubMed]
Figure 1.
Structural overview of voltage-gated channels. A) Transmembrane disposition of a single voltage-gated K channel subunit. There are six transmembrane regions, denoted by S1 through S6. B) Structural organization of voltage-gated channels. Na and Ca channels have four homologous repeats of the core motif in a single polypeptide chain; K channels are tetrameric assemblies of subunits with a single core motif. C) A 3D representation of the crystallographic structure of a Arcobacter butzleri RM4018 VGCC in its open state (PDB ID: 4MS2). In green the four VSD, in blue the helical conformation 3 in the S4 helix, in purple the S4-S5 helix (not present in A) or B) that connect the S5 and S6 helix, in light purple the S5 helix and the rest of amino acids that connect to the S6 helix. In black cylinder the S6 helix and the red spheres represent three calcium atoms. Figure extracted from article entitled Exploring the conformational changes induced by "Nanosecond Pulsed Electric Fields on the Voltage Sensing Domain of a Ca Channel", journal membranes [59]
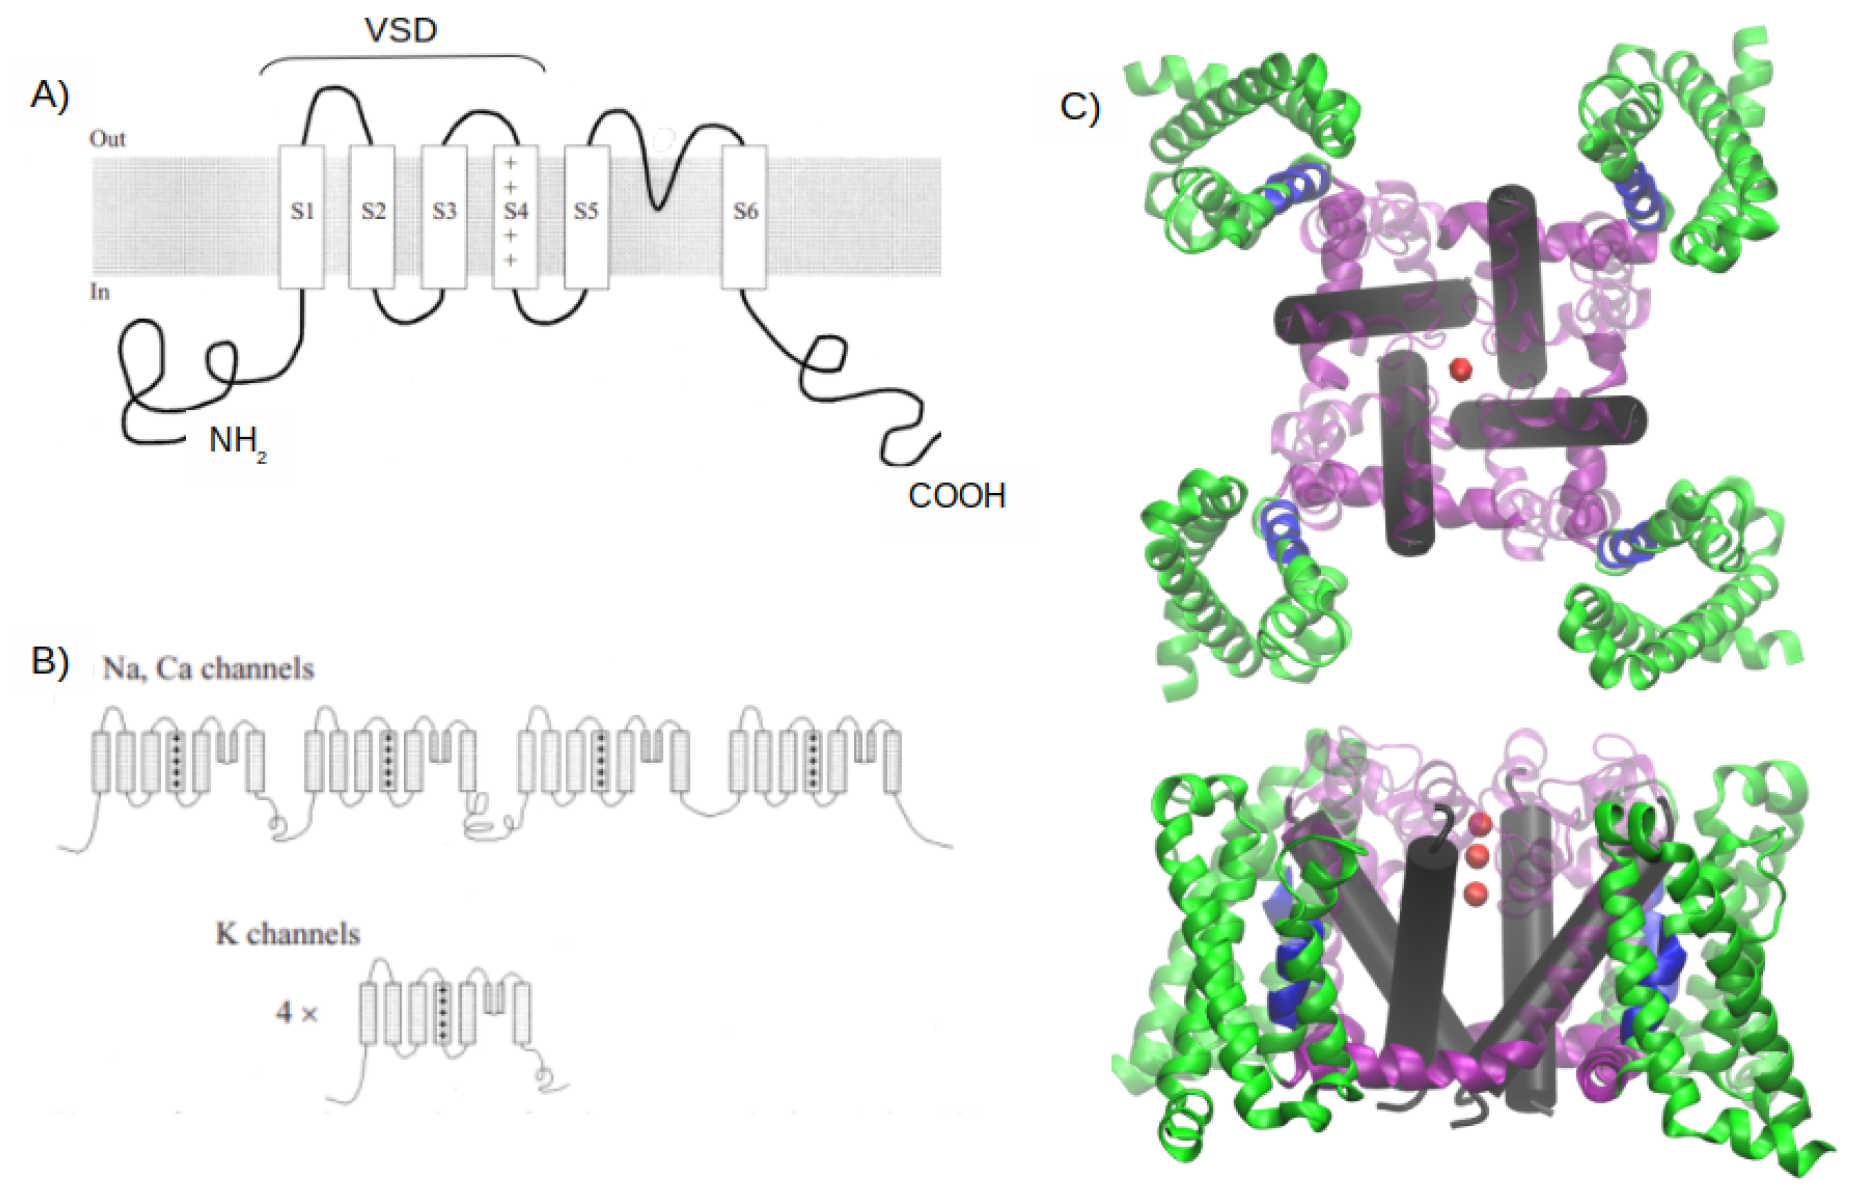
Figure 2.
A) RMSD as a function of time during 200 ns of equilibration. B) VSD represented in cartoon and in sky blue color, water represented in van der waals spheres.
Figure 2.
A) RMSD as a function of time during 200 ns of equilibration. B) VSD represented in cartoon and in sky blue color, water represented in van der waals spheres.
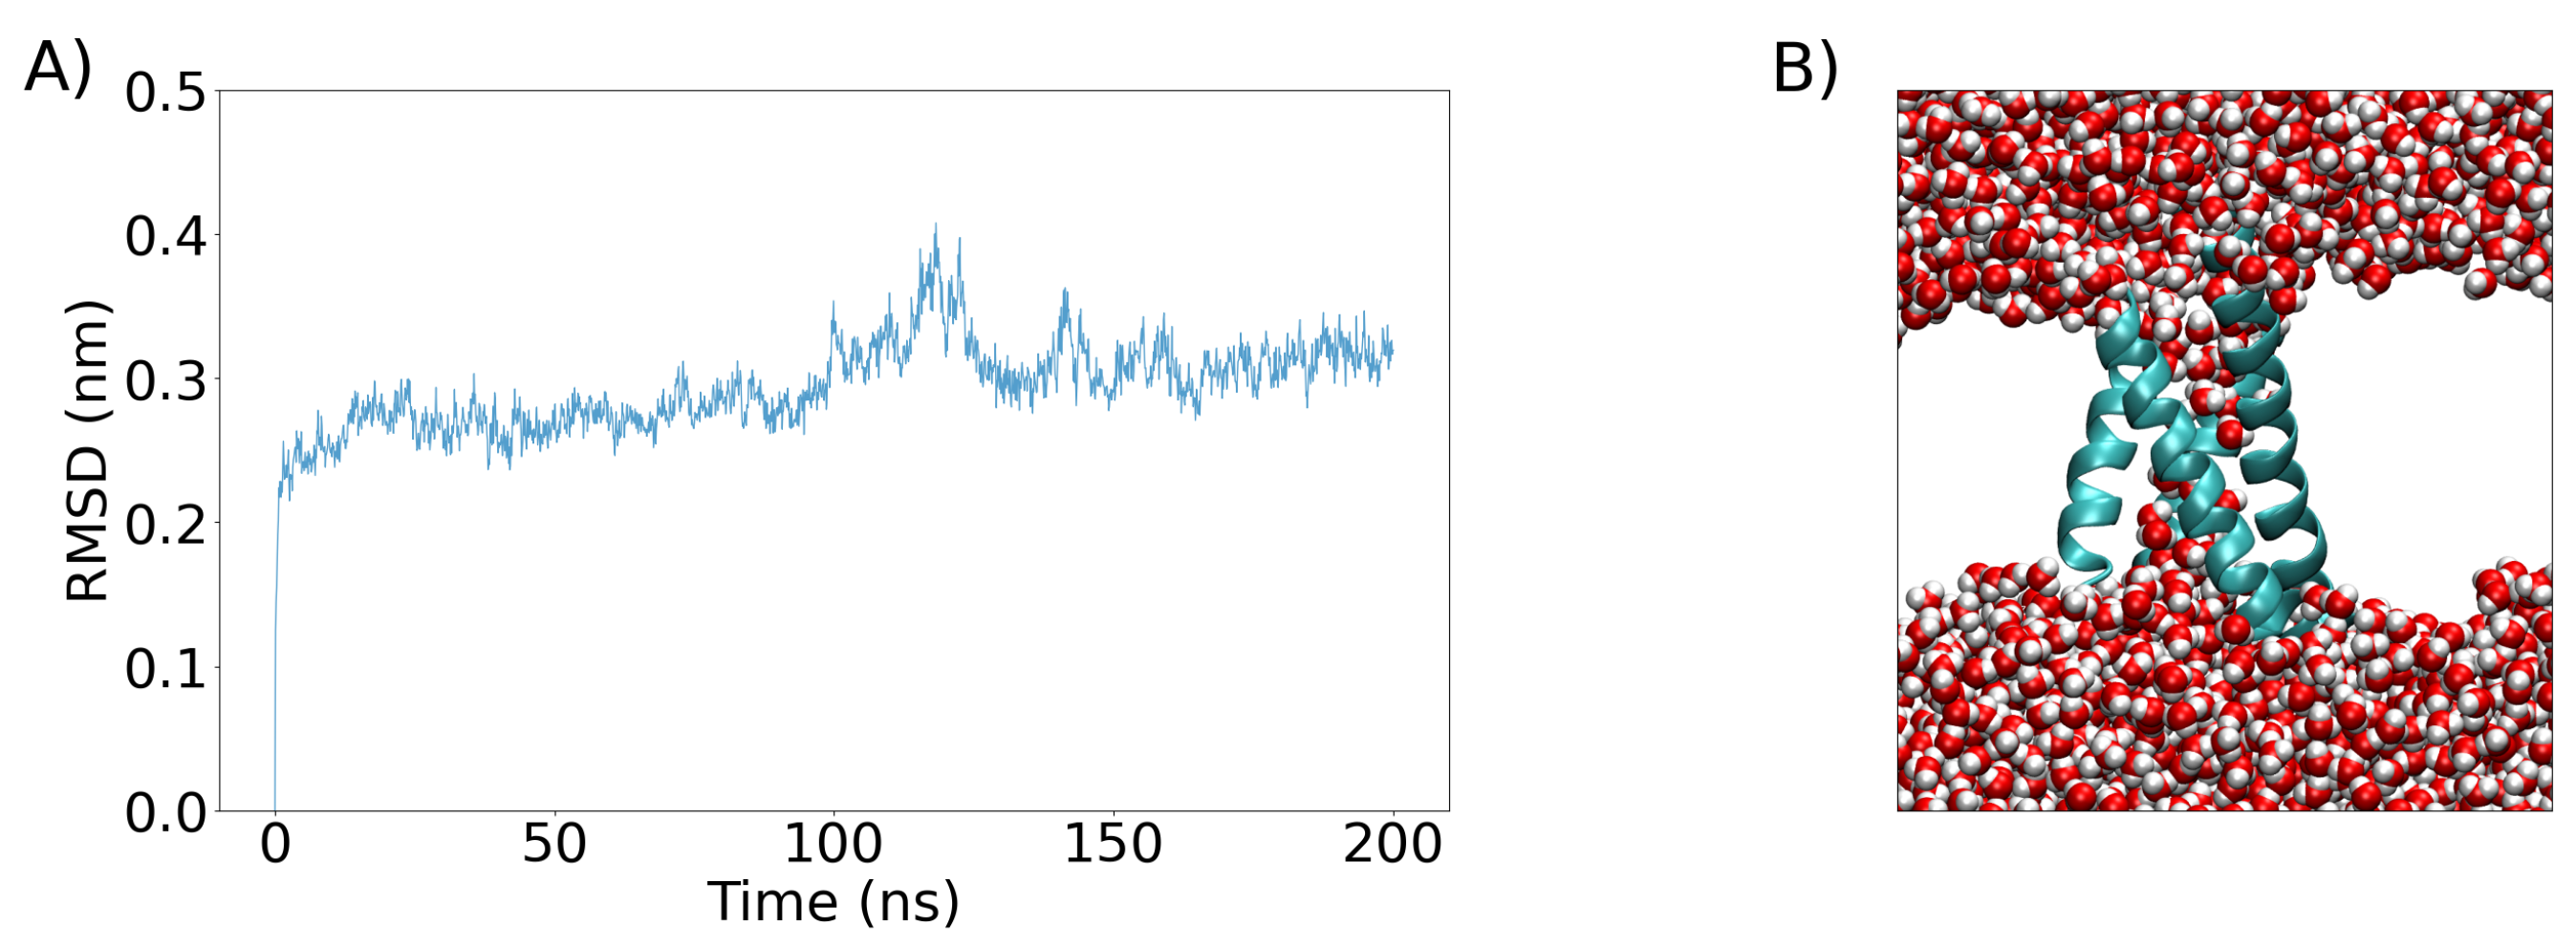
Figure 3.
RMSD at different of the the third VSD of the human Nav1.5-E1784K, immerse in a POPC bilayer. A) 8 replicas at =0.10 V/nm. B) 8 replicas at =0.12 V/nm. C) 8 replicas at =0.14 V/nm. D) 8 replicas at =0.16 V/nm. E) 8 replicas at =0.18 V/nm. F) 8 replicas at =0.20 V/nm. G) 200 replicas at =0.13 V/nm.
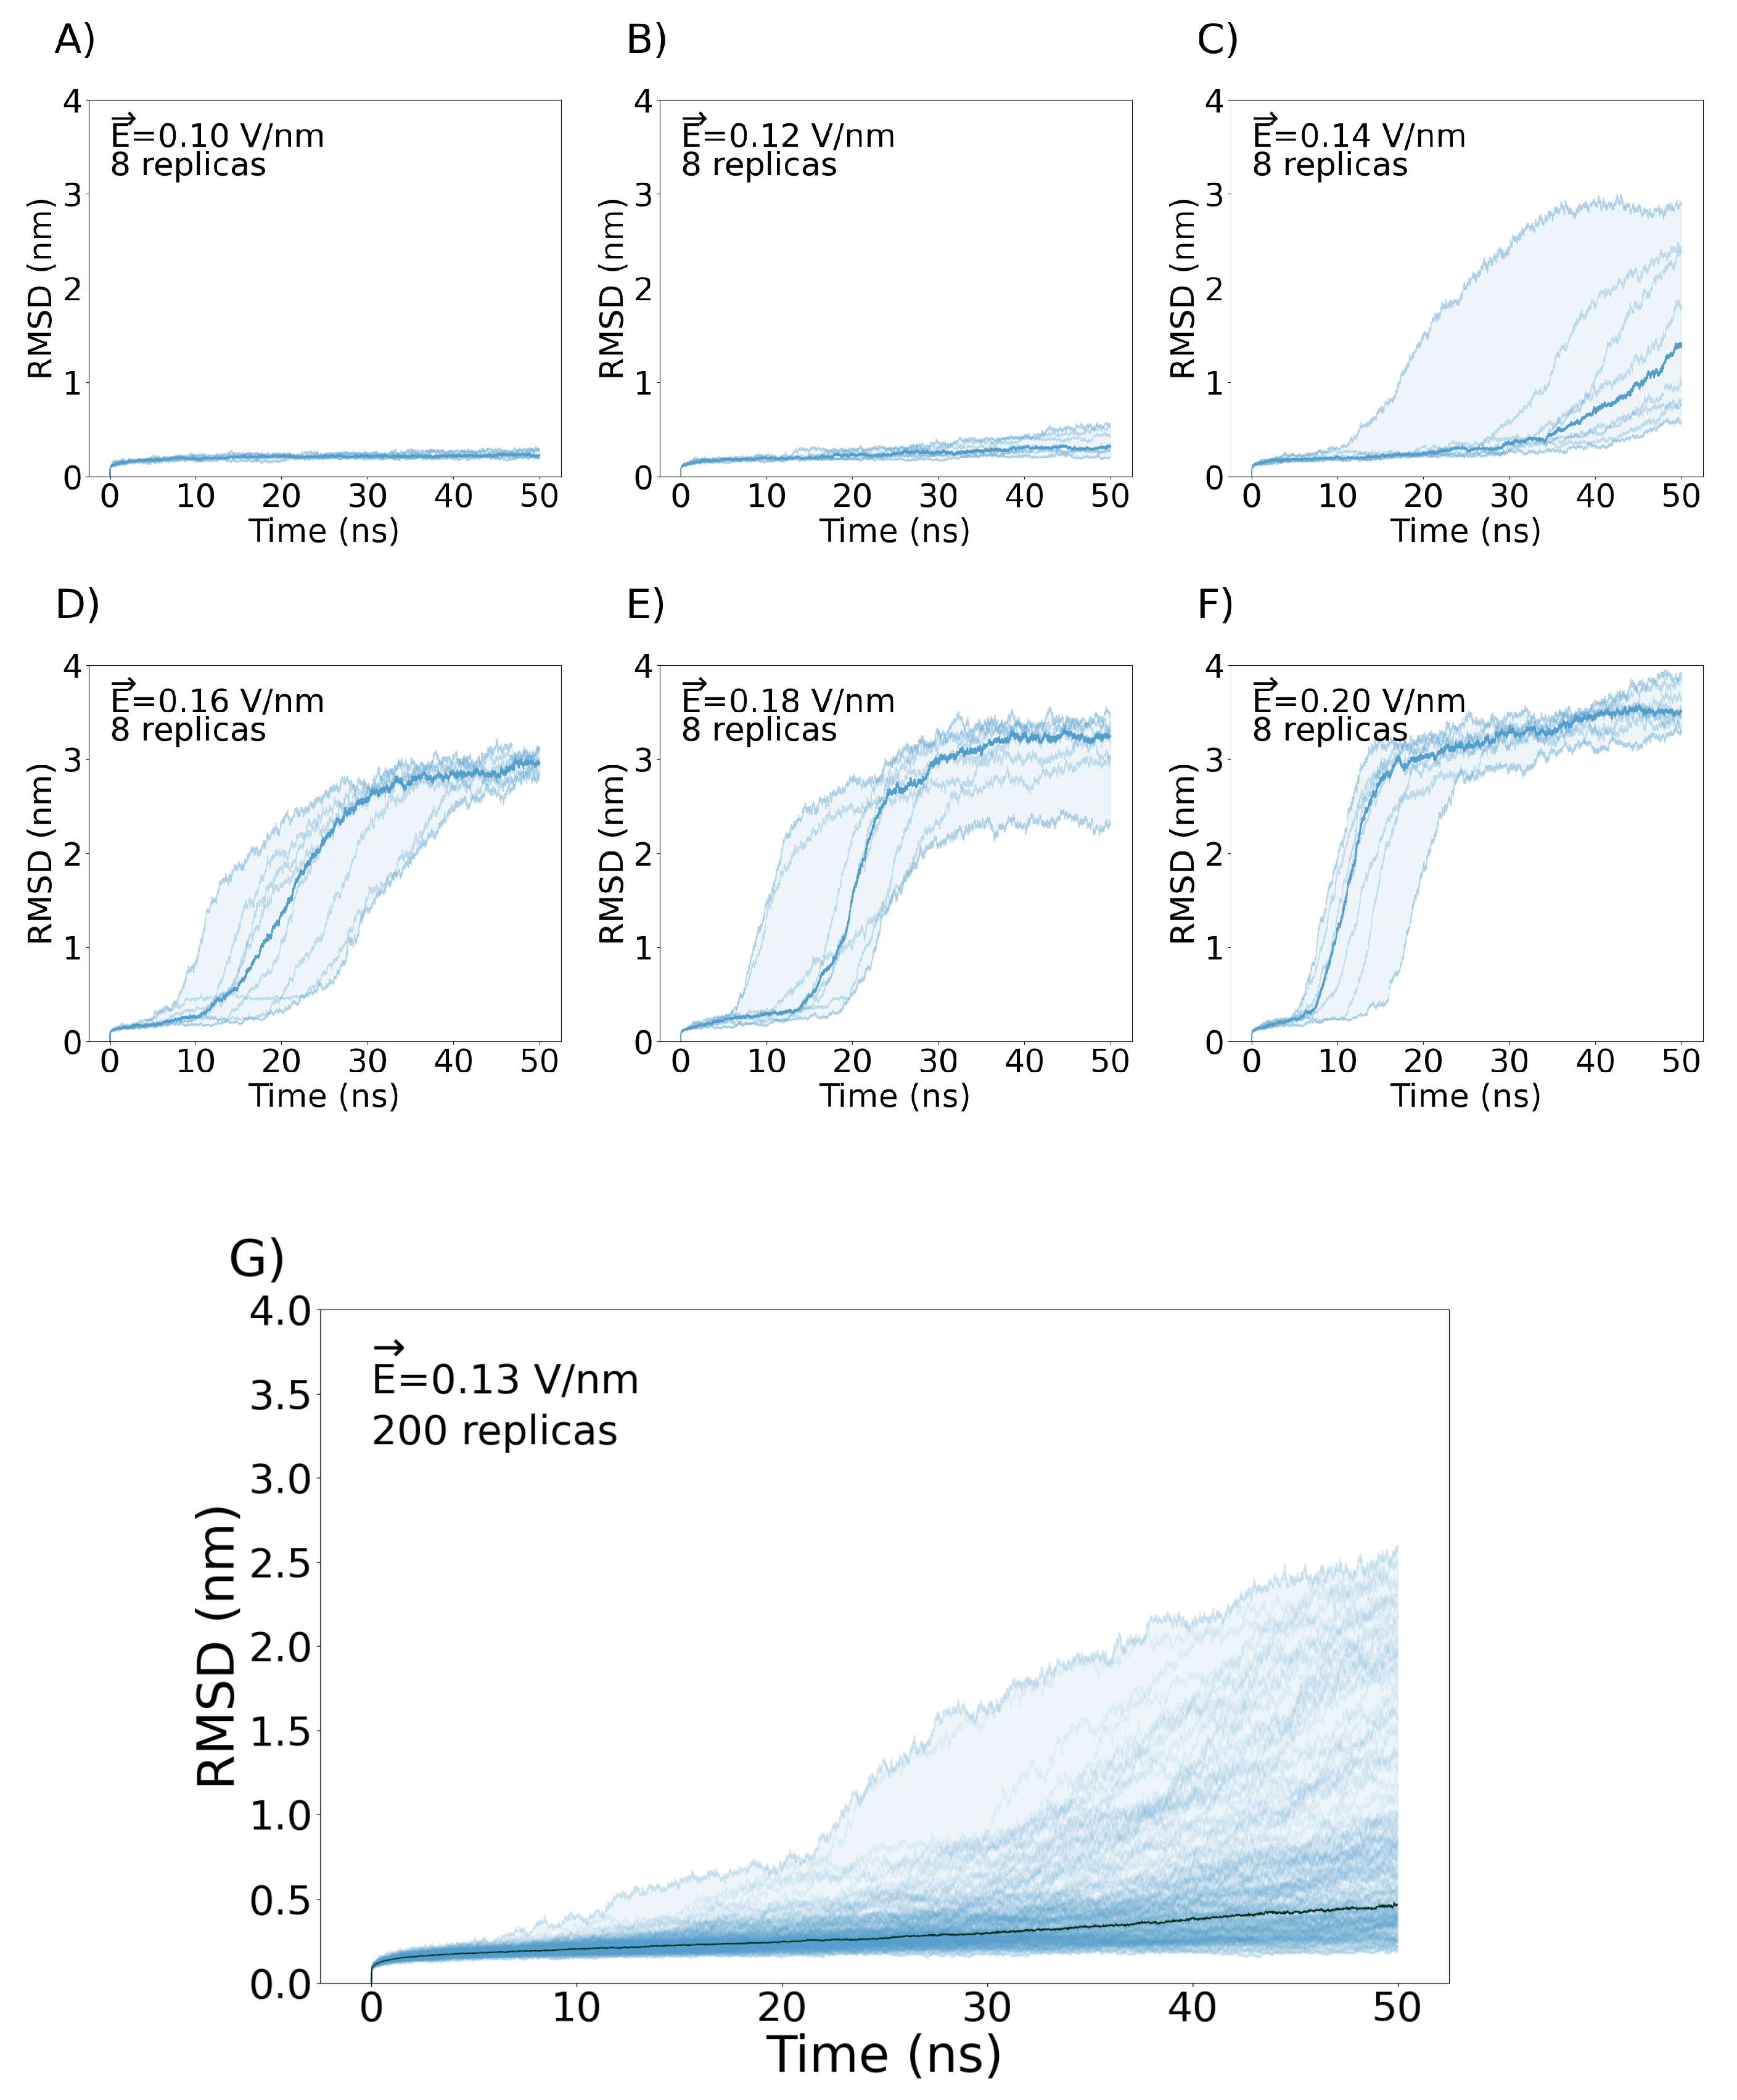
Figure 4.
Membrane rearrangement of replicas forming complex pores under an external =0.13 with high ending RMSD. A) Final RMSD=2.38 nm . B) Final RMSD=2.25 nm. C) Final RMSD=2.47 nm. D) Final RMSD=2.22.
Figure 4.
Membrane rearrangement of replicas forming complex pores under an external =0.13 with high ending RMSD. A) Final RMSD=2.38 nm . B) Final RMSD=2.25 nm. C) Final RMSD=2.47 nm. D) Final RMSD=2.22.
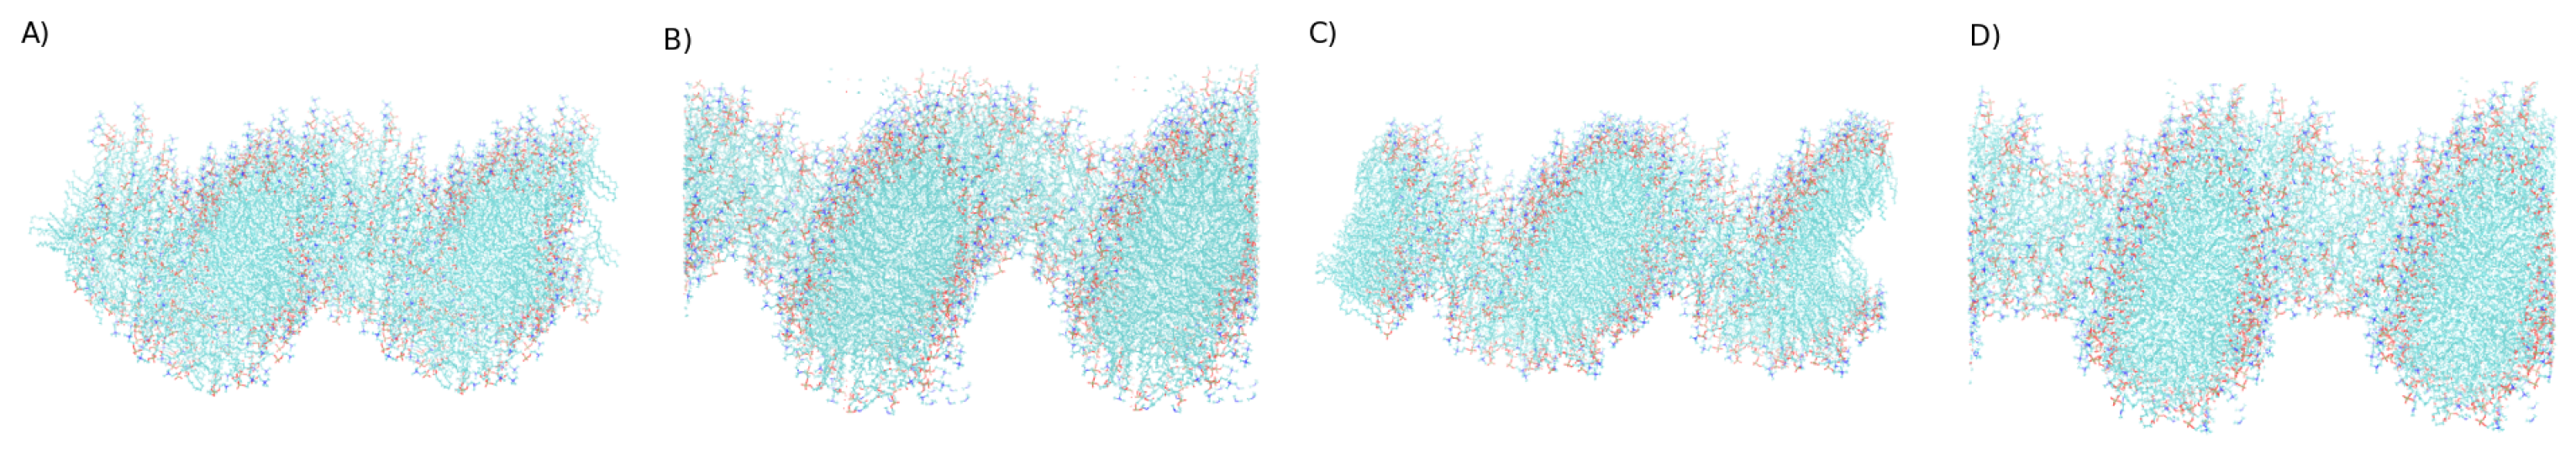
Figure 5.
Five examples of the higher RMSD below RMSD of 0.35. The protein is represented in sky blue cartoon, and water in van der waals spheres representation. The white spaces are POPC. A) Final RMSD=0.349. B) RMSD=0.323 nm.C) Final RMSD=0.330. D) Final RMSD=0.328 nm. E) Final RMSD=0.348 nm.
Figure 5.
Five examples of the higher RMSD below RMSD of 0.35. The protein is represented in sky blue cartoon, and water in van der waals spheres representation. The white spaces are POPC. A) Final RMSD=0.349. B) RMSD=0.323 nm.C) Final RMSD=0.330. D) Final RMSD=0.328 nm. E) Final RMSD=0.348 nm.
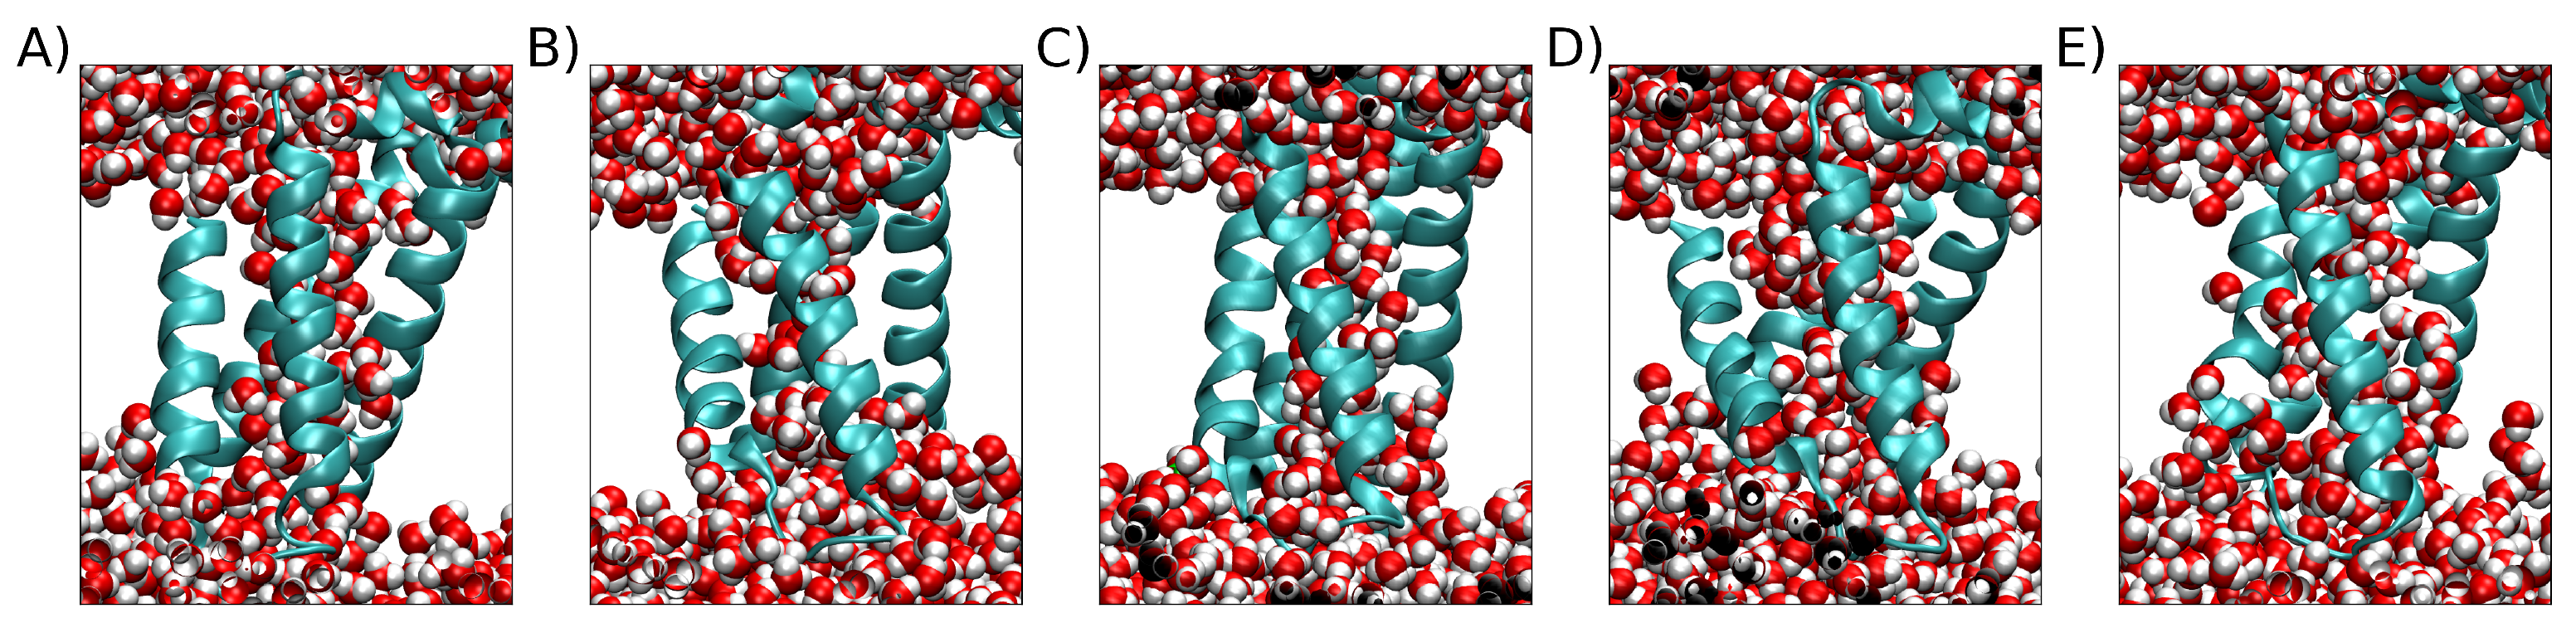
Figure 6.
Examples of VSD structure with water crossing the membrane at different final RMSD. VSD represented new cartoon with sky blue color, and water in van der waals spheres representation A) Example of VSD with larges RMSD. B) Example with higher RMSD below 2.0 nm. C) Example with higher RMSD below 1.6 nm. D) Example with higher RMSD below 1.2 nm. E)Example with higher RMSD below 0.8 nm. F) Example with higher RMSD below 0.6 nm. G) Example with higher RMSD below 0.4 nm. H) Example with higher RMSD below 0.4 nm.
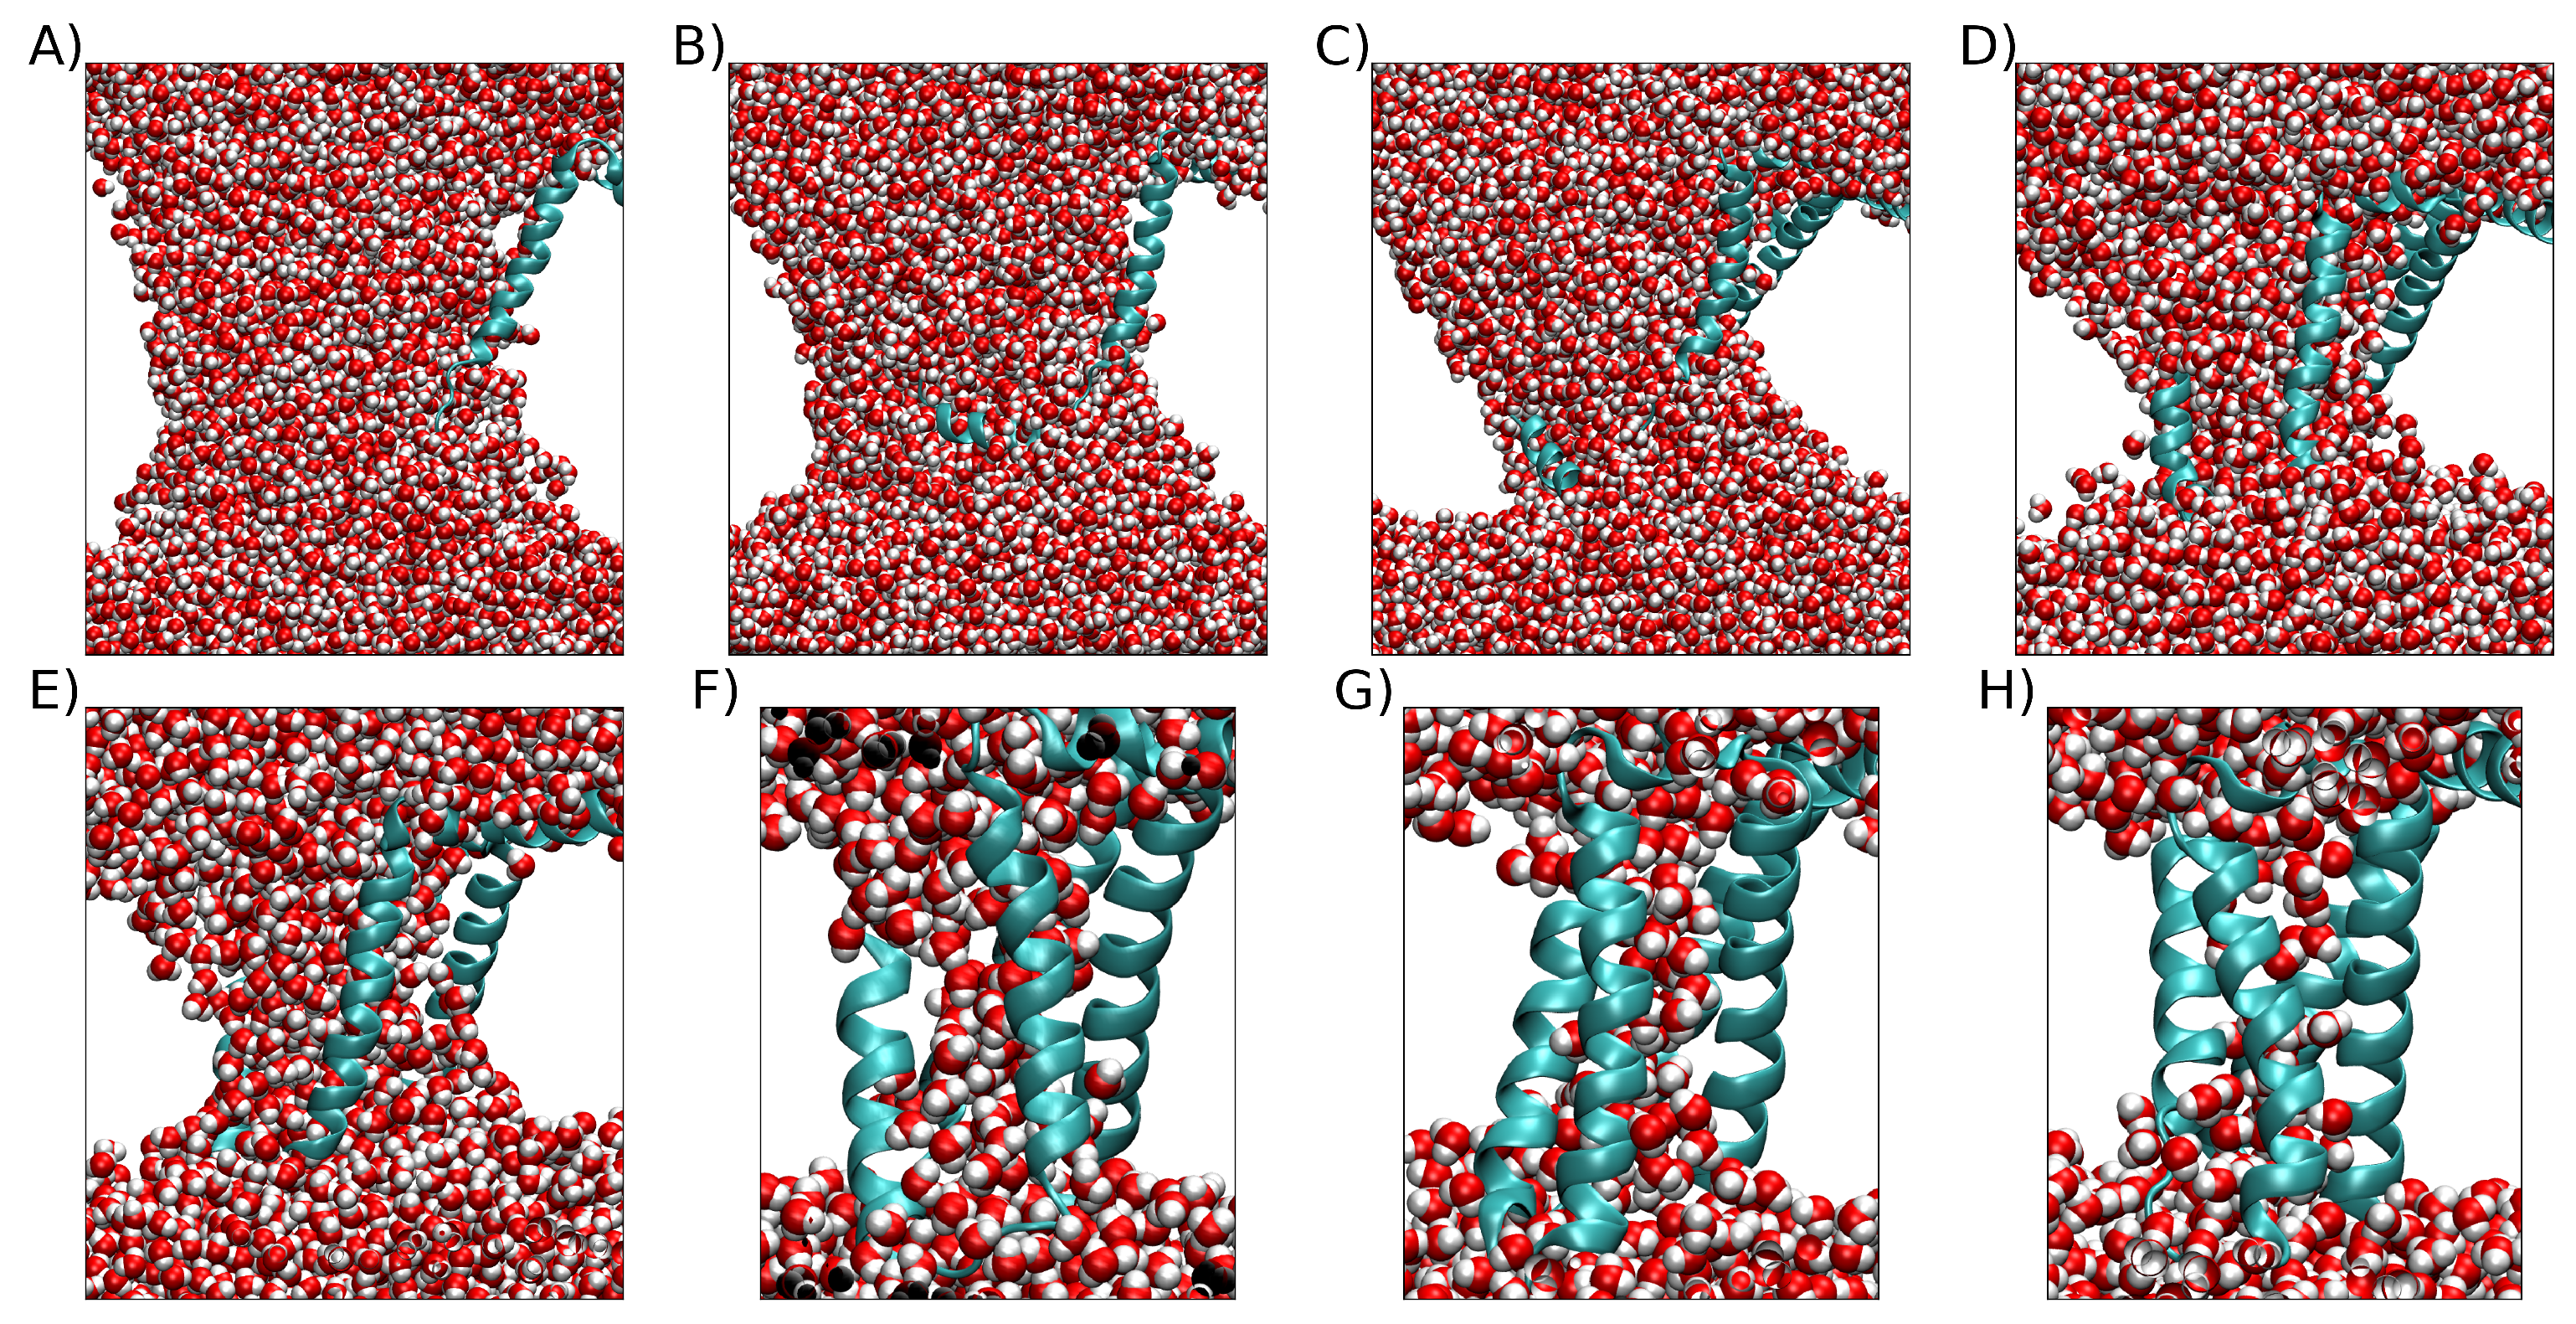
Figure 7.
A) The 3 cluster plotted in a 3D cube with each cluster in different color, and their centroid in a red circle. B) Cluster 1. C) Cluster 2. D) Cluster 3
Figure 7.
A) The 3 cluster plotted in a 3D cube with each cluster in different color, and their centroid in a red circle. B) Cluster 1. C) Cluster 2. D) Cluster 3
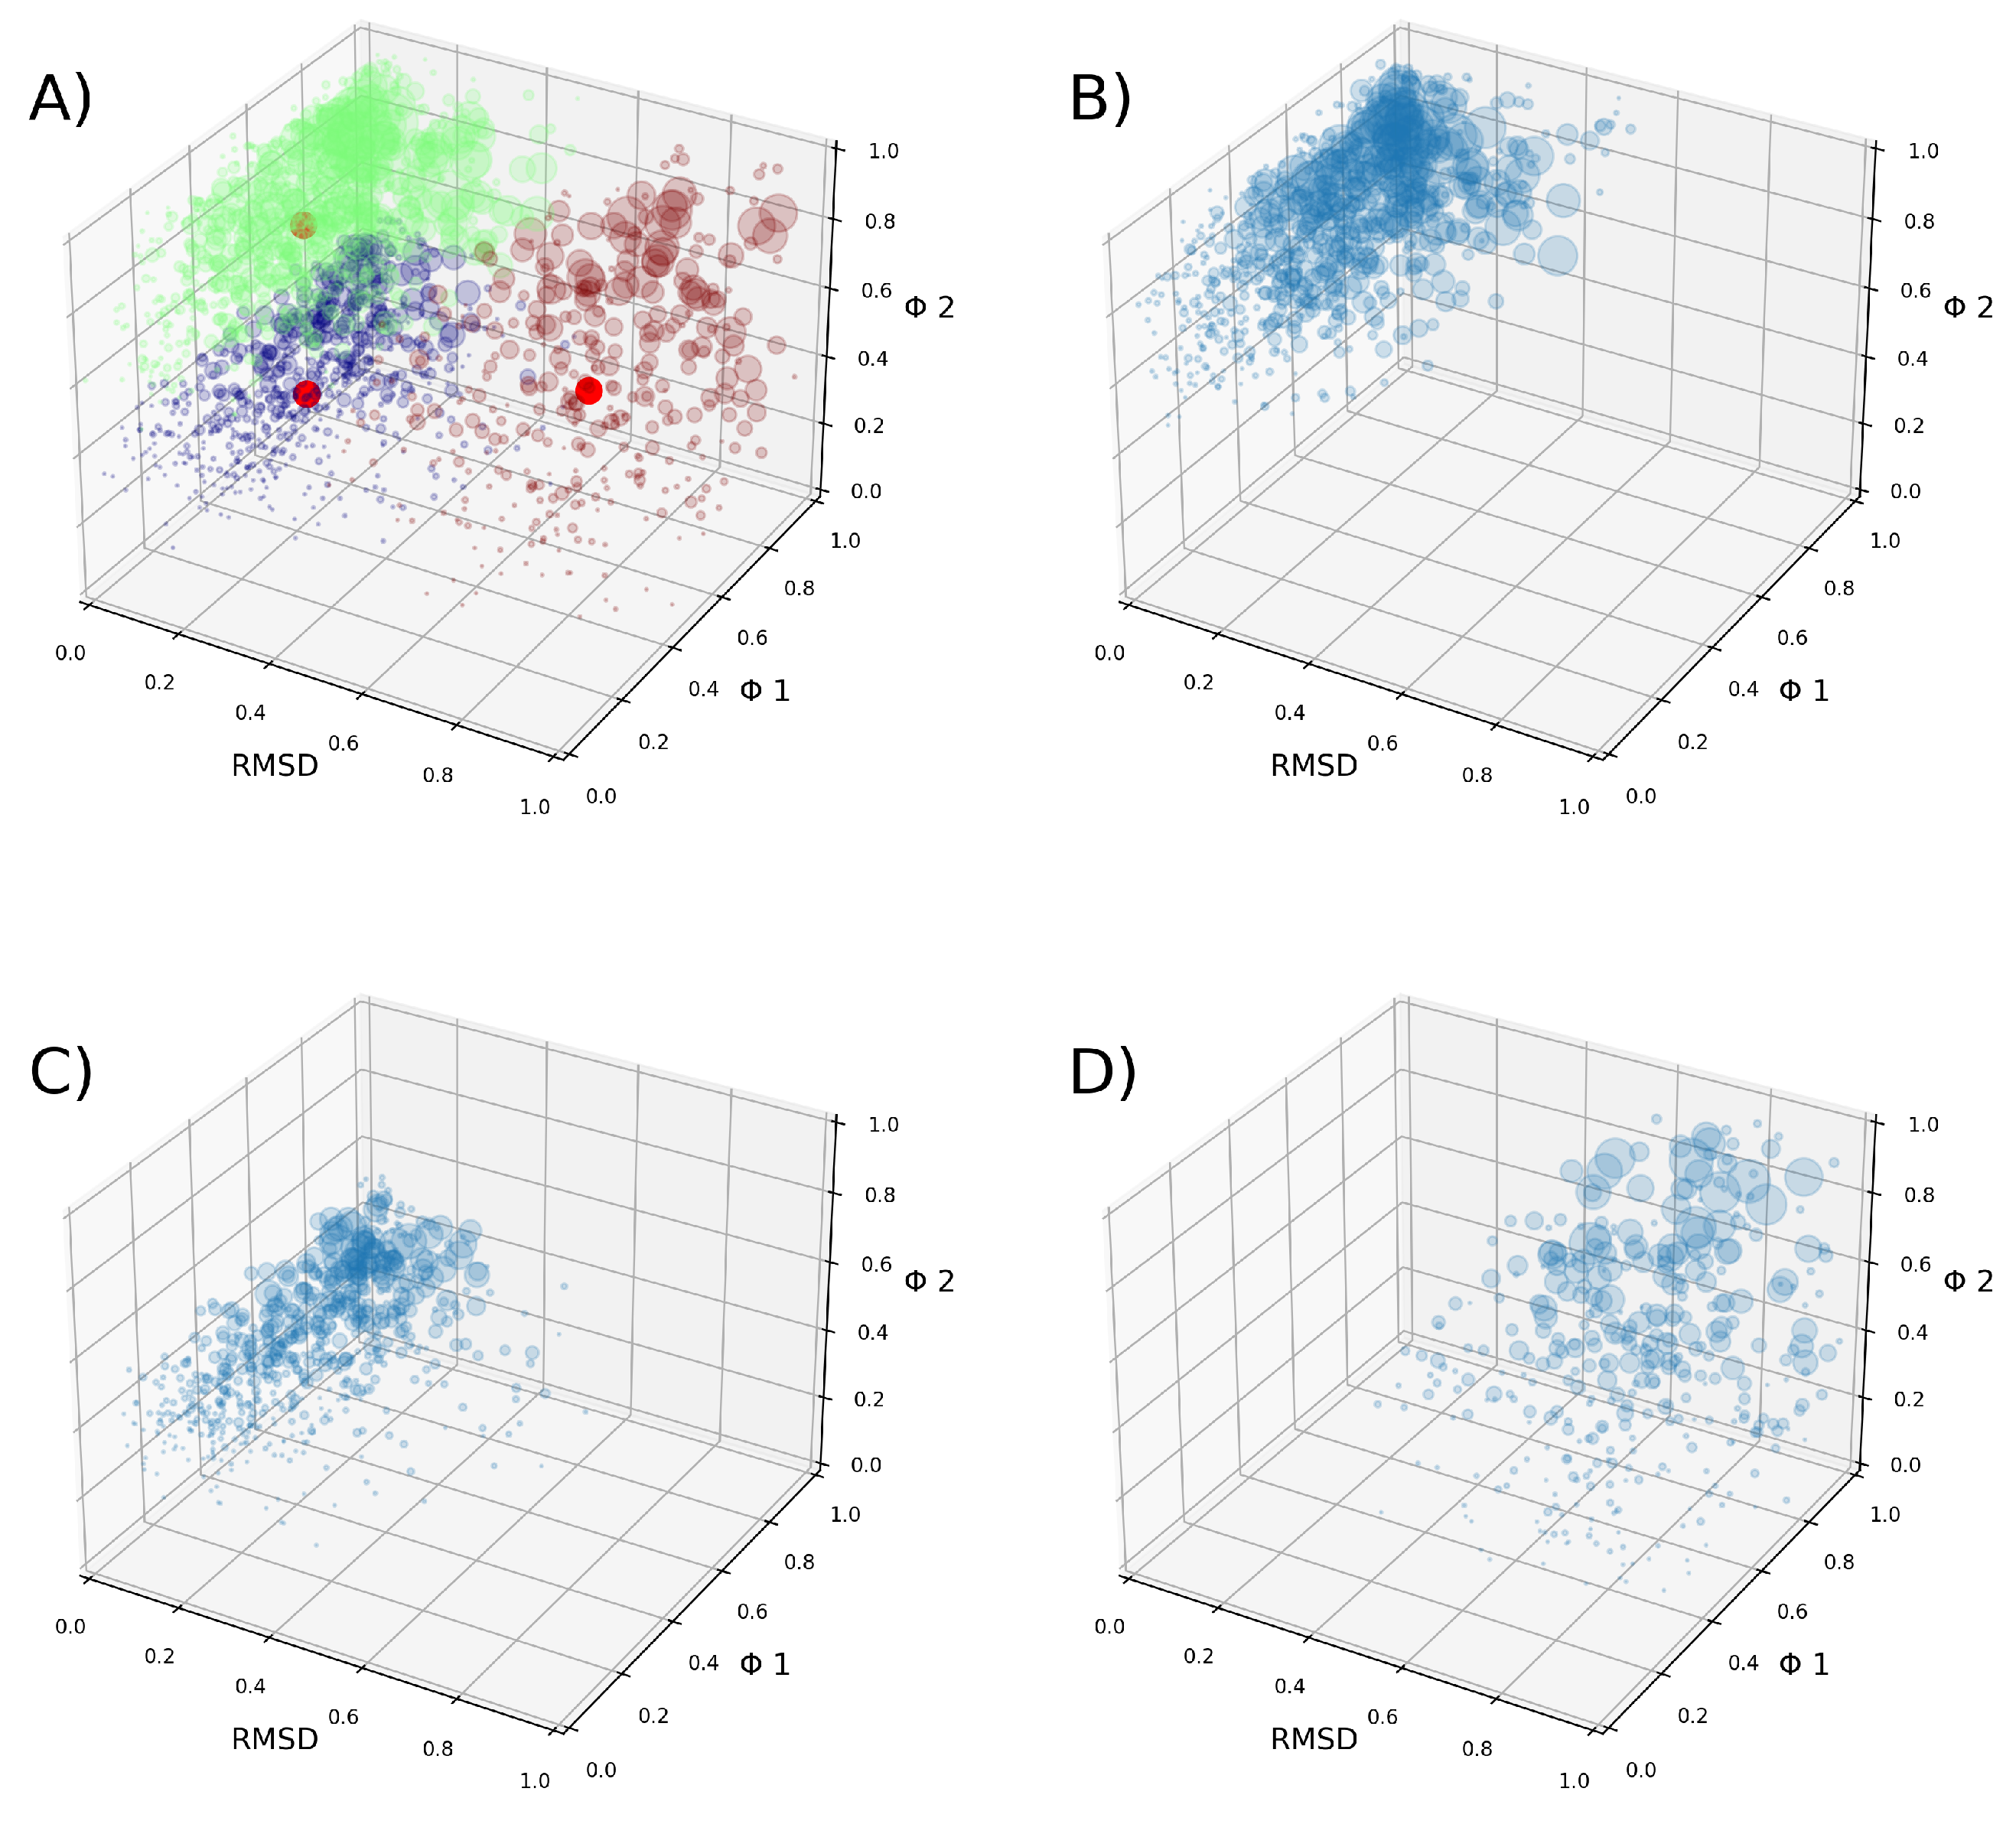
Figure 8.
Density profiles for each cluster considering the RMSD and the FNC (). Darker colours indicate denser regions.
Figure 8.
Density profiles for each cluster considering the RMSD and the FNC (). Darker colours indicate denser regions.
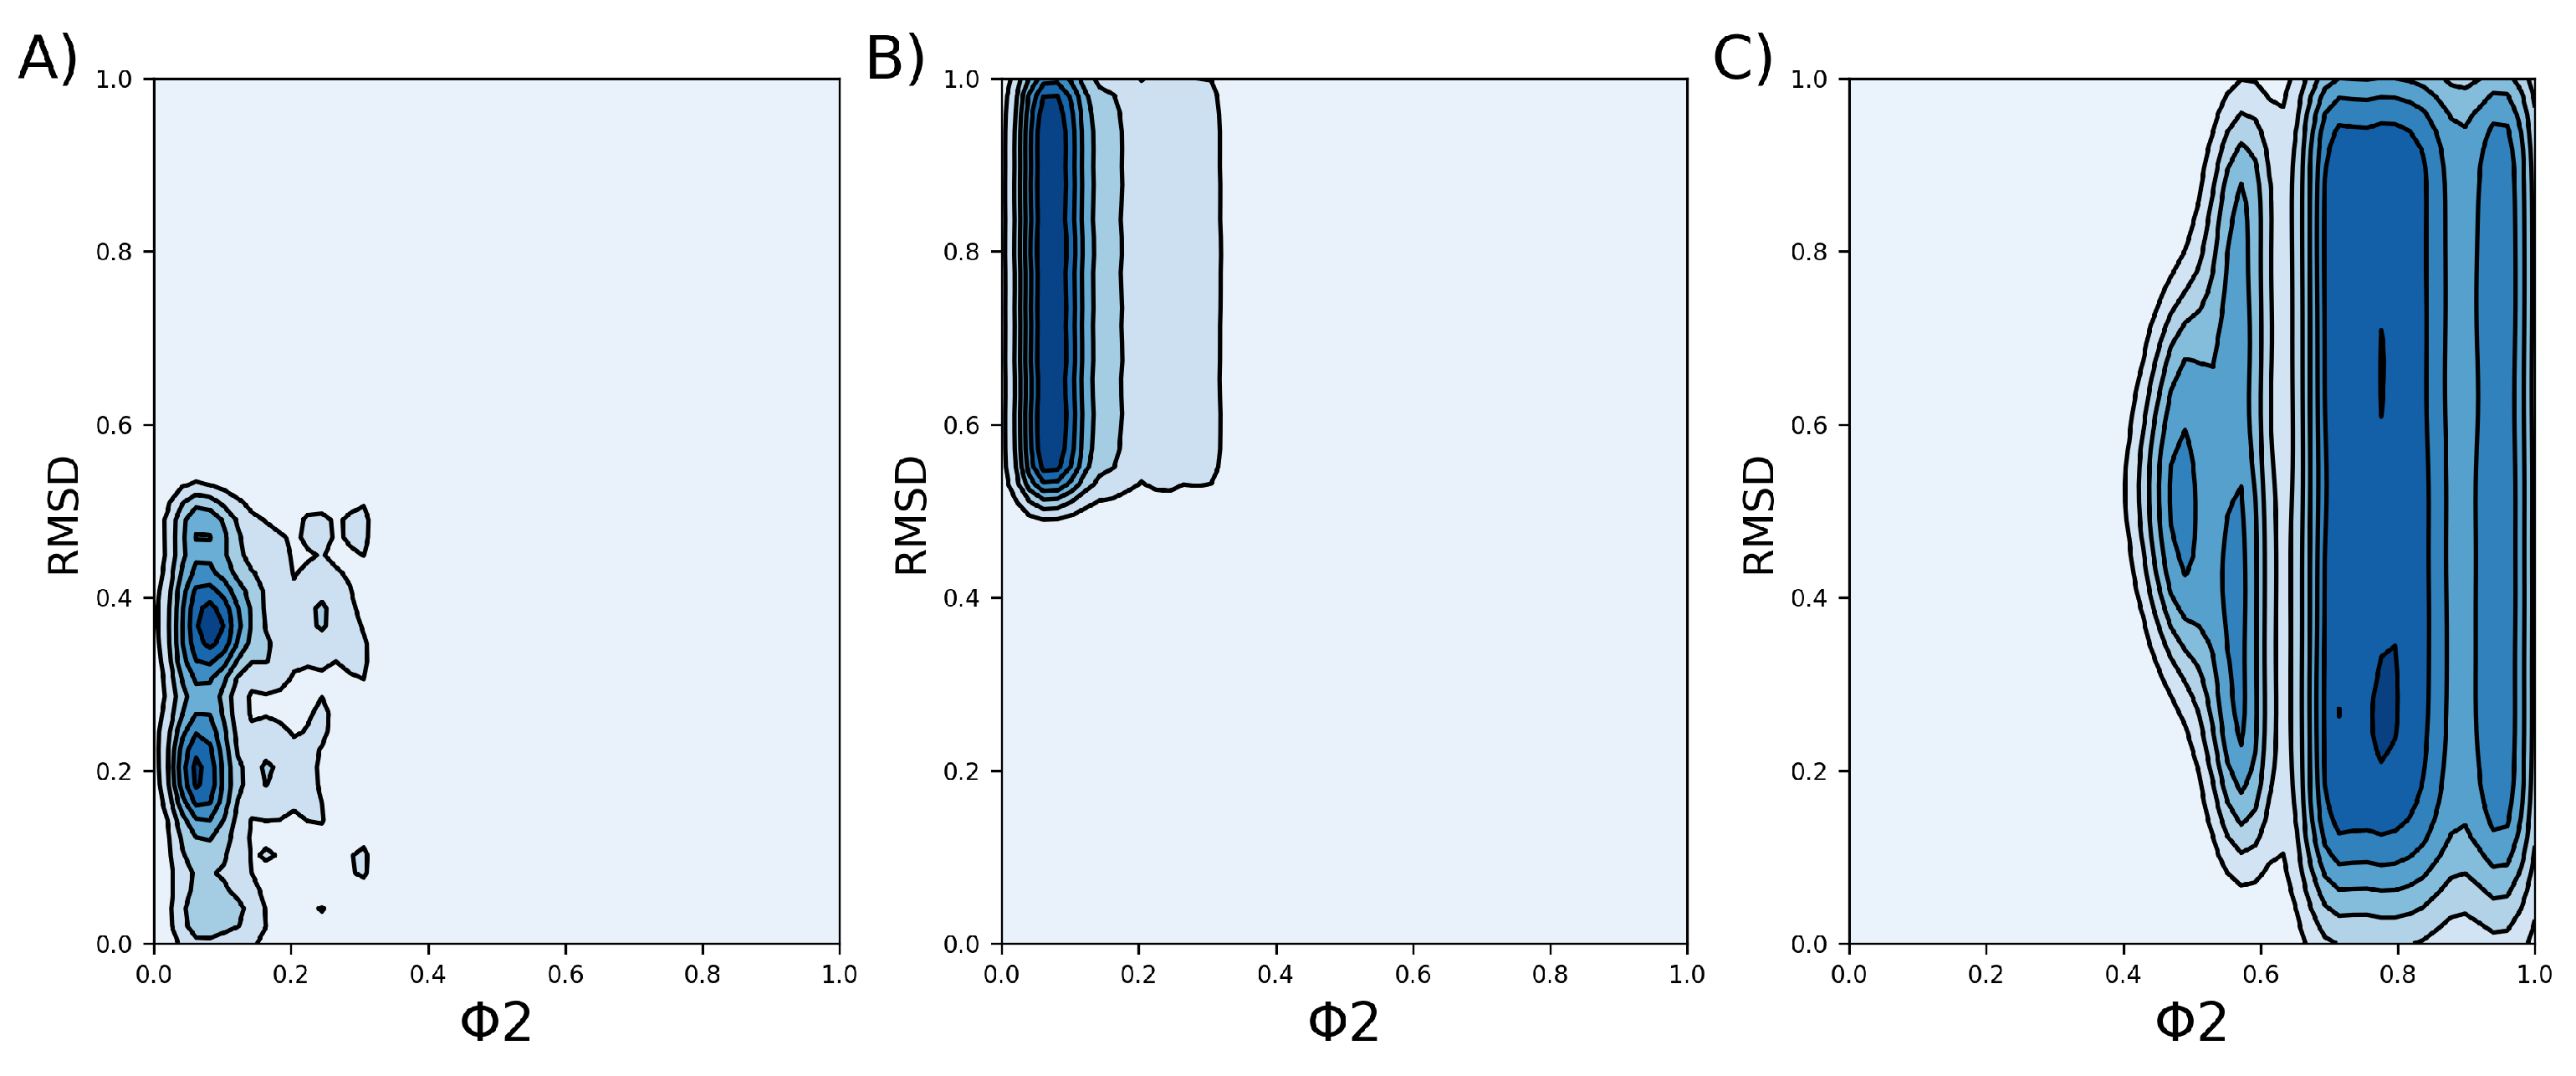
Figure 9.
Representation of the structure of VSDs more representative of each cluster. A) VSD in new-cartoon of cluster 1 view above the x-y plane. B) VSD in new-cartoon of cluster 1 view above the z-y plane. C) VSD in new-cartoon and water in van der waals spheres. D) VSD in new-cartoon of cluster 2 view above the x-y plane. E) VSD in new-cartoon of cluster 2 view above the z-y plane. F) VSD in new-cartoon of cluster 2 and water in van der waals spheres. G) VSD in new-cartoon of cluster 3 view above the x-y plane. H) VSD in new-cartoon of cluster 3 view above the z-y plane. I) VSD of cluster 3 and water in van der waals spheres.
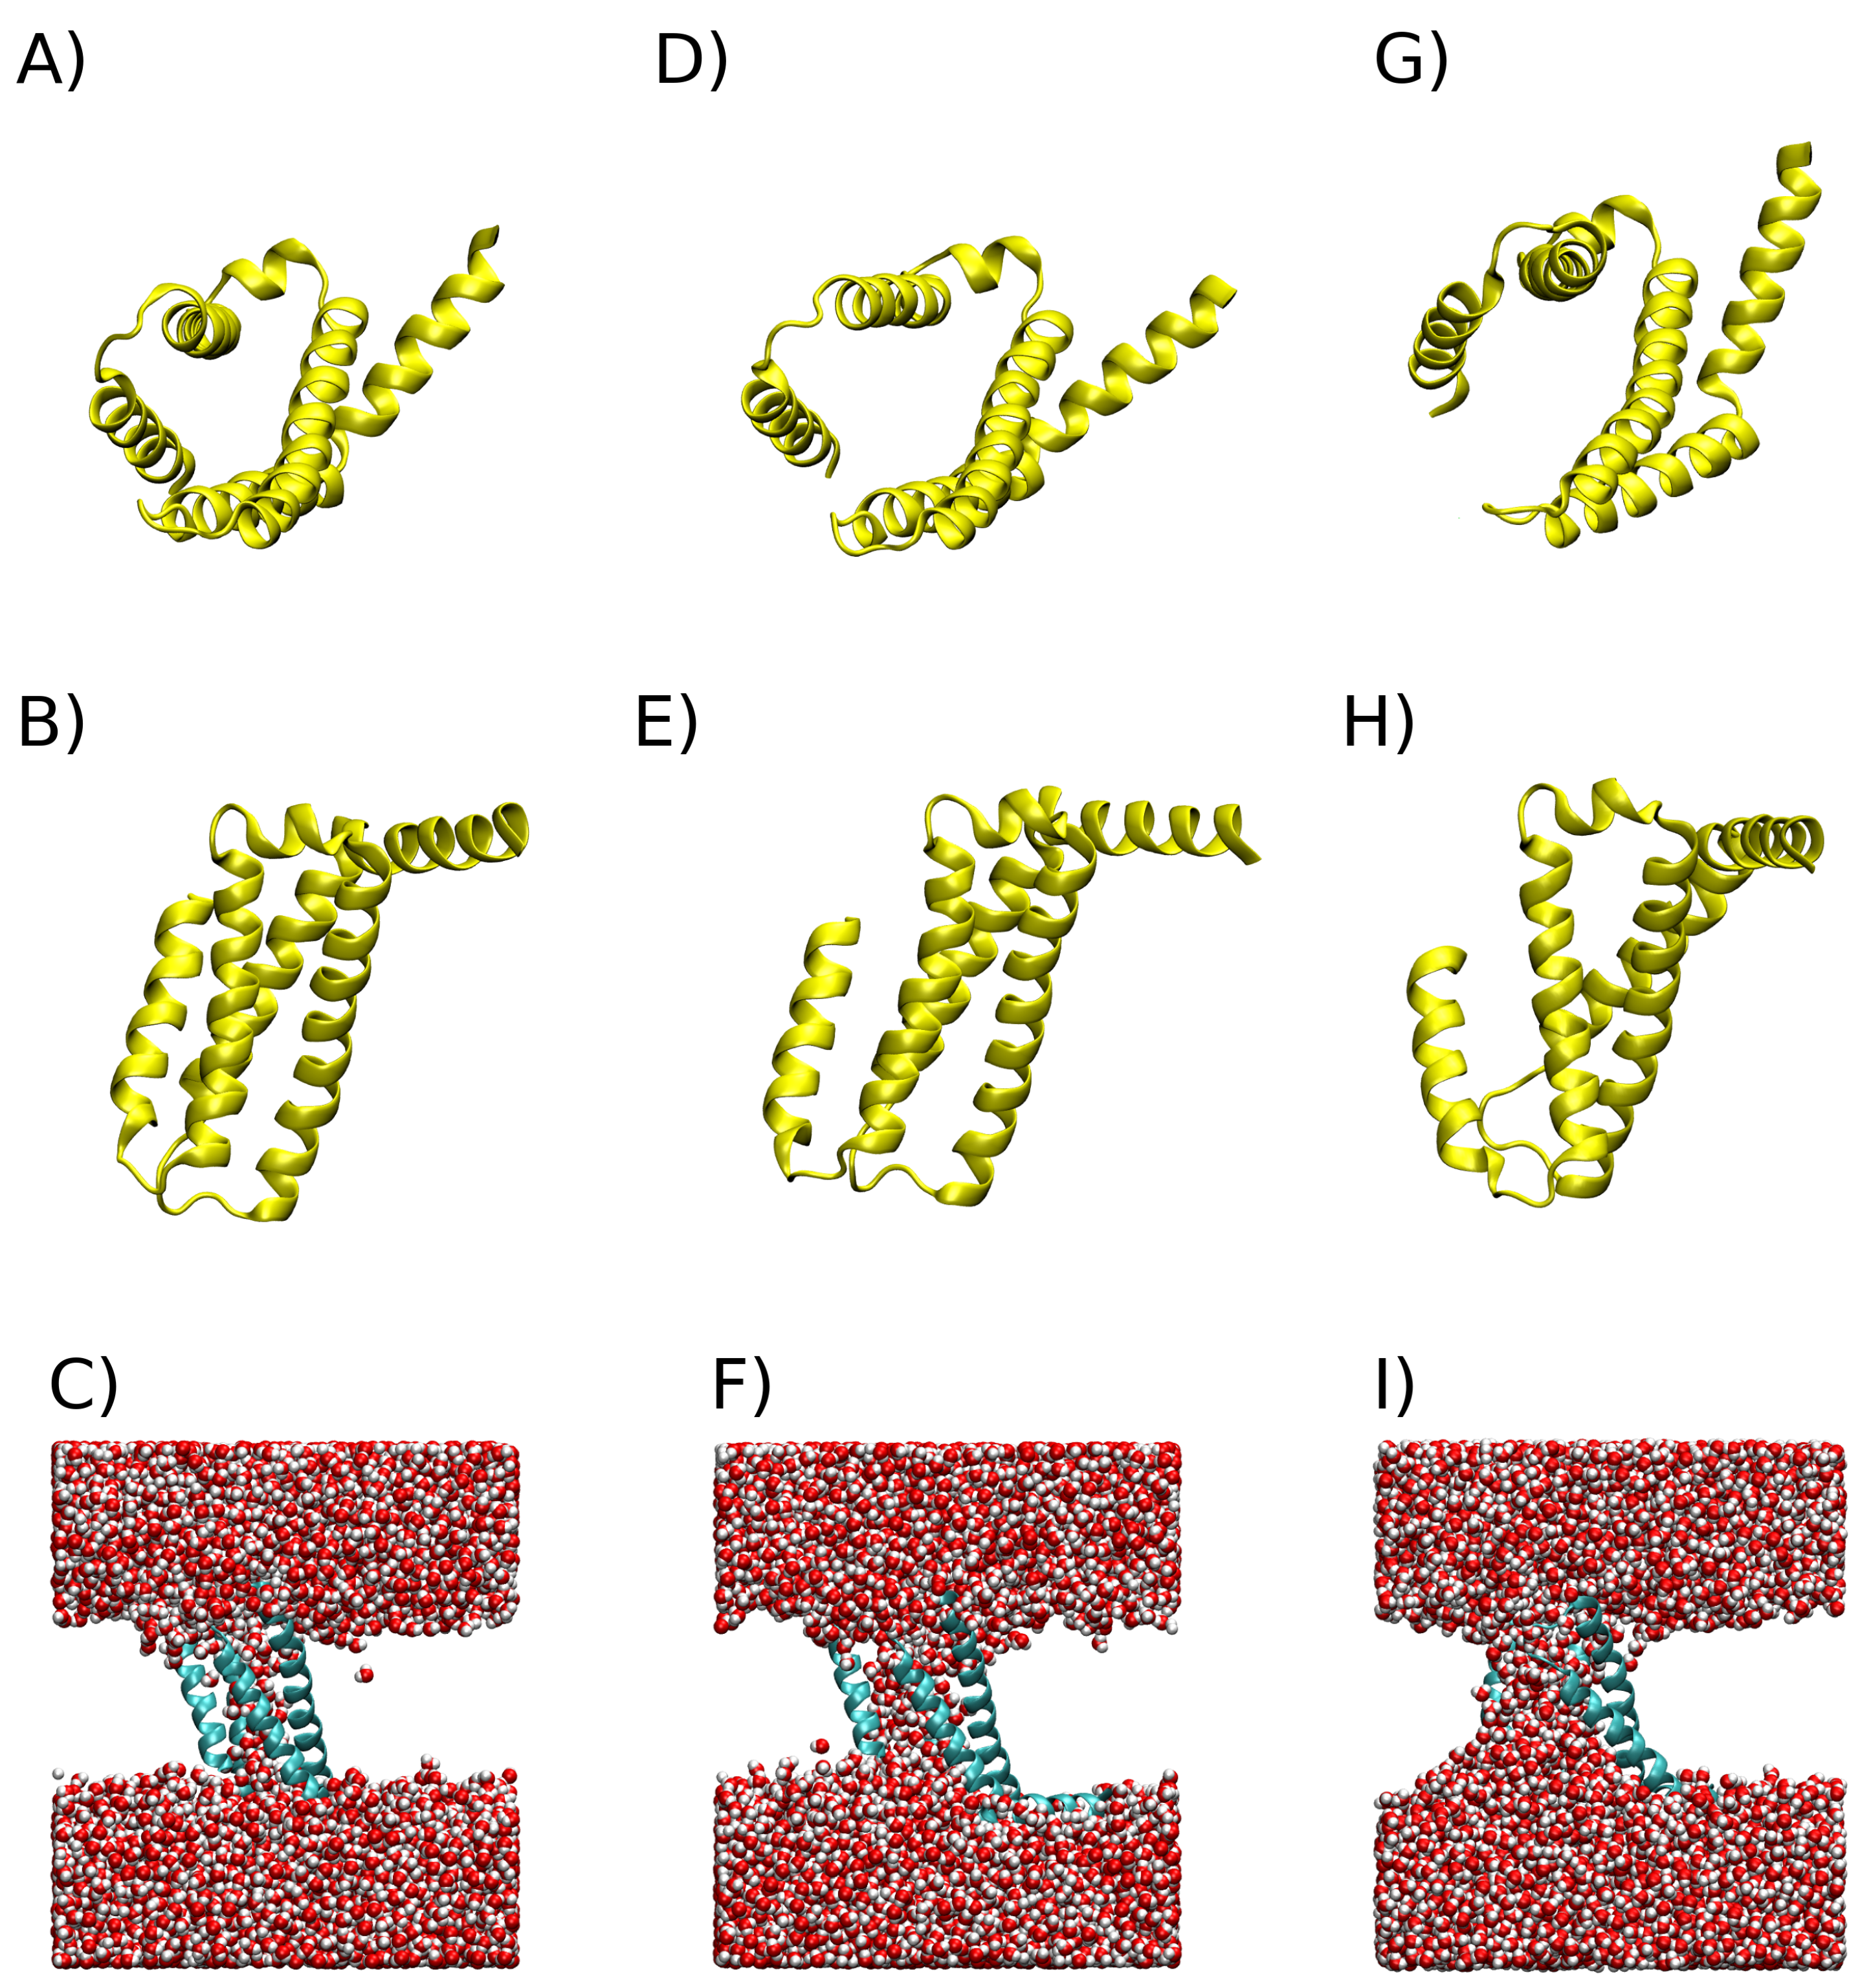

Table 1.
Free energy values between clusters.
| Clusters | (J/mol) |
|---|---|
| 1-2 | -80.5 |
| 1-3 | -1,760.2 |
| 2-3 | -1,679.7 |
Disclaimer/Publisher’s Note: The statements, opinions and data contained in all publications are solely those of the individual author(s) and contributor(s) and not of MDPI and/or the editor(s). MDPI and/or the editor(s) disclaim responsibility for any injury to people or property resulting from any ideas, methods, instructions or products referred to in the content. |
© 2023 by the authors. Licensee MDPI, Basel, Switzerland. This article is an open access article distributed under the terms and conditions of the Creative Commons Attribution (CC BY) license (http://creativecommons.org/licenses/by/4.0/).
Copyright: This open access article is published under a Creative Commons CC BY 4.0 license, which permit the free download, distribution, and reuse, provided that the author and preprint are cited in any reuse.


