
Submitted:
28 April 2023
Posted:
29 April 2023
You are already at the latest version
Abstract
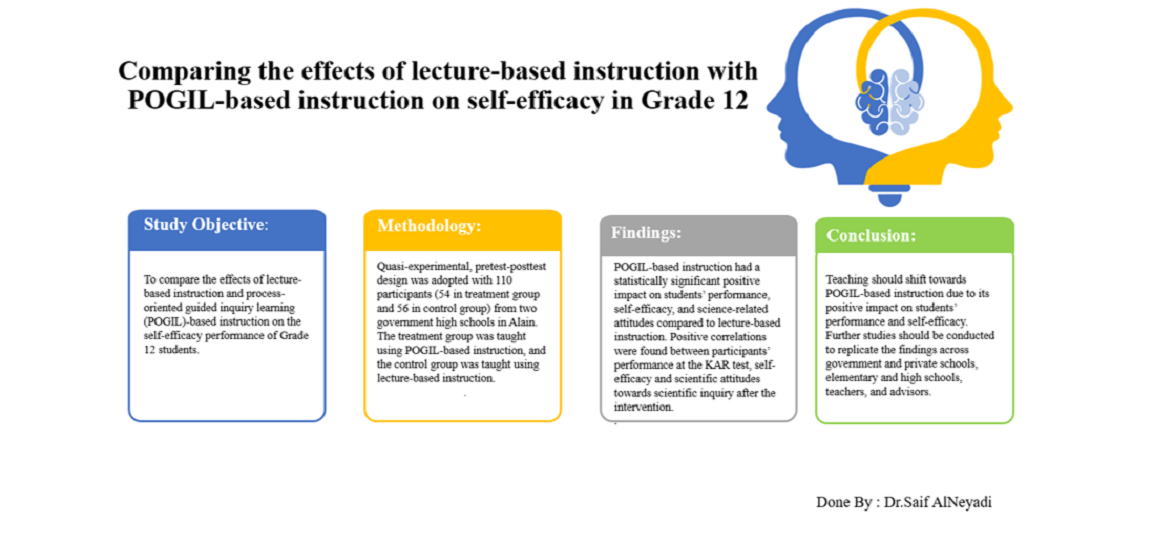
This study compares the effects of lecture-based instruction and process-oriented guided inquiry learning (POGIL)-based instruction on the self-efficacy performance of Grade 12 students. A quasi-experimental, pretest-posttest design was adopted to investigate and assess the impact of POGIL-based instruction versus lecture-based instruction on students’ performance as measured by three types of cognitive outcomes; Knowing, Applying and Reasoning (KAR). Two government high schools in Alain were selected as research sites, one for the boys and one for the girls. The total number of participants was approximately 110 students (N=110); 54 were assigned to treatment groups (25 girls and 29 boys), and 56 were assigned to control groups (27 girls and 29 boys). The treatment group was taught a circular motion unit in physics using POGIL-based instruction, while the control group was taught the unit using lecture-based instruction. The study's findings showed statistically significant differences between students of the control group and the treatment group in favour of the latter regarding their science performance, self-efficacy and science-related attitudes. Moreover, positive correlations were found between participants’ performance at the KAR test, self-efficacy and scientific attitudes towards scientific inquiry after the intervention. In conclusion, it is recommended to shift teaching towards POGIL-based instruction due to its positive impact on students’ performance and self-efficacy. It is also suggested to replicate the study to include government and private schools, elementary and high schools, teachers and advisors.
Keywords:
POGIL-based instruction
; lecture-based instruction
; the unit of circular motion
; science performance self-efficacy
Introduction
Many studies in Science, technology, engineering, and mathematics (STEM) education have examined how first-year college students suffer
in their initial courses. Due to various cognitive, intellectual, and social-psychological issues, students may suffer for various reasons (Frey et al., 2020). Students have long-standing problems applying chemical knowledge to microscopic, macroscopic, and symbolic forms; numerous studies have noted these problems and sought to offer alternatives (Talanquer, 2022). Perhaps every academic program or discipline shares the same educational goal of helping pupils develop their critical thinking and problem-solving abilities. Employing teaching and learning methodologies that engage
students and support the development of application, analysis, and evaluation process skills is essential to reaching this goal (Idul and Caro, 2022). Most instructional tactics used in Science and math are passive, which disengages students and contributes to Science's "leaky pipeline"(De Loof et al., 2022). The significant time required to prepare materials, the reluctance to cut back on the amount of material covered, and the belief that students are unwilling to participate in or prepare for these types of classroom activities are among the reasons science faculty members give for their resistance to adopt active-learning strategies. In response, the field of STEM education research has investigated numerous strategies supported by the data(Frey et al., 2020). Studies have evaluated interventions and looked at how they affected a class's overall performance, and more recently, the focus has expanded to include student subgroups inside a class(Young et al., 2022). Several researchers have examined how affective traits and social identity affect exam performance and class retention(Easterbrook and Hadden, 2021). Even other studies have looked at how students approach problems and whether they comprehend the ideas behind them or only use algorithms to solve them (Knight et al., 2015)
Science education, in general, and physics, in particular,
have tremendous contributions to the technological and digital advancement that
serves humanity (Haleem et al., 2022). Yet, in many countries, judging from
the results of international exams like the Program for International Student Assessment
(PISA), learners performed low in Science, including physics. For this research,
in the UAE, for example, the results in physics are not where they should be (Hassan
Al Marzouqi et al., 2019). Other researchers suggest that, for students,
physics is considered the most challenging area of learning within the field of
Science, and it usually magnetizes fewer students compared to other science-related
subjects from secondary school to university (Kaleva et al., 2019). Generally,
according to these authors, students tend to have a negative attitude towards physics,
presumably because they lack interest in the subject and the syllabus itself. To
make up for these negative attitudes, Asem and colleagues, in their review, argued
that “These motivate educators to use a variety of strategies to put student’s performance
in physics on a pedestal (Assem et al., 2023). Also, to address the demand
to produce learners who knew not only how to write, read and do arithmetic but learners
who can perform process skills”,
In this paper, we examined students’ differences in
concept building as potentially one key factor in explaining student struggles and
differing outcomes of otherwise similar students. We did so with two approaches.
First, we investigated the impact of POGIL-based instruction on student performance
as measured by three types of cognitive outcomes, namely: knowing, applying and
reasoning (KAR). We then extended our understanding of this concept- determine the
impacts of POGIL-based instruction on students' self-efficacy as measured by the
variable of physics learning, understanding of physics, and the willingness to learn
it in their future careers. Although the team experience of students has not received
much attention in physics, previous research has looked at characteristics that
affect student results in physics. Self-efficacy, which has repeatedly been demonstrated
to be a critical construct that predicts student success in physics, particularly
problem-solving, is one of the factors. Bandura first defined self-efficacy as the
conviction that one can "successfully execute the behaviour required to produce
the outcomes" (Bandura, 1977). Bandura also made the case that one's self-efficacy
beliefs influence how much effort one will put into a task and how long one will
persevere in the face of setbacks.
According to research, self-efficacy is a significant
predictor of student performance in STEM education, even when other factors (such
as prior academic experience, success indicators, behavioral traits, self-esteem,
learning styles, and learning strategies) are considered. While self-efficacy is
the most significant predictor of performance, Lishinski and colleagues discovered
that it also has a reciprocal effect, where self-efficacy influences performance,
which then influences self-efficacy, which again influences performance (Sakellariou
and Fang, 2021). We also intended to investigate how students' views of collaborative
learning in teams and their actual learning were related to their sense of self-efficacy.
Contribution to the Literature
The present study fills a gap in the literature regarding
the main learning difficulties and alternative conceptions of pre-service teachers
concerning the digestive system.
- First, of its kind in the UAE, the present study is vital in understanding the benefits of inquiry-based approaches to learning.
- This research study represents a deep investigation of the theoretical frameworks of the POGIL in teaching Science in particular. Such strategies are vital in ensuring learners exploit their abilities in areas like knowing, applying and reasoning in an implicit manner that guides their acquisition of the recommended skills and competencies.
- As shown, such competencies are attained due to the determination of the impact of POGIL-based instruction on improving self-efficacy in physics. The data collected for this study is hoped to guide the field practices in science teaching and learning.
Literature Review
POGIL is a strategy and a philosophy for learning and
teaching. It is a strategy since it provides a specific methodology and procedural
structure that are constant with the method students learn and that lead to the
desired learning outcomes. It is also a philosophy as it involves specific ideas
about the nature of the learning process and the expected learning outcomes (Brown,
2010). Based on social constructivist learning theory, POGIL is a student-centred
teaching method science educators developed in the 1990s. Here, learners develop
their conceptual understanding collaboratively and work in groups on carefully designed
learning cycle activities (Le et al., 2018).
Soltis and his group argue that it helps students construct
their scientific understanding based on their prior knowledge, experiences, skills,
attitudes, beliefs and self-efficacy(Soltis et al., 2015). The students,
Soltis and colleagues explain, also experience a learning cycle of exploration,
concept formation, and application. Besides, students using the POGIL module connect
and visualize concepts and multiple representations and discuss and interact with
one another.
To shed some light on the roles of the POGIL group,
the manager ensures that the members are doing their roles, achieving the
tasks on time, and all members are participating in the activities and understanding
the concepts. The recorder reports the discussions and essential aspects
of the group’s observations, insights and the significant concepts learnt. The “presenter”
provides oral reports to the class. The “reflector” observes group dynamics,
behaviour and performance and may report to the group (or the class) about how well
the group operates (Hu and Shepherd, 2013). The POGIL activities emphasize core
concepts and encourage a deep understanding of the course materials through an exploration
to construct understanding while developing higher thinking skills. Here, Trevathan
and Myers explain that learning is achieved through fun exercises that prove effective
to students with the benefits of shared information and collaborative learning(Trevathan,
Jarrod, and Myers, 2013).
A study by Walker and Warfa established that students
that taught using a POGIL-based instructional strategy registered higher levels
of achievement and developed positive attitudes towards using the approach(Walker
and Warfa, 2017). On the other hand, Lin and Tsai established that using the POGIL-based
instructional approach enhanced the ability of the students to perfect their learning
capabilities compared to other approaches(Lin and Tsai, 2013). Further, Wozniak
found that using POGIL was instrumental in identifying the different conceptions
by students and facilitated their ability to change or alter such conceptions(Wozniak,
2012). However, a study by Barthlow contrasts these findings as the study found
that the learners that taught using POGIL did not have any different or alternative
conceptions compared to the learners that have been taught using the traditional
forms of instruction. In sum, one has to keep an open mind when analyzing later
in the research study and be cautious with the conclusions one reaches(Barthlow
and Watson, 2014).
Deora and colleagues conducted research in the U.S.
to examine the impact of the flipped classroom and POGIL methods on the chemistry
of college students (Nipa Deora, Nathalie Rivera, Sheila Sarkar, Marcos Betancourt,
2020). The results revealed positive trends favouring POGIL students. Unlike Barthlow’s
study, however, no significant differences were found between students’ overall
grades learnt by POGIL and their counterpart students learnt by traditional instruction.
However, there was an increase in passing grades(Barthlow and Watson, 2014).
Self-efficacy is the learners’ belief in their ability
to accomplish tasks in specific situations, that is, their competencies to organize
and complete courses of action required to achieve selected types of performances(Artino
Jr., 2012). Since self-efficacy is confidence in one’s ability to perform, which
will be reflected in students' actions. Students with high self-efficacy for performing
a specific task will have high expectations towards performing it and are likely
to succeed, for example, in Science at school and choose majors that align with
their self-belief about personal competencies and abilities (Kaleva et al.,
2019).
Situated within the social cognitive theory, self-efficacy
indicates behaviour can be best understood in terms of a reciprocal system, including
reasoning, behaviour and context. This reciprocal system, Lin explains, refers to
the perceived ability to carry out the task, behaviour, performance, and environment
setting(Lin, 2009). Within this reciprocal system, moreover, self-efficacy becomes
a vital construct for learners to monitor their performance as it attracts their
attention to beliefs about the effectiveness of their learning methods (Anam and
Stracke, 2016).
Examining students' attitudes toward using POGIL in
teaching physics is essential, and this can help us better understand the impact
of POGIL on students’ attitudes and science learning achievement. For this study
and the subsequent discussion, by attitude towards Science, I am referring to “the
feelings, beliefs, and values held about an object that may be the enterprise of
science, school science, the impact of science on society or scientists themselves.”
(Osborne et al., 2003).
Though the previous studies have not tackled POGIL directly,
they shed light on the relationships between students’ attitudes and their science
learning that might be done through POGIL or any other methods or models of inquiry.
These conclusions are highly relevant and essential to this study. The same relevance
can be seen in the studies discussed in the following paragraphs(Vishnumolakala
et al., 2017).
In the Philippines, a quantitative study was conducted
by Guido to analyze and evaluate the relationship between engineering and technology
students’ attitudes and motivations towards learning physics. The study's results
found no significant difference in the attitude and motivation of students towards
learning physics. Furthermore, most students participating in the study felt good
when they were successful in physics (Guido, 2013). The students thought that their
success was due to the simple and practical method of teaching used by teachers,
which enhanced their attitude towards physics learning. The participants also enjoyed
studying physics since they could see its utility in everyday life.
Despite the prevalence of studies that are based on
the efficacy of the use of constructivist methodologies in teaching students, a
gap exists in the literature due to the lack of studies that involve high school
students in the use of inquiry-based instruction, especially the use of approaches
such as POGIL in the UAE context (Daubenmire et al., 2015). An instrument-based
survey conducted in the UAE by Tairab and Al-Naqbi that evaluated the effectiveness
of constructivist pedagogical strategies established unanimity between students
and teachers that most curriculum materials require inquiry-based instructional
strategies to enhance effectiveness (Tairab and Al-Naqbi, 2017). A study by Al-Naqbi
showed significant differences in high school students' perceptions of chemistry
as a subject, chemistry research and jobs related to chemistry. In the self-efficacy
scale, the main differences amongst the students were found in their performance,
scores, and the percentiles of the secondary schools. However, regarding gender,
nationality and matriculation, there were no significant or notable differences
among the students on the self-efficacy scale(Al-Naqbi and Alshannag, 2018). Another
quasi-experimental study was carried out by Qureshi and Visnumolakala to explore
Qatari Foundation first-year students’ understanding of chemistry concepts in a
POGIL context (Qureshi et al., 2017). The study's results found positive
effects of POGIL on students’ understanding of chemistry concepts. The authors thus
concluded that student-centred pedagogical practices like POGIL enhanced students’
understanding of the field of Science.
Methodology
Research Design
The study adopted a cause-effect, pretest-post-test
design. This design is used to study the impact of POGIL-based instruction for physics
subject students on their performance and self-efficacy. The concert was demonstrated
by three outcomes, namely “Knowing”, “Applying”, and “Reasoning”. Self-efficacy
is described by three outcomes, expressly” physics learning”, “understanding of
physics”, and “the willingness”. Scientific attitudes showed by three outcomes,
particularly “Scientific inquiry”, “Enjoyment”, and “Career interest”. One of the
attributes of the design adopted for the study is that it allowed this researcher
to manipulate self-efficacy as an independent variable. This design is the best
approach to evaluating the forms of causality that will be evident among the variables
in the study. Such design, Creswell (2012) explains further, is the most beneficial
method in education since little interference occurs. It is also appropriate to
the nature of the study that compares pre- and post-intervention, including the study’s dependent variables.
Data collection
Students were invited to participate in the study and
signed consent forms during the first week of the semester. Students completed the
teamwork perceptions and self-efficacy survey towards the end of the semester. To
ensure student confidentiality and the validity of the data, they were provided
with an anonymous link to the survey and informed that the instructor would not
have access to the data.
Self-efficacy
To gauge students' self-efficacy in physics, we modified
the self-efficacy sub-scale from the Motivated Strategies for Learning Questionnaire
(MSLQ) (Pintrich et al., 1993). Cronbach's alpha was used to evaluate the
sub-scale reliability ( = 0.96, indicating that the items' internal consistency
was good).
Results
The results presented in Table 1 display the test scores of (KAR) in the
pretest in the control group taught by the lecturing-based instruction method and
the experimental group taught by POGIL-based instruction.
Table 1 (above)
and Figure 1 showed that participants’ Applying
abilities were the highest in both groups (Control Group M = 5.63, SD = 1.46) and
(Experimental Group M=5.98, SD =1.84), followed by their Knowing abilities (Control
Group M = 3.93 and SD =1.10) and (Experimental Group M= 4.02, SD =1.21). However,
participants’ Reasoning abilities were reported to be the lowest in both groups
(Control Group M= 3.66, SD = 1.07) and (Experimental Group M= 3.89, SD =1.18). In
the total score of the cognitive outcomes Test (KAR), participants scored higher
in the experimental group (M= 13.91, SD =2.33) than in the control group (M= 13.23,
SD = 2.00).
A T-test for Equality of Means for independent samples
was conducted to find if there were statistically significant differences between
the mean scores of the pretest measured in this study in the circular motion unit
in the physics curriculum of grade 12 in both control and experimental groups before
the intervention. The results of the T-test showed that there were no statistically
significant differences between the control group (M =3.93, SD = 1.10) and experimental
group (M = 4.02, SD =1.21) about students’ knowing abilities (), which indicated that the performance of the students
in the pretest of knowing was the same.
In addition, no statistically significant difference
was found between the control group (M =5.63, SD = 1.46) and experimental group
(M =5.98, SD =1.84) about students’ applying abilities (), which indicated that the performance of the students
in the pretest of applying abilities was the same. Moreover, no statistically significant
difference was shown between the control group (M = 3.66, SD = 1.07) and experimental
group (M= 3.89, SD =1.18) regarding students’ reasoning abilities (), which indicated that the performance of the students
in the pretest of reasoning abilities was the same.
Overall, no statistically significant difference was
found between the control group (M = 13.23, SD = 2.00) and experimental group (M
= 13.91, SD =2.33) regarding student performance in the total score of the cognitive
outcomes Test of (KAR) since (), which indicated that the
performance of the students in the pretest of KAR was the same. The same results
were obtained after using the Bonferroni adjusted significance criterion of the
p-value 0.05. The adjusted p-value was = 0.0125 (.05/4) since four tests
were conducted. As Huck (2011) showed, Bonferroni adjusted the significance criterion
of the p-value can be obtained by “dividing the desired Type I error risk for the
full study by the number of times the hypothesis testing procedure will be used”.
As presented in Table 2, the participants’ applying ability for the control group was the highest
(M = 5.84, SD = 1.35), followed by their reasoning ability (M = 3.96, SD =1.39).
However, participants’ knowing ability was reported as the lowest (M= 3.64, SD =
1.10). In the total score of the cognitive outcomes of (the KAR) test, participants
scored a mean of 13.45 (SD = 2.00). To deduct whether there were statistically significant
differences between the means of the scores of the Knowing, Applying and Reasoning,
and overall (KAR) in the pretest and post-test for the control group, the researcher
ran Paired sample T- test for related samples. Results of Paired sample T-test indicated
no significant difference in means of the students’knowing scores in the pretest and post-test
for the control group (). No significant
difference was shown in means of the students’ applying scores (, and no significant
difference was shown in means of the students’ Reasoning scores (.
Overall, no significant difference in means of total scores
of the Cognitive Outcomes of the (KAR) in the pretest and post-test for the control
group (. We can conclude that the student's performance in the cognitive
outcomes of the (KAR) in the pretest and post-test for the control group was the
same. The same results were obtained after using the Bonferroni adjusted significance
criterion of the p-value 0.05. The adjusted p-value was = 0.0125 (.05/4)
since four tests were conducted.
Table 3 above
and Figure 2 showed that participants’ reasoning
ability was the highest in the experimental group (M = 8.83, SD = 1.41). Applying
ability came with a mean of 7.70 (SD=2.13), while participants’ knowing ability
was the lowest (M = 5.17, SD = 0.88). Concerning the control group, participants’
applying ability was the highest (M = 5.84, SD = 1.35). Reasoning ability came with
a mean of 3.96 (SD=1.39), while participants’ knowing ability was the lowest in
the control group (M = 3.64, SD = 1.10). In the total score of the cognitive outcomes
Test (KAR), participants scored higher in the experimental group (M= 21.70, SD =2.96)
than in the control group (M= 13.45, SD = 2.00). Independent Samples T-test was
conducted to find if there were tatistically significant differences between the mean scores
of the post-test measured in this study in the circular motion unit in the physics
curriculum of grade 12 in both control and experimental groups after the intervention.
The results of T- the test for independent samples showed
that statistically, there was a highly significant difference between the control
group and experimental group regarding students’ knowing abilities in favour of
the experimental group (, which indicated that the students in the experimental
group were more likely had a high knowing performance after the intervention, comparing
to control group. In addition, statistically, there was a highly significant difference
found between the control group and experimental group regarding students’ applying
abilities in favour of the experimental group (, which indicated that the students in the experimental
group were more likely to had a high applying performance in applying after the
intervention, comparing to control group.
The results of the t-test test for independent samples
showed that statistically, there was a highly significant difference between the
control group and experimental group regarding students’ reasoning abilities in
favour of the experimental group (, which indicated that the students in the experimental
group were more likely to had a high reasoning performance reasoning after the intervention,
comparing to control group.
Statistically, there was a highly significant difference
found between the control group and experimental group regarding student performance
in the total score of the cognitive outcomes of (the KAR) Test ( in favour of the experimental group. We can conclude
that the students in the experimental group were more likely to have a high performance
in the overall KAR after the intervention compared to the control group. The same
results were obtained after using the Bonferroni adjusted significance criterion
of the p-value 0.05. The adjusted p-value was = 0.0125 (.05/4) since four
tests were conducted.
The results in Table 4 display the Paired Sample T-test for related samples of the scores of three subscales of (the KAR) test in the pretest and post-test for the experimental group
taught by POGIL-based instruction. The results indicated that there was a highly
significant difference in means of the scores of knowing in favour of post-test
(. The mean knowledge scores
for students in the post-test were higher than that observed in the pretest. Students
in the experimental group were more likely to have high performance in knowing after
the intervention, compared with their scores in the pretest. In addition, there was a highly significant difference in means
of the scores of applying in favour of post-test (. The mean scores of applying
students in the post-test were higher than that observed in the pretest. Students
in the experimental group were more likely to have high performance in applying
after the intervention, compared with their scores in the pretest.
Moreover, there was a highly significant difference
in means of the scores of reasoning in favour of the post-test (. The mean reasoning scores for students in the post-test
were higher than that observed in the pretest. Students in the experimental group
were more likely to have high performance in reasoning after the intervention, compared
with their scores in the pretest. Overall, there was a highly significant difference
in means of the total scores of (KAR) in favour of the post-test (. The mean scores of KAR for students after the intervention
were higher than that observed in the pretest. Students in the experimental group
were more likely to have high performance in the KAR test after the intervention,
compared with their scores in the pretest.
The same results were obtained after using the Bonferroni
adjusted significance criterion of the p-value 0.05. The adjusted p-value
was = 0.0125 (.05/4) since four tests were conducted.
In addition, the researcher
calculated the Effect Size of the POGIL-based instruction for the post-scores
of the experimental group in each subscale of the KAR test.
The Effect size (d) through T-test for related samples
given by
Where Mean difference= Difference between means of pre
and post-tests
SD.diff. = Pooled Standard Deviation
Using the data presented in Table 11, the effect size of the POGIL approach
for knowing scores for the experimental group will be:
The effect size calculated above shows that the percentage
of the POGIL approach for knowing scores for the experimental group is 75%. This
percentage indicates that this tool is effective in elevating knowing ability among
the students in the experimental group by approximately 0.75 level of standard deviation.
Further, Cohen’s effect size value (d = 0.75) suggested a high practical
significance. Likewise, the effect size of the POGIL approach for applying scores
for the experimental group will be:
The effect size calculated above shows that the percentage
of the POGIL approach for applying scores for the experimental group is 50%. This
percentage indicates that this tool is effective in elevating applying ability among
the students in the experimental group by approximately 0.50 level of standard deviation.
Further, Cohen’s effect size value (d = 0.50) suggested a medium practical
significance.
The effect size of the POGIL approach for reasoning scores for the experimental group will be:
The effect size calculated above shows that the percentage
of the POGIL approach for reasoning scores for the experimental group is
298%. This percentage indicates that this tool effectively elevates reasoning ability among the students in the experimental group by approximately 2.98 level
of standard deviation. Further, Cohen’s effect size value (d = 2.98) suggested
a very high practical significance.
In addition, the effect size of the POGIL approach for
overall KAR scores for the experimental group will be:
The effect size calculated above shows that the percentage
of the POGIL approach for overall KAR scores for the experimental group is 190%.
This percentage indicates that this tool is effective in elevating overall KAR ability
among the students in the experimental group by approximately 1.90 level of standard
deviation. Further, Cohen’s effect size value (d = 1.90) suggested a high
practical significance (Figure 3).
The self-efficacy of grade 12 pupils is impacted by POGIL-based instruction instead of lecturing-based instruction.
The students' scores in the self-efficacy survey pretest
were obtained. Then, descriptive statistics such as mean and standard deviation
were used to compare the student’s performance in the two groups (control and experimental)
regarding physics learning, understanding of physics, Willingness to learn physics,
and the total scores
of Self-Efficacies. The data analysis employed a T-test for an independent sample
to determine if there were statistically significant differences between the mean
scores of the two groups. In contrast, T- a test for related samples, was used to
determine if there were statistically significant differences between the mean scores
of the pre-and post-measured in this study in each domain. The results in Table 5 display the test scores of Self-efficacy
subscales in the pretest in the control group taught by the lecturing-based instruction
method and the experimental group taught by POGIL-based instruction.
Table 5 and Figure 4 showed that participants’ performance in
willingness to learn Physics was the highest in both groups (Control group: M =
2.68, SD = 0.61) and (Experimental group: M=2.74, SD =0.59) followed by their Learn
physics abilities (Control group: M = 2.64, SD =0.62) and (Experimental group: M=
2.69, SD =0.54). However, participants’ understanding of Physics abilities reported
the lowest in both groups (Control group: M= 2.57, SD = 0.68) and (Experimental
group: M= 2.70, SD =0.60). In the total scores of the Self-efficacy test, participants
scored higher in the experimental group (M= 8.13, SD =0.99) than in the control
group (M= 7.89, SD = 1.02).
In addition, T-test for independent samples was conducted
to find if there were statistically significant differences between the mean scores
of the pretest measured in this study for the subscales of the Self-Efficacy Survey
for grade 12 students in both control and experimental groups before the intervention.
The results showed that statistically, there were no significant differences between
the control group (M =2.64, SD = 0.62) and experimental group (M = 2.70, SD = 0.54)
regarding students’ performance in learning physics (), which indicated that students’
performance in learning physics in the pretest was the same. Statistically, there
is no significant difference found between the control group (M =2.57, SD = 0.68)
and experimental group (M =2.70, SD =0.60) regarding students’ performance in understanding of Physics (), which indicated that students’
performance in understanding of Physics before the intervention was the same.
Moreover, no statistically significant difference was
shown between the control group (M = 2.68, SD = 0.61) and experimental group (M=
2.74, SD =0.59) regarding students’ performance in willingness to learn Physics
(), which indicated that students’ performance in willingness
to learn Physics before the intervention was the same. Statistically, there is no
significant difference found between the control group (M = 7.89, SD = 1.02) and
experimental group (M = 8.13, SD =0.99) regarding students’ performance in the Self-efficacy test (), which indicated that the students’ Self-efficacy
before the intervention was the same. The same results were obtained after using
the Bonferroni adjusted significance criterion of the p-value 0.05. The adjusted
p-value was = 0.0125 (.05/4) since four tests were conducted.
As presented in Table 6, for the control group, the participants’ understanding of Physics was
the highest (M = 2.70, SD = 0.63), followed by a willingness to learn Physics (M
= 2.66, SD =0.61). In contrast, participants’ Physics learning reported the lowest
(M= 2.45, SD = 0.63). In the total scores of the Self-efficacy test, participants
scored a mean of 7.80 (SD = 1.07). Results of the T-test for related samples indicated
no significant differences in means of the student’s performance in the control
group in learning physics in the pretest and post-test (), which indicated that the
performance of the students in the pretest and post-test of learning physics was
the same. Concerning students’ understanding of physic, there was no significant difference
in means of in the control group in the pretest and post-test (), which indicated that the
performance of the students in the pretest and post-test of understanding of physic
was the same.
Likewise, statistically, no significant difference was
shown in means of the student’s willingness to learn physics in the control group
in the pre and post-test (), which indicated
that the performance of the students in the pretest and post-test of willingness
to learn physics was the same. Overall, no significant difference in means of total
scores of Self-efficacy in the pretest and post-test for the control group (. We can conclude that the student’s performance in
the Self-efficacy survey for the control group was the same before and after the
intervention. The same results were obtained after using the Bonferroni adjusted
significance criterion of the p-value 0.05. The adjusted p-value was = 0.0125
(.05/4) since four tests were conducted.
Table 7 shows
that participants’ willingness to learn Physics was the highest in the experimental
group (M = 4.17 and SD = 0.75), then Physics learning came with a mean of 3.78 (SD
= 0.60). At the same time, participants’ understanding of Physics came last with
mean scores of 3.74 (SD = 0.76). Concerning the control group, participants’ understanding
of Physics was the highest (M = 2.70, SD = 0.63). Willingness to learn Physics came
with a mean of 2.66 (SD = 0.61), while participants’ Physics learning came last
with mean scores of 2.45 (SD = 0.63). In the total scores of the Self-efficacy test,
participants scored higher in the experimental group (M= 11.69, SD = 1.24) than
in the control group (M = 7.80, SD = 1.07).
A T-test for independent samples was conducted to find
if there were statistically significant differences between the mean scores of the
post-test measured in this study for students’ Self-efficacy outcomes for students in grade
12 in both control and experimental groups after the intervention. Statistically,
there was a highly significant difference between the control group and experimental
group regarding students’ Physics learning in favour of the experimental group (). Students in the experimental
group were more likely to perform better in Physics learning in the post-test than
in the control group. In addition, statistically,
there was a highly significant difference found between the control group and experimental
group regarding students’ understanding of Physics in favour of the experimental
group (). Students in the experimental
group were more likely to perform better in understanding Physics in the post-test
than in the control group. The results of the T-test
for independent samples showed that statistically, there was a highly significant
difference between the control group and experimental group regarding students’
willingness to learn Physics in favour of the experimental group (). Students in the experimental
group were more likely to have good performance in willingness to learn Physics
in the post-test compared to the control group. Statistically,
there was a highly significant difference found between the control group and experimental
group regarding students’ Self- efficacy as a whole in favour of the experimental
group (). Students in the experimental
group were more likely to have good Self-efficacy in the post-test compared to the
control group. The same results were obtained after using
the Bonferroni adjusted significance criterion of the p-value 0.05. The adjusted
p-value was = 0.0125 (0.05/4) since four tests were conducted.
The results presented in Table 8 and Figure 5 display the T-test for related samples of the scores of the domains of
Self- efficacy in the pretest and post-test for the experimental group taught by
POGIL-based instruction. The results indicated that there was a highly significant
difference in means of the scores of learning Physics in favour of post-test. The mean scores of students’ Physics learning were higher than
that observed in the pretest. Students in the experimental group were likelier to
perform well in Physics learning after the intervention. In addition, there was a highly significant difference in means
of the scores of understanding of Physics in favour of post-test. The mean scores of students’
understanding of Physics were higher than that observed in the pretest. Students
in the experimental group were more likely to have had good performance in understanding
Physics after the intervention.
Moreover, there was a highly significant difference
in means of the scores of willingness to learn Physics in favour of post-test. The mean scores of students’ willingness to learn
Physics were higher than that observed in the pretest. Students in the experimental
group were more likely to have had good performance in willingness to learn Physics
after the intervention.
Overall, there was a highly significant difference in
means of the scores of the total scores of Self-efficacy in favour of the post-test. The mean scores of students’ self-efficacy were higher
than that observed in the pretest. The same results were obtained after using the
Bonferroni adjusted significance criterion of the p-value 0.05. The adjusted
p-value was = 0.0125 (.05/4) since four tests were conducted.
Thus, students in the experimental group were more likely
to have good Self- efficacy after the intervention (Figure 5 below). Using
the data presented in Table 8, the effect
size of the POGIL approach for Physics learning scores for the experimental group
will be:
The effect size calculated above shows that the percentage
of the POGIL approach for Physics learning scores for the experimental group is
140%. This percentage indicates that this tool is effective in elevating Physics
learning ability among the students in the experimental group by approximately 1.40
level of standard deviation. Further, Cohen’s effect size value (d = 1.40)
suggested a high practical significance. In addition, the effect size of the POGIL
approach for the understanding Physics scores for the experimental group will be:
The effect size calculated above shows that the percentage
of the POGIL approach for understanding Physics scores for the experimental group
is 142%. This percentage indicates that this tool effectively elevates the understanding
of Physics ability among the students in the experimental group by approximately
1.42 level of standard deviation. Further, Cohen’s effect size value (d =
1.42) suggested a high practical significance. Likewise, the effect size of the
POGIL approach for willingness to learn Physics scores for the experimental group
will be:
The effect size calculated above shows that the percentage
of the POGIL approach for willingness to learn Physics scores for the experimental
group is 146%. This percentage indicates that this tool effectively elevates willingness
to learn Physics ability among the students in the experimental group by approximately
1.43 level of standard deviation. Further, Cohen’s effect size value (d =1.43)
suggested a high practical significance. Concerning overall students’ self-efficacy, the
effect size of the POGIL approach for Self- efficacy scores for the experimental
group will be:
The effect size calculated above shows that the percentage
of the POGIL approach for Self- efficacy scores for the experimental group are 254%.
This percentage indicates that this tool is effective in elevating Self- efficacy
ability among the students in the experimental group by approximately 2.54 level
of standard deviation. Further, Cohen’s effect size value (d = 2.54) suggested
a very high practical significance (Figure 6).
Correlation between student performance and self-efficacy in grade 12 when learning through POGIL versus lecturing
Correlation Analysis
A Pearson’s correlation coefficient was conducted to
determine the correlation between students’ performance in KAR, Self-Efficacy, and
views towards science inquiry amongst 56 participants in the control group. Statistically,
there was no significant correlation between students’ performance in KAR and their
Self-Efficacy (), no significant correlation
between students’ performance in KAR and their views towards science inquiry (), and no significant correlation
between students’ Self-Efficacy and their views towards science inquiry ().

Table 9.
Correlation between Grade 12 Students’ Performance in KAR, Self-Efficacy and Attitudes in Control Group: Pearson’s Correlation Coefficient.
Table 9.
Correlation between Grade 12 Students’ Performance in KAR, Self-Efficacy and Attitudes in Control Group: Pearson’s Correlation Coefficient.
| Scales | KAR | Self-Efficacy | Attitudes | |
|---|---|---|---|---|
| KAR | Correlation Coefficient | 1.000 | ||
| P-value | ||||
| n | 56 | |||
| Self-Efficacy | Correlation Coefficient | 0.076 | 1.000 | |
| P-value | 0.579 | |||
| n | 56 | 56 | ||
| Attitudes | Correlation Coefficient | 0.037 | 0.194 | 1.000 |
| P-value | 0.786 | 0.153 | ||
| n | 56 | 56 | 56 | |
Table 10.
Correlation between Grade 12 Students’ Performance in KAR, Self-Efficacy and Attitudes in Experimental Group: Pearson’s Correlation Coefficient.
Table 10.
Correlation between Grade 12 Students’ Performance in KAR, Self-Efficacy and Attitudes in Experimental Group: Pearson’s Correlation Coefficient.
| Scales | KAR | Self-Efficacy | Attitudes | |
|---|---|---|---|---|
| KAR | Correlation Coefficient | 1.000 | ||
| P-value | . | |||
| N | 54 | |||
| Self-Efficacy | Correlation Coefficient | 0.704** | 1.000 | |
| P-value | 0.000 | . | ||
| N | 54 | 54 | ||
| Attitudes | Correlation Coefficient | 0.565** | 0.569** | 1.000 |
| P-value | 0.000 | 0.000 | . | |
| N | 54 | 54 | 54 | |
** Correlation is significant at the 0.05 level (2-tailed).
A Pearson’s correlation coefficient was conducted to determine the correlation between students’ performance in KAR, Self-Efficacy, and views towards science inquiry amongst 54 participants in the experimental group. Statistically, there was a robust, positive and significant correlation between students’ performance in KAR and their Self-Efficacy () which indicated that as students’ performance in KAR increase, their Self-Efficacy increase.
In addition, there was a strong, positive and significant correlation between students’ performance in KAR and their views towards science inquiry (), which indicated that as students’ performance in KAR increase, their views towards science inquiry more positive.
Moreover, there was a strong, positive and significant correlation between students’ Self-Efficacy and attitudes towards science inquiry (), which indicated that as students’ Self-Efficacy increase, their views towards science inquiry more positive.
Regression Analysis
Multiple Liner Regression was conducted to find the relationship between Grade 12 students’ performance as the dependent variable and self-efficacy and scientific attitudes as independent variables when they learn by POGIL-based instruction and lecturing-based instruction. To this end, the research used SPSS to examine all the relations paths through the resultant path coefficients.
Table 11.
Model Summary: Relationship between Students’ Performance, Self-Efficacy and Attitudes when They Learn by POGIL-Based Instruction.
Table 11.
Model Summary: Relationship between Students’ Performance, Self-Efficacy and Attitudes when They Learn by POGIL-Based Instruction.
| R | R Square | Adjusted R Square | Std. An error in the Estimate |
|---|---|---|---|
| 0.732 | 0.536 | 0.513 | 2.053 |
The prediction model contained two predictors: Self-Efficacy and students’ attitudes towards science inquiry, used to predict Students’ performance in KAR. As Table 12 and Table 13 showed, the multiple correlations R indicated a positive correlation between the independent and dependent variables (r = 0.732). The model was statistically significant, F (2, 51) = 29.45, p-value < 0.05, and accounted for approximately 51.3% of the variance of students’ attitudes towards science inquiry.
The raw and standardized regression coefficients of the predictors are shown in Table 13. The Coefficients table provides the necessary information to predict the dependent variable from the predictors and determine whether the predictors contribute statistically significantly to the model. Self-Efficacy received the most substantial weight in the model. Therefore, Self-Efficacy statistically has a positive effect on student performance since the results indicated that (. In addition, students’ attitudes towards science inquiry statistically have a positive effect on student's performance since (. Overall results of the fourth question showed no correlations between the variables: students’ performance and, Self-efficacy and Attitudes when learning by POGIL-based instruction and lecturing instruction before the intervention. On the other hand, there were strong and positive correlations between all variables of the participants’ performance in the KAR Test, participants’ Self-efficacy and their Attitudes towards Scientific Inquiry after the intervention. In addition, the results showed that students’ Self-Efficacy and attitudes towards science inquiry positively affect students’ performance.
Discussion
Our findings indicate that, on the whole, students felt that working in teams to learn was a worthwhile experience that helped them learn compared to lectures. Additionally, we discovered that collaboration helped students acquire process skills, including teamwork, respect for others' opinions, and problem-solving. The results show that students are aware of the advantages of POGIL, which explicitly emphasizes the development of process skills (KAR) as a crucial part of the student learning process. Students can identify, develop, and carry out a strategy that goes beyond regular action to find a solution to a problem or question when they connect with others and build on each other's strengths and talents.
As previously said, teams in POGIL have defined roles which help with learning and developing process skills. These roles give the students the scaffolding they need to participate in the "interactive" form of learning as they learn to clarify, build, and defend their ideas to others while discovering a new subject for the first time (Zamista et al., 2019). In particular, the scaffolding within the roles allows for enough turn-taking frequency to "enable more frequent revisions on smaller components of knowledge" and "make it easier for students to incorporate their partners' understanding of the domain and to make adjustments to their mental model"(Aiman et al., 2020).
Our findings are positive that students understand the value of working in teams, given the focus of POGIL on improving process skills (KAR). According to the regression results, self-efficacy was also a significant predictor of learning outcomes. This implies that although students felt the opportunity to work in a team was beneficial for their learning and the development of process skills, their actual learning was unaffected. These results align with an earlier study, which discovered that self-efficacy is among the most important indicators of students' learning in computer science (Bandura, 1977; Sakellariou and Fang, 2021; Vishnumolakala et al., 2017). Prior research has suggested that rather than outperforming students who learn through traditional lecture-based approaches on traditional assessments, students who learn through inquiry-based approaches, like problem-based learning, significantly outperform students on assessments that measure clinical and application skills (Yadav et al., 2011, 2014). Therefore, future research should concentrate on creating instruments that can assess students' procedural abilities and allow them to apply rather than merely regurgitate what they have learned.
Future studies should look into POGIL's long-term effects and how collaborative learning in the classroom applies to the workplace. Graduates of POGIL-based curricula could be used in a cross-sectional study to determine whether and how POGIL prepared them for professional employment. Future research could also examine how POGIL in foundational computer science courses affects students' transition to upper-level physics courses.
Conclusions
In recent years, Physics classes have used Process Oriented Guided Inquiry Learning. This study adds findings concerning its effect on students' views and performance. Our findings are encouraging, especially in light of research showing that collaborative learning is superior to individualistic and competitive strategies. Future studies should, however, investigate POGIL's long-term effects and how students apply their collaborative learning outside of the classroom to real-world situations. Our results provide a first step in that approach because they demonstrate that students felt POGIL assisted them in improving their problem-solving and collaborative abilities.
References
- Aiman, U. Aiman, U., Hasyda, S. and Uslan, U. (2020), “The Influence of Process Oriented Guided Inquiry Learning (POGIL) Model Assisted by Realia Media to Improve Scientific Literacy and Critical Thinking Skill of Primary School Students”, European Journal of Educational Research, Vol. 9 No. 4, pp. 1635–1647.
- Al-Naqbi, A.K. Al-Naqbi, A.K. and Alshannag, Q. (2018), “The status of education for sustainable development and sustainability knowledge, attitudes, and behaviors of UAE University students”, International Journal of Sustainability in Higher Education, Vol. 19 No. 3, pp. 566–588.
- Anam, S. and Stracke, E. (2016), “Language learning strategies of Indonesian primary school students: In relation to self-efficacy beliefs”, System, Vol. 60, pp. 1–10.
- Artino Jr., A.R. (2012), “Academic self-efficacy: from educational theory to instructional practice”, Perspectives on Medical Education, Vol. 1 No. 2, pp. 76–85.
- Assem, H.D., Nartey, L., Appiah, E. and Aidoo, J.K. (2023), “A Review of Students’ Academic Performance in Physics: Attitude, Instructional Methods, Misconceptions and Teachers Qualification”, European Journal of Education and Pedagogy, Vol. 4 No. 1, pp. 84–92.
- Bandura, A. (1977), “Self-efficacy: Toward a unifying theory of behavioral change.”, Psychological Review, Vol. 84 No. 2, pp. 191–215.
- Barthlow, M.J. Barthlow, M.J. and Watson, S.B. (2014), “The Effectiveness of Process-Oriented Guided Inquiry Learning to Reduce Alternative Conceptions in Secondary Chemistry”, School Science and Mathematics, Vol. 114 No. 5, pp. 246–255.
- Brown, S.D. Brown, S.D. (2010), “A Process-Oriented Guided Inquiry Approach to Teaching Medicinal Chemistry”, American Journal of Pharmaceutical Education, Vol. 74 No. 7, p. 121.
- Daubenmire, P., Frazier, M., Bunce, D., Draus, C., Gessell, A. and Van Opstal, M. (2015), “Research and Teaching: During POGIL Implementation the Professor Still Makes a Difference”, Journal of College Science Teaching, Vol. 44 No. 5. [CrossRef]
- Easterbrook, M.J. and Hadden, I.R. (2021), “Tackling Educational Inequalities with Social Psychology: Identities, Contexts, and Interventions”, Social Issues and Policy Review, Vol. 15 No. 1, pp. 180–236.
- Frey, R.F., McDaniel, M.A., Bunce, D.M., Cahill, M.J. and Perry, M.D. (2020), “Using Students’ Concept-building Tendencies to Better Characterize Average-Performing Student Learning and Problem-Solving Approaches in General Chemistry”, edited by Davidesco, I.CBE—Life Sciences Education, Vol. 19 No. 3, p. ar42. 3.
- Guido, R.M. Guido, R.M. (2013), “Attitude and Motivation towards Learning Physics”, International Journal of Engineering Research & Technology (IJERT), Vol. 2 No. 11.
- Haleem, A., Javaid, M., Qadri, M.A. and Suman, R. (2022), “Understanding the role of digital technologies in education: A review”, Sustainable Operations and Computers, Vol. 3, pp. 275–285.
- Hassan Al Marzouqi, A.H., Alameddine, M., Sharif, A. and Alsheikh-Ali, A.A. (2019), “Research productivity in the United Arab Emirates: A 20-year bibliometric analysis”, Heliyon, Vol. 5 No. 12, p. e02819.
- Hu, H.H. Hu, H.H. and Shepherd, T.D. (2013), “Using POGIL to help students learn to program”, ACM Transactions on Computing Education, Vol. 13 No. 3, pp. 1–23.
- Idul, J.J.A. Idul, J.J.A. and Caro, V.B. (2022), “Does process-oriented guided inquiry learning (POGIL) improve students’ science academic performance and process skills?”, International Journal of Science Education, Vol. 44 No. 12, pp. 1994–2014.
- Kaleva, S. Kaleva, S., Pursiainen, J., Hakola, M., Rusanen, J. and Muukkonen, H. (2019), “Students’ reasons for STEM choices and the relationship of mathematics choice to university admission”, International Journal of STEM Education, Vol. 6 No. 1, p. 43.
- Knight, J.K., Wise, S.B., Rentsch, J. and Furtak, E.M. (2015), “Cues Matter: Learning Assistants Influence Introductory Biology Student Interactions during Clicker-Question Discussions”, edited by Momsen, J.CBE—Life Sciences Education, Vol. 14 No. 4, p. ar41.
- Le, H., Janssen, J. and Wubbels, T. (2018), “Collaborative learning practices: teacher and student perceived obstacles to effective student collaboration”, Cambridge Journal of Education, Vol. 48 No. 1, pp. 103–122.
- Lin, T.-J. Lin, T.-J. and Tsai, C.-C. (2013), “A MULTI-DIMENSIONAL INSTRUMENT FOR EVALUATING TAIWANESE HIGH SCHOOL STUDENTS’ SCIENCE LEARNING SELF-EFFICACY IN RELATION TO THEIR APPROACHES TO LEARNING SCIENCE”, International Journal of Science and Mathematics Education, Vol. 11 No. 6, pp. 1275–1301.
- Lin, T.-S.C.W.M.Y.-G. Lin, T.-S.C.W.M.Y.-G. (2009), “Faculty Perceptions of Teaching Support and Teaching Efficacy in Taiwan”, Springer, Vol. 59, pp. 207–220.
- De Loof, H. De Loof, H., Boeve-de Pauw, J. and Van Petegem, P. (2022), “Engaging Students with Integrated STEM Education: a Happy Marriage or a Failed Engagement?”, International Journal of Science and Mathematics Education, Vol. 20 No. 7, pp. 1291–1313.
- Nipa Deora, Nathalie Rivera, Sheila Sarkar, Marcos Betancourt, L.W. (2020), “Combining Flipped Classroom with POGIL in an Urban Community College Setting: A Pilot Study”, Vol. 10 No. 1, pp. 19–23.
- Osborne, J. Osborne, J., Simon, S. and Collins, S. (2003), “Attitudes towards science: A review of the literature and its implications”, International Journal of Science Education, Vol. 25 No. 9, pp. 1049–1079.
- Pintrich, P.R. Pintrich, P.R., Smith, D.A.F., Garcia, T. and Mckeachie, W.J. (1993), “Reliability and Predictive Validity of the Motivated Strategies for Learning Questionnaire (Mslq)”, Educational and Psychological Measurement, Vol. 53 No. 3, pp. 801–813.
- Qureshi, S. Qureshi, S., Vishnumolakala, V.R., Southam, D.C. and Treagust, D.F. (2017), “Inquiry-Based Chemistry Education in a High-Context Culture: a Qatari Case Study”, International Journal of Science and Mathematics Education, Vol. 15 No. 6, pp. 1017–1038.
- Sakellariou, C. Sakellariou, C. and Fang, Z. (2021), “Self-efficacy and interest in STEM subjects as predictors of the STEM gender gap in the US: The role of unobserved heterogeneity”, International Journal of Educational Research, Vol. 109, p. 101821.
- Soltis, R. Soltis, R., Verlinden, N., Kruger, N., Carroll, A. and Trumbo, T. (2015), “Process-Oriented Guided Inquiry Learning Strategy Enhances Students’ Higher Level Thinking Skills in a Pharmaceutical Sciences Course”, American Journal of Pharmaceutical Education, Vol. 79 No. 1, p. 11.
- Tairab, H. and Al-Naqbi, A. (2017), “Provision of Inquiry Instruction and Actual Level of Practice as Perceived by Science Teachers and their Students”, EURASIA Journal of Mathematics, Science and Technology Education, Vol. 14 No. 1. [CrossRef]
- Talanquer, V. Talanquer, V. (2022), “The Complexity of Reasoning about and with Chemical Representations”, JACS Au, Vol. 2 No. 12, pp. 2658–2669.
- Trevathan, Jarrod, and Myers, T. (2013), “Towards online delivery of process-oriented guided inquiry learning techniques in information technology courses”, Journal of Learning Design, Vol. 6 No. 2, pp. 1–11.
- Vishnumolakala, V.R. Vishnumolakala, V.R., Southam, D.C., Treagust, D.F., Mocerino, M. and Qureshi, S. (2017), “Students’ attitudes, self-efficacy and experiences in a modified process-oriented guided inquiry learning undergraduate chemistry classroom”, Chemistry Education Research and Practice, Vol. 18 No. 2, pp. 340–352.
- Walker, L. and Warfa, A.-R.M. (2017), “Process oriented guided inquiry learning (POGIL®) marginally effects student achievement measures but substantially increases the odds of passing a course”, edited by Tractenberg, R.E.PLOS ONE, Vol. 12 No. 10, p. e0186203.
- Wozniak, B.M. (2012), “Effect of Process-Oriented Guided-Inquiry Learning on Non-Majors Biology Students’ Understanding of Biological Classification”, [Master’s Thesis, Minnesota State University, Mankato].
- Yadav, A., Subedi, D., Lundeberg, M.A. and Bunting, C.F. (2011), “Problem-based Learning: Influence on Students’ Learning in an Electrical Engineering Course”, Journal of Engineering Education, Vol. 100 No. 2, pp. 253–280.
- Yadav, A., Vinh, M., Shaver, G.M., Meckl, P. and Firebaugh, S. (2014), “Case-based instruction: Improving students’ conceptual understanding through cases in a mechanical engineering course”, Journal of Research in Science Teaching, Vol. 51 No. 5, pp. 659–677.
- Young, T., Macinnes, S., Jarden, A. and Colla, R. (2022), “The impact of a wellbeing program imbedded in university classes: the importance of valuing happiness, baseline wellbeing and practice frequency”, Studies in Higher Education, Vol. 47 No. 4, pp. 751–770.
- Zamista, A.A. Zamista, A.A., Rahmi, H. and Juni. (2019), “Development of Physics Module based on Process Oriented Guided Inquiry Learning as a Tool to Increase Student Science Process Skills”, Journal of Physics: Conference Series, Vol. 1233 No. 1, p. 012067.
Figure 1.
Profile of the Cognitive Outcomes of (KAR) Test –Pretest.
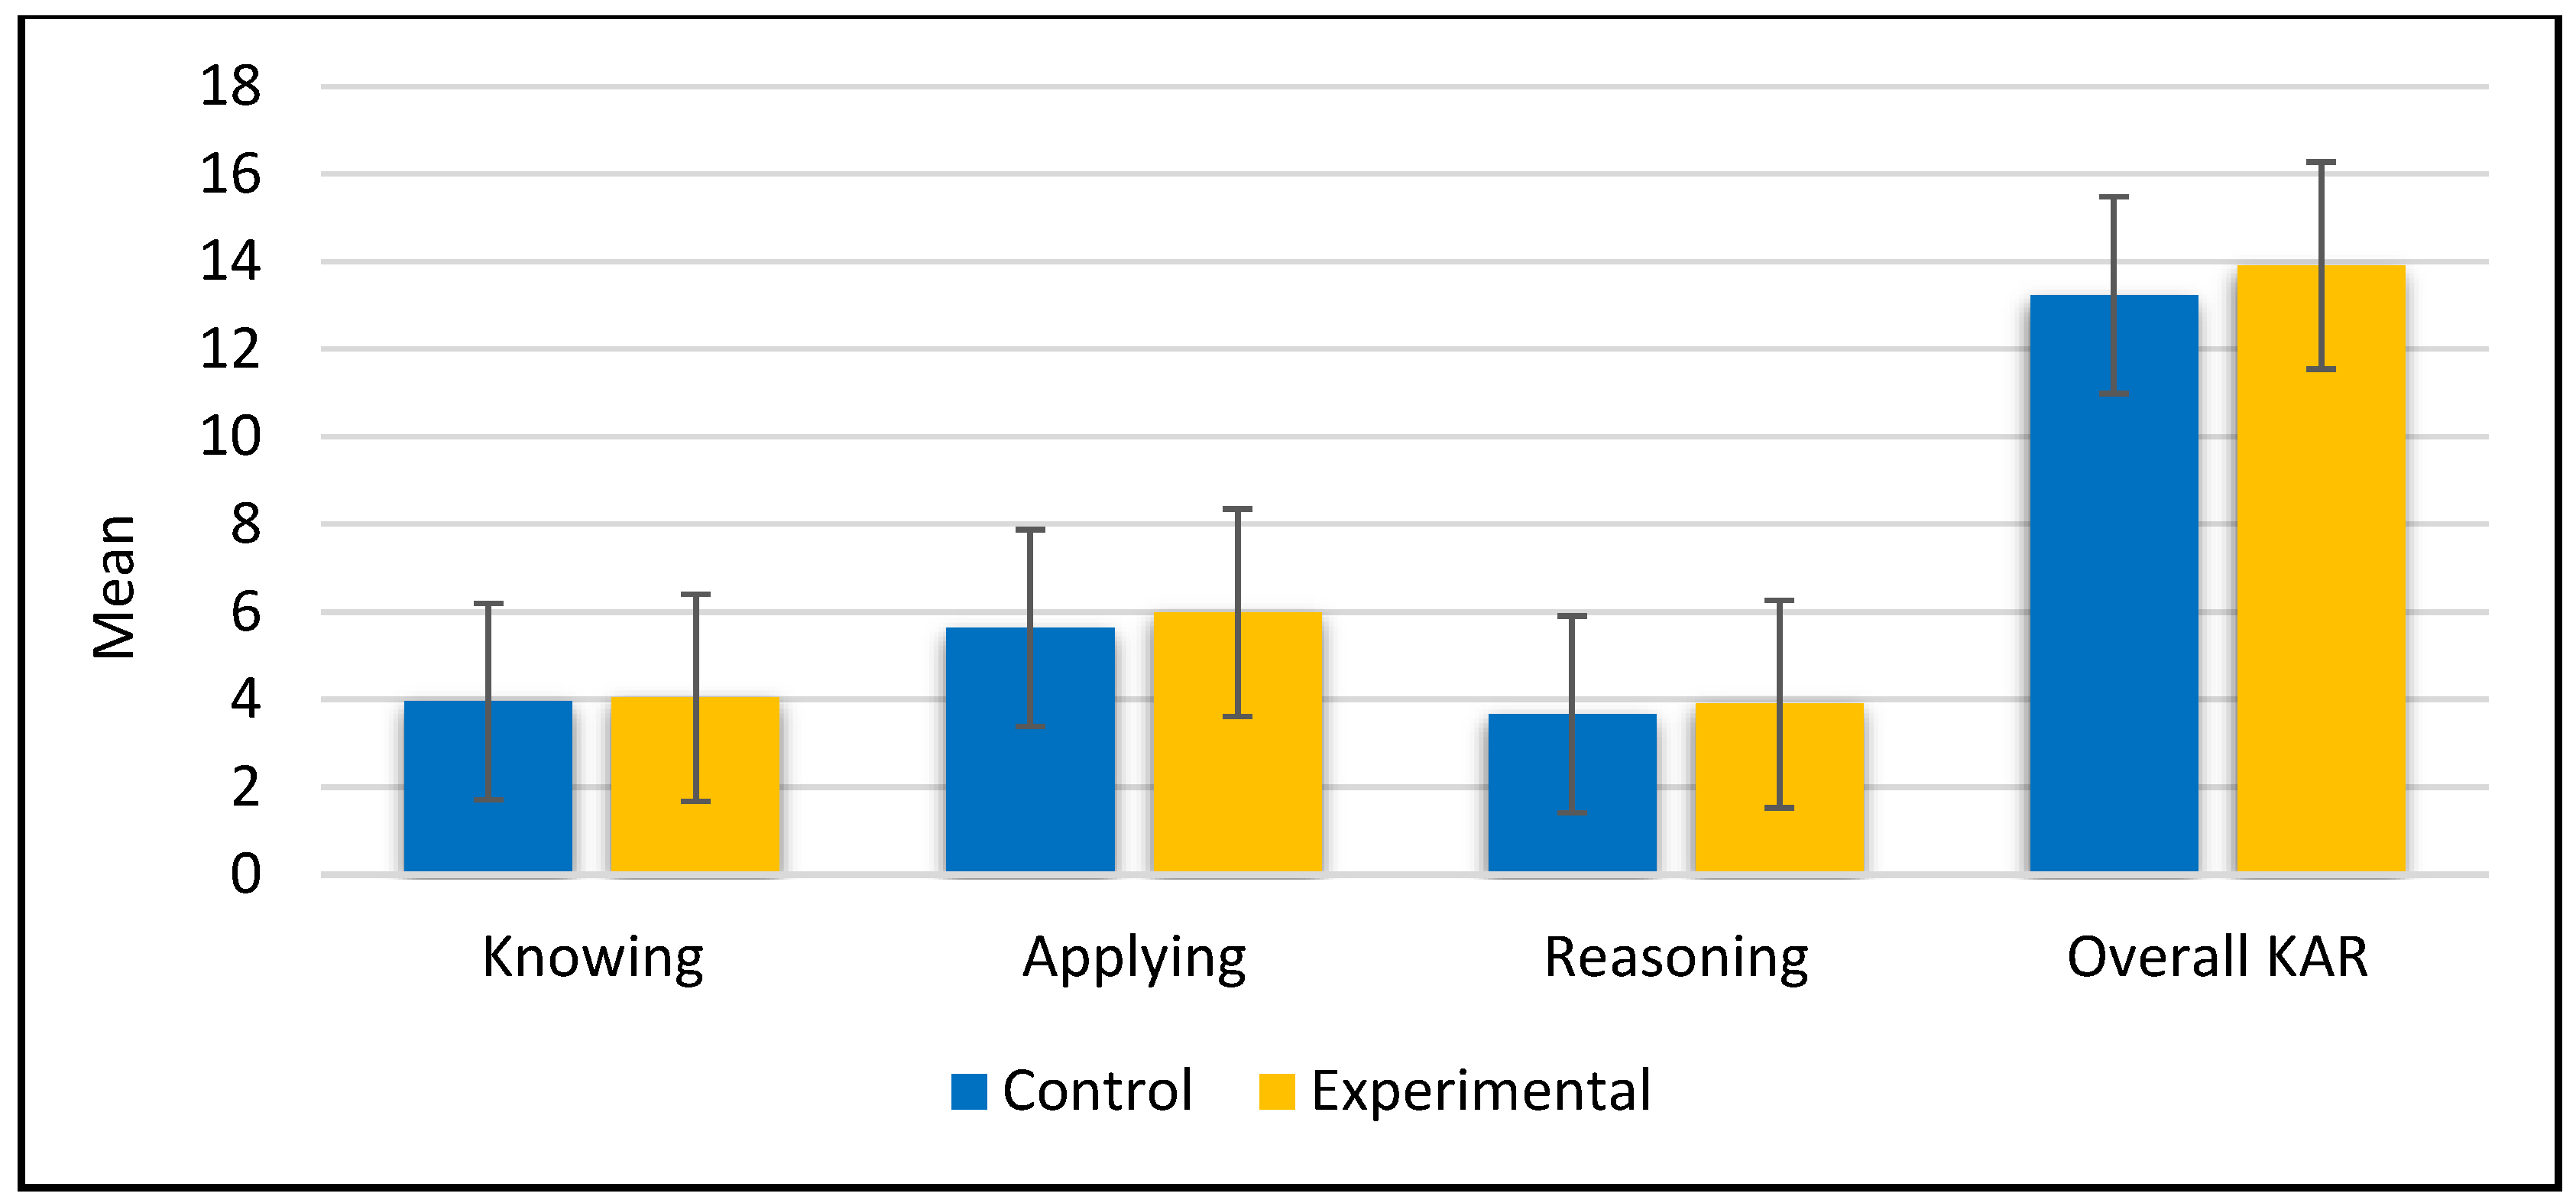
Figure 2.
Profile of the Students in the Cognitive Outcomes of (KAR)-Post-Test.
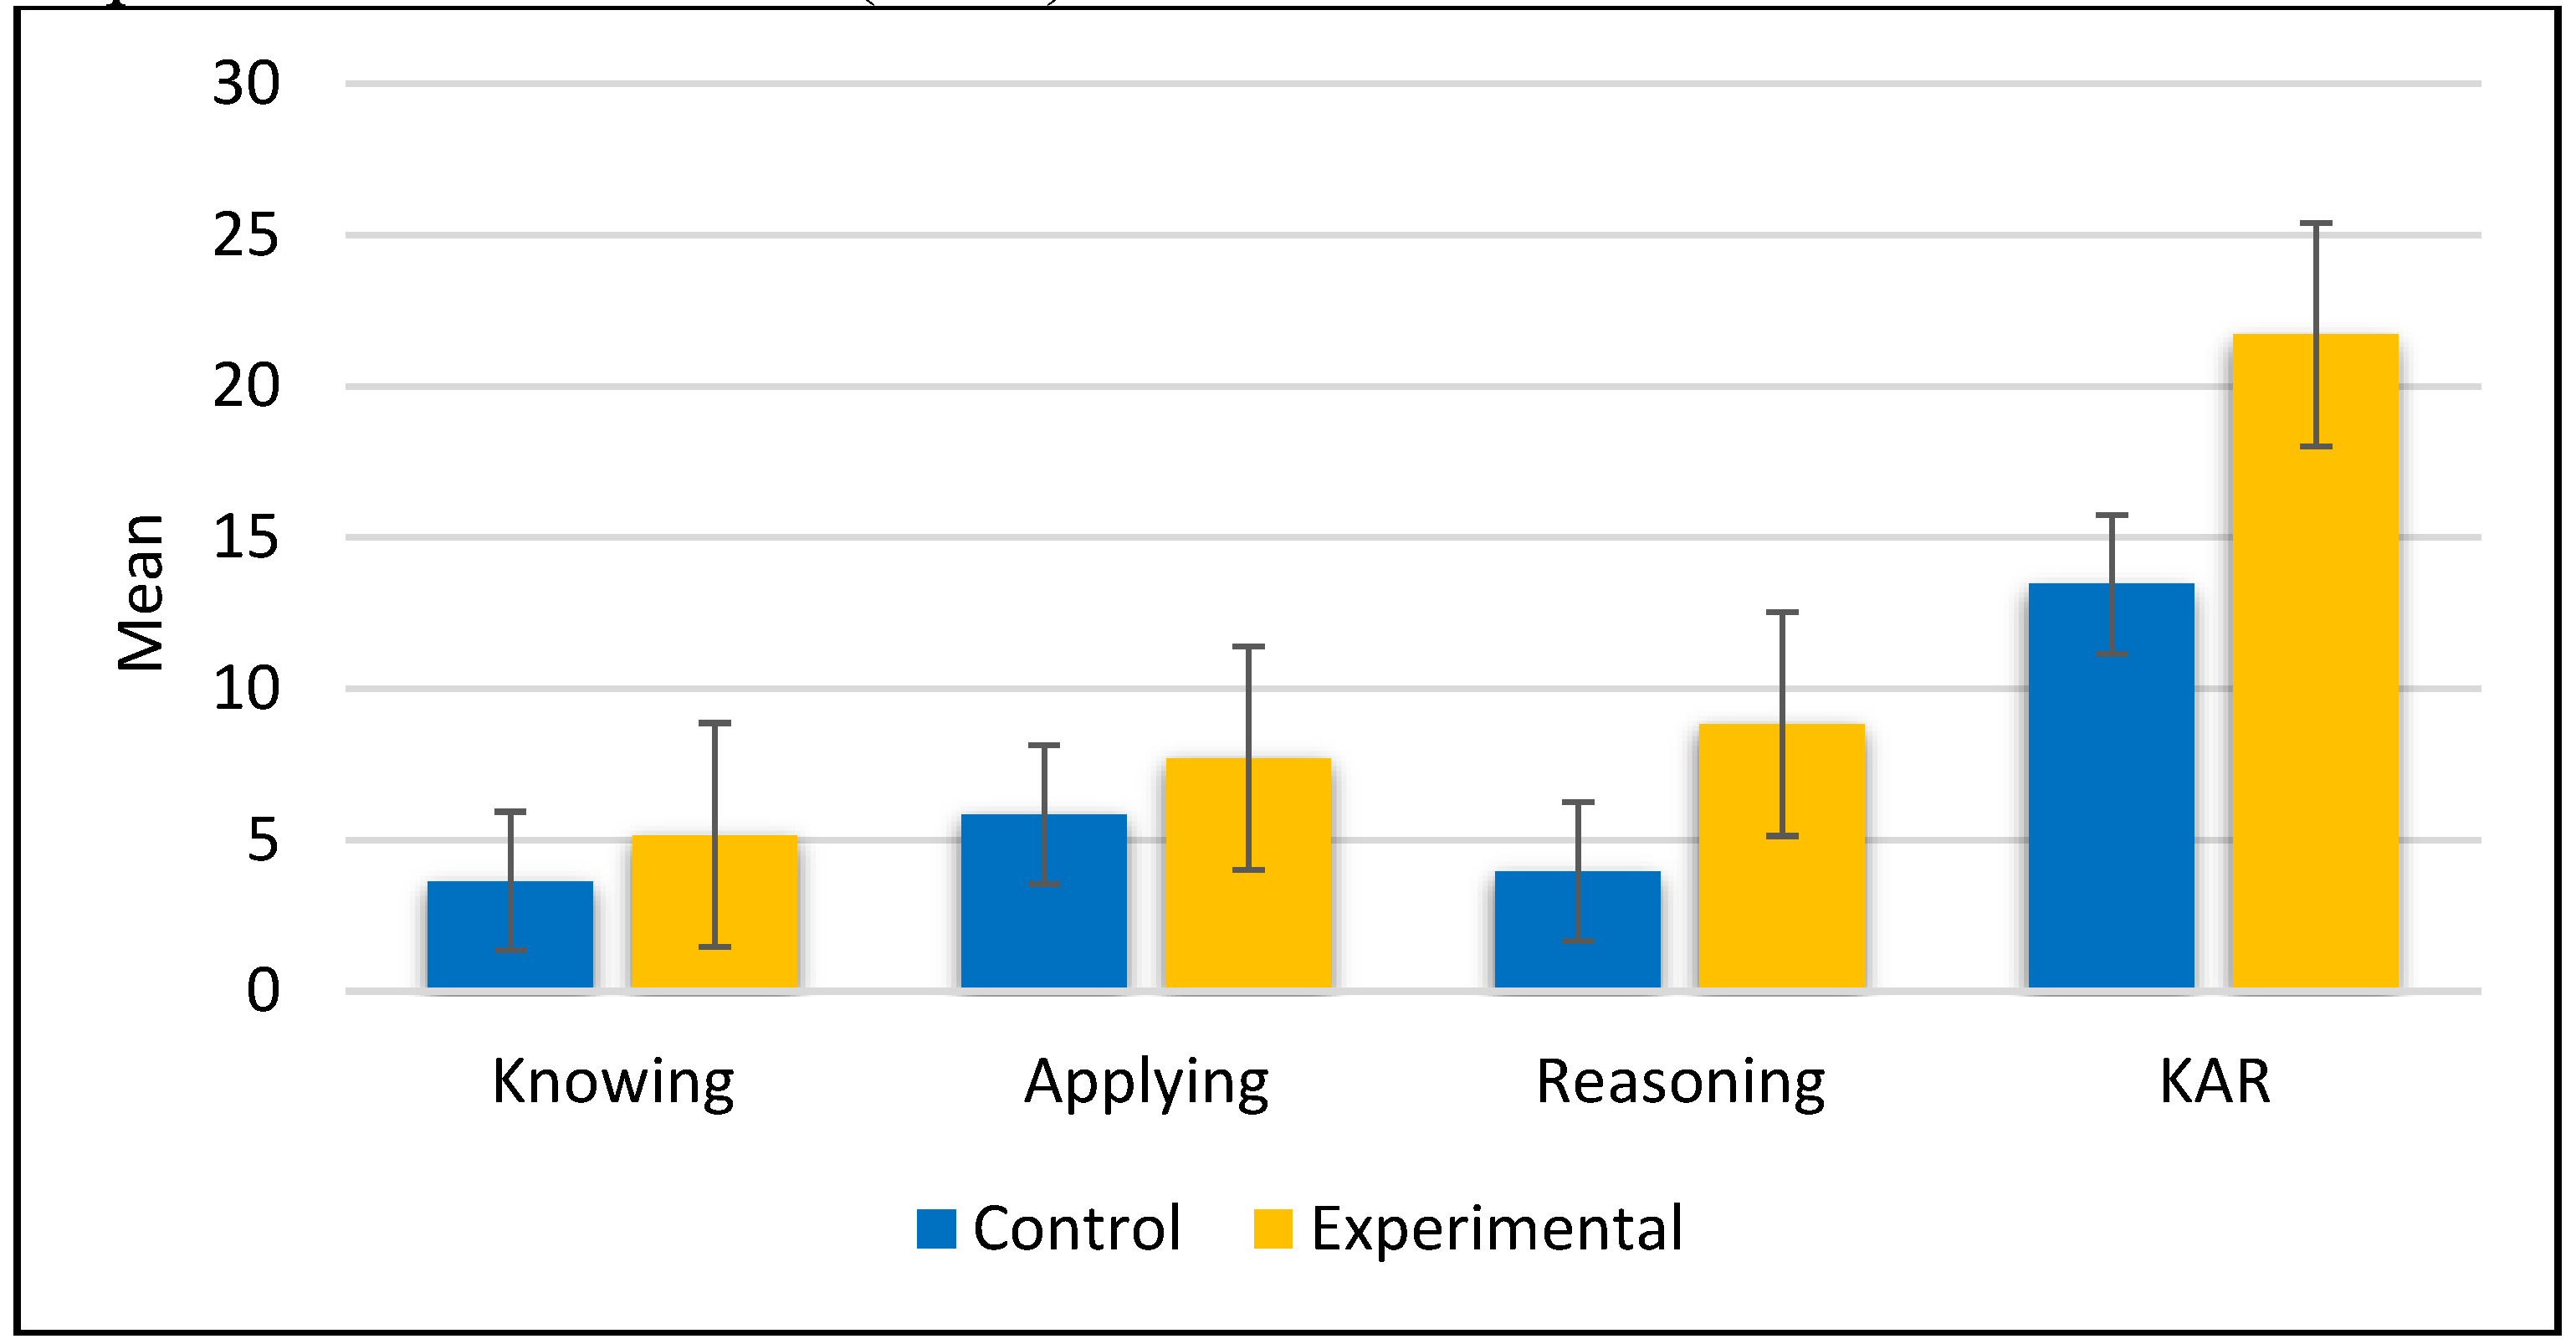
Figure 3.
Profile of the cognitive outcomes Test of (KAR)-Pretest vs Post-test.
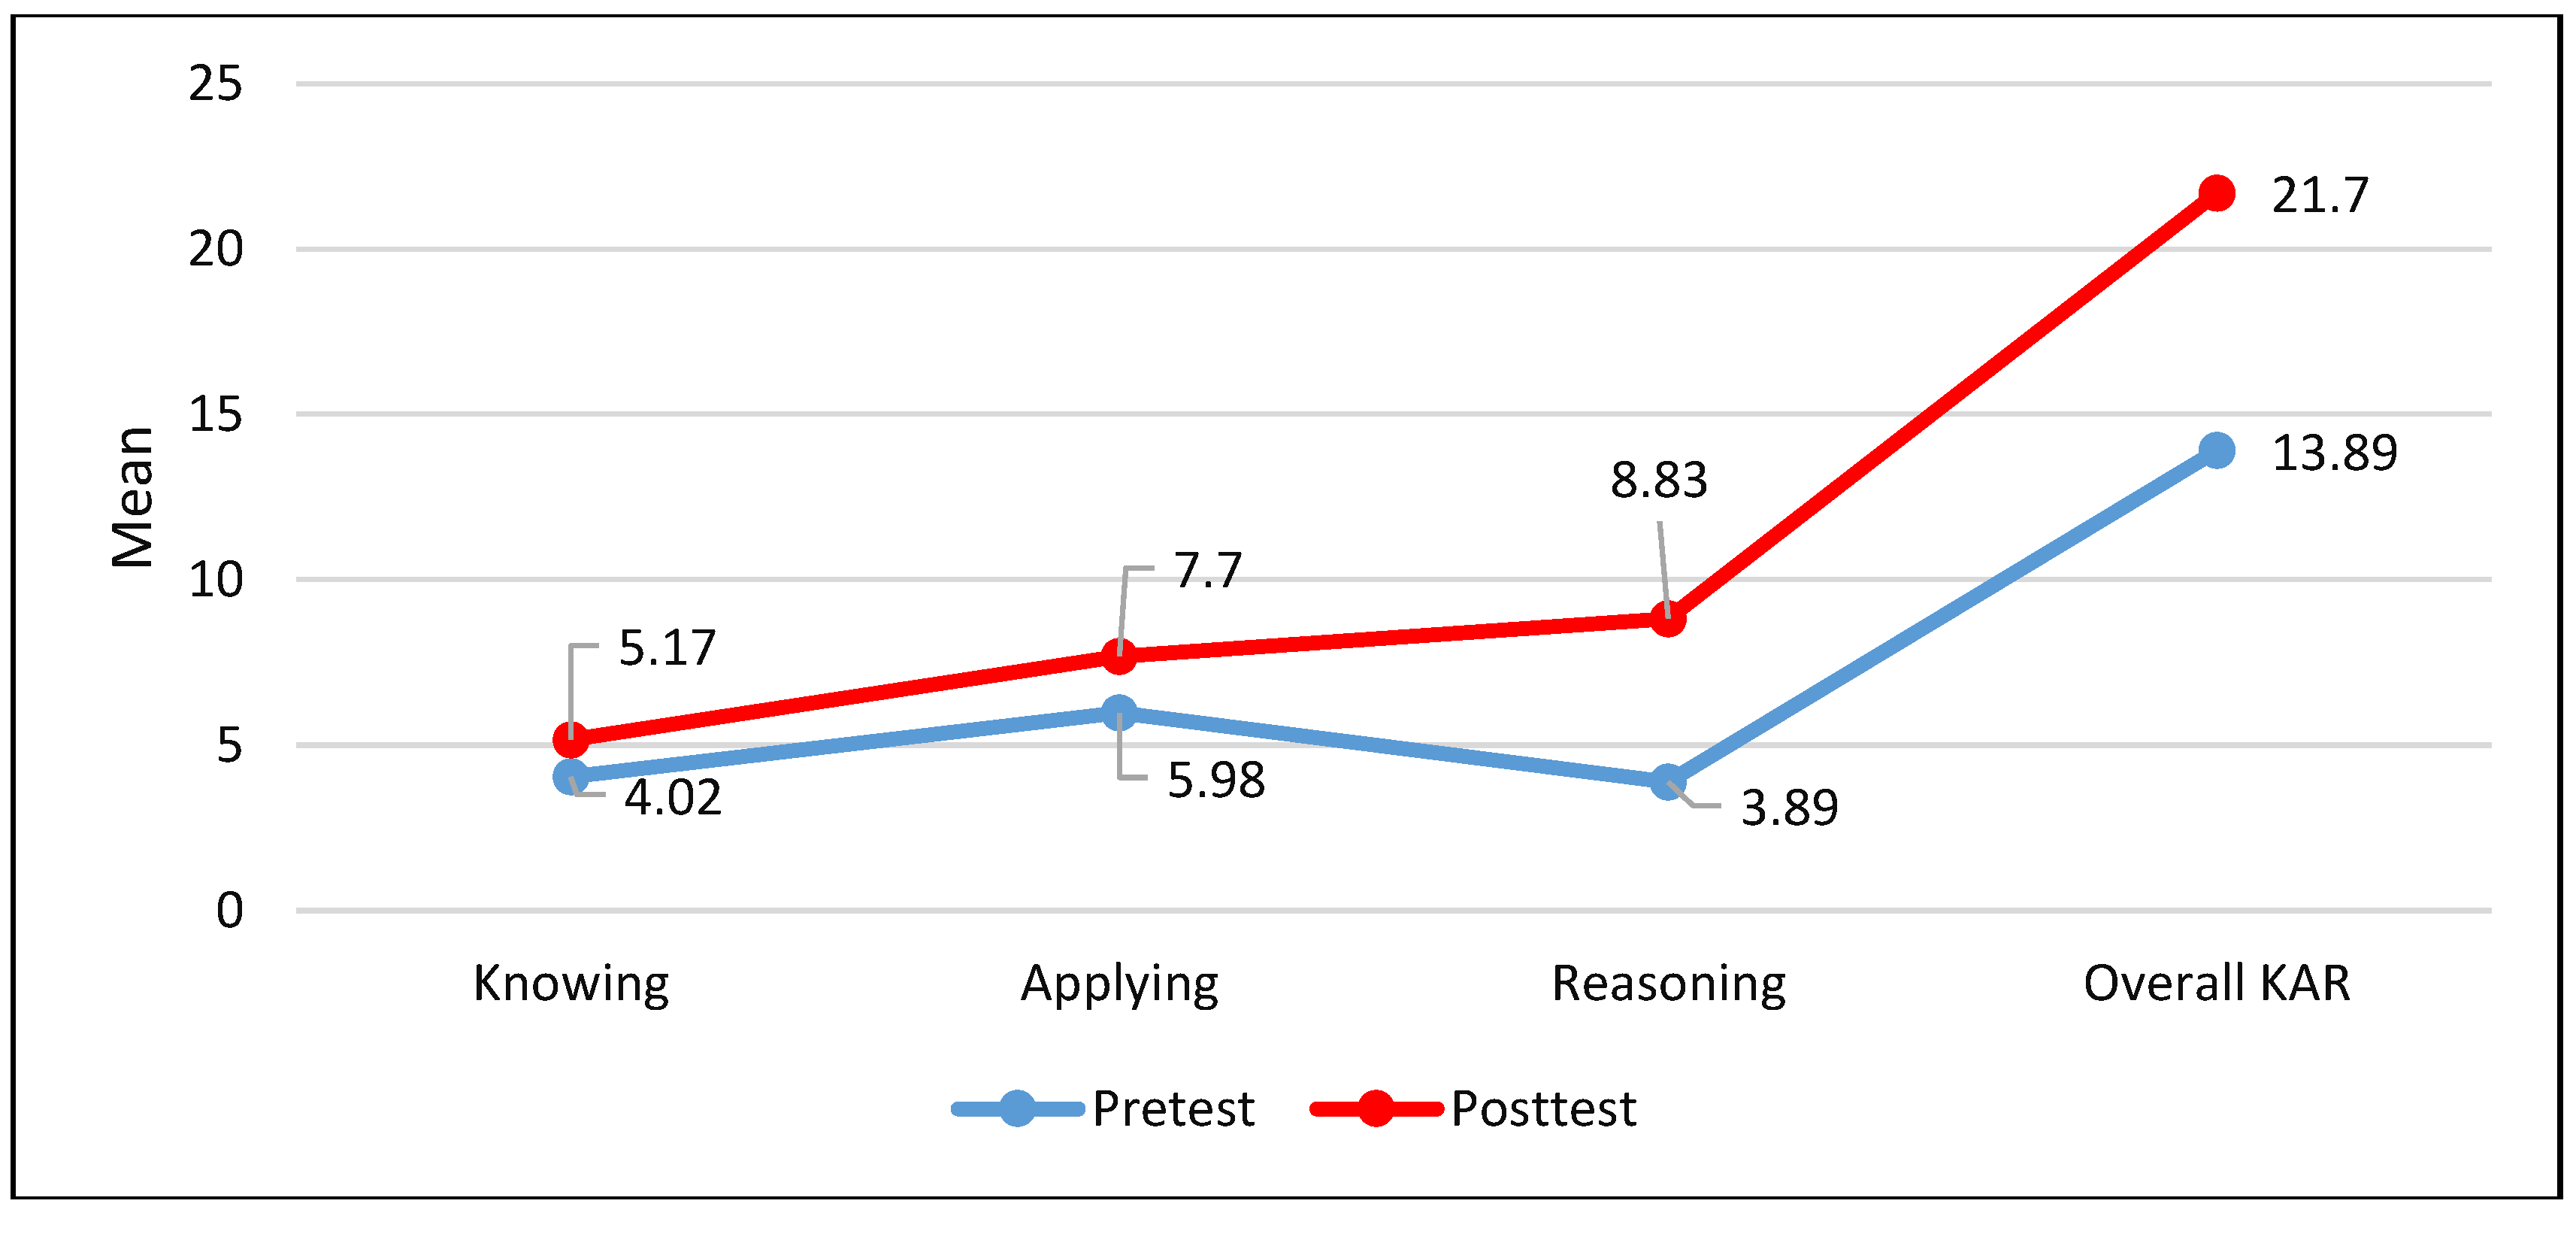
Figure 4.
Profile of the Students in the Pretest for the Subscales and Whole Test of Self-Efficacy.

Figure 5.
Profile of the Students in the Post-Test for the Subscales and Whole Test of Self-Efficacy.
Figure 5.
Profile of the Students in the Post-Test for the Subscales and Whole Test of Self-Efficacy.
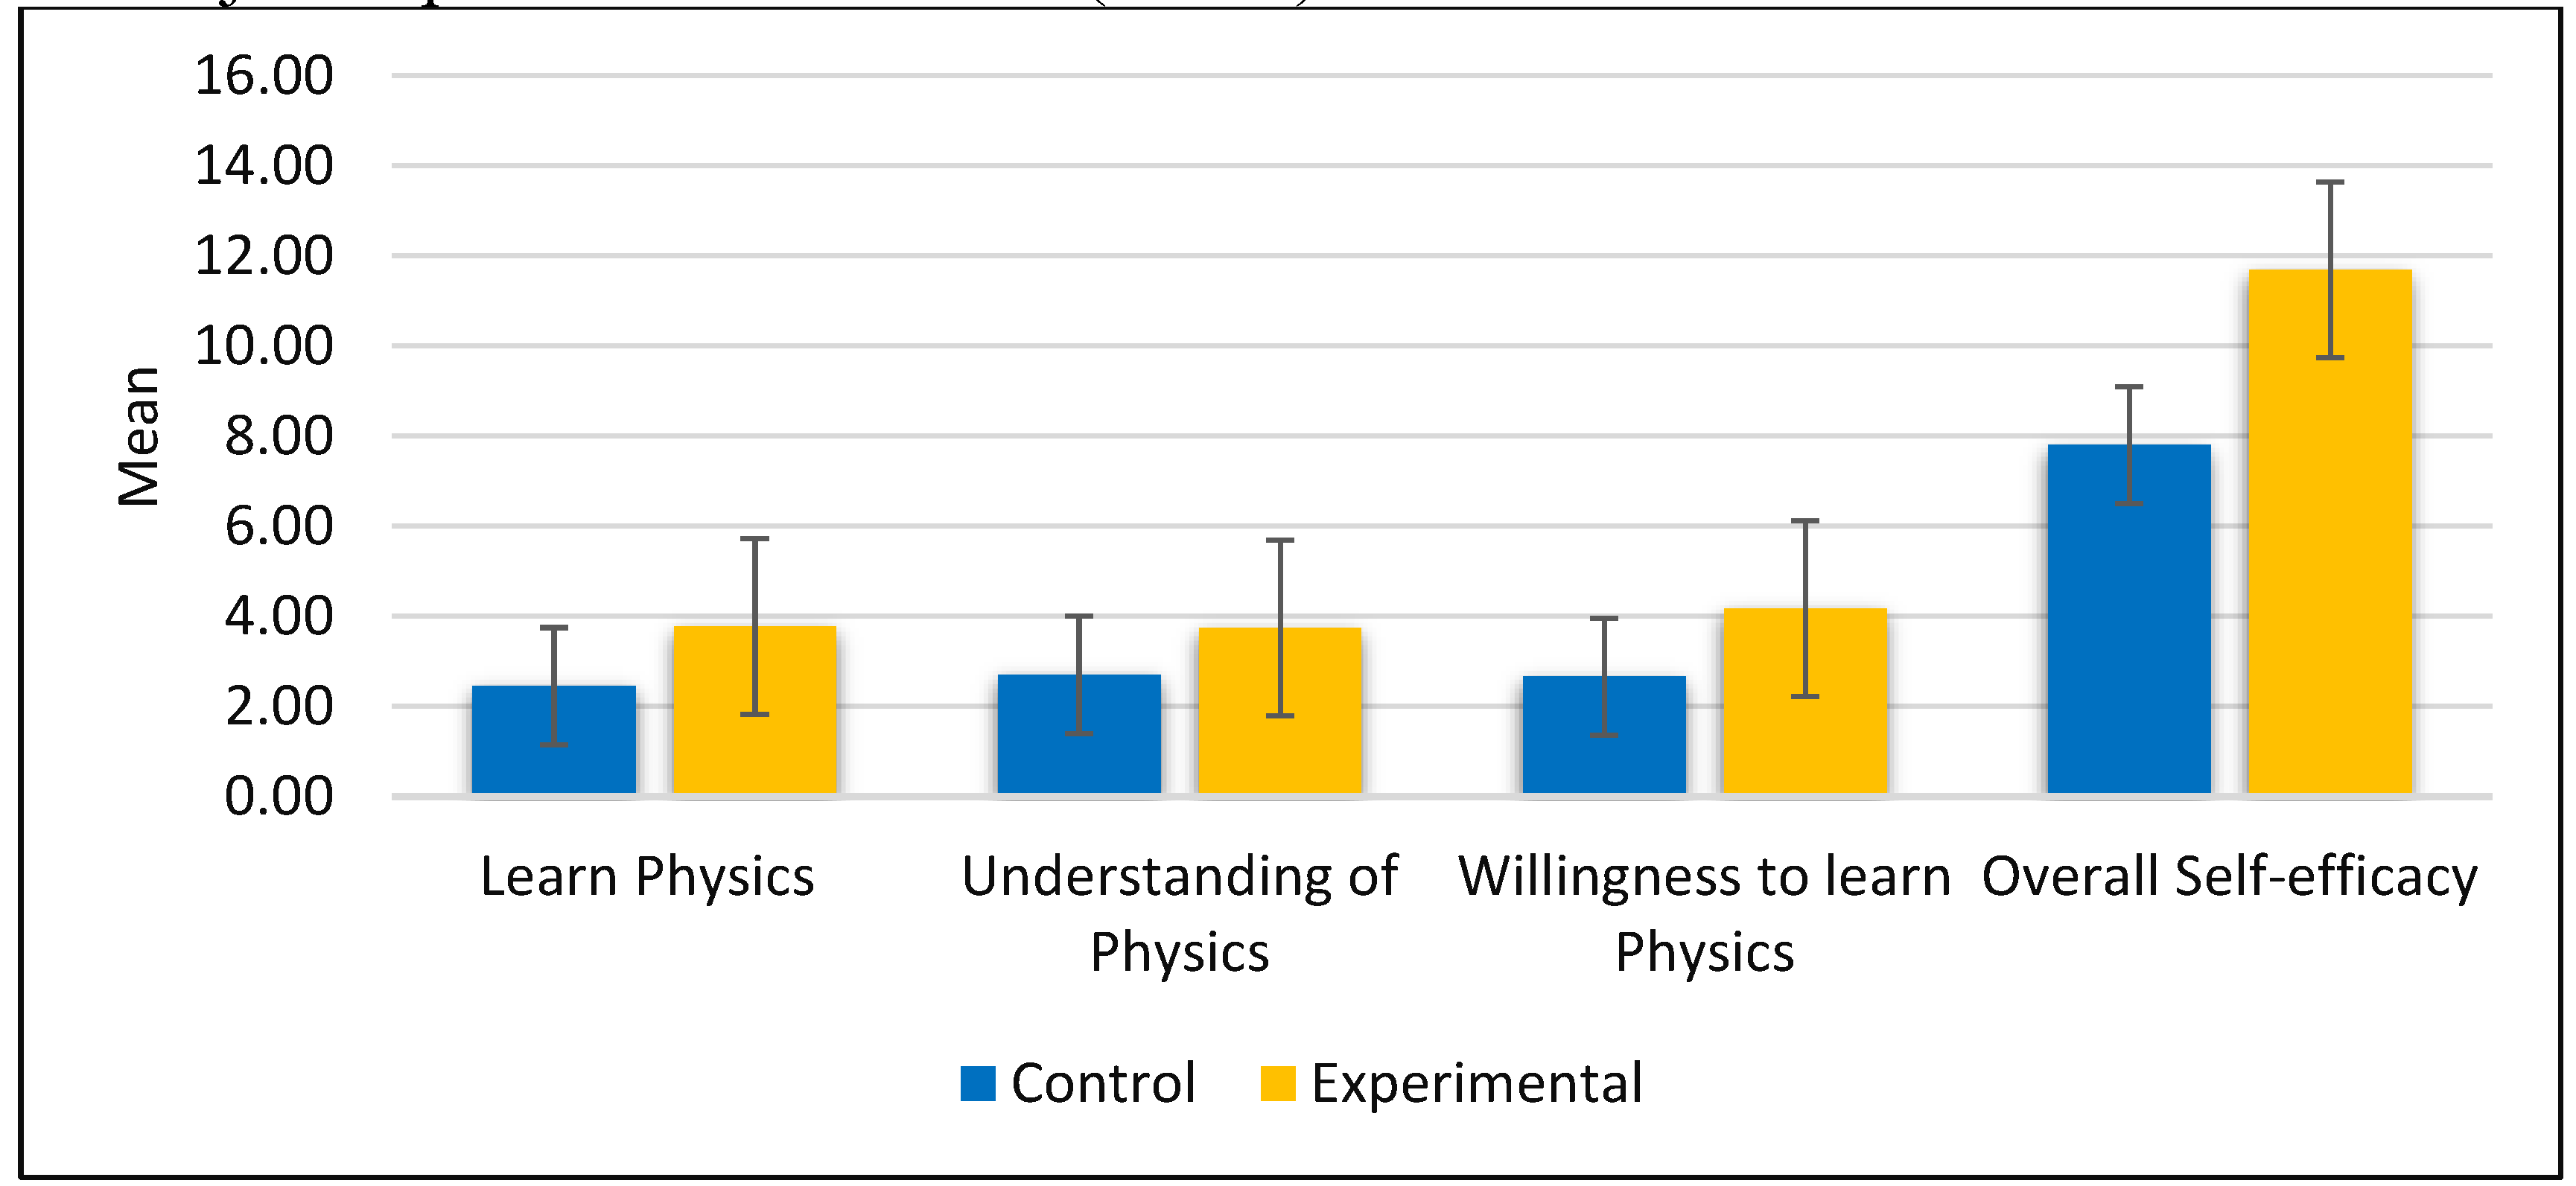
Figure 6.
Profile of the Experimental Group in the Subscales of Self-Efficacy Survey: Pretest vs Post-Test.
Figure 6.
Profile of the Experimental Group in the Subscales of Self-Efficacy Survey: Pretest vs Post-Test.
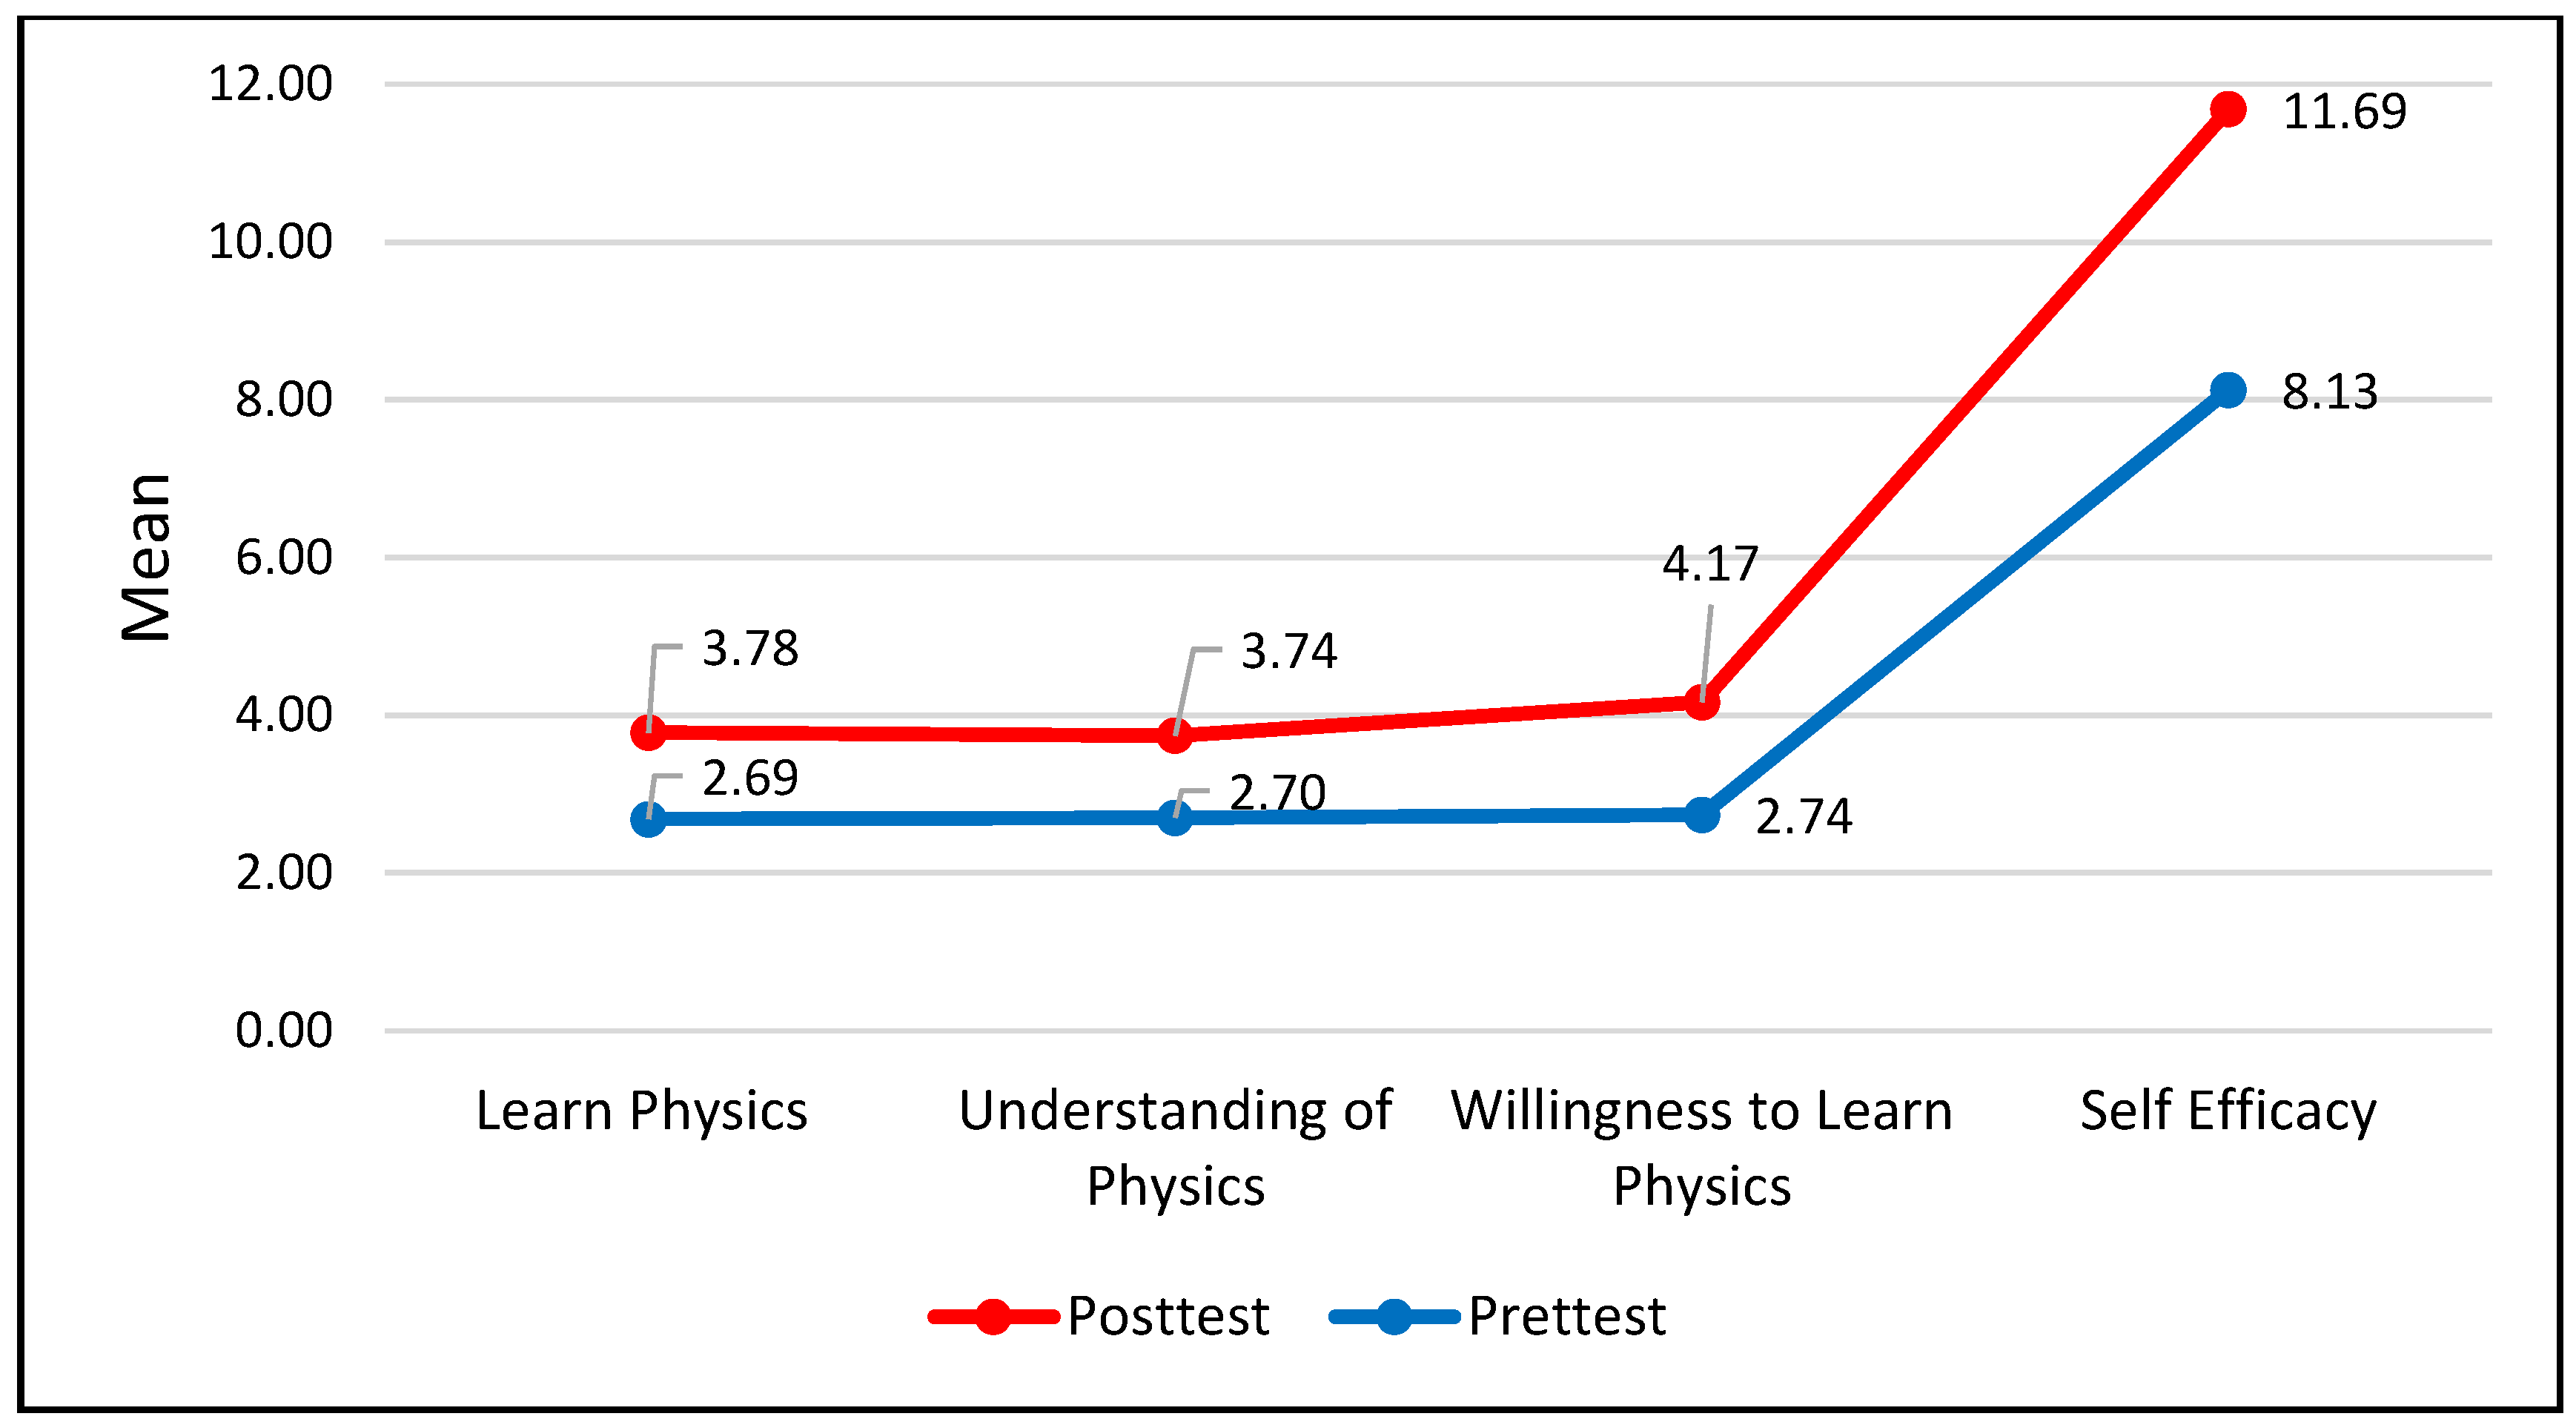
Table 1.
Results of Independent Samples T-test for Equality of Means of the Cognitive Outcomes of the variables of Knowing, Applying and Reasoning (KAR)- Pretest.
Table 1.
Results of Independent Samples T-test for Equality of Means of the Cognitive Outcomes of the variables of Knowing, Applying and Reasoning (KAR)- Pretest.
| Scale | Group | N | Mean | Std. Dev. | t | df | Sig. |
|---|---|---|---|---|---|---|---|
| Knowing | Control | 56 | 3.93 | 1.10 | 0.41 | 108 | 0.682 |
| Experimental | 54 | 4.02 | 1.21 | ||||
| Total | 110 | 3.99 | 1.18 | ||||
| Applying | Control | 56 | 5.63 | 1.46 | 1.129 | 108 | 0.261 |
| Experimental | 54 | 5.98 | 1.84 | ||||
| Total | 110 | 5.80 | 1.66 | ||||
| Reasoning | Control | 56 | 3.66 | 1.07 | 1.067 | 108 | 0.289 |
| Experimental | 54 | 3.89 | 1.18 | ||||
| Total | 110 | 3.77 | 1.12 | ||||
| Overall KAR | Control | 56 | 13.23 | 2.00 | 1.635 | 108 | 0.105 |
| Experimental | 54 | 13.91 | 2.33 | ||||
| Total | 110 | 13.56 | 2.18 |
Std. Dev.=Standard Deviation.
Table 2.
Results of Paired Sample T-Test for the Cognitive Outcomes of the (KAR) Test in the Pretest and Post-Test for the Control Group.
Table 2.
Results of Paired Sample T-Test for the Cognitive Outcomes of the (KAR) Test in the Pretest and Post-Test for the Control Group.
| Scale | Test | Mean | Std. Deviation | Mean Diff. | t | df | Sig. |
|---|---|---|---|---|---|---|---|
| Knowing | Pretest | 3.93 | 1.10 | 0.286 | 1.29 | 55 | 0.203 |
| Post-test | 3.64 | 1.10 | |||||
| Applying | Pretest | 5.63 | 1.46 | 0.214 | 0.792 | 55 | 0.432 |
| Post-test | 5.84 | 1.35 | |||||
| Reasoning | Pretest | 3.66 | 1.07 | 0.304 | 1.608 | 55 | 0.114 |
| Post-test | 3.96 | 1.39 | |||||
| KAR | Pretest | 13.21 | 2.00 | 0.232 | 0.641 | 55 | 0.524 |
| Post-test | 13.45 | 2.00 |
Std. Deviation= Standard Deviation Mean Diff. = Mean Difference.
Table 3.
Results of Independent Samples T-Test of the Cognitive Outcomes of the Variables of Knowing, Applying, Reasoning, and Overall (KAR) for the Two Groups-Post-Test.
Table 3.
Results of Independent Samples T-Test of the Cognitive Outcomes of the Variables of Knowing, Applying, Reasoning, and Overall (KAR) for the Two Groups-Post-Test.
| Scale | Group | N | Mean | Std. Dev. | T | df | Sig. |
|---|---|---|---|---|---|---|---|
| Knowing | Control | 56 | 3.64 | 1.10 | 7.98 | 108 | 0.000 |
| Experimental | 54 | 5.17 | 0.88 | ||||
| Total | 110 | 4.39 | 1.26 | ||||
| Applying | Control | 56 | 5.84 | 1.35 | 5.50 | 108 | 0.000 |
| Experimental | 54 | 7.70 | 2.13 | ||||
| Total | 110 | 6.75 | 2.00 | ||||
| Reasoning | Control | 56 | 3.96 | 1.39 | 18.25 | 108 | 0.000 |
| Experimental | 54 | 8.83 | 1.41 | ||||
| Total | 110 | 6.35 | 2.81 | ||||
| Overall KAR | Control | 56 | 13.45 | 2.00 | 17.22 | 108 | 0.000 |
| Experimental | 54 | 21.70 | 2.96 | ||||
| Total | 110 | 17.50 | 4.84 |
Std. Dev.= Standard Deviation.
Table 4.
Results of Paired Sample T-Test for the Cognitive Outcomes of the (KAR) Test in the Pretest and Post-Test for the Experimental Group.
Table 4.
Results of Paired Sample T-Test for the Cognitive Outcomes of the (KAR) Test in the Pretest and Post-Test for the Experimental Group.
| Scale | Test | Mean | Std. Dev. | Mean diff. | SD diff. |
T | df | Sig. | d |
|---|---|---|---|---|---|---|---|---|---|
| Knowing | Pretest | 4.02 | 1.21 | 1.15 | 1.54 | 5.50 | 53 | 0.000 | 0.75 |
| Post-test | 5.17 | 0.88 | |||||||
| Applying | Pretest | 5.98 | 1.84 | 1.72 | 3.41 | 3.72 | 53 | 0.000 | 0.50 |
| Post-test | 7.70 | 2.13 | |||||||
| Reasoning | Pretest | 3.89 | 1.18 | 4.94 | 1.66 | 21.8 | 53 | 0.000 | 2.98 |
| Post-test | 8.83 | 1.41 | |||||||
| KAR | Pretest | 13.89 | 2.28 | 7.82 | 4.08 | 14.1 | 53 | 0.000 | 1.92 |
| Post-test | 21.70 | 2.96 |
Mean Diff. = Mean Difference SD diff. = Pooled Standard Deviation d= Effect size.
Table 5.
Results of Independent Samples T- Test for Physics Learning, Understanding of Physics, Willingness to Learn Physics, and Overall Self-Efficacy: Pretest.
Table 5.
Results of Independent Samples T- Test for Physics Learning, Understanding of Physics, Willingness to Learn Physics, and Overall Self-Efficacy: Pretest.
| Scale | Group | N | Mean | Std. Dev. | t | df | Sig. |
|---|---|---|---|---|---|---|---|
| Physics Learning | Control | 56 | 2.64 | 0.62 | 0.38 | 108 | 0.703 |
| Experimental | 54 | 2.70 | 0.54 | ||||
| Total | 110 | 2.66 | 0.58 | ||||
| Understanding of Physics | Control | 56 | 2.57 | 0.68 | 1.08 | 108 | 0.285 |
| Experimental | 54 | 2.70 | 0.60 | ||||
| Total | 110 | 2.64 | 0.65 | ||||
| Willingness to learn Physics | Control | 56 | 2.68 | 0.61 | 0.55 | 108 | 0.587 |
| Experimental | 54 | 2.74 | 0.59 | ||||
| Total | 110 | 2.71 | 0.60 | ||||
| Overall Self-efficacy | Control | 56 | 7.89 | 1.02 | 1.23 | 108 | 0.220 |
| Experimental | 54 | 8.13 | 0.99 | ||||
| Total | 110 | 8.01 | 1.01 |
Std. Dev.=Standard Deviation.
Table 6.
Results of T-Test for Related Samples in the Pretest and Post-Test for the Control Group for the Subscales of Self-Efficacy Survey.
Table 6.
Results of T-Test for Related Samples in the Pretest and Post-Test for the Control Group for the Subscales of Self-Efficacy Survey.
| Scale | Test | Mean | Std. Dev. | Mean Diff. | t | df | Sig. |
|---|---|---|---|---|---|---|---|
| Physics Learning | Pretest | 2.64 | 0.62 | 0.20 | 1.56 | 55 | 0.12 |
| Post-test | 2.45 | 0.63 | |||||
| Understanding of Physics | Pretest | 2.57 | 0.68 | 0.13 | 0.98 | 55 | 0.33 |
| Post-test | 2.70 | 0.63 | |||||
| Willingness to learn Physics | Pretest | 2.68 | 0.61 | 0.02 | 0.16 | 55 | 0.87 |
| Post-test | 2.66 | 0.61 | |||||
| Overall Self Efficacy1 | Pretest | 7.89 | 1.02 | 0.09 | 0.44 | 55 | 0.66 |
| Post-test | 7.80 | 1.07 |
Std. Dev.= Standard Deviation Mean Diff. = Mean Difference.
Table 7.
Results of Independent Samples T- Test of the Subscales of Self-Efficacy for the Students in the Two Groups: Post-Test.
Table 7.
Results of Independent Samples T- Test of the Subscales of Self-Efficacy for the Students in the Two Groups: Post-Test.
| Scale | Group | N | Mean | Std. Dev. | t | df | Sig. |
|---|---|---|---|---|---|---|---|
| Physics Learning | Control | 56 | 2.45 | 0.63 | 11.31 | 108 | 0.000 |
| Experimental | 54 | 3.78 | 0.60 | ||||
| Total | 110 | 3.10 | 0.91 | ||||
| Understanding of Physics | Control | 56 | 2.70 | 0.63 | 7.88 | 108 | 0.000 |
| Experimental | 54 | 3.74 | 0.76 | ||||
| Total | 110 | 3.21 | 0.87 | ||||
| Willingness to learn Physics | Control | 56 | 2.66 | 0.61 | 11.60 | 108 | 0.000 |
| Experimental | 54 | 4.17 | 0.75 | ||||
| Total | 110 | 3.40 | 1.02 | ||||
| Overall Self-efficacy | Control | 56 | 7.80 | 1.07 | 17.60 | 108 | 0.000 |
| Experimental | 54 | 11.69 | 1.24 | ||||
| Total | 110 | 9.71 | 2.26 |
Std. Dev.=Standard Deviation.
Table 8.
Results of T-Test for Related Sample in the Pretest and Post-Test for the Experimental Group for the Subscales of Self-Efficacy Survey.
Table 8.
Results of T-Test for Related Sample in the Pretest and Post-Test for the Experimental Group for the Subscales of Self-Efficacy Survey.
| Scale | Test | Mean | Std. Dev. | Mean diff. | SD diff. |
T | df | Sig. | d |
|---|---|---|---|---|---|---|---|---|---|
| Physics Learning | Pre | 2.69 | 0.54 | 1.09 | 0.78 | 10.25 | 53 | 0.000 | 1.40 |
| Post | 3.78 | 0.60 | |||||||
| Applying Understanding of Physics |
Pre | 2.70 | 0.60 | 1.04 | 0.73 | 10.50 | 53 | 0.000 | 1.42 |
| Post | 3.74 | 0.76 | |||||||
| Reasoning | Pre | 2.74 | 0.59 | 1.43 | 0.98 | 10.66 | 53 | 0.000 | 1.46 |
| Post | 4.17 | 0.75 | |||||||
| Willingness to learn Physics | Pre | 8.13 | 0.99 | 3.56 | 1.40 | 18.71 | 53 | 0.000 | 2.54 |
| Post | 11.7 | 1.24 |
Mean Diff. = Mean Difference SD diff. = Pooled Standard Deviation d= Effect size.
Table 12.
ANOVA for the Relationship between Students’ Performance, Self-Efficacy and Attitudes Learned by POGIL-Based Instruction.
Table 12.
ANOVA for the Relationship between Students’ Performance, Self-Efficacy and Attitudes Learned by POGIL-Based Instruction.
| Source of Variation | Sum of Squares | df | Mean Square | F | Sig. |
|---|---|---|---|---|---|
| Regression | 248.290 | 2 | 124.145 | 29.45 | 0.000 |
| Residual | 214.970 | 51 | 4.215 | ||
| Total | 463.259 | 53 |
Table 13.
Model Coefficients for the Relationship between Students’ Performance, Self-Efficacy and Attitudes Learned by POGIL-Based Instruction.
Table 13.
Model Coefficients for the Relationship between Students’ Performance, Self-Efficacy and Attitudes Learned by POGIL-Based Instruction.
| Predictors | Unstandardized Coefficients | Standardized Coefficients | t | p-value | |
|---|---|---|---|---|---|
| B | Std. Error | Beta | |||
| (Constant) | -1.96 | 3.30 | -0.59 | 0.555 | |
| Self-Efficacy | 1.35 | 0.28 | 0.57 | 4.88 | 0.000 |
| Students’ Attitudes towards science inquiry | 0.63 | 0.30 | 0.24 | 2.10 | 0.041 |
Dependent Variable: Students’ Performance.
Disclaimer/Publisher’s Note: The statements, opinions and data contained in all publications are solely those of the individual author(s) and contributor(s) and not of MDPI and/or the editor(s). MDPI and/or the editor(s) disclaim responsibility for any injury to people or property resulting from any ideas, methods, instructions or products referred to in the content. |
© 2023 by the authors. Licensee MDPI, Basel, Switzerland. This article is an open access article distributed under the terms and conditions of the Creative Commons Attribution (CC BY) license (http://creativecommons.org/licenses/by/4.0/).
Copyright: This open access article is published under a Creative Commons CC BY 4.0 license, which permit the free download, distribution, and reuse, provided that the author and preprint are cited in any reuse.


