
Submitted:
28 April 2023
Posted:
29 April 2023
You are already at the latest version
Abstract
Malaria is a prevalent disease in several tropical and subtropical regions, including Brazil, where remains a significant public health concern. Despite control efforts, reintroduction of endemics in areas without cases for decades poses a challenge. To assess factors influencing ma-laria risk, regional outbreak cluster analysis and a spatio-temporal models were developed for the Brazilian Amazon, incorporating climate, land use/cover interactions, endemic bird, and amphibian richness. Results showed that amphibian, bird richness and endemism correlated with a reduction in malaria risk. Presence of forest had a positive effect on risk, but it depended on its juxtaposition with anthropic land uses. Biodiversity and landscape composition, rather than forest formation presence alone, modulated malaria risk in the period. Areas with low en-demic species diversity and high human activity, predominantly anthropogenic landscapes posed high malaria risk. This study underscores the importance of considering the broader eco-logical context in malaria control efforts.
Keywords:
Malaria
; Amazon biome
; INLA
; Land use/cover interactions
; Bird and amphibian rich-ness-endemics
; Landscape composition
; Biological diversity
; Spatio-temporal modeling
1. Introduction
Malaria is a tropical and subtropical endemic disease that affects several countries worldwide. In South America, malaria cases were reduced by 58% between 2000-2020, from 1.5 to 0.65 million cases [1]. Yet, malaria remains an important public health problem, far from elimination in several regions. Venezuela, Brazil and Colombia make up 77% of all cases in South America and 68% of those cases were due to Plasmodium vivax parasite. Although in Brazil the malaria control efforts have been significant, public health issues still concern, in addition to the increasing reintroduction of endemics in areas without cases for decades [2].
Even though Anopheles darlingi is the predominant malaria vector in the Amazonian countries [3], there are 61 Anopheles species in Brazil belonging to the subgenus Anopheles, Kerteszia and Nyssorhynchus, some of those species inhabits other biomes such as the “Atlantic Forest” and the “Pantanal” wetlands. The highest vector species richness is located in the Amazon biome, being Nyssorhynchus and Anopheles the most diversified subgenera [4]. That way, in Brazil the transmission remains highly clustered in the Amazon basin, with 99.5% of the total cases [5,6]. Most of the vector species are restricted to forest areas being very rare in urban zones [7].
Deforestation is a critical driver associated with increased malaria cases in Amazon [8,9,10,11]. The relationship between deforestation and malaria incidence is driven by multiple processes. For instance, an interface between primary forest and human settlements [12,13], the rapid process of adaptation of vectors to new modified environments [14,15,16,17], food chain shifts, and also low abundance of vector predators [18,19].
Deforestation is caused by increasing urban infrastructure, crops, agriculture, livestock, mining and other human-induced activities that represent a rise in the contact between human and natural land cover types, where the infected vectors inhabit. Thus, spatial modeling of land use and cover is considered an important tool to understand how malaria increases or decreases due to the distribution of people and changes in vector habitat quality [8,20,21,22,23,24,25]. The importance of using landscape-based approaches including landscape configuration in eco-epidemiological models is remarkable, going beyond including the quantity for each category and also its interactions [23,26,27].
In addition to understanding the roles of deforestation, understanding the role of biodiversity in malaria prevalence might be fruitful, in terms of the role of predators, competitive species and non-competitive hosts, that is, hosts incapable of being infected by the Plasmodium. The effects of human-induced changes on disease prevalence have already been studied for hantavirus [28,29], Lyme disease [30] and schistosomiasis [31]. Consequently, in diverse ecosystems, the transmission of diseases is disrupted due to a dilution of infectious agents across different species. In other words, if there are more species in an ecosystem, there are more opportunities for a pathogen to infect a non-host species, which reduces the concentration of the pathogen in the environment and, consequently, its transmission to the host species. Overall, the dilution effect highlights the importance of preserving biodiversity as a means of reducing the incidence of infectious diseases [32,33].
Several predators can significantly control populations of disease-carrying mosquitoes, both aquatic and terrestrial ecosystems. The aquatic predators of mosquitoes are made up of different taxa, such as tadpoles, but few species identified as effective predators [19], fish [34], being a very effective predator such as Poecilia reticulata, Gambussia affinis, and the most important group, macroinvertebrates such as Belostomatidae, Notonectidae and Odonata [18,35,36]. The most common and effective terrestrial predators are Arachnyda, mammals such as insectivorous bats [37], and birds like the flycatcher [38]. Although the majority of groups that regulate mosquito populations have been briefly discussed, it is worth noting the intricacy of a pristine ecosystem. Any ecosystem disruption can lead to an ecological imbalance resulting in a decline of the ecosystem’s ability to control disease-carrying mosquito populations.
Three main factors determine the distribution and biological cycle of malaria: (1) anthropological factors such as migrations, economic activities (hunting, fishing, agriculture), race, age, gender; (2) Environmental factors such as temperature, relative humidity, altitude, precipitation and (3) ecological factors such as vegetation types, biological interactions, nutrient availability, among others. Previous studies evaluated the biological factors [39], the land use - land cover (here after LULC) influence [8,20,21,22,23,24,25,40], and malaria spatial patterns [41]. However, the combined impact of land use, biodiversity and environmental factors on a macro ecological scale (biome) in Brazil has not been studied yet.
Here we examined the dynamics of malaria and the impact of LULC, local biodiversity and other environmental factors as drivers of malaria risk at Amazon. Specifically, we aimed to understand: i) how the land use types can increase or decrease the malaria risk, ii) how the combination, or interaction, of different land use types can affect malaria risk, iii) whether biodiversity would dilute malaria in more rich regions, and iv) how climatic variables correlates with malaria. We expected that Amazonian municipalities with high levels of anthropogenic land use (high habitat modification) and with low biological richness had higher Malaria prevalence. This information will contribute to the understanding of the spatio-temporal dynamics of malaria across Amazonia, in addition to improving regional and municipal prevention plans.
2. Materials and Methods
2.1. Dataset
2.2. Malaria Cases and Population Data
Human annual Malaria cases (infection location) for each municipality from 2007 to 2018 were provided by Brazil’s Epidemiological Surveillance Information System for malaria [43]. Due to the low amount of P. ovale and P. malariae (mostly African and Asian distribution) cases, the models were restricted to P. vivax and P. falciparum. The mixed-infection cases were added to both falciparum and vivax cases. The cases were downloaded without stratification by age, sex or race, The Annual Parasite Index (API) was calculated as Annual cases/Population*1000. The total population size was downloaded directly from Instituto Brasileiro de Geografia e Estatística [44].
2.3. Land use – land cover (LULC)
LULC rasters with 100 m cell-size resolution were downloaded from “Projeto MapBiomas” collection 5.0 to reconstruct landscape structure annual information for 2007-2018, based on Landsat images [45]. Data was extracted through Google Earth Engine, with 13 LULC classes: forest plantation, mining, sugar cane, wetland, temporary crops, grassland, other non-forest formation, savanna, river, lake and ocean, urban infrastructure, pasture and forest formation. We obtained the area of each LULC classification for each municipality in hectares from 2007 to 2018 using zonal statistics in QGIS 3.8.2 (2018). Then, the LULC areas were divided by the municipality area in order to calculate the proportion of each LULC class for each municipality. Finally, in order to characterize the municipalities and their land use change dynamics throughout the years analyzed, the % change of the most important uses in terms of anthropic activities and natural habitats were plotted on maps.
2.4. Environmental variables
The precipitation seasonality has a high influence in terms of malaria outbreaks [24,46,47]. We assigned to each municipality a climatic zone to establish which are the four rainiest months, the four driest months, the four warmest months and finally the four coldest months. We used two climatic variables from the historical monthly weather data from Worldclim from the year 2007 to 2018 with spatial resolution of 2.5 minutes (pixel area ~21 km2) the average maximum temperature (°C) and monthly precipitation (mm) [48]. Each climatic zone formed by a 250,000 km2 grid = 500 km * 500 km (see Figure S2A). We used the municipality centroid to determine its climatic zone (Figure S2B). After defining the dry and rainy seasons (each season composed of four months), we calculated the total rainfall and average of temperature values. Thus we obtained the next four climatic variables: (1) Total rainfall in the dry season, (2) Total rainfall in the rainy season, (3) Maximum temperature in the dry season and (4) Maximum temperature in the rainy season. The seasons observed were confirmed using the rainfall trends in the Amazon from the past eight decades [49]. Finally, the last environmental variable measured was the mean municipality altitude extracted from EarthEnv with 1 km² cell-size resolution [50].
2.5. Biological Diversity variables
We used data from birds, mammals, amphibian species richness and endemism as biological diversity proxy. We used them due to high quality data availability for these three groups commonly used in macro ecological studies [51,52,53]. These data were extracted from the Patterns of Vertebrate Diversity and Protection in Brazil database [54]. Those variables were fixed for all the years studied due to the absence of yearly information and represented on maps the zonal average by municipality to make comparisons with the other variables analyzed and its possible impact on malaria risk.
2.6. Model building
After the variable transformation (common logarithm), we analyzed variable distribution in order to determine if they have a good representation across the study region. Skewed variables were eliminated from the analysis after a graphical method confirmation through the histograms and normality plots (see Figure S3). We also performed a Spearman correlation analysis (p<0.05 of significance) (See Figure S4), finding the most correlated variables (>0.8 of correlation) and eliminating them from the analysis based on the most appropriate biological criteria. The final selected variables are shown in Table 1.
We initially used cluster analysis to identify the spatial pattern of malaria (random, aggregate or uniform) and then, we utilized integrated nested Laplace approximation (INLA) analysis to validate the risk factors (LULC, environmental variables and local diversity) driving malaria risk. Cluster analysis is a technique used to identify groups or observations in a dataset based on the similarity of their attributes. In disease spatial analysis, cluster analysis can be used to identify spatial areas with a high prevalence or incidence of a particular disease. INLA is a Bayesian method used for fitting models to spatial data. It is particularly useful for spatial analysis because it can handle complex spatial structures, including spatial correlation, time dependence, and can provide accurate estimates of uncertainty. In disease spatial analysis, INLA can be used to model the spatial distribution of a disease, taking into account the underlying spatial structure of the data and any potential confounding variable [55]. Using both cluster analysis and INLA together can provide a more comprehensive analysis of disease spatial patterns.
The cluster analysis models were developed using a retrospective spatiotemporal model under permutation probability using a maximal cluster size of 50% of the total annual municipality population using SaTScan™. The null hypothesis of no clustering was rejected when the simulated p-value was lower than or equal to 0.05. For the INLA analysis we used two models for P. vivax and two for P. falciparum, covariates models (see Table 1) and interactions models with the landscape configuration (the land use combinations present in a defined area).
To address the issue of highly uneven population distribution across the Amazonian municipalities the malaria cases were standardized by utilizing the function ’expected’ (expected cases) before incorporating them into the INLA models [56]. Accordingly, we performed two models for each parasite, the first one with the covariates described in Table 1 and the second one with the LULC interactions, that is the relationship between multiple land use land cover types and their combined effect on malaria risk. Once we determined the influence of each combination of LULC on malaria risk through the INLA models, we created a 10 x 10 km mesh with each cell representing a specific geographic area. Using this mesh, we constructed a zonal histogram to identify the LULC combinations present in each cell for each year. Finally, we created annual color-coded maps showing the associated malaria risk values for each LULC combination across the study area.
All the models were performed with non-informative priors. We included an ’ independent and identically distributed (iid) random effects often used to account for overdispersion [57] and a Besag-York-Mollier spatial term where the observations and data in contiguous municipalities may be spatially correlated compared to areas that are further apart [56,58].
The model choice was based on the fit and adequacy, the cross-validation check via conditional predictive ordinate (CPO) values, the log likelihood, the dispersion, and the correlation between the mean fitted values and the observed cases. All analysis were performed using the R language (R Core Team, 2022). The correlation analysis was performed using the R package Vegan [61]; the expected values were calculated with the SpatialEpi R package, the neighborhood matrix with the spdep R package, for the spatiotemporal models, we used the R package INLA 21.11.22 [55,62] and the coefficient plots were created using coefINLA R package [63], for the maps, zonal statistics and zonal histograms we used QGIS 3.8.2 (2018).
3. Results
3.1. Malaria cases
In total, 2,827,546 cases were reported, whereas P. vivax cases were the most abundant (85.2% of cases), followed by P. falciparum (13.7% of cases) and mixed forms (0.9% of cases). In general, from 2007-2018 there was a decreasing trend for P. vivax and P. falciparum cases, both peaking in 2007. The northern zone in the Amazon region concentrated the largest quantity of cases (Figures S5 and S6), for both P. vivax and P. falciparum. In 2007 the Amazonas state (AM) registered the highest number of cases (total cases), with 203,164 cases that represented 38.3% of all the cases from 2007-2018.
There were areas with absence or rare cases, where the relative risk maps, however, showed positive risk. Another region that presents high API and relative risk is the northern areas in the Amapá state, a state composed mainly by forest cover, grassland and a big river cover due to the mouth of the Amazon river. Over the years, the API relative risk in the northwest Amazon region has consistently increased. This area is mostly characterized by grasslands and pastures that may or may not be grazed, and forms the ecotone between the savannahs of the Orinocense plains and the Amazon biome. Additionally, this region has experienced significant natural habitat modification in the past two decades (see S8). Regarding P. falciparum, the pattern remains quite similar, albeit with fewer risk values and smaller clusters. The Amazon’s northwestern and northeastern regions also exhibited elevated API values and positive risk values (see Figure S6).
3.2. Spatial clusters
According to our analysis, we have identified three distinct clusters for both P. vivax and P. falciparum, each with varying levels of risk, geographic coverage, time windows, and location (See Table 2). The clusters associated with P. vivax had larger expected and observed cases, indicating a higher incidence of this strain of the disease in the affected areas. Additionally, our findings revealed that cluster number 2 for falciparum malaria had a consistent location within regions that have experienced significant natural cover transformation over the past two decades, specifically in the Para state (North east Amazon zone).
3.3. LULC change
During 2007-2018 there was a notable land use change (Figure 1). The forest formation in the northern area of Mato Grosso, as well as in nearly all of Acre, Rondonia, and Amazonas states, showed a significant decline. Porto Velho – RO had one of the highest negative trends in all of the Amazon region. In 40 municipalities there was a reduction of approximately 10% to 22% of forest cover in the period. Grassland had a cover reduction as well but differently from forest formation, the higher percentage change was in the south west and south east parts of the Amazon region (Mato Grosso, Tocantins and Maranhão states). Temporary crops had a notable increase within the agriculturally expansive states (Mato Grosso, Maranhão, and Pará). We want to remark that those changes are more accented in smaller municipalities, due to the fact those are maps that have been represented in proportion (land use area / municipality total area * 100).
3.4. Diversity variables
The Acre, western Amazonas and the north of Roraima States contained the greatest bird richness values. In the Mato Grosso state, the southern region also shows a high number of bird species due to high influence of the Pantanal wetlands. Para and eastern Maranhão states showed high mean endemic bird species number, the other states showed smaller numbers of endemic species even in the absence of information for Acre and some municipalities of Amazonas, Roraima and Amapá. Finally, the Tocantins state exhibited the highest number of endemic amphibians (Figure 1).
3.5. Covariate significance
After identifying over dispersion in both P. vivax and P. falciparum cases, we opted to employ the zero-inflated negative binomial error distribution for the covariates model and the negative binomial family for the interactions models. For P. vivax covariate model, the cpo values ranged from 0 to 0.99 with a mean of 0.43, for the P. falciparum covariate model, the cpo values ranged from 0 to 0.99 with a mean of 0.62. The Table S9, S10 and the Figure 2 shows the average and range values for each covariate. There was a difference in the effects of each covariate for P. vivax and P. falciparum risk. Forest formation had a positive effect on the relative risk for both Plasmodium species. Endemic amphibians, endemic birds, grassland, pasture, temporary crops and urban infrastructure had a negative effect on the relative risk of P. vivax. For P. falciparum, endemic birds, pasture, temporary crops, and urban infrastructure had a negative effect on the relative risk.
3.6. Interactions models and effect maps
We found 50 unique landscape configuration combinations from 2007 to 2018 (See the example for the 2018, Figure S9). In the INLA interaction models we estimate the mean effect for every possible combination (57 combinations for the six LULC categories used), of which we found four positive and seven negative significant landscape configurations for P. vivax model and one positive and one negative significant for P. falciparum models (See Table S11). For P. vivax, the landscape configuration that showed the highest average effect was (1) Grassland * River Lake and Ocean (2) Pasture * Grassland * Temporary crops (3) Forest Formation * River Lake and Ocean and (4) Pasture * Forest Formation * Grassland. The other seven combinations all had a negative effect on estimated risk, with the strongest negative effect being for Forest formation * Urban infrastructure. In the case of P. falciparum, we found only two landscape significant combinations, (Main reason why we did not make maps representing the average effect in each 10 * 10 square, we would have only 2 colors represented which would not be informative), (1) Grassland * River Lake and Ocean with positive risk effect and (2) Forest Formation * Grassland * River Lake and Ocean with negative mean effect. All of these interaction effects and single land use effects were mapped for each year (see Figure 3) for P. vivax in order to see in more detail each effect on the spatial interaction pattern in all the analyzed years. For P. falciparum the cpo values ranged from 0 to 0.99 with a mean of 0.51, in the case of P. vivax the values ranged from 0 to 0.98 with a mean of 0.31.
4. Discussion
Our findings suggest that the risk of malaria is influenced by a complex interaction of ecological and anthropogenic factors that determine a non-random distribution. One notable factor is the richness and endemism of amphibians, mammals, and birds, which appears to reduce the risk of malaria. Additionally, the presence of forest was found to have a positive effect on malaria risk, but this relationship was dependent on the contact with anthropic land uses where humans inhabit. The covers of anthropic activities were found to reduce the malaria risk, possibly due to the vector habitat loss and homogenization of the landscape. However, when these land use covers came into contact with other land uses such as water cover and natural habitats of the vector, the effect was reversed, and the risk of malaria increased.
The detected clusters suggest that malaria cases distribution was far from random, and display the same trend with past investigations showing high malaria rates in the municipalities Mâncio Lima - AC, Rodrigues Alves - AC and Cruzeiro do Sul – AC [41] and the other municipalities that make up each of the clusters, mainly the Amazonas, Northern Acre and the western zone of Para states. Permutational and Bayesian analysis present similarity in the spatial pattern, where the largest clusters contain municipalities with highest risk values due to highly suitable conditions for malaria transmission.
From the 53 Brazilian municipalities located on the border with Peru, Colombia, Venezuela, Suriname, Guyana, and French Guiana, 39 presented high risk values, consistent with the investigation of [4], that reviewed the spatialization of malaria in Brazil. This reaffirms the importance of carrying out early control and prevention alerts, due to the combination of high migration rates and their remote locations from larger health centers and political administrative centers, it is anticipated that these municipalities will be the most affected areas in the future.
The P. vivax and P. falciparum spatial patterns were differentiated. Those differences are still not completely understood and might be due multiple reasons. For instance, the Duffy gene is randomly distributed in the population and more frequently found in Afro-descendants from the West African region [64], the difference in the Plasmodium species niches [4], the Plasmodium species time of gametocyte production and their lifespan [65], or the relapses, a blood-stage infection only for P. vivax and P. ovale, arising from the activation of hypnozoites after the primary infection [66]. On the other hand, the Brazilian government launched a campaign in 2003 for the prevention and control of malaria (acronym in Portuguese PNCM) where its process and result indicators are specifically the percentage of P. falciparum cases, autochthonous cases of P. falciparum, parasitic index falciparum annual (IFA), among others meaning this differential control effort [67].
Although climatic variables are very important in malaria transmission at local scales, no detectable effect was found for our lattice dataset at the municipality level for explaining annual risk. At the biome level, the spatial and temporal scale at which the climatic variables were measured can affect the inferred malaria cases-climatic influence [68]. Although micro-scale environmental characteristics are lost when we aggregate data for a year at the municipality level (such as the differences in the land uses temperature), biome-scale models are a fundamental tool due to the fact that epidemiological data are frequently reported at the administrative regions [69]. In addition, the primary socio-ecological processes that lead to the rise and resurgence of zoonotic diseases may take place on a biome-scale level [70,71,72].
The anthropic land uses like pasture, temporary crops and urban infrastructure had a negative effect on malaria transmission risk. However, in the interaction models, various landscape combinations had a positive effect on malaria transmission where those anthropic land uses were present (e.g. Pasture * Forest formation * Grassland in P. vivax), thus corroborating that human activities such as cattle ranching, grazing, or mining (not analyzed in this model but with much existing information on the positive influence on malaria infections) by themselves do not represent all the risk, but rather, the contact zones and landscape configuration of the areas where the main vectors inhabit. Several investigations have shown that deforestation, changes in land use, and anthropic activities are related to the malaria transmission in the Amazon, in some cases with positive effect [15,16,73], in others negative effect [74], demonstrating that the LULC influence is highly context specific [75].
Although the Anopheles species populations per se do not have a perfect correlation with malaria cases, the habitat suitability mediated by the environment is a factor that determines the probability of contact between humans and the pathogen [40]. The prediction and habitat suitability maps of the primary vectors of malaria (A. darlingi and A. nuneztovari) throughout the Amazon biome [76] show areas of high suitability in common with areas of positive effect on the transmission of the maps made from effect of landscape interactions (e.g. eastern Amazon state), where forest cover or water were always present, optimal places for the oviposition, development and growth of mosquitoes [3]. Although some Anopheles species can adapt to modified environments [8,12,77], they still need the forest for its life cycle [39]. On the other hand, is important to mention that the malaria cases are influenced not only by the forest cover but the activities on it, like forest clearance [8,12] and changes in the habitat suitability due to the forest disturbance [77], finally, the areas with more forest cover are the areas with higher deforestation rates [10].
Zoonotic disease transmission is also subject to changes in landscape heterogeneity and configuration due to the changes in contact zones, distribution and availability of vectors, pathogens, and hosts [78]. According to long-term mathematical modeling, malaria population dynamics in developing forest areas show that cases behave as a convex declining curve, the cases increasing until reaching a peak and descending until reaching a lower point close to zero due to the reduction of forest formation and the social incomes related to health facilities [20]. We believe that the effects of landscape interactions are correlated with the heterogeneity of the habitat, in this sense, in cells with a greater number of land uses (greater diversity of habitats) and with the presence of preserved forest, the contact between the infected vector and human greatly increases and is reduced as landscape homogenization occurs with a predominance of anthropogenic land uses. On the other hand, it is worth mentioning that although the reduction of forest is a factor that could affect the populations of some Anopheles species, the appearance of species adapted to modified environments can play a fundamental role in the transmission of homogenized environments, and in addition to the appearance of other diseases of medical importance mediated by anthropophilic vectors such as dengue, zika, chagas, yellow fever, etc [79,80].
In relation to the influence of diversity on the prevalence of malaria, the intermediate disturbance hypothesis is something that could support ecosystems with a medium anthropic intervention that present high values of species richness [81]. As mentioned earlier, it is worth noting that municipalities with significant variations in their spatial characteristics may also demonstrate elevated levels of both malaria cases and species diversity. In other words, areas with high spatial heterogeneity, such as complex landscapes configurations, may have a higher likelihood of malaria outbreaks. Accordingly, the relationship between malaria cases and species richness (speaking of predator diversity and non-competent hosts) could be correlative but not causal [71]. However, several investigations support the hypothesis of the dilution effect with explanation of the underlying mechanisms that could help to reduce cases. In Central America, the decrease in amphibian populations caused by the pathogenic fungus Batrachochytrium dendrobatidis has been found to have a direct correlation with the rise in malaria cases. This aligns with the finding that a higher number of endemic species in an area can have a negative impact on the risk of malaria transmission [82].
While the exact contribution of birds to human malaria infections remains unclear, the impact of native bird species on malaria cases may be attributed to a comparable mechanism as observed in the study conducted by [33]. Their findings revealed that an increase in bird diversity resulted in a decrease in the incidence of West Nile virus due to the host competition. Also the non-competent host hypothesis could explain the importance of the bird and mammal’s community, the greater the diversity, the bigger the number of non-competitive hosts for various types of pathogens [83]. The bird richness was highly correlated with the mammal richness, so it is possible that mammals also play a fundamental role in malaria control, e.g. the high diversity of warm-blooded hosts decreased malaria cases in the Atlantic Forest in Brazil [84], demonstrating the importance of the availability of several hosts to decrease the probability of infection of humans by being bitten by infected mosquitoes.
On the other hand, and taking the avian malaria transmission system as a model, the richness and structure of the bird community and the characteristics of the landscape are determining factors in explaining the prevalence of Plasmodium [85]. However, the conclusions from these studies are scale-dependent, diverse host communities commonly inhibit the spread of parasites on small scales and follow a generally hump-shaped nonlinear relationship [86]. Our methodological approach enabled us to detect the effect of the endemics of birds, mammals, and amphibians and the incidence of malaria in humans. This highlights the importance in identifying and analyzing the complex relationships between different biological factors influencing the spread of this disease. However, understanding the patterns of the composition of the possible hosts (community structure, that is, a step beyond richness) at different temporal events is crucial to predict where and specifically how specific relationships between diversity and disease occur in natural systems [87].
5. Conclusions
Malaria is part of complex system that includes several components with specific characteristics, including human and vector population dynamics, imperfect detection, recrudescence, and several other factors. It´s patterns occur at multiple scales such as local, regional and biome. The LULC and interaction analysis at biome scale, indicate that forest formations alone are not responsible for driving most of the transmission risk. The biological endemic diversity context in addition to landscape composition modulate overall risk, areas with the presence of humans living close to the forest, mostly at areas with active deforestation predominantly anthropogenic landscapes and smaller values of richness and endemic species, represent the typical pathogenic landscape of the high-risk areas. Thus, in all over the Amazon biome, it is important to plan a long-term sustainable development such as ecotourism, agroforestry, sustainable forestry, sustainable fisheries, renewable energy without abruptly modifying the ecosystem cycles and their components and not take as an excuse the homogenization of the landscape with anthropic activities and deforestation for malaria control. The bird, and amphibian patterns suggest a potential effect in the cases reduction. We recommend future research with time replicates, community composition analysis in order to directly test the dilution effect and thus be able to give another argument in favor of conservation and nature-based solutions.
Supplementary Materials
The following supporting information can be downloaded at the website of this paper posted on Preprints.org. Figure S1. Study area: The legal Amazon municipalities in gray, all the municipalities of Brazil in white with faded border color. and in black line the American countries. Figure S2. Climatic zones in the studied area in order to extract the precipitation and temperature data for each season. A. The total mean rainfall for each month for each climatic zone (Y axis: 0-1500 mm of rain, X axis: each month represented by color bars from January to December) showing the differences in the rain and dry seasons for the region. B. Municipalities centroids used to determine the climatic zone (Dashed lines limit), if the centroid fall into the square (500 * 500 km) the season was determined by the rain pattern of its correspondent climatic zone. Figure S3. Covariate´s histogram plots. Figure S4. Correlation plot based on the Pearson correlation analysis (significance p value=0.01), the X marked correlations were non-significant. Figure S5. (GIF Plasmodium vivax). Plasmodium vivax maps in time sequence, in the left column, the RR (relative risk calculated by the INLA model), in the right column the API (Annual parasite index), for each municipality between the year 2007 to 2018. Figure S6. (GIF Plasmodium falciparum). Plasmodium falciparum maps in time sequence, in the left column RR (relative risk calculated by the INLA model), in the right column the API (Annual parasite index) the for each municipality between the year 2007 to 2018. Figure S7. Detected outbreak clusters in the studied area. The map on the left represents the three clusters for Malaria vivax cases, the map on the right represents the three clusters for malaria falciparum cases. Figure S8. Land use and land cover map for the year 2018 in the legal Amazon (100 m pixel resolution). Figure S9. Land use and land cover configuration for the artificial grid of 10 km * 10 km for 2018. Each letter and color in the legend represents land use type and their unique combinations per cell. T: Temporary crops, F: Forest formation, G: Grassland, P: Pasture, R: River, lake or ocean and U: Urban infrastructure. Table S9. Model estimates for the Plasmodium vivax risk. Table S10. Model estimates for the Plasmodium falciparum risk. Table S11. Model estimates for the Plasmodium falciparum and Plasmodium vivax interactions models. Each letter represents land use type. T: Temporary crops, F: Forest formation, G: Grassland, P: Pasture, R: River, lake or ocean and U: Urban infrastructure. Table S12. First 40 municipalities with the higher predicted cases for the Plasmodium vivax interactions model with its state and IBGE code.
Author Contributions
Conceptualization, WGD, VLL, TSS and RLM.; methodology, WGD and RLL.; software, WGD and RLL.; validation, WGD and RLM.; formal analysis, WGD, VLL, TSS and RLM.; investigation, WGD, VLL, TSS and RLM.; data curation, WGD; writing—original draft preparation, WGD, RLM and VLL.; writing—review and editing, WGD, VLL, TSS and RLM.; visualization, WGD.; supervision, WGD.; project administration, WGD and VLL.;. All authors have read and agreed to the published version of the manuscript.
Funding
WGD was supported by CAPES, doctoral fellowship Process 23108.014608/2019-37. RLM was supported by Bryce Carmine and Anne Carmine (née Percival), through the Massey University Foundation
Acknowledgments
We thank Thiago Izzo, Martha Suárez-Mutis, Ricardo Augusto dos Passos and Jose Joaquin Carvajal for discussions about the research results and its valuable knowledge in malaria and ecology. RLM was supported by Bryce Carmine and Anne Carmine (née Percival), through the Massey University Foundation.
Conflicts of Interest
The authors declare no conflict of interest Any role of the funders in the design of the study; in the collection, analyses or interpretation of data; in the writing of the manuscript; or in the decision to publish the results must be declared in this section. If there is no role, please state “The funders had no role in the design of the study; in the collection, analyses, or interpretation of data; in the writing of the manuscript; or in the decision to publish the results”.
References
- World Health Organization. World Malaria Report 2021; World Health Organization: Geneva, 2021.
- Ayala, M. J. C.; Bastos, L. S.; Villela, D. A. M. On Multifactorial Drivers for Malaria Rebound in Brazil: A Spatio-Temporal Analysis. Malar J, 2022, 21 (1), 52. [CrossRef]
- Hiwat, H.; Bretas, G. Ecology of Anopheles Darlingi Root with Respect to Vector Importance: A Review. Parasites Vectors, 2011, 4 (1), 177. [CrossRef]
- Carlos, B. C.; Rona, L. D. P.; Christophides, G. K.; Souza-Neto, J. A. A Comprehensive Analysis of Malaria Transmission in Brazil. Pathogens and Global Health, 2019, 113 (1), 1–13. [CrossRef]
- Ferreira, M. U.; Castro, M. C. Challenges for Malaria Elimination in Brazil. Malar J, 2016, 15 (1), 284. [CrossRef]
- Pimenta, P. F.; Orfano, A. S.; Bahia, A. C.; Duarte, A. P.; Ríos-Velásquez, C. M.; Melo, F. F.; Pessoa, F. A.; Oliveira, G. A.; Campos, K. M.; Villegas, L. M.; et al. An Overview of Malaria Transmission from the Perspective of Amazon Anopheles Vectors. Mem. Inst. Oswaldo Cruz, 2015, 110 (1), 23–47. [CrossRef]
- Sánchez-Ribas, J.; Oliveira-Ferreira, J.; Gimnig, J. E.; Pereira-Ribeiro, C.; Santos-Neves, M. S. A.; Silva-do-Nascimento, T. F. Environmental Variables Associated with Anopheline Larvae Distribution and Abundance in Yanomami Villages within Unaltered Areas of the Brazilian Amazon. Parasites Vectors, 2017, 10 (1), 571. [CrossRef]
- Burkett-Cadena, N. D.; Vittor, A. Y. Deforestation and Vector-Borne Disease: Forest Conversion Favors Important Mosquito Vectors of Human Pathogens. Basic and Applied Ecology, 2018, 26, 101–110. [CrossRef]
- Hahn, M. B.; Gangnon, R. E.; Barcellos, C.; Asner, G. P.; Patz, J. A. Influence of Deforestation, Logging, and Fire on Malaria in the Brazilian Amazon. PLoS ONE, 2014, 9 (1), e85725. [CrossRef]
- Lima, J. M. T.; Vittor, A.; Rifai, S.; Valle, D. Does Deforestation Promote or Inhibit Malaria Transmission in the Amazon? A Systematic Literature Review and Critical Appraisal of Current Evidence. 2017, 11.
- MacDonald, A. J.; Mordecai, E. A. Amazon Deforestation Drives Malaria Transmission, and Malaria Burden Reduces Forest Clearing. Proc. Natl. Acad. Sci. U.S.A., 2019, 116 (44), 22212–22218. [CrossRef]
- Barros, F. S. M.; Honório, N. A. Deforestation and Malaria on the Amazon Frontier: Larval Clustering of Anopheles Darlingi (Diptera: Culicidae) Determines Focal Distribution of Malaria. The American Journal of Tropical Medicine and Hygiene, 2015, 93 (5), 939–953. [CrossRef]
- Vittor, A. Y.; Pan, W.; Gilman, R. H.; Tielsch, J.; Glass, G.; Shields, T.; Sánchez-Lozano, W.; Pinedo, V. V.; Salas-Cobos, E.; Flores, S.; et al. Linking Deforestation to Malaria in the Amazon: Characterization of the Breeding Habitat of the Principal Malaria Vector,. 2013, 16.
- Barbosa, L. M. C.; Scarpassa, V. M. Blood-Feeding Behavior of Anopheles Species (Diptera: Culicidae) in the District of Ilha de Santana, State of Amapá, Eastern Brazilian Amazon. Rev. Bras. entomol., 2021, 65 (4), e20200048. [CrossRef]
- Chaves, L. S. M.; Bergo, E. S.; Conn, J. E.; Laporta, G. Z.; Prist, P. R.; Sallum, M. A. M. Anthropogenic Landscape Decreases Mosquito Biodiversity and Drives Malaria Vector Proliferation in the Amazon Rainforest. PLoS ONE, 2021, 16 (1), e0245087. [CrossRef]
- Conn, J. E.; Segura, M. N. O.; Wilkerson, R. C.; Schlichting, C. D.; Póvoa, M. M.; Wirtz, R. A.; de Souza, R. T. L. Emergence of a New Neotropical Malaria Vector Facilitated by Human Migration and Changes in Land Use. The American Journal of Tropical Medicine and Hygiene, 2002, 66 (1), 18–22. [CrossRef]
- dos Reis, I. C.; Codeço, C. T.; Degener, C. M.; Keppeler, E. C.; Muniz, M. M.; de Oliveira, F. G. S.; Cortês, J. J. C.; de Freitas Monteiro, A.; de Souza, C. A. A.; Rodrigues, F. C. M.; et al. Contribution of Fish Farming Ponds to the Production of Immature Anopheles Spp. in a Malaria-Endemic Amazonian Town. Malar J, 2015, 14 (1), 452. [CrossRef]
- Rejmánková, E.; Grieco, J.; Achee, N.; Roberts, D. R. Ecology of Larval Habitats. In Anopheles mosquitoes - New insights into malaria vectors; Manguin, S., Ed.; InTech, 2013. [CrossRef]
- Roux, O.; Robert, V. Larval Predation in Malaria Vectors and Its Potential Implication in Malaria Transmission: An Overlooked Ecosystem Service? Parasites Vectors, 2019, 12 (1), 217. [CrossRef]
- Baeza, A.; Santos-Vega, M.; Dobson, A. P.; Pascual, M. The Rise and Fall of Malaria under Land-Use Change in Frontier Regions. Nat Ecol Evol, 2017, 1 (5), 0108. [CrossRef]
- Cheong, Y. L.; Leitão, P. J.; Lakes, T. Assessment of Land Use Factors Associated with Dengue Cases in Malaysia Using Boosted Regression Trees. Spatial and Spatio-temporal Epidemiology, 2014, 10, 75–84. [CrossRef]
- Kalbus, A.; de Souza Sampaio, V.; Boenecke, J.; Reintjes, R. Exploring the Influence of Deforestation on Dengue Fever Incidence in the Brazilian Amazonas State. PLoS ONE, 2021, 16 (1), e0242685. [CrossRef]
- Laurance, S. G. W.; Meyer Steiger, D. B.; Ritchie, S. A. Land Use Influences Mosquito Communities and Disease Risk on Remote Tropical Islands: A Case Study Using a Novel Sampling Technique. The American Journal of Tropical Medicine and Hygiene, 2016, 94 (2), 314–321. [CrossRef]
- Nava, A.; Shimabukuro, J. S.; Chmura, A. A.; Luz, S. L. B. The Impact of Global Environmental Changes on Infectious Disease Emergence with a Focus on Risks for Brazil. ILAR Journal, 2017, 58 (3), 393–400. [CrossRef]
- Vanwambeke, S. O.; Lambin, E. F.; Eichhorn, M. P.; Flasse, S. P.; Harbach, R. E.; Oskam, L.; Somboon, P.; van Beers, S.; van Benthem, B. H. B.; Walton, C.; et al. Impact of Land-Use Change on Dengue and Malaria in Northern Thailand. EcoHealth, 2007, 4 (1), 37–51. [CrossRef]
- Ostfeld, R.; Glass, G.; Keesing, F. Spatial Epidemiology: An Emerging (or Re-Emerging) Discipline. Trends in Ecology & Evolution, 2005, 20 (6), 328–336. [CrossRef]
- Pepey, A.; Souris, M.; Vantaux, A.; Morand, S.; Lek, D.; Mueller, I.; Witkowski, B.; Herbreteau, V. Studying Land Cover Changes in a Malaria-Endemic Cambodian District: Considerations and Constraints. Remote Sensing, 2020, 12 (18), 2972. [CrossRef]
- Muylaert, R.; Sabino-Santos, G.; Prist, P.; Oshima, J.; Niebuhr, B.; Sobral-Souza, T.; Oliveira, S.; Bovendorp, R.; Marshall, J.; Hayman, D.; et al. Spatiotemporal Dynamics of Hantavirus Cardiopulmonary Syndrome Transmission Risk in Brazil. Viruses, 2019, 11 (11), 1008. [CrossRef]
- Suzán, G.; Marcé, E.; Giermakowski, J. T.; Mills, J. N.; Ceballos, G.; Ostfeld, R. S.; Armién, B.; Pascale, J. M.; Yates, T. L. Experimental Evidence for Reduced Rodent Diversity Causing Increased Hantavirus Prevalence. PLoS ONE, 2009, 4 (5), e5461. [CrossRef]
- Keesing, F.; Brunner, J.; Duerr, S.; Killilea, M.; LoGiudice, K.; Schmidt, K.; Vuong, H.; Ostfeld, R. S. Hosts as Ecological Traps for the Vector of Lyme Disease. Proc. R. Soc. B., 2009, 276 (1675), 3911–3919. [CrossRef]
- Johnson, P. T. J.; Lund, P. J.; Hartson, R. B.; Yoshino, T. P. Community Diversity Reduces Schistosoma Mansoni Transmission, Host Pathology and Human Infection Risk. Proc. R. Soc. B., 2009, 276 (1662), 1657–1663. [CrossRef]
- Civitello, D. J.; Cohen, J.; Fatima, H.; Halstead, N. T.; Liriano, J.; McMahon, T. A.; Ortega, C. N.; Sauer, E. L.; Sehgal, T.; Young, S.; et al. Biodiversity Inhibits Parasites: Broad Evidence for the Dilution Effect. Proc. Natl. Acad. Sci. U.S.A., 2015, 112 (28), 8667–8671. [CrossRef]
- Swaddle, J. P.; Calos, S. E. Increased Avian Diversity Is Associated with Lower Incidence of Human West Nile Infection: Observation of the Dilution Effect. PLoS ONE, 2008, 3 (6), e2488. [CrossRef]
- Louca, V.; Lucas, M. C.; Green, C.; Majambere, S.; Fillinger, U.; Lindsay, S. W. Role of Fish as Predators of Mosquito Larvae on the Floodplain of the Gambia River. J Med Entomol, 2009, 46 (3), 546–556. [CrossRef]
- Collins, C. M.; Bonds, J. A. S.; Quinlan, M. M.; Mumford, J. D. Effects of the Removal or Reduction in Density of the Malaria Mosquito, ANOPHELES GAMBIAE s.l ., on Interacting Predators and Competitors in Local Ecosystems. Med Vet Entomol, 2019, 33 (1), 1–15. [CrossRef]
- Kweka, E. J.; Zhou, G.; Gilbreath, T. M.; Afrane, Y.; Nyindo, M.; Githeko, A. K.; Yan, G. Predation Efficiency of Anopheles Gambiae Larvae by Aquatic Predators in Western Kenya Highlands. Parasites Vectors, 2011, 4 (1), 128. [CrossRef]
- Russell, M. C.; Herzog, C. M.; Gajewski, Z.; Ramsay, C.; El Moustaid, F.; Evans, M. V.; Desai, T.; Gottdenker, N. L.; Hermann, S. L.; Power, A. G.; et al. Both Consumptive and Non-Consumptive Effects of Predators Impact Mosquito Populations and Have Implications for Disease Transmission. eLife, 2022, 11, e71503. [CrossRef]
- S.P. Singh. Biological Control of Mosquitoes by Insectivorous Flycatcher Birds. Journal of entomological research, 2013, v. 37 (4), 359–364.
- Tadei, W. P.; Scarpassa, V. M.; Thatcher, B. D.; Santos, J. M.; Rafael, M. S.; Rodrigues, I. B. Ecologic Observations on Anopheline Vectors of Malaria in the Brazilian Amazon. The American Journal of Tropical Medicine and Hygiene, 1998, 59 (2), 325–335. [CrossRef]
- Achee, N. L.; Grieco, J. P.; Masuoka, P.; Andre, R. G.; Roberts, D. R.; Thomas, J.; Briceno, I.; King, R.; Rejmankova, E. Use of Remote Sensing and Geographic Information Systems to Predict Locations of Anopheles Darlingi-Positive Breeding Sites Within the Sibun River in Belize, Central America. 2006, 12.
- Kohara Melchior, L. A.; Chiaravalloti Neto, F. Spatial and Spatio-Temporal Analysis of Malaria in the State of Acre, Western Amazon, Brazil. Geospat Health, 2016, 11 (3). [CrossRef]
- Malha Municipal | IBGE https://www.ibge.gov.br/geociencias/organizacao-do-territorio/malhas-territoriais/15774-malhas.html?=&t=acesso-ao-produto (accessed Apr 12, 2023).
- Dados para cidadão a partir da fonte de dados do Sivep-Malária e do Sinan, para notificações do Brasil de 2007 a 2023. Dados do Sivep-Malária atualizados em 29/03/2023. Dados do Sinan atualizados em: 14/03/2023. https://public.tableau.com/views/Dadosparacidado_201925_03_2020/Incio?%3Adisplay_static_image=y&%3AbootstrapWhenNotified=true&%3Aembed=true&%3Alanguage=en-US&:embed=y&:showVizHome=n&:apiID=host0#navType=0&navSrc=Parse (accessed Apr 12, 2023).
- População | IBGE https://www.ibge.gov.br/estatisticas/sociais/populacao.html (accessed Apr 12, 2023).
- Souza, C. M.; Z. Shimbo, J.; Rosa, M. R.; Parente, L. L.; A. Alencar, A.; Rudorff, B. F. T.; Hasenack, H.; Matsumoto, M.; G. Ferreira, L.; Souza-Filho, P. W. M.; et al. Reconstructing Three Decades of Land Use and Land Cover Changes in Brazilian Biomes with Landsat Archive and Earth Engine. Remote Sensing, 2020, 12 (17), 2735. [CrossRef]
- Gwitira, I.; Murwira, A.; Zengeya, F. M.; Masocha, M.; Mutambu, S. Modelled Habitat Suitability of a Malaria Causing Vector (Anopheles Arabiensis) Relates Well with Human Malaria Incidences in Zimbabwe. Applied Geography, 2015, 60, 130–138. [CrossRef]
- Parham, P. E.; Michael, E. Modeling the Effects of Weather and Climate Change on Malaria Transmission. Environmental Health Perspectives, 2010, 118 (5), 620–626. [CrossRef]
- Harris, I.; Jones, P. D.; Osborn, T. J.; Lister, D. H. Updated High-Resolution Grids of Monthly Climatic Observations - the CRU TS3.10 Dataset: UPDATED HIGH-RESOLUTION GRIDS OF MONTHLY CLIMATIC OBSERVATIONS. Int. J. Climatol., 2014, 34 (3), 623–642. [CrossRef]
- Satyamurty, P.; de Castro, A. A.; Tota, J.; da Silva Gularte, L. E.; Manzi, A. O. Rainfall Trends in the Brazilian Amazon Basin in the Past Eight Decades. Theor Appl Climatol, 2010, 99 (1–2), 139–148. [CrossRef]
- Amatulli, G.; Domisch, S.; Tuanmu, M.-N.; Parmentier, B.; Ranipeta, A.; Malczyk, J.; Jetz, W. A Suite of Global, Cross-Scale Topographic Variables for Environmental and Biodiversity Modeling. Sci Data, 2018, 5 (1), 180040. [CrossRef]
- Marini, M. A.; Garcia, F. I. Bird Conservation in Brazil. Conservation Biology, 2005, 19 (3), 665–671. [CrossRef]
- Costa, L. P.; Leite, Y. L. R.; Mendes, S. L.; Ditchfield, A. D. Mammal Conservation in Brazil. Conservation Biology, 2005, 19 (3), 672–679. [CrossRef]
- Guerra, V.; Jardim, L.; Llusia, D.; Márquez, R.; Bastos, R. P. Knowledge Status and Trends in Description of Amphibian Species in Brazil. Ecological Indicators, 2020, 118, 106754. [CrossRef]
- Jenkins, C. N.; Alves, M. A. S.; Uezu, A.; Vale, M. M. Patterns of Vertebrate Diversity and Protection in Brazil. PLoS ONE, 2015, 10 (12), e0145064. [CrossRef]
- Rue, H.; Martino, S.; Chopin, N. Approximate Bayesian Inference for Latent Gaussian Models by Using Integrated Nested Laplace Approximations. Journal of the Royal Statistical Society: Series B (Statistical Methodology), 2009, 71 (2), 319–392. [CrossRef]
- Moraga, P.; Dean, C.; Inoue, J.; Morawiecki, P.; Noureen, S. R.; Wang, F. Bayesian Spatial Modelling of Geostatistical Data Using INLA and SPDE Methods: A Case Study Predicting Malaria Risk in Mozambique. Spatial and Spatio-temporal Epidemiology, 2021, 39, 100440. [CrossRef]
- Gómez-Rubio, V. Bayesian Inference with INLA; Chapman & Hall/CRC Press: Boca Raton, FL, 2021.
- Besag, J.; York, J.; Mollié, A. Bayesian Image Restoration, with Two Applications in Spatial Statistics. Ann Inst Stat Math, 1991, 43 (1), 1–20. [CrossRef]
- Held, L.; Schrödle, B.; Rue, H. Posterior and Cross-Validatory Predictive Checks: A Comparison of MCMC and INLA. In Statistical Modelling and Regression Structures; Kneib, T., Tutz, G., Eds.; Physica-Verlag HD: Heidelberg, 2010; pp 91–110. [CrossRef]
- Wang, X.; Yue, Y. R.; Faraway, J. J. Bayesian Regression Modeling with INLA; CRC Press, 2018.
- Oksanen, J.; Simpson, G. L.; Blanchet, F. G.; Kindt, R.; Legendre, P.; Minchin, P. R.; O’Hara, R. B.; Solymos, P.; Stevens, M. H. H.; Szoecs, E.; et al. Vegan: Community Ecology Package, 2022.
- Lindgren, F.; Rue, H. Bayesian Spatial Modelling with R - INLA. J. Stat. Soft., 2015, 63 (19). [CrossRef]
- Hess, C. CoefINLA, 2020.
- Langhi, D. M.; Orlando Bordin, J. Duffy Blood Group and Malaria. Hematology, 2006, 11 (5–6), 389–398. [CrossRef]
- Escalante, A. A.; Cepeda, A. S.; Pacheco, M. A. Why Plasmodium Vivax and Plasmodium Falciparum Are so Different? A Tale of Two Clades and Their Species Diversities. Malar J, 2022, 21 (1), 139. [CrossRef]
- White, M. T.; Karl, S.; Koepfli, C.; Longley, R. J.; Hofmann, N. E.; Wampfler, R.; Felger, I.; Smith, T.; Nguitragool, W.; Sattabongkot, J.; et al. Plasmodium Vivax and Plasmodium Falciparum Infection Dynamics: Re-Infections, Recrudescences and Relapses. Malar J, 2018, 17 (1), 170. [CrossRef]
- Programa Nacional de Prevenção e Controle da Malária https://www.gov.br/saude/pt-br/assuntos/saude-de-a-a-z/m/malaria/pncm/programa-nacional-de-prevencao-e-controle-da-malaria-pncm (accessed Apr 12, 2023).
- Jackson, H. B.; Fahrig, L. Are Ecologists Conducting Research at the Optimal Scale?: Is Research Conducted at Optimal Scales? Global Ecology and Biogeography, 2015, 24 (1), 52–63. [CrossRef]
- Lucas, T. C. D.; Nandi, A.; Nguyen, M.; Rumisha, S.; E. Battle, K.; E. Howes, R.; Hendriks, C.; Python, A.; Hancock, P.; Cameron, E.; et al. Model Ensembles with Different Response Variables for Base and Meta Models: Malaria Disaggregation Regression Combining Prevalence and Incidence Data; preprint; Epidemiology, 2019. [CrossRef]
- Eigenbrod, F.; Hecnar, S. J.; Fahrig, L. Sub-Optimal Study Design Has Major Impacts on Landscape-Scale Inference. Biological Conservation, 2011, 144 (1), 298–305. [CrossRef]
- Lambin, E. F.; Tran, A.; Vanwambeke, S. O.; Linard, C.; Soti, V. Pathogenic Landscapes: Interactions between Land, People, Disease Vectors, and Their Animal Hosts. Int J Health Geogr, 2010, 9 (1), 54. [CrossRef]
- McGarigal, K.; Wan, H. Y.; Zeller, K. A.; Timm, B. C.; Cushman, S. A. Multi-Scale Habitat Selection Modeling: A Review and Outlook. Landscape Ecol, 2016, 31 (6), 1161–1175. [CrossRef]
- Oliveira, T. M. P.; Laporta, G. Z.; Bergo, E. S.; Chaves, L. S. M.; Antunes, J. L. F.; Bickersmith, S. A.; Conn, J. E.; Massad, E.; Sallum, M. A. M. Vector Role and Human Biting Activity of Anophelinae Mosquitoes in Different Landscapes in the Brazilian Amazon. Parasites Vectors, 2021, 14 (1), 236. [CrossRef]
- Tangena, J.-A. A.; Thammavong, P.; Wilson, A. L.; Brey, P. T.; Lindsay, S. W. Risk and Control of Mosquito-Borne Diseases in Southeast Asian Rubber Plantations. Trends in Parasitology, 2016, 32 (5), 402–415. [CrossRef]
- Fornace, K. M.; Diaz, A. V.; Lines, J.; Drakeley, C. J. Achieving Global Malaria Eradication in Changing Landscapes. Malar J, 2021, 20 (1), 69. [CrossRef]
- Alimi, T. O.; Fuller, D. O.; Qualls, W. A.; Herrera, S. V.; Arevalo-Herrera, M.; Quinones, M. L.; Lacerda, M. V. G.; Beier, J. C. Predicting Potential Ranges of Primary Malaria Vectors and Malaria in Northern South America Based on Projected Changes in Climate, Land Cover and Human Population. Parasites Vectors, 2015, 8 (1), 431. [CrossRef]
- Loaiza, J. R.; Dutari, L. C.; Rovira, J. R.; Sanjur, O. I.; Laporta, G. Z.; Pecor, J.; Foley, D. H.; Eastwood, G.; Kramer, L. D.; Radtke, M.; et al. Disturbance and Mosquito Diversity in the Lowland Tropical Rainforest of Central Panama. Sci Rep, 2017, 7 (1), 7248. [CrossRef]
- Estrada-Peña, A.; Ostfeld, R. S.; Peterson, A. T.; Poulin, R.; de la Fuente, J. Effects of Environmental Change on Zoonotic Disease Risk: An Ecological Primer. Trends in Parasitology, 2014, 30 (4), 205–214. [CrossRef]
- Schrama, M.; Hunting, E. R.; Beechler, B. R.; Guarido, M. M.; Govender, D.; Nijland, W.; van ‘t Zelfde, M.; Venter, M.; van Bodegom, P. M.; Gorsich, E. E. Human Practices Promote Presence and Abundance of Disease-Transmitting Mosquito Species. Sci Rep, 2020, 10 (1), 13543. [CrossRef]
- Vinod, S. DEFORASTATION AND WATER POLLUTION IMPACT ON MOSQUITOE RELATED EPIDEMIC DISEASES IN NANDED REGION. 2011, 8.
- Svensson, J. R.; Lindegarth, M.; Jonsson, P. R.; Pavia, H. Disturbance–Diversity Models: What Do They Really Predict and How Are They Tested? Proc. R. Soc. B., 2012, 279 (1736), 2163–2170. [CrossRef]
- Springborn, M. R.; Weill, J. A.; Lips, K. R.; Ibáñez, R.; Ghosh, A. Amphibian Collapses Increased Malaria Incidence in Central America *. Environ. Res. Lett., 2022, 17 (10), 104012. [CrossRef]
- Ferraguti, M.; Martínez-de la Puente, J.; Jiménez–Clavero, M. Á.; Llorente, F.; Roiz, D.; Ruiz, S.; Soriguer, R.; Figuerola, J. A Field Test of the Dilution Effect Hypothesis in Four Avian Multi-Host Pathogens. PLoS Pathog, 2021, 17 (6), e1009637. [CrossRef]
- Laporta, G. Z.; Prado, P. I. K. L. de; Kraenkel, R. A.; Coutinho, R. M.; Sallum, M. A. M. Biodiversity Can Help Prevent Malaria Outbreaks in Tropical Forests. PLoS Negl Trop Dis, 2013, 7 (3), e2139. [CrossRef]
- Ferraguti, M.; Martínez-de la Puente, J.; Bensch, S.; Roiz, D.; Ruiz, S.; Viana, D. S.; Soriguer, R. C.; Figuerola, J. Ecological Determinants of Avian Malaria Infections: An Integrative Analysis at Landscape, Mosquito and Vertebrate Community Levels. J Anim Ecol, 2018, 87 (3), 727–740. [CrossRef]
- Halliday, F. W.; Rohr, J. R. Measuring the Shape of the Biodiversity-Disease Relationship across Systems Reveals New Findings and Key Gaps. Nat Commun, 2019, 10 (1), 5032. [CrossRef]
- Mihaljevic, J. R.; Joseph, M. B.; Orlofske, S. A.; Paull, S. H. The Scaling of Host Density with Richness Affects the Direction, Shape, and Detectability of Diversity-Disease Relationships. PLoS ONE, 2014, 9 (5), e97812. [CrossRef]
Figure 1.
The left and center column shows LULC percentage change (%) between the 2007-2018 at the municipality level, the negative values represent a decrease and positive values represent an increase in land use - land cover area of each covariate. The right column shows the average species richness maps at municipality level.
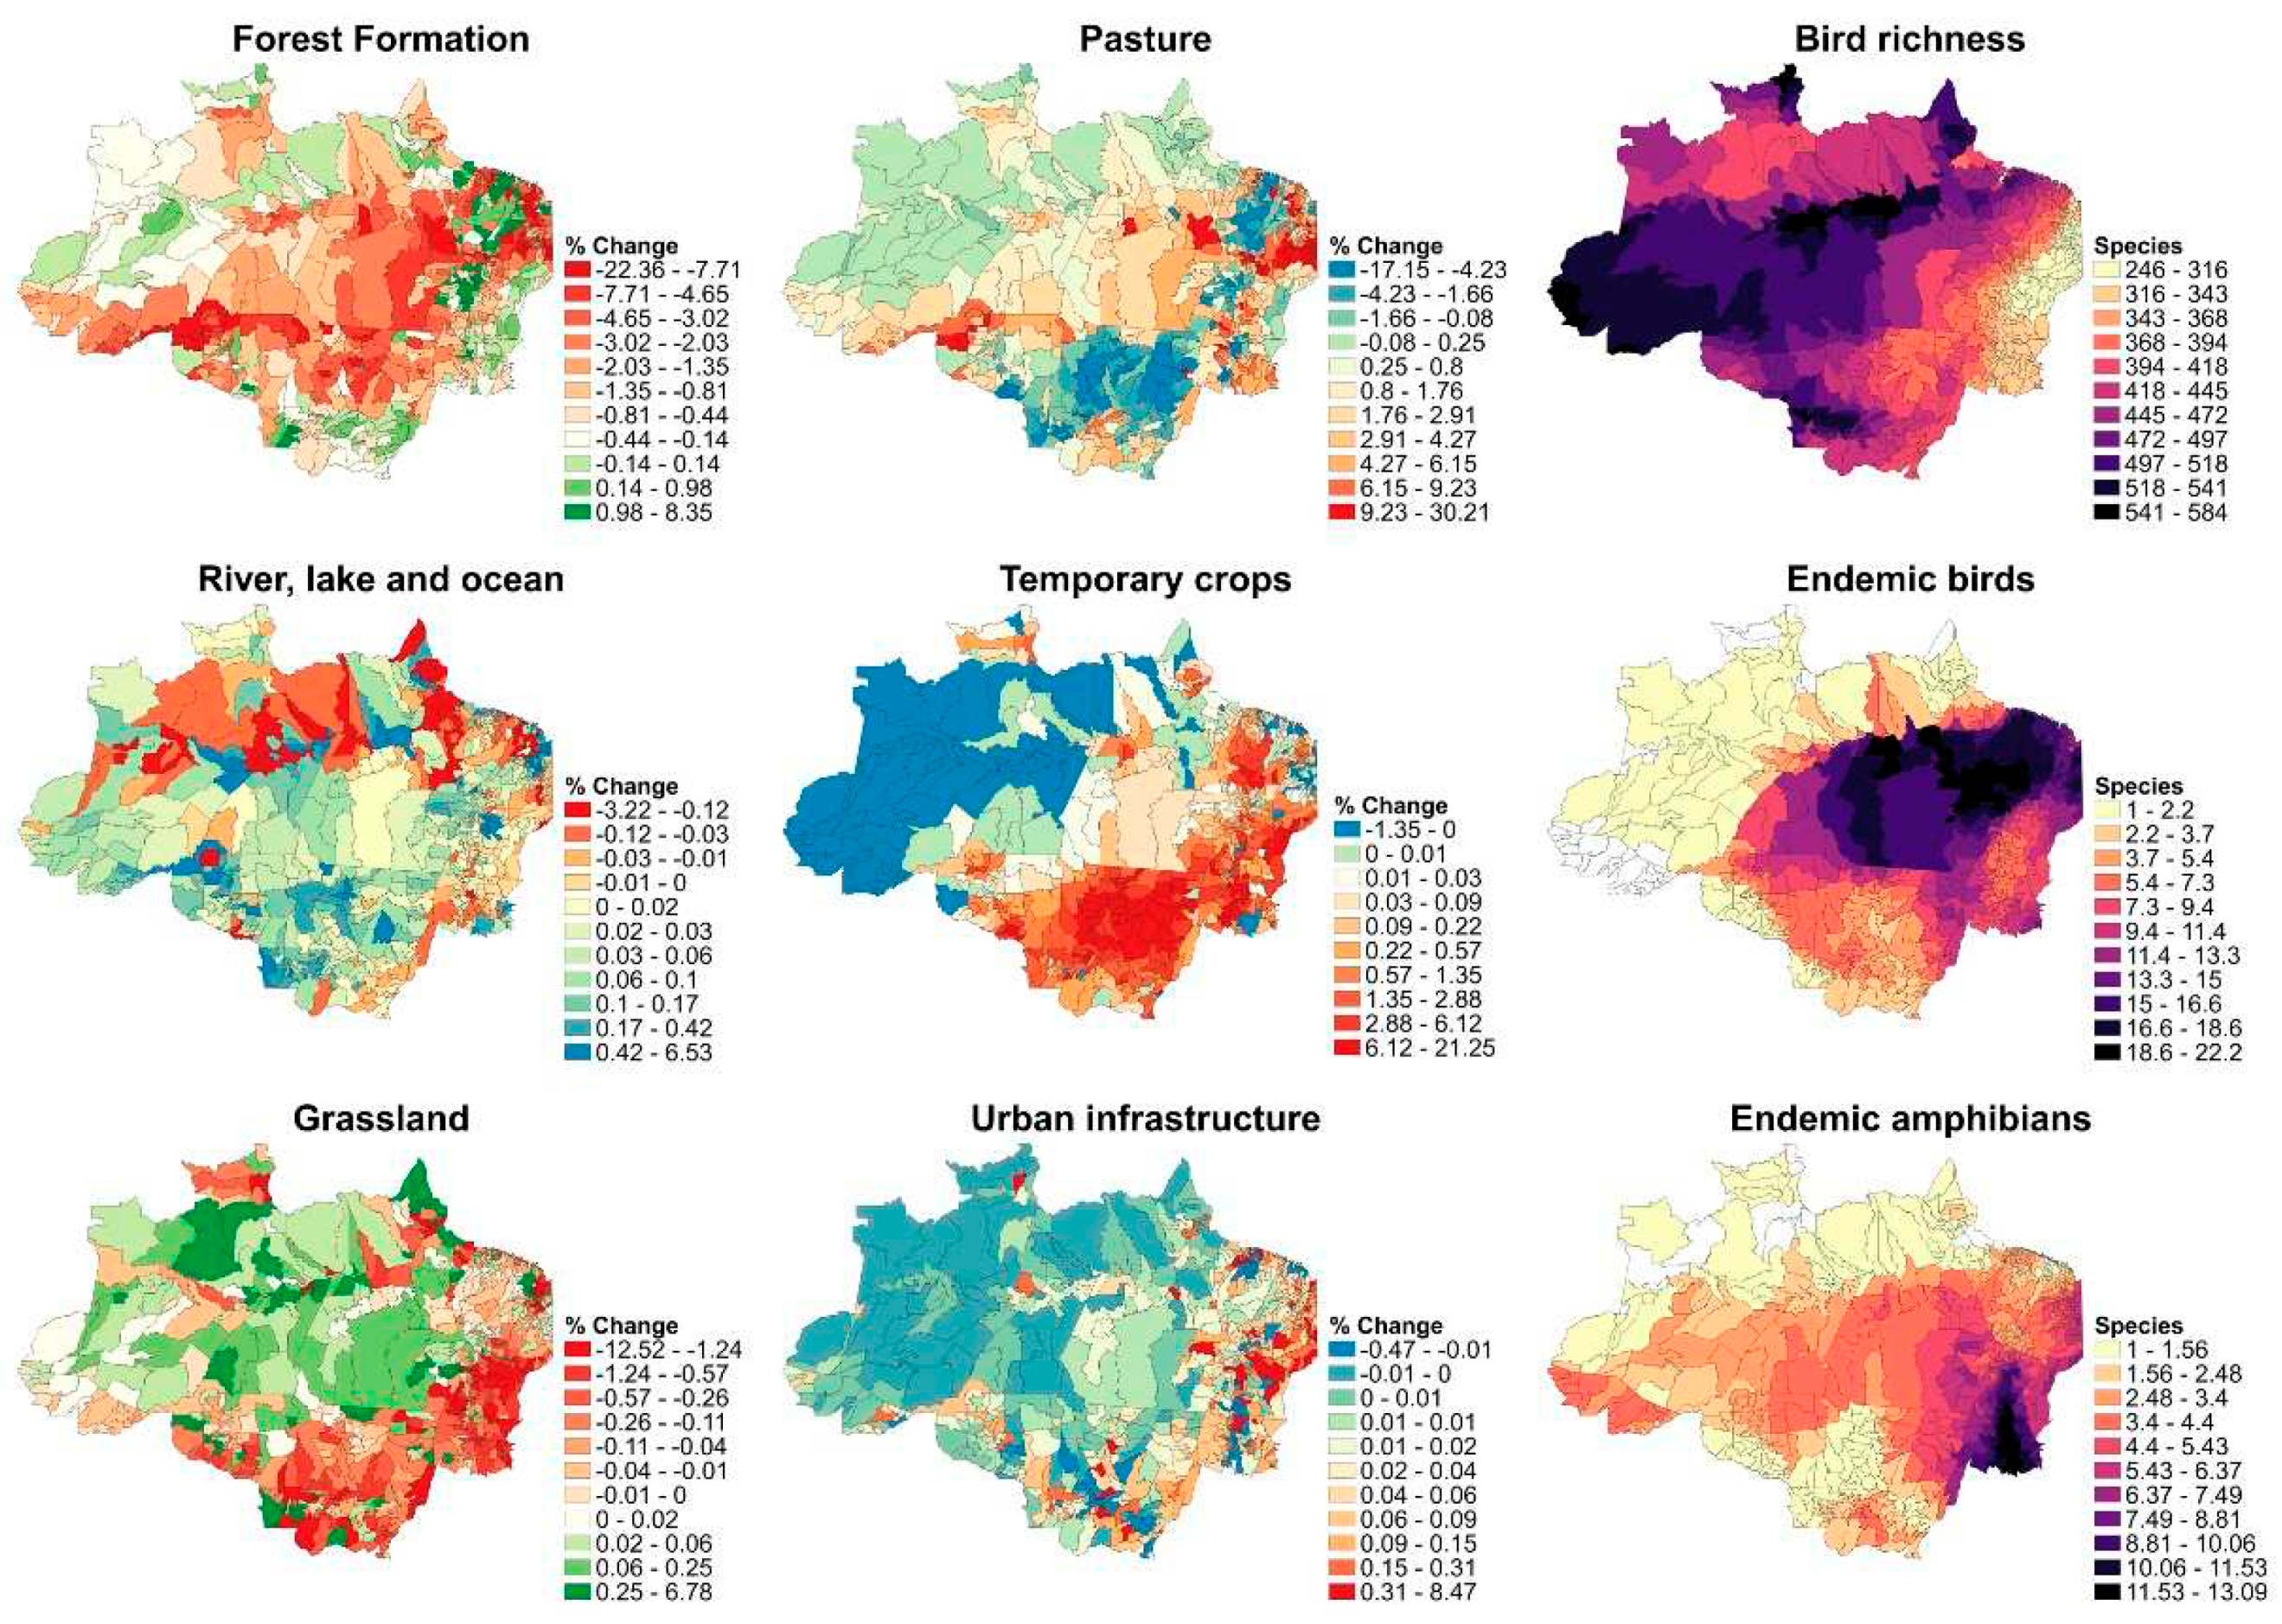
Figure 2.
Coefficient plots of posterior distributions effect sizes with the median (dark blue and green lines) and 95% credible intervals (light blue and green shades) of each covariate for (A) Plasmodium vivax cases in blue and (B) Plasmodium falciparum cases in green, the significant effects are represented in bold face and marked with an asterisk.
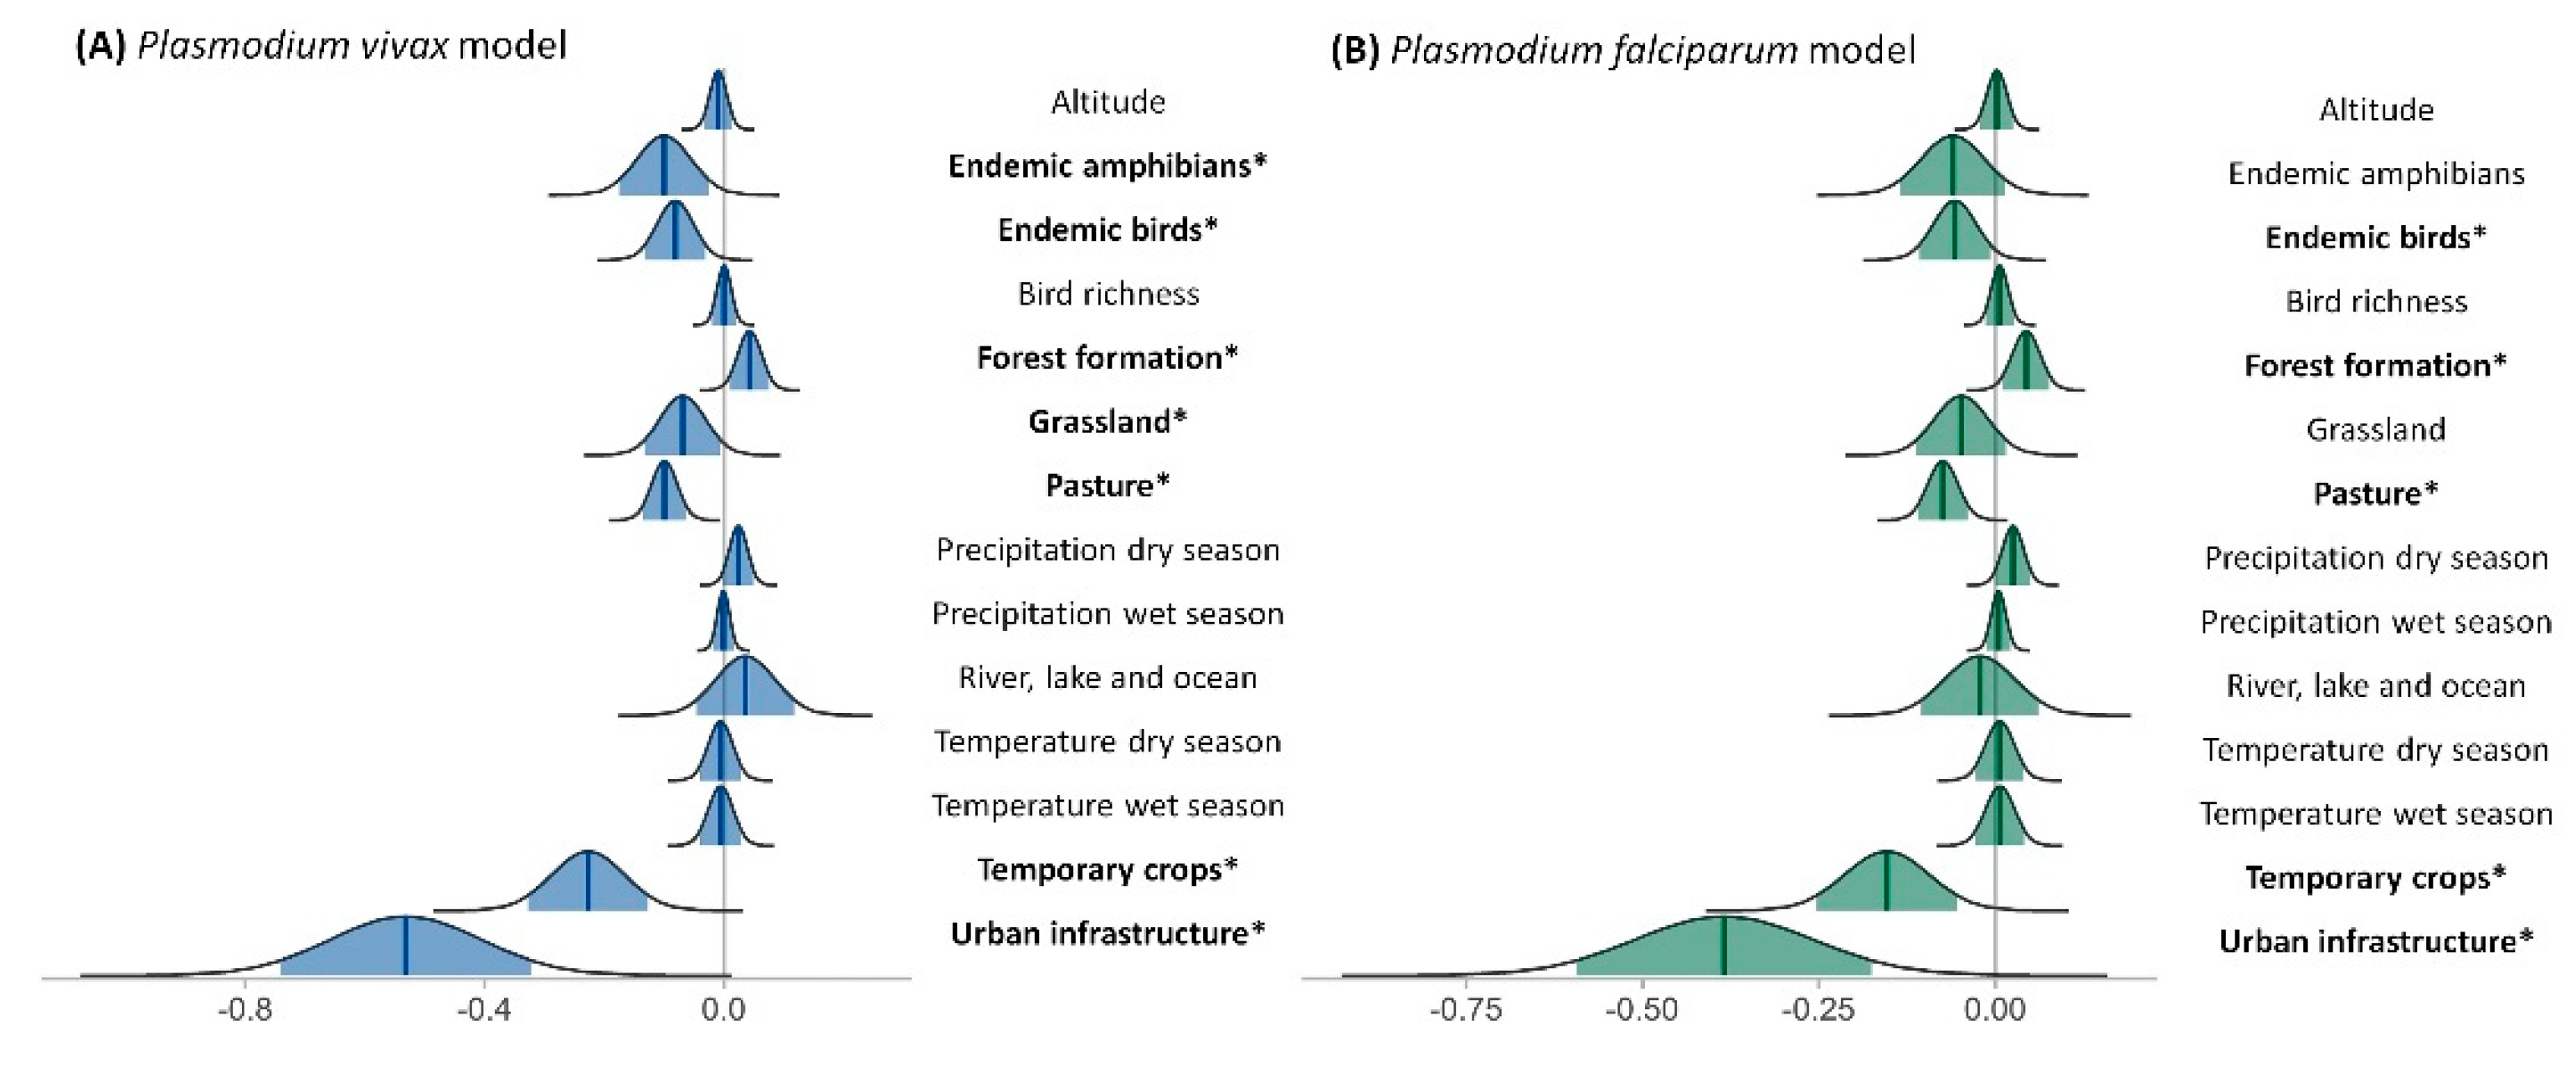
Figure 3.
INLA median effect on the credible intervals in the P. vivax risk based on the LULC interaction model (100 km2 mesh maps). Lower values cells (blue) and the higher values cells (red) are based on the landscape configuration (see supplementary materials) for all years (2007 – 2018).
Figure 3.
INLA median effect on the credible intervals in the P. vivax risk based on the LULC interaction model (100 km2 mesh maps). Lower values cells (blue) and the higher values cells (red) are based on the landscape configuration (see supplementary materials) for all years (2007 – 2018).
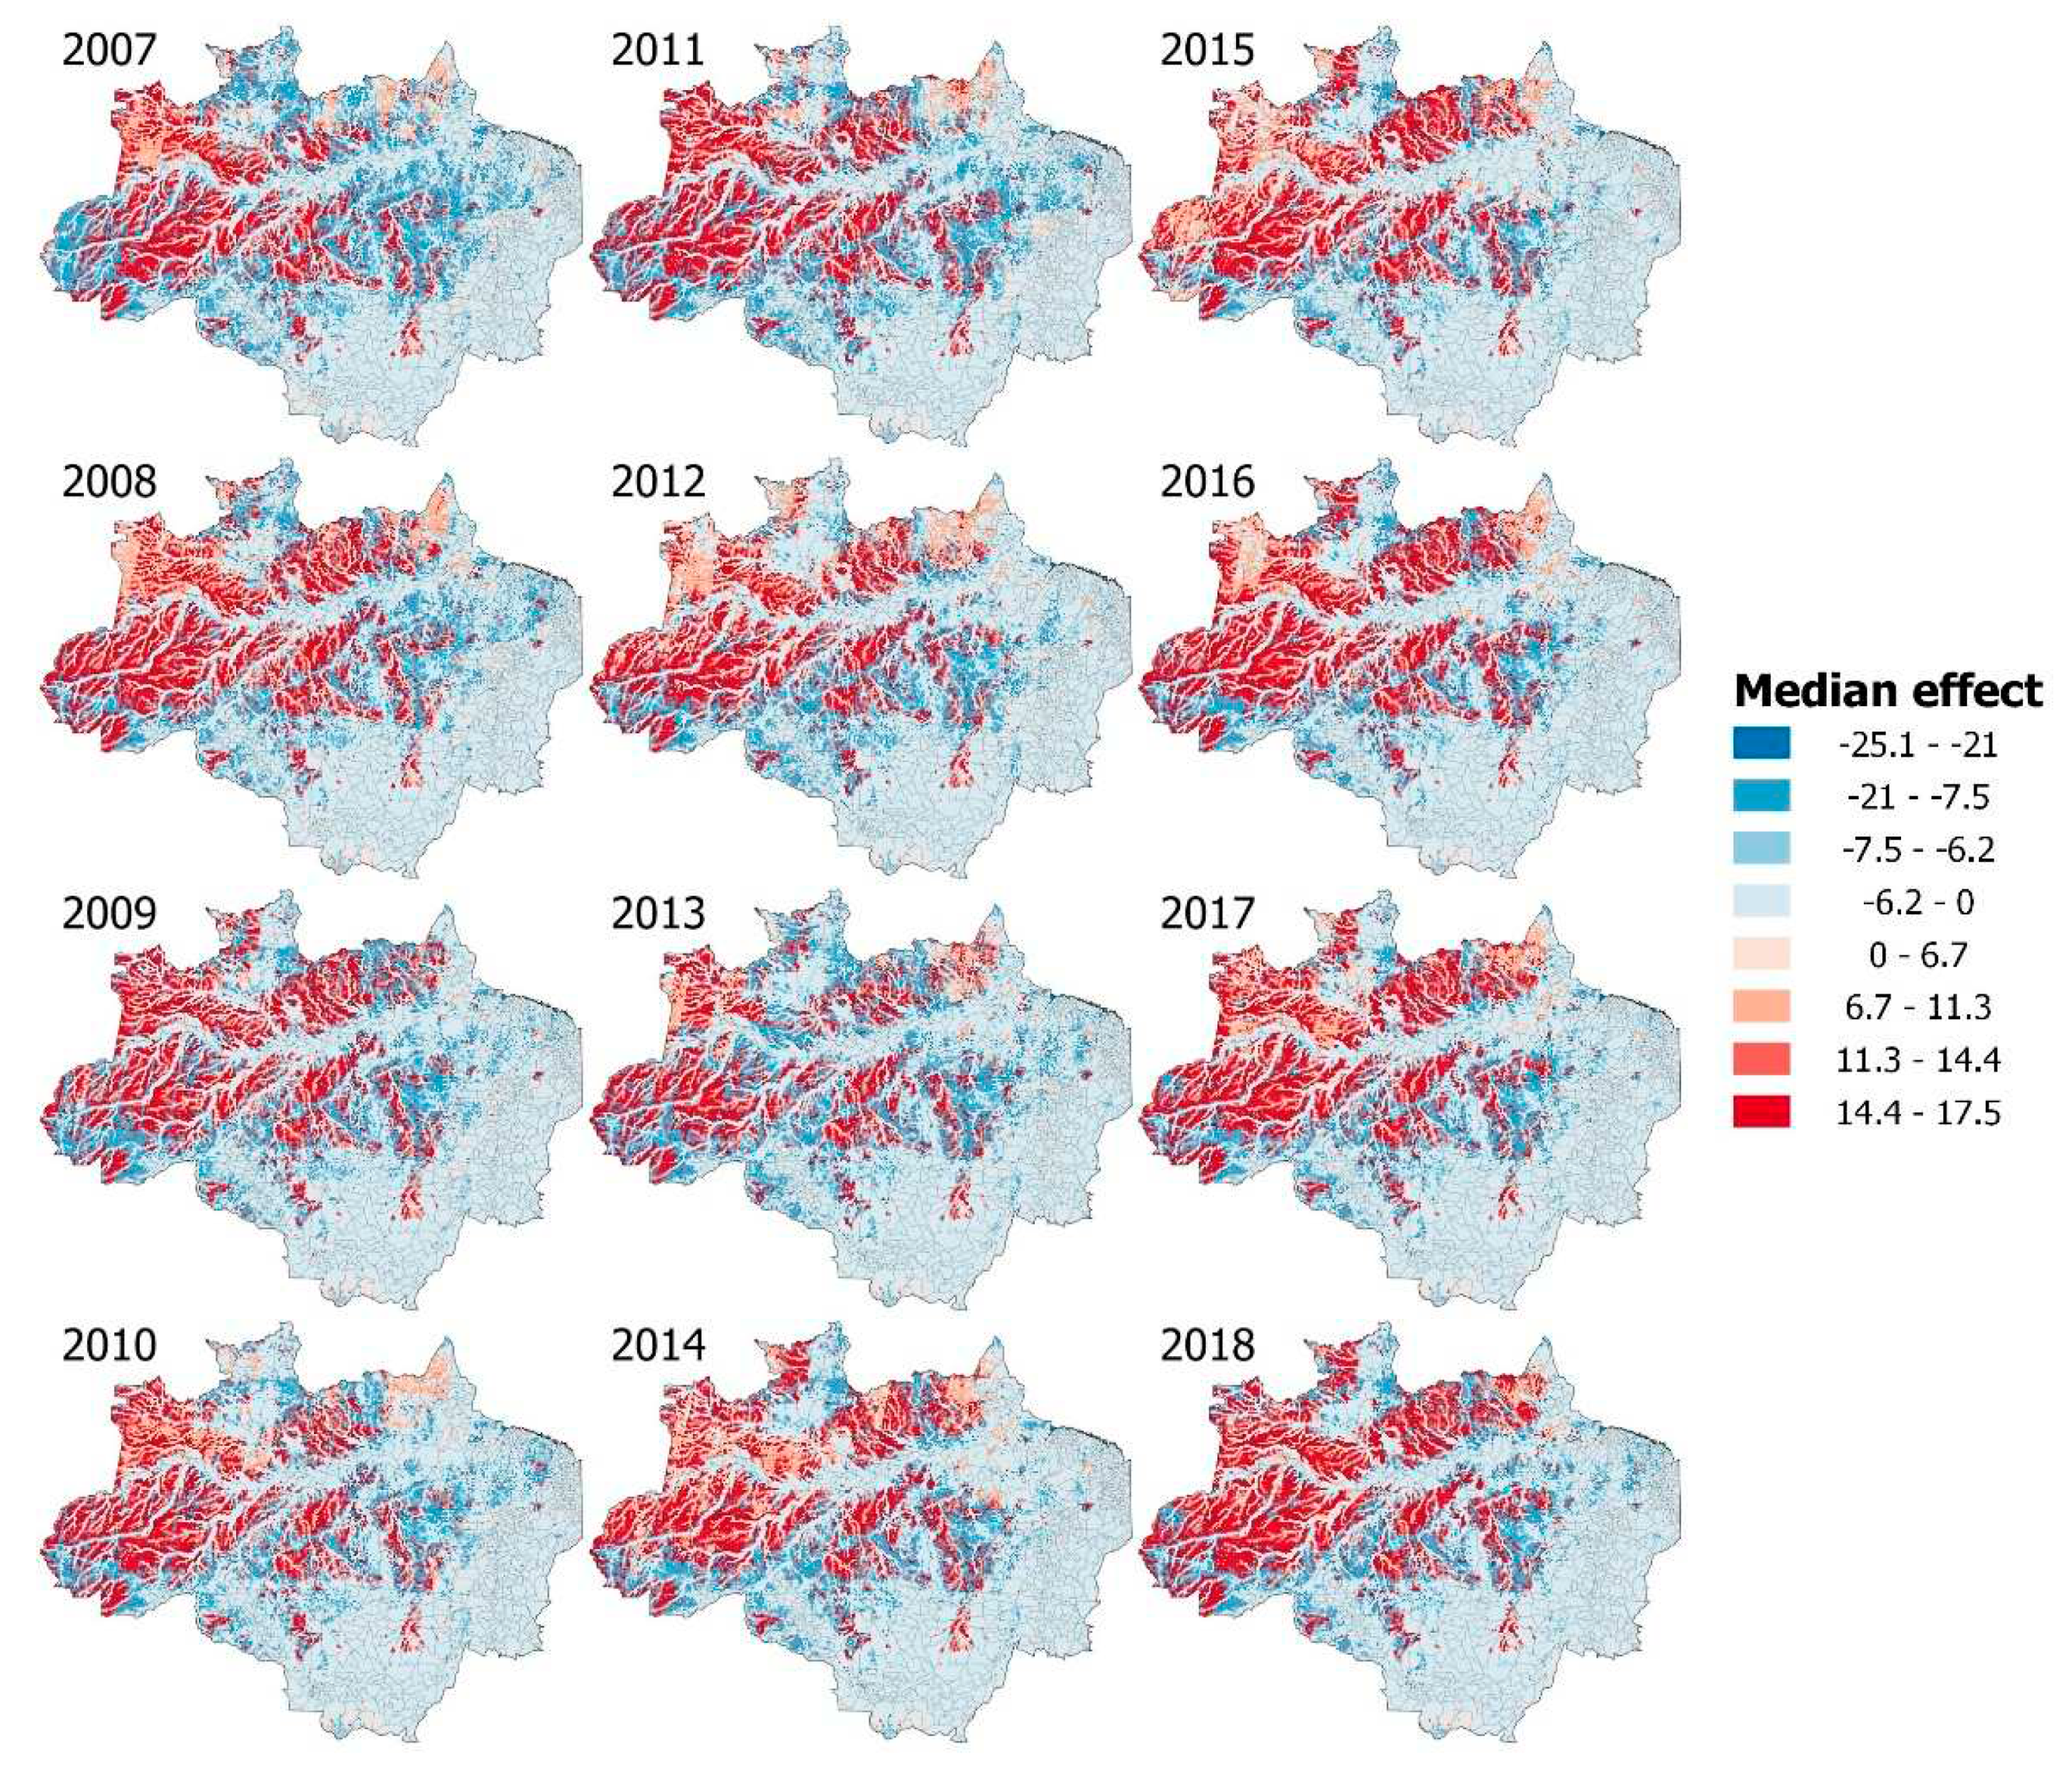

Table 1.
Covariate description (values per municipality) including environmental, LULC classifications and diversity after the correlation analysis and the selection based on the data distribution (see Figures S3 and S4). Each of these variables are described for the Amazon biome. Number of total and endemic mammal species were eliminated from the analysis due to high correlation with birds. *For the details of the species maps methodology for each taxonomic group see [54].
| Variable | Variable type | Description |
|---|---|---|
| Altitude | Climatic | Municipality mean altitude, M.A.M.S.L. (static variable). |
| Precipitation wet season | Climatic | Total mean precipitation in the wet season (mm). |
| Precipitation dry season | Climatic | Total mean precipitation in the dry season (mm). |
| Temperature wet season | Climatic | Mean maximum temperature (°C) in the wet season. |
| Temperature dry season | Climatic | Mean maximum temperature (°C) in the dry season. |
| Forest Formation | Land use land cover | Dense rainforest, evergreen seasonal forest, open rainforest, semi deciduous seasonal forest, deciduous seasonal forest, wooded savanna, alluvial open rainforest (floodplain forests and Igapó forests) (% of municipality). |
| Grassland | Land use land cover | Regions within the Amazonia/Cerrado/Orinoco ecotone with predominance of herbaceous strata (% of municipality). |
| Pasture | Land use land cover | Area of pasture, predominantly planted, linked to agricultural activity. Areas of natural pasture are predominantly classified as Grassland which may or may not be grazed (% of municipality). |
| Temporary crops | Land use land cover | Areas occupied with agricultural crops of short or medium duration, generally with a vegetative cycle of less than one year, which after harvest require new planting to produce (% of municipality). |
| Urban Infrastructure | Land use land cover | Urbanized areas with a predominance of non-vegetated surfaces, including trails, roads and buildings (% of municipality). |
| River, lakes and ocean | Land use land cover | As the name denotes, rivers, reservoirs, dams, ocean in the East coast zone in the Amazon region, lakes and other water bodies (% of municipality). |
| Endemic amphibians* | Diversity | Mean endemic amphibians species number (static variable). |
| Endemic birds* | Diversity | Mean endemic bird number species (static variable). |
| Bird richness* | Diversity | Mean bird number of species (static variable). |
Table 2.
Results of the cluster analysis for P. vivax and P. falciparum. The clusters shown here were significant (p<0.00001) and the risk value was calculated by measuring the ratio between observed cases and expected cases. Its geographical extension and location can be observed in Figure S7.
Table 2.
Results of the cluster analysis for P. vivax and P. falciparum. The clusters shown here were significant (p<0.00001) and the risk value was calculated by measuring the ratio between observed cases and expected cases. Its geographical extension and location can be observed in Figure S7.
| P. vivax | P. falciparum | ||||||
|---|---|---|---|---|---|---|---|
| Cluster Time | Observed cases | Expected cases | Risk | Cluster Time | Observed cases | Expected cases | Risk |
| (1) 2013-2017 | 353,973 | 231,923.58 | 1.53 | (1) 2013-2018 | 83,331 | 47,915.42 | 1.74 |
| (2) 2010-2011 | 163,179 | 86,675.19 | 1.88 | (2) 2009-2012 | 65,919 | 38,388.91 | 1.72 |
| (3) 2007-2008 | 136,239 | 81,743.78 | 1.67 | (3) 2007-2008 | 21,794 | 9,446.12 | 2.31 |
Disclaimer/Publisher’s Note: The statements, opinions and data contained in all publications are solely those of the individual author(s) and contributor(s) and not of MDPI and/or the editor(s). MDPI and/or the editor(s) disclaim responsibility for any injury to people or property resulting from any ideas, methods, instructions or products referred to in the content. |
© 2023 by the authors. Licensee MDPI, Basel, Switzerland. This article is an open access article distributed under the terms and conditions of the Creative Commons Attribution (CC BY) license (http://creativecommons.org/licenses/by/4.0/).
Copyright: This open access article is published under a Creative Commons CC BY 4.0 license, which permit the free download, distribution, and reuse, provided that the author and preprint are cited in any reuse.


