
Submitted:
26 April 2023
Posted:
27 April 2023
You are already at the latest version
Abstract
Even after debridement and chemical root canal preparation, multispecies bacterial biofilms can still be found in root canals and dentinal tubules. This demonstrates the necessity of using suitable antibacterial endodontic sealers. Due to their well-known biological qualities, calcium silicate based root canal sealers or “bioceramic’ sealers have recently been launched and can be successful in endodontic procedures. This study's objective was to compare the impact of CerasealR, Total Fill BC SealerR, Bio-C SealerR, AH Plus BioceramicR, K-biocerR and SealiteR on the elimination of a multispecies’ endodontic biofilm at 3, 7 and 14 days.
Enterococcus faecalis, Pseudomonas Aeruginosa, Candida Albicans and Proteus Mirabilis were cultured on specific agars and later grown in Brain Heart Infusion broth on hydroxyapatite discs pretreated with collagen type 1 and incubated for 18 days. The resulting biofilm was then placed on a 10mm round shaped blotting paper set on a metallic net in a 6cm petri dish with an orthodontic bend filled with the calcium silicate based root canal sealer in direct contact with the biofilm.
In all tested groups, the total bacterial count has significantly decreased between day 3 and day 14 (P<0.05) with no statistically significant differences among the different sealers’ groups at all time points. Sealite group was capable of decreasing the Candida Albicans count significantly between day 3 and day 14 (P<0.05) in comparison with the bioceramic groups.
All sealers had antibacterial activity against the multispecies biofilm between day 3 and day 14.
Keywords:
bioceramics
; multispecies’ biofilm
; calcium silicate based root canal sealers
; biofilm
1. Introduction
Persistent apical periodontitis occurs when root canal treatment of initial apical periodontitis has not sufficiently eliminated the intraradicular infection [1].
It is known that microorganisms present in root canals form biofilms, which makes them more resistant to antimicrobial agents than bacteria in the planktonic state [2]. The goal of endodontic treatment is to remove the microorganisms from the infected root canal in order to achieve clinical and radiological healing [3]. Although mechanical and chemical preparation significantly reduce the amount of microorganisms in the infected root canal system, it is practically impossible to completely remove all microorganisms by irrigation and other methods [4].
In the medical and dentistry disciplines, bioceramics are inorganic, nonmetallic, and biocompatible materials used in direct contact with living tissues [5]. Other bioceramic materials have been elaborated and applied successfully in endodontic treatments, including pulp capping, obturation, apical barrier construction, perforation repair, and root-end filling, because they are chemically stable, non-corrosive, and interact well with organic tissues [6]. While some endodontic bioceramics are premixed materials that cure with moisture from the surrounding tissue, others are powder/liquid systems that require manual mixing [7]. The bioceramics can create a great seal with the tooth structure thanks to the curing procedure. [8]
By raising the pH and ion release from the material, the antibacterial and antibiofilm characteristics are applied during the setting process [9]. The outcome of endodontic therapy depends on both a high-quality seal and antibacterial characteristics [10]. By further physico-chemical interactions (such as the biomineralization effect) with the surrounding dental hard tissues, antibiofilm qualities may continue to be present in a bioceramic-treated environment [11].
The aim of this study was to compare the impact of different calcium silicate bsed root canal sealers, CSBRCS, on a multispicies endodontic biofilm elimination at 3, 7 and 14 days.
2. Material and Methods
The study protocol was approved by the “Ethics Committee” (FMD158).
Multispecies biofilm formation
Enterococcus faecalis derived from ATCC 29212 was obtained from Microbiological lab and cultured aerobically on blood agar at 35˚C for 48 h according to manufacturer’s instructions. Colonies were later grown in Brain Heart Infusion + 5% glucose (BHI) broth at 37˚C for 24 h in a shaker incubator followed by a 24hr static incubation at 37˚C. Inoculum was prepared in sterile BHI + 5% glucose broth and turbidity was set to 0.5 McFarland corresponding to approximately 1.5 × 10⁸ colony forming units per milliliter (CFU/mL).
Ten µl of the inoculum were placed on 63 hydroxyapatite discs pretreated with collagen type 1 and were incubated for 16 days at 37˚C.
Proteus Mirabilis and Pseudomonas Aeruginosa, were grown on Plate Count Agar (PCA) at 37˚C for 24 h according to manufacturer’s instructions, Candida Albicans was grown on Yeast Glucose Chloramphenicole (YGC) . Colonies were later grown in Brain Heart Infusion + 5% glucose (BHI) broth at 37˚C for 24 h in a shaker incubator followed by a 24hr static incubation at 37˚C. Inoculum was prepared in sterile BHI + 5% glucose broth and turbidity was set to 0.5 McFarland corresponding to approximately 1.5 × 10⁸ colony forming units per milliliter (CFU/mL).
Pseudomonas Aeruginosa was added to the pretreated hydroxyapatite discs at day 10, Candida Albicans at day 14 and Proteus Mirabilis at day 16. The multispecies biofilm was then incubated for 2 days at 37˚C.
The 63 formed biofilms were removed, placed on a 10mm round shaped blotting paper cut in the middle, set on a metallic net in a 6cm petri dish filled in sterile BHI broth. An orthodontic bend #2 was positioned in the middle of the metallic net in a direct contact with the biofilm.
The sample was divided equally and randomly into 7 groups: group 1: ceraseal (Meta Biomed, Cheongju, Korea) group 2 :total Fill BC Sealer (TFBC; FKG Dentaire, La Chaux-des-Fonds, Switzerland), group 3 Bio-C Sealer (Angelus, PR, Brazil ), group 4: AH Plus Bioceramic (AHBC, Dentsply Sirona, York, PA, USA), group 5 K-biocer (Rikitta, Lebanon). Group 6: Sealite (Pierre Rolland, Merignac, France). Group 7: group control.
The blotting paper underneath the orthodontic bend was removed using forceps and placed in sterile BHI broth for 15 min. after vortex, the biofilm was dissected using the sterile needle technique for 15 min.
An optic density test was realized, followed by a gram staiing and a microscopic observation.
50 µl of the liquid medium were serially diluted in sterile BHI broth and plated on different agars. Plate Count Agar (PCA) for the determination of the total number of bacteria. Yeast Glucose Chloramphenicole (YGC) for Candida Albicans, Cetrimid Agar (AC) for Pseudomonas Aeruginosa, Slantez and Bartley Agar (SBA) fot Enterococcus Faecalis, Uriselect for Proteus Mirabilis.
Colonies were counted and confirmed by colony morphology observation on the agar of choice at 3, 7 and 14 days.
3. Results
Statistical analysis
Data were analyzed using IBM SPSS Statistics for Windows, version 26 (IBM Corp., Armonk, NY, USA). Descriptive statistics of the quantitative variables were summarized and presented as medians (1st and 3rd quartiles) and means ± standard deviations. Normality of distribution of the quantitative variables were assessed using the Shapiro-Wilk test. The Friedman’s test was used to compare values within each group between the three timepoints when data was not normally distributed, and repeated-measures ANOVA was used instead when normality of distribution was assumed, both tests were followed by the Bonferroni post-hoc test for multiple comparisons. Mann-Whitney U test (when data was not normally distributed) and Student t test (when data was normally distributed) were used to compare values within each timepoint between groups. All tests were two-tailed and the level of significance was set at 5%.
Results
- Descriptive statistics of total bacterial count according to the seven different groups and the three different time points, and results of the comparisons between values of every sealer and the control group within each timepoint, and between the timepoints within each group are shown in Table 1.

Table 1.
Descriptive statistics of total bacterial count (x107) according to groups and time.
| Groups | Time | |||
|---|---|---|---|---|
| Day 3 | Day 7 | Day 14 | p-value | |
|
Control (n=9) Mean ± SD Median (Q1 – Q3) |
4.62 ± 0.73C 4.6 (3.95 – 5.30)C |
4.86 ± 0.72B 4.8 (4.2 – 5.55)B |
5.11 ± 0.71A 5.1 (4.45 – 5.75)A |
<0.001* |
|
CeraSeal (n=9) Mean ± SD Median (Q1 – Q3) |
2.63 ± 0.23A 2.6 (2.4 – 2.75)A |
2.36 ± 0.22B 2.3 (2.2 – 2.5)B |
2.16 ± 0.17C 2.1 (2.05 – 2.5)C |
<0.001* |
| p-value (difference with the control group) | <0.001* | <0.001* | <0.001* | |
|
TotalFill (n=8) Mean ± SD Median (Q1 – Q3) |
2.56 ± 0.17A 2.5 (2.42 – 2.67)A |
2.37 ± 0.18B 2.3 (2.22 – 2.55)B |
2.19 ± 0.17C 2.1 (2.1 – 2.35)C |
<0.001* |
| p-value (difference with the control group) | <0.001* | <0.001* | <0.001* | |
|
Bio-C Sealer (n=9) Mean ± SD Median (Q1 – Q3) |
2.71 ± 0.23A 2.7 (2.55 – 2.9)A |
2.50 ± 0.21B 2.5 (2.35 – 2.7)B |
2.27 ± 0.19C 2.3 (2.1 – 2.4)C |
<0.001* |
| p-value (difference with the control group) | <0.001* | <0.001* | <0.001* | |
|
AH Plus (n=9) Mean ± SD Median (Q1 – Q3) |
2.73 ± 0.24A 2.8 (2.45 – 2.95)A |
2.52 ± 0.26B 2.6 (2.25 – 2.75)B |
2.31 ± 0.26C 2.3 (2.05 – 2.55)C |
<0.001* |
| p-value (difference with the control group) | <0.001* | <0.001* | <0.001* | |
|
K-Biocer (n=9) Mean ± SD Median (Q1 – Q3) |
2.76 ± 0.25A 2.8 (2.5 – 2.95)A |
2.54 ± 0.25B 2.6 (2.3 – 2.75)B |
2.33 ± 0.25C 2.4 (2.1 – 2.55)C |
<0.001* |
| p-value (difference with the control group) | <0.001* | <0.001* | <0.001* | |
|
Sealite (n=9) Mean ± SD Median (Q1 – Q3) |
2.70 ± 0.22A 2.7 (2.5 – 2.9)A |
2.50 ± 0.22B 2.5 (2.3 – 2.7)B |
2.28 ± 0.22C 2.3 (2.1 – 2.5)C |
<0.001* |
| p-value (difference with the control group) | <0.001* | <0.001* | <0.001* | |
SD = standard deviation; Q1 = first quartile; Q3 = third quartile; *P<0.05; different uppercase superscript letters indicate statistically significant differences between the timepoints within each group.
-
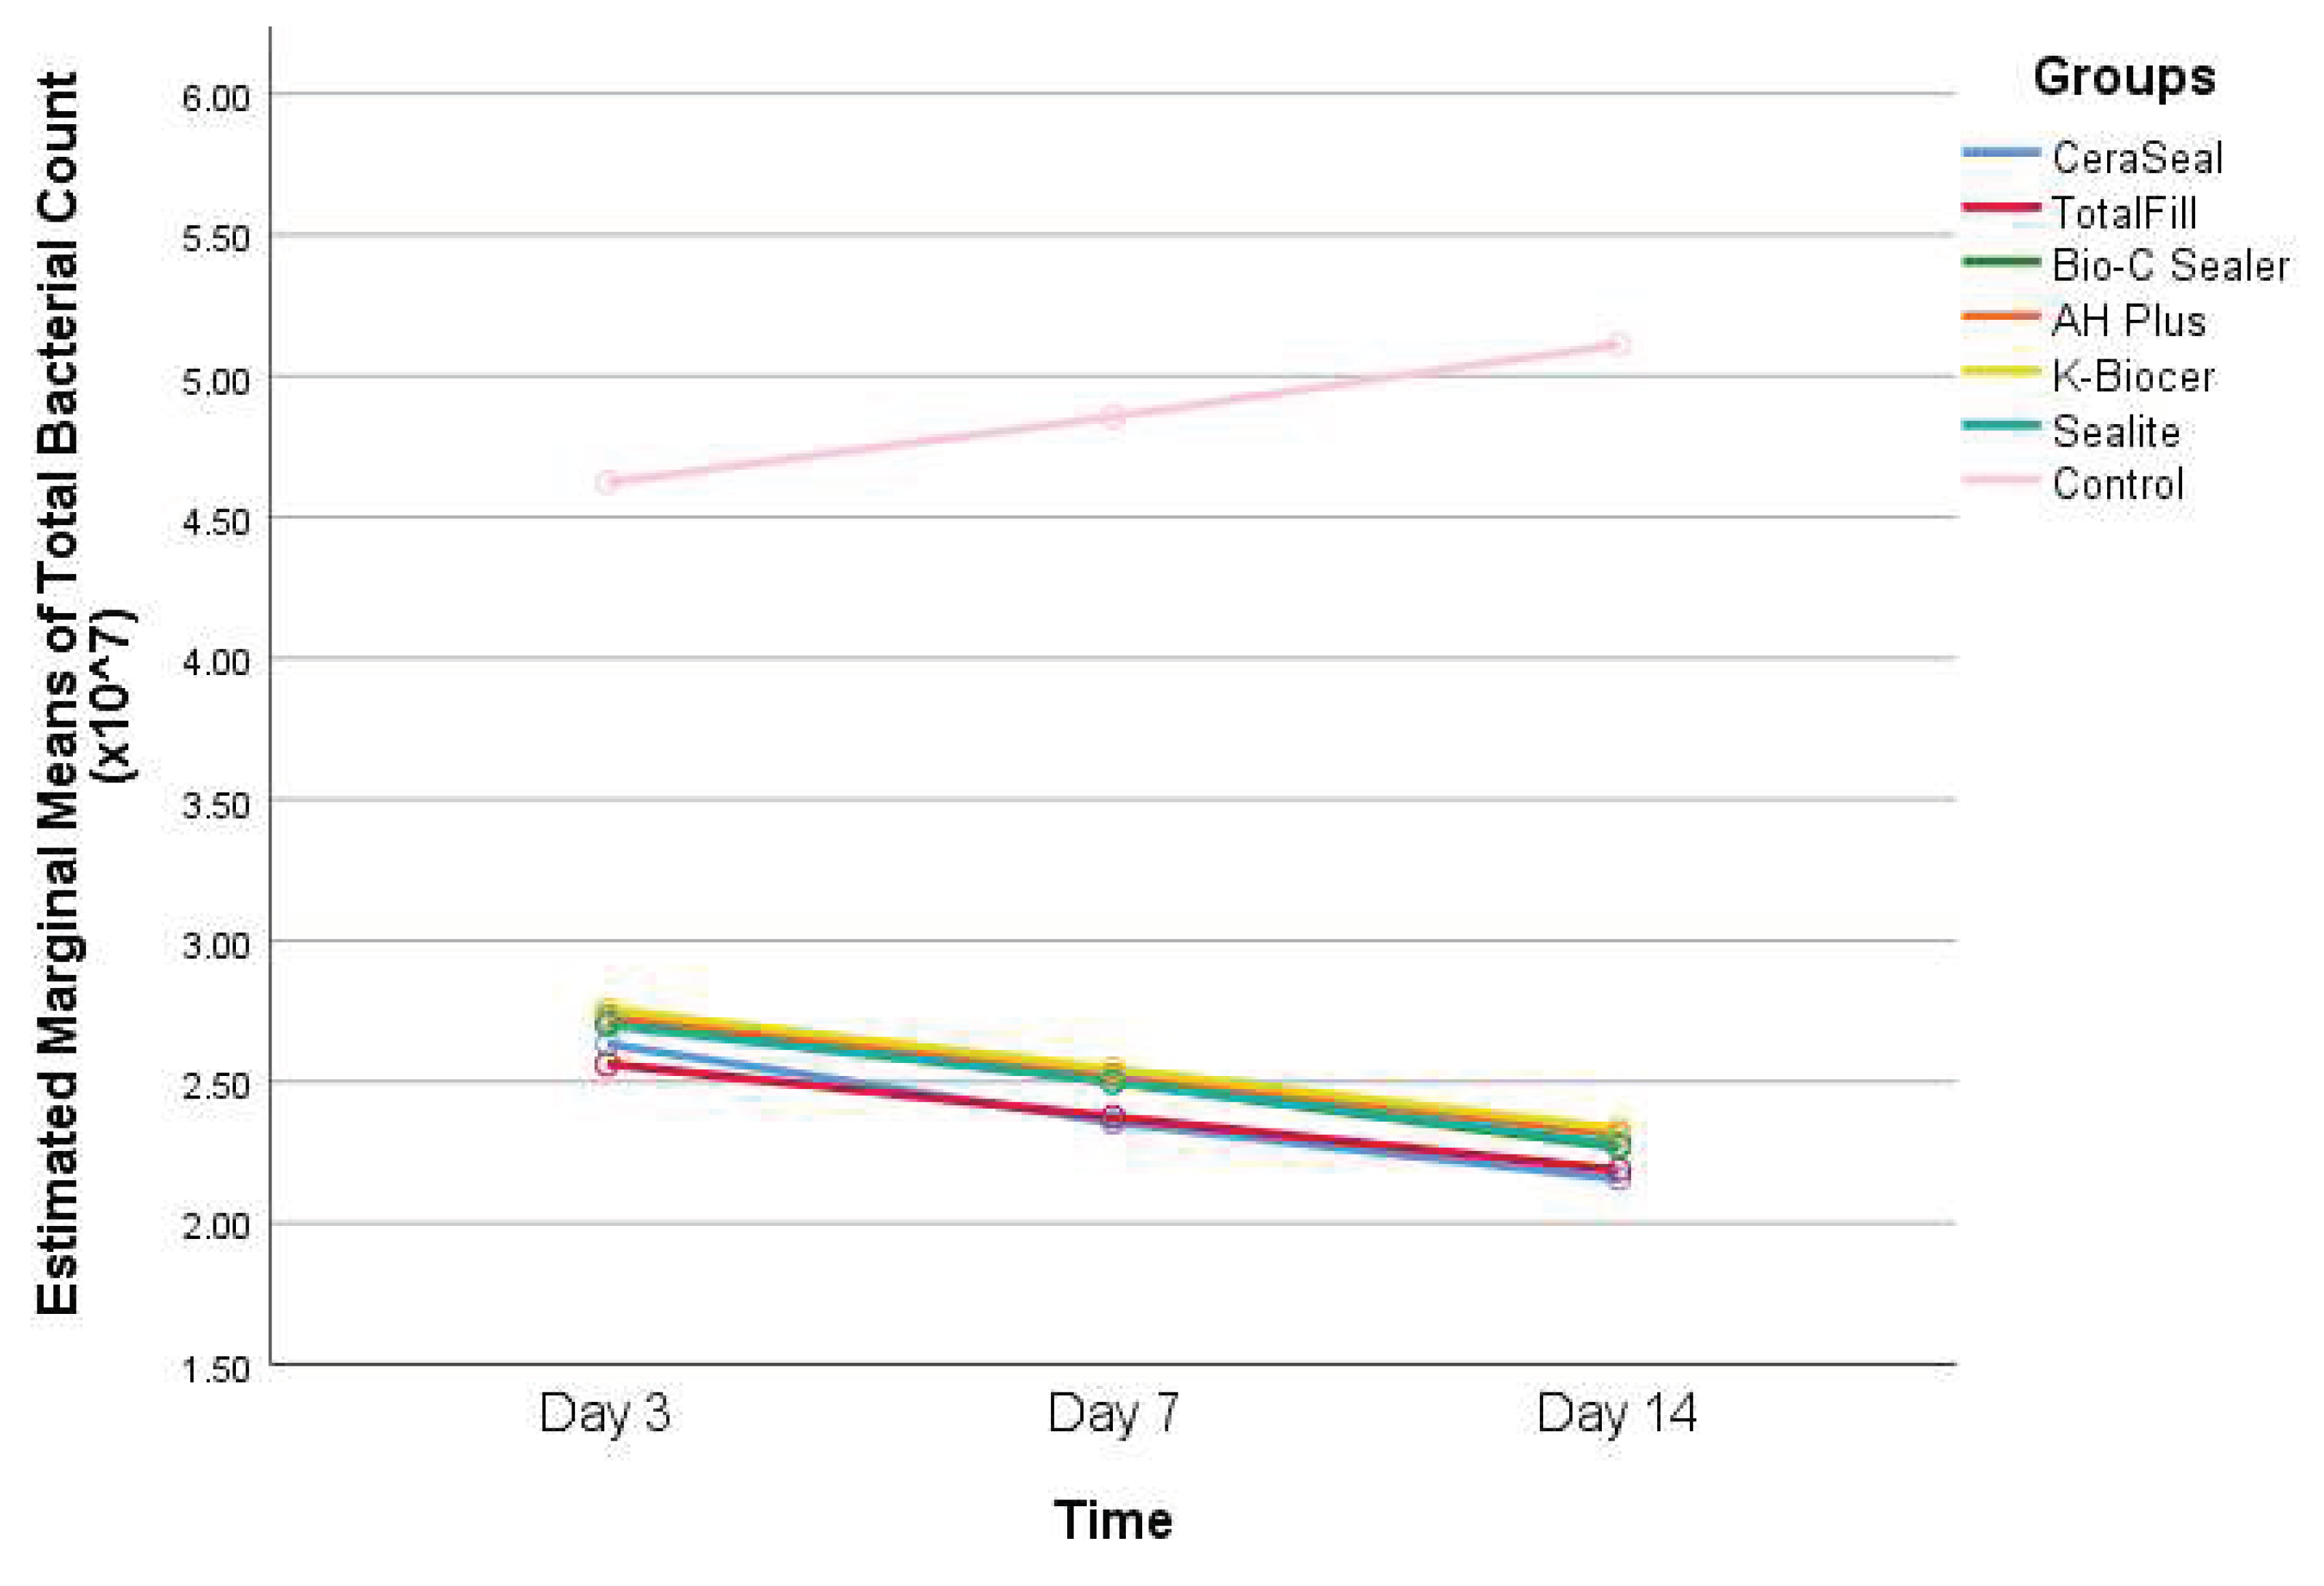
Interpretation of Table 1: - Within the control group, the total bacterial count has significantly increased between day 3 and day 14 (P<0.05).
- –
- Within all the other groups (CeraSeal, TotalFill, Bio-C Sealer, AH Plus, K-Biocer, and Sealite), the total bacterial count has significantly decreased between day 3 and day 14 (P<0.05).
- –
- At days 3, 7, and 14, the total bacterial count was significantly greater in the control group than that of all the other groups (P<0.05).
- As for the total bacterial count, no statistically significant differences were found among the different sealers’ groups at all timepoints (P>0.05).
Figure 1.
Changes in total bacterial count (x107) for the seven groups over 14 days.
- Descriptive statistics of Candida Albicans count according to the seven different groups and the three different timepoints, and results of the comparisons between values of every sealer and the control group within each timepoint, and between the timepoints within each group are shown in Table 2.
Table 2.
Descriptive statistics of Candida Albicans count (x106) according to groups and time.
| Groups | Time | |||
|---|---|---|---|---|
| Day 3 | Day 7 | Day 14 | p-value | |
|
Control (n=9) Mean ± SD Median (Q1 – Q3) |
12.78 ± 2.91 13 (10.5 – 15) |
13.56 ± 2.96 14 (11 – 15) |
14.22 ± 3.38 13 (11 – 17.5) |
0.308 |
|
CeraSeal (n=9) Mean ± SD Median (Q1 – Q3) |
6.89 ± 1.62 7 (5 – 8.5) |
5.67 ± 1.50 6 (4 – 7) |
5.78 ± 1.30 5 (5 – 7) |
0.072 |
| p-value (difference with the control group) | <0.001* | <0.001* | <0.001* | |
|
TotalFill (n=8) Mean ± SD Median (Q1 – Q3) |
7.00 ± 1.60 7 (5.25 – 8.75) |
7.12 ± 1.25 7 (6.25 – 8) |
6.00 ± 1.07 6 (5.25 – 7) |
0.252 |
| p-value (difference with the control group) | <0.001* | <0.001* | <0.001* | |
|
Bio-C Sealer (n=9) Mean ± SD Median (Q1 – Q3) |
7.22 ± 1.30 8 (6 – 8) |
6.00 ± 1.50 6 (4.5 – 7.5) |
6.00 ± 0.87 6 (5 – 7) |
0.106 |
| p-value (difference with the control group) | <0.001* | <0.001* | <0.001* | |
|
AH Plus (n=9) Mean ± SD Median (Q1 – Q3) |
7.33 ± 1.00 7 (6.5 – 8) |
6.22 ± 0.97 6 (5.5 – 7) |
6.56 ± 1.33 7 (5.5 – 7.5) |
0.070 |
| p-value (difference with the control group) | <0.001* | <0.001* | <0.001* | |
|
K-Biocer (n=9) Mean ± SD Median (Q1 – Q3) |
7.56 ± 1.24 7 (6.5 – 9) |
6.56 ± 0.88 7 (6 – 7) |
6.78 ± 1.20 7 (5.5 – 8) |
0.148 |
| p-value (difference with the control group) | <0.001* | <0.001* | <0.001* | |
|
Sealite (n=9) Mean ± SD Median (Q1 – Q3) |
6.78 ± 1.56A 6 (5.5 – 8.5)A |
6.44 ± 1.01A 7 (5.5 – 7)A |
4.67 ± 0.87B 4 (4 – 5.5)B |
0.001* |
| p-value (difference with the control group) | <0.001* | <0.001* | <0.001* | |
SD = standard deviation; Q1 = first quartile; Q3 = third quartile; *P<0.05; different uppercase superscript letters indicate statistically significant differences between the timepoints within the Sealite group.
-
Interpretation of Table 2: - The Candida Albicans count has increased in the control group between days 3 and 14, but this increase was not statistically significant (P>0.05).
- –
- In the Sealite group, Candida Albicans count has significantly decreased between day 3 and day 14 (P<0.05), and day 7 and 14.
- –
- In the rest of the groups, the count of Candida Albicans has decreased between days 3 and 14 but not significantly (P>0.05).
- –
- Candida Albicans count was significantly greater in the control group at all timepoints, compared to all the other groups (P<0.05).
-
Regarding the Candida Albicans count, a statistically significant difference was observed at day 7 between CeraSeal and TotalFill (P=0.047).
- –
- A statistically significant difference was observed at day 14 between TotalFill and Sealite (P=0.021).
- –
- A statistically significant difference was observed at day 14 between Bio-C Sealer and Sealite (P=0.011).
- –
- A statistically significant difference was observed at day 14 between AH Plus and Sealite (P=0.006).
- –
- A statistically significant difference was observed at day 14 between K-Biocer and Sealite (P=0.002).
Figure 2.
Changes in Candida Albicans count for the seven groups over 14 days.

- Descriptive statistics of Enterococcus faecalis count according to the seven different groups and the three different timepoints, and results of the comparisons between values of every sealer and the control group within each timepoint, and between the timepoints within each group are shown in Table 3.
Table 3.
Descriptive statistics of Enterococcus count (x106) according to groups and time.
| Groups | Time | |||
|---|---|---|---|---|
| Day 3 | Day 7 | Day 14 | p-value | |
|
Control (n=9) Mean ± SD Median (Q1 – Q3) |
12.00 ± 2.78 13 (9.5 – 15) |
12.22 ± 2.44 13 (10 – 13) |
12.89 ± 2.42 14 (10.5 – 15) |
0.284 |
|
CeraSeal (n=9) Mean ± SD Median (Q1 – Q3) |
5.89 ± 1.54 6 (4.5 – 7.5) |
5.78 ± 1.64 5 (4.5 – 7) |
5.56 ± 1.67 5 (4 – 6.5) |
0.892 |
| p-value (difference with the control group) | <0.001* | <0.001* | <0.001* | |
|
TotalFill (n=8) Mean ± SD Median (Q1 – Q3) |
6.75 ± 1.03 7 (6 – 7.75) |
5.87 ± 2.10 5.5 (4 – 8.25) |
6.75 ± 1.28 7 (5.5 – 7) |
0.261 |
| p-value (difference with the control group) | <0.001* | <0.001* | 0.018* | |
|
Bio-C Sealer (n=9) Mean ± SD Median (Q1 – Q3) |
7.00 ± 0.87 7 (6 – 8) |
6.56 ± 1.01 6 (6 – 7.5) |
5.67 ± 1.50 6 (4 – 7) |
0.067 |
| p-value (difference with the control group) | 0.003* | <0.001* | <0.001* | |
|
AH Plus (n=9) Mean ± SD Median (Q1 – Q3) |
6.44 ± 1.59 6 (5 – 8) |
6.44 ± 1.24 6 (5.5 – 7) |
5.44 ± 1.67 5 (4 – 6.5) |
0.233 |
| p-value (difference with the control group) | <0.001* | <0.001* | <0.001* | |
|
K-Biocer (n=9) Mean ± SD Median (Q1 – Q3) |
7.11 ± 0.93 7 (6.5 – 7.5) |
6.56 ± 1.42 7 (5.5 – 8) |
5.44 ± 1.01 5 (5 – 6.5) |
0.053 |
| p-value (difference with the control group) | 0.001* | <0.001* | <0.001* | |
|
Sealite (n=9) Mean ± SD Median (Q1 – Q3) |
6.22 ± 1.56 7 (4.5 – 7.5) |
5.56 ± 0.73 5 (5 – 6) |
6.33 ± 0.71 6 (6 – 7) |
0.217 |
| p-value (difference with the control group) | <0.001* | <0.001* | 0.004* | |
SD = standard deviation; Q1 = first quartile; Q3 = third quartile; *P<0.05.
-
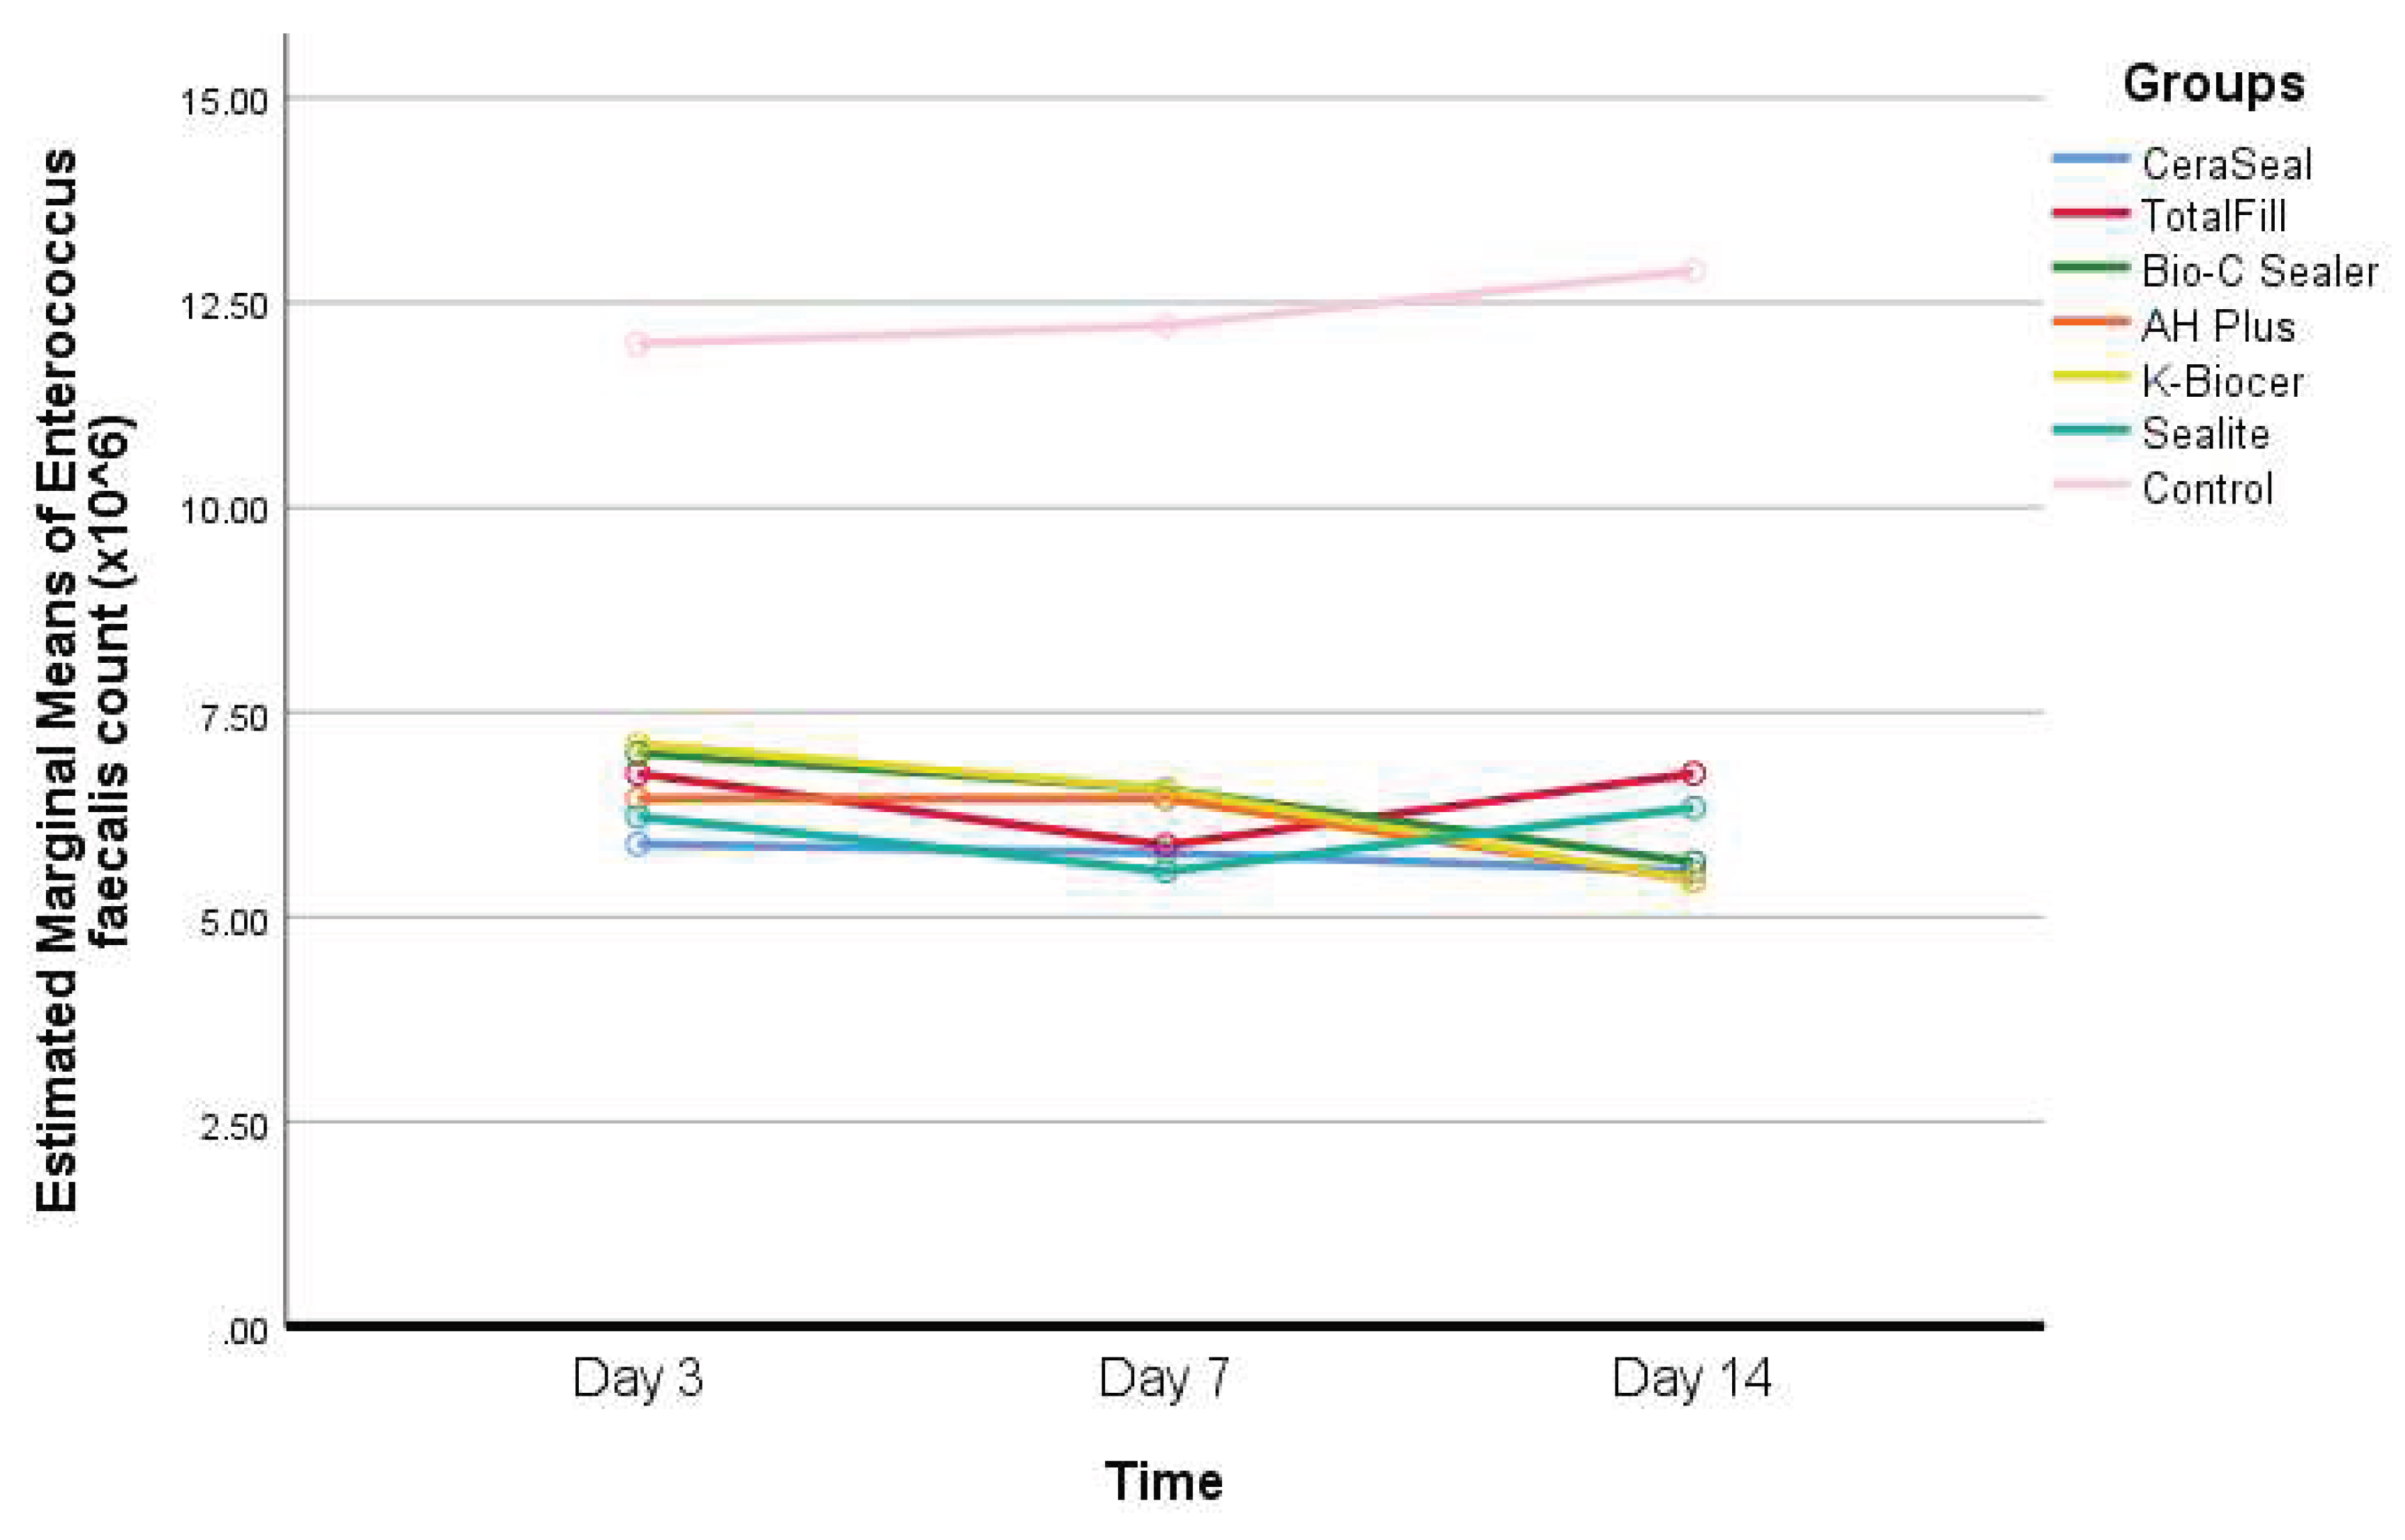
Interpretation of Table 3: - In the control group, Enterococcus faecalis count has increased with time, but this increase was not statistically significant (P>0.05).
- –
- In the K-Biocer group, there was a decrease in Enterococcus faecalis with a borderline significance unlike the rest of the groups (P≈0.05).
- –
- At days 3, 7, and 14, the Enterococcus faecalis count was significantly greater in the control group, compared to all the other groups (P<0.05).
- At day 7, a statistically significant difference was observed in Enterococcus faecalis count between Bio-C Sealer and Sealite (P=0.040).
Figure 3.
Changes in Enterococcus faecalis count for the seven groups over 14 days.
- Descriptive statistics of Pseudomonas aeruginosa count according to the seven different groups and the three different timepoints, and results of the comparisons between values of every sealer and the control group within each timepoint, and between the timepoints within each group are shown in Table 4.
Table 4.
Descriptive statistics of Pseudomonas aeruginosa count (x106) according to groups and time.
Table 4.
Descriptive statistics of Pseudomonas aeruginosa count (x106) according to groups and time.
| Groups | Time | |||
|---|---|---|---|---|
| Day 3 | Day 7 | Day 14 | p-value | |
|
Control (n=9) Mean ± SD Median (Q1 – Q3) |
10.22 ± 1.92B 9 (9 – 11.5)B |
10.44 ± 2.24B 12 (8 – 12)B |
12.22 ± 2.82A 12 (10 – 14.5)A |
0.012* |
|
CeraSeal (n=9) Mean ± SD Median (Q1 – Q3) |
6.89 ± 1.69A 7 (5.5 – 8.5)A |
6.44 ± 1.59AB 6 (5.5 – 8)AB |
5.22 ± 1.39B 5 (4 – 7)B |
0.040* |
| p-value (difference with the control group) | 0.001* | <0.001* | <0.001* | |
|
TotalFill (n=8) Mean ± SD Median (Q1 – Q3) |
6.12 ± 1.73 5.5 (5 – 7.75) |
5.25 ± 1.03 5 (4.25 – 6) |
4.87 ± 0.83 5 (4 – 5.75) |
0.199 |
| p-value (difference with the control group) | <0.001* | <0.001* | <0.001* | |
|
Bio-C Sealer (n=9) Mean ± SD Median (Q1 – Q3) |
6.78 ± 1.39 7 (5.5 – 8) |
6.22 ± 1.56 7 (5 – 7) |
5.78 ± 1.39 6 (4.5 – 7) |
0.356 |
| p-value (difference with the control group) | <0.001* | <0.001* | <0.001* | |
|
AH Plus (n=9) Mean ± SD Median (Q1 – Q3) |
6.89 ± 1.17 7 (6 – 7.5) |
6.11 ± 1.62 6 (5 – 7.5) |
5.56 ± 1.42 5 (4 – 7) |
0.347 |
| p-value (difference with the control group) | <0.001* | <0.001* | <0.001* | |
|
K-Biocer (n=9) Mean ± SD Median (Q1 – Q3) |
6.22 ± 1.39 6 (5 – 7.5) |
6.67 ± 1.22 6 (6 – 7.5) |
5.89 ± 1.90 6 (4 – 8) |
0.462 |
| p-value (difference with the control group) | 0.001* | 0.001* | 0.001* | |
|
Sealite (n=9) Mean ± SD Median (Q1 – Q3) |
7.11 ± 1.54 7 (5.5 – 8.5) |
6.56 ± 1.74 7 (5 – 8) |
6.22 ± 1.39 6 (5 – 8) |
0.244 |
| p-value (difference with the control group) | 0.002* | 0.001* | 0.005* | |
SD = standard deviation; Q1 = first quartile; Q3 = third quartile; *P<0.05; different uppercase superscript letters indicate statistically significant differences between the timepoints within the control and CeraSeal groups.
-
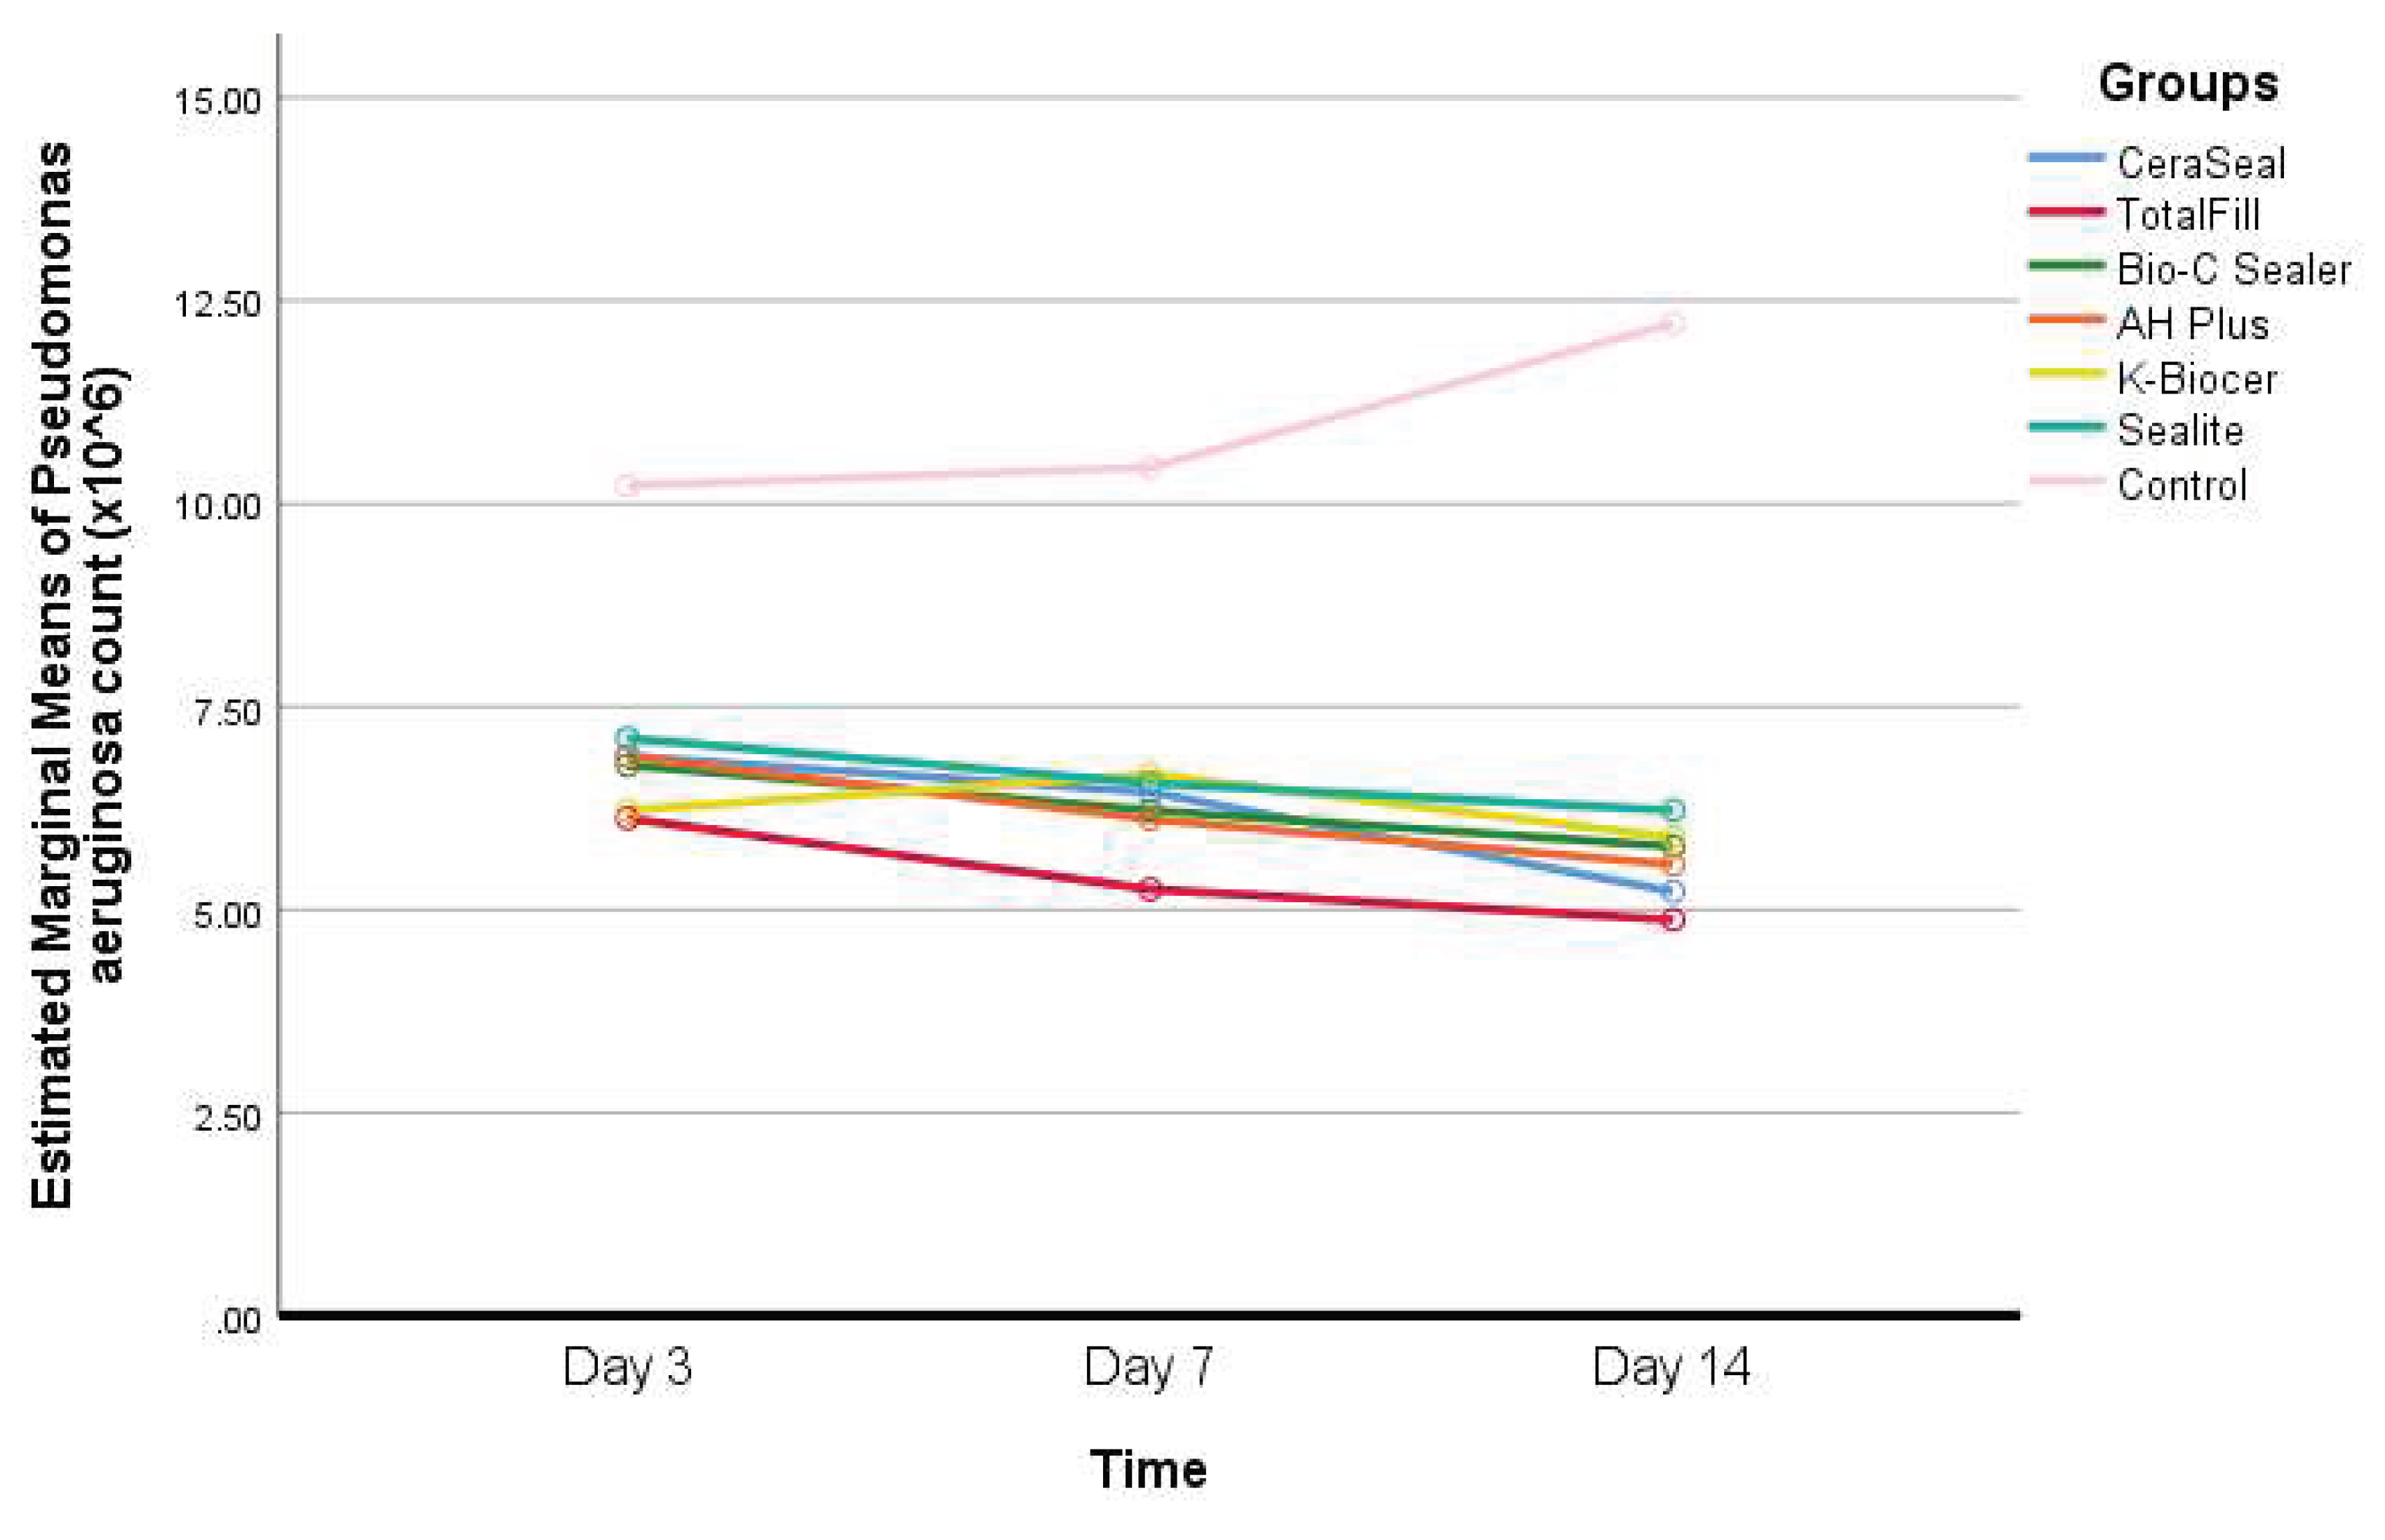
Interpretation of Table 4: - The increase in Pseudomonas aeruginosa count in the control group was statistically significant between day 3 and day 14 (P<0.05).
- –
- Decreases were observed in Pseudomonas aeruginosa count in the sealers’ groups between days 3 and 14, but this decrease was statistically significant in the CeraSeal group only (P<0.05).
- –
- At days 3, 7, and 14, the Pseudomonas aeruginosa count was significantly greater in the control group, compared to all the other groups (P<0.05).
- At day 7, a statistically significant difference in Pseudomonas aeruginosa counts was observed between TotalFill and K-Biocer (P=0.022).
Figure 4.
Changes in Pseudomonas aeruginosa count for the seven groups over 14 days.
- Descriptive statistics of Proteus Mirabilis count according to the seven different groups and the three different timepoints, and results of the comparisons between values of every sealer and the control group within each timepoint, and between the timepoints within each group are shown in Table 5.
Table 5.
Descriptive statistics of Proteus Mirabilis count (x106) according to groups and time.
| Groups | Time | |||
|---|---|---|---|---|
| Day 3 | Day 7 | Day 14 | p-value | |
|
Control (n=9) Mean ± SD Median (Q1 – Q3) |
11.22 ± 1.92 11 (10 – 13) |
12.33 ± 1.93 12 (10.5 – 14.5) |
11.78 ± 1.30 11 (11 – 13) |
0.328 |
|
CeraSeal (n=9) Mean ± SD Median (Q1 – Q3) |
6.67 ± 1.41 7 (5.5 – 8) |
5.67 ± 1.58 5 (4 – 7) |
5.22 ± 0.83 5 (4.5 – 6) |
0.177 |
| p-value (difference with the control group) | <0.001* | <0.001* | <0.001* | |
|
TotalFill (n=8) Mean ± SD Median (Q1 – Q3) |
5.75 ± 2.05 5 (4 – 7.75) |
5.62 ± 1.30 5.5 (4.25 – 7) |
4.75 ± 0.89 4.5 (4 – 5.75) |
0.341 |
| p-value (difference with the control group) | <0.001* | <0.001* | <0.001* | |
|
Bio-C Sealer (n=9) Mean ± SD Median (Q1 – Q3) |
6.11 ± 1.69AB 6 (4.5 – 7.5)AB |
6.22 ± 1.20A 6 (5.5 – 7)A |
5.22 ± 1.39B 5 (4 – 6)B |
0.040* |
| p-value (difference with the control group) | <0.001* | <0.001* | <0.001* | |
|
AH Plus (n=9) Mean ± SD Median (Q1 – Q3) |
6.67 ± 0.87 6 (6 – 7.5) |
6.44 ± 1.67 6 (5 – 8) |
5.56 ± 1.13 6 (4.5 – 6.5) |
0.261 |
| p-value (difference with the control group) | <0.001* | <0.001* | <0.001* | |
|
K-Biocer (n=9) Mean ± SD Median (Q1 – Q3) |
6.67 ± 0.87 6 (6 – 7.5) |
5.67 ± 1.58 5 (4 – 7) |
5.33 ± 0.87 6 (4.5 – 6) |
0.085 |
| p-value (difference with the control group) | <0.001* | <0.001* | <0.001* | |
|
Sealite (n=9) Mean ± SD Median (Q1 – Q3) |
6.89 ± 1.05 7 (6 – 8) |
6.44 ± 1.94 6 (4.5 – 8.5) |
5.56 ± 1.01 5 (5 – 6.5) |
0.234 |
| p-value (difference with the control group) | <0.001* | <0.001* | <0.001* | |
SD = standard deviation; Q1 = first quartile; Q3 = third quartile; *P<0.05; different uppercase superscript letters indicate statistically significant differences between the timepoints within the Bio-C Sealer group.
-
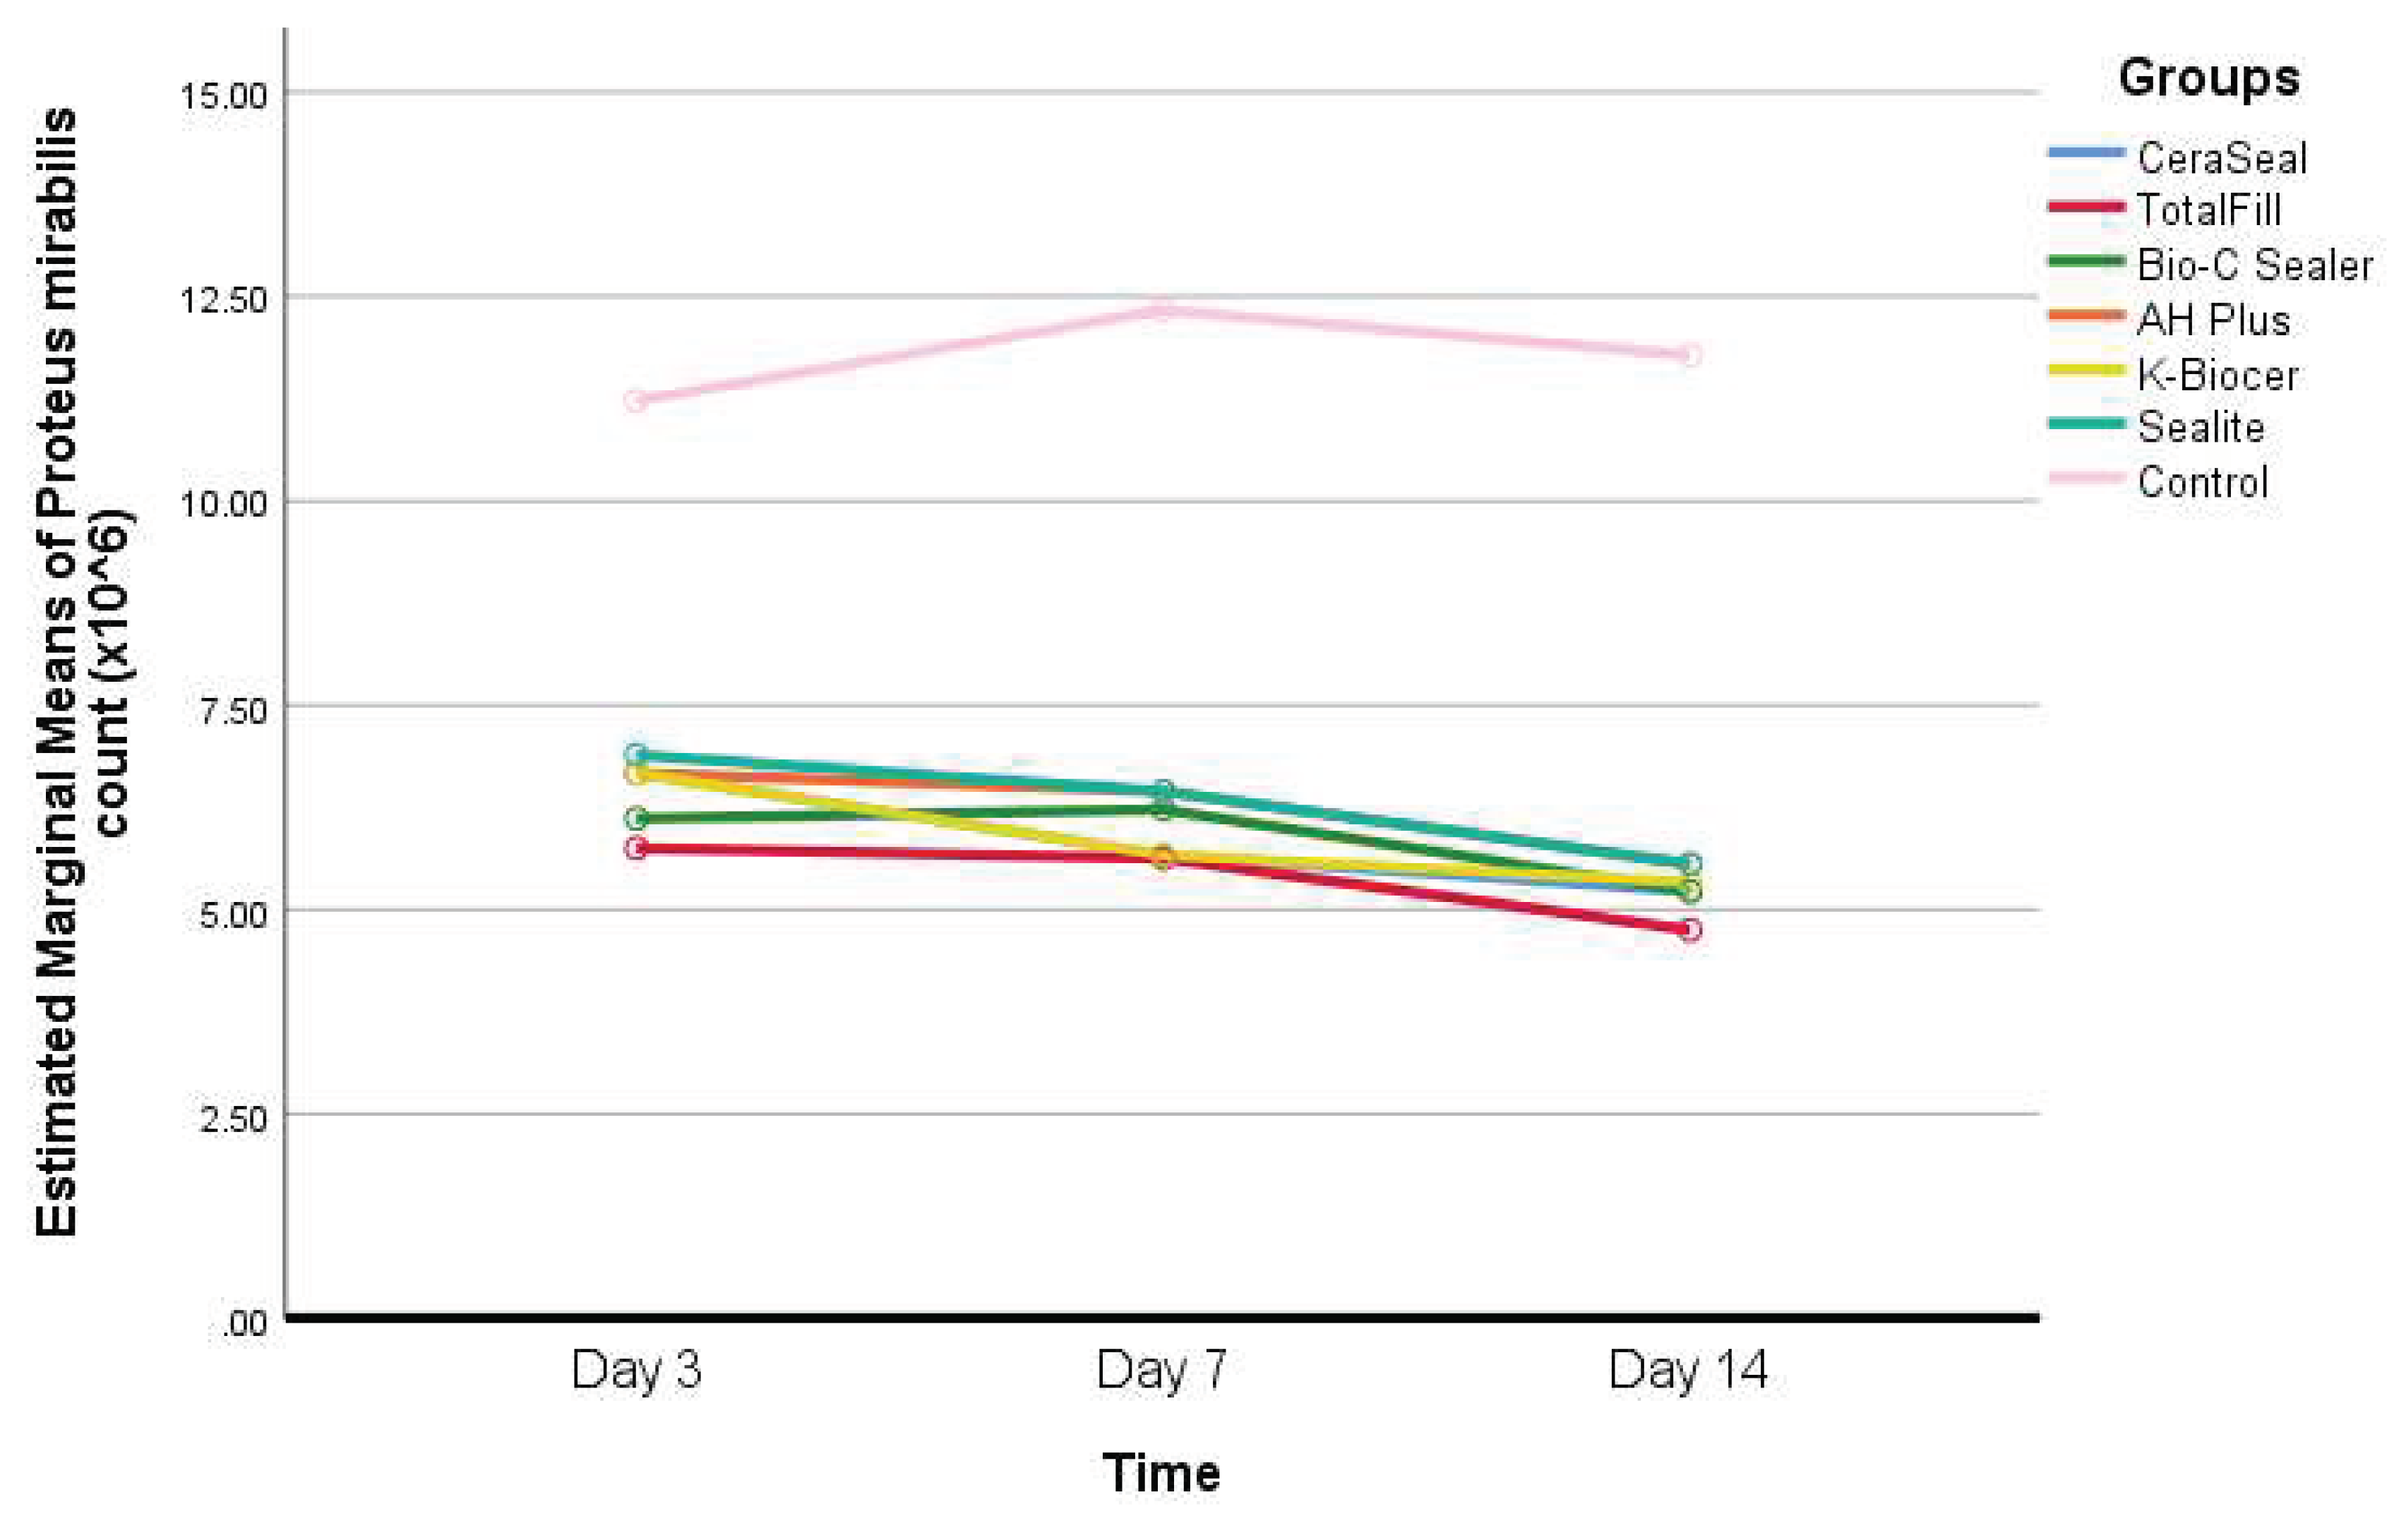
Interpretation of Table 5: - Only in the Bio-C Sealer group, a statistically significant decrease in Proteus Mirabilis count was observed between day 7 and day 14 (P<0.05).
- –
- The differences between timepoints in all the other groups were not statistically significant (P>0.05).
- –
- At days 3, 7, and 14, the Proteus Mirabilis count was significantly greater in the control group, compared to all the other groups (P<0.05).
- As for the Proteus Mirabilis count, no statistically significant differences were found among the different sealers’ groups at all timepoints (P>0.05).
Figure 5.
Changes in Proteus Mirabilis count for the seven groups over 14 days.
4. Discussion
One of the primary causes of pulp necrosis, periapical pathology and unsuccessful root canal treatments is bacteria, their compounds, and their ability to form biofilms. Hence, the primary goal of root canal therapy is to eliminate bacteria and stop them from spreading throughout the root canal system [3,4]. This highlights the need of maximizing the effectiveness of irrigants to improve disinfection [12], before filling the root canal systems with sealing compounds and filling materials that have antibacterial effects, especially before setting [13]. The aim of this study was to compare the impact of different bioceramics and sealite on a multispecies endodontic biofilm elimination at 3, 7 and 14 days.
Most of the studies on antimicrobial activity use a monospecies biofilm which is far from the in vivo situation [4], in which infected canals host a polymicrobial infection where microorganisms create three-dimensionally structured communities with fluid channels for the transportation of food, waste, and signal molecules [14]. Further, several studies have shown that multispecies biofilms demonstrate increased resistance to antimicrobial treatment compared to monoculture biofilms [3,13,15]. For example, when the aerobic bacteria consume the oxygen they provide anaerobic circumstances inside the deeper layers of the biofilm, for instance, anaerobic bacteria are able to survive aerobic conditions when grown in a mixed biofilm [4,14,16].
Since only a specific set of microorganisms thrive in the environment of the necrotic root canal, 4 microorganisms were selected for this study, Enterococcus faecalis is a pioneer bacteria in the formation of endodontic biofilm, a resistant to all kind of irrigation techniques [17] which make it one of the main reasons of the persistence of a periapical lesion after endodontic treatment [4,17,18]. Pseudomonas Aeruginosa, Candida Albicans and Proteus Mirabilis are some of the main microorganisms in a necrotic pulpal infection [4].
Bioceramic sealers have the advantage of extended antimicrobial activity in comparison with Sealite R that can lose antimicrobial activity after setting [19]. Within all the first 5 groups, the total bacterial count has significantly decreased between day 3 and day 14 (P<0.05) this antibacterial activity is mostly related to their capacity to raise pH after releasing hydroxyl ions in comparison with traditional sealers [19,20]. The production of calcium silicate hydrogel and calcium hydroxide, which raise and maintain a high pH in the root canal environment is facilitated by moisture from dentin [21]. When silica is dissolved in a high pH environment, it can directly reduce the viability of bacteria [9,11,21].
Total fill R bioceramic sealer, at day 14, killed more bacteria but no statistical difference was found in comparison with the other groups at all time points. This result might be related to the capability of Total fill to have a long-lasting antimicrobial ability for up to 30 days due to the biomineralization process induced by calcium silicates/phosphates from the sealer and from the dentin minerals [22]. In another study?/?/??which one, TotalFill BC demonstrated effective antibacterial activities against single-species and multi-species endodontic biofilm utilizing a direct contact test and confocal laser scanning microscopy. It also killed over 40% of E. faecalis biofilm in dentin [23]. Using a modified direct contact test, a recent study found that TotalFill BC had more antibacterial activity than AH-Plus sealer [24].
In addition, the high solubility of AHplus Bioceramic sealer and Ceraseal increases the production of calcium silicate facilitated by the moisture, this can positively impact the antibacterial effect [25,26].
On the other hand, we compared the antibacterial properties of bioceramic sealers with zinc oxide eugenol cement, in the Sealite group, Candida Albicans count has significantly decreased between day 3 and day 14 (P<0.05) in comparison with the other groups. In fact in a comparative study of Harni Priya et al. showed that zinc oxide eugenol had a maximum antifungal activity on Candida Albicans [27], this finding is also in concordance with the comparative study of Saha et al. where a zinc oxide eugenol-based sealer showed maximum zone of inhibition affirming the highest antimicrobial activity on Candida Albicans [28]. These results are probably due to the composition and biophysical characteristics of the sealer [19,25,26,27].
5. Conclusion
Overall, the CSBS tested in our study displayed antibacterial qualities comparable or even superior to those of traditional sealers. Nevertheless, it has been noted that there is a lack of consistency in the evaluation of antibacterial characteristics. Therefore, the clinician should rely on the root canal disinfection procedure and irrigant activation techniques instead of the antibacterial properties of endodontic sealers.
References
- Byström A., Sundqvist G. Bacteriologic evaluation of the effect of 0.5 percent sodium hypochlorite in endodontic therapy. Oral Surg. Oral Med. Oral Pathol. 1983;55:307–312. [CrossRef]
- Waltimo T., Trope M., Haapasalo M., Ørstavik D. Clinical efficacy of treatment procedures in endodontic infection control and one year follow-up of periapical healing. J. Endod. 2005;31:863–866. [CrossRef]
- Duggan J.M., Sedgley C.M. Biofilm formation of oral and endodontic Enterococcus faecalis. J. Endod. 2007;33:815–818. [CrossRef]
- Swimberghe RCD, Coenye TRJ, De Moor G, et al. Biofilm model systems for root canal disinfection: a literature review. Int Endod J. 2019;52(5):604–628. [CrossRef]
- Camilleri J. Will Bioceramics be the Future Root Canal Filling Materials? Curr. Oral Health Rep. 2017;4:228–238. [CrossRef]
- Camps J., Jeanneau C., El Ayachi I., Laurent P., About I. Bioactivity of a Calcium Silicate–based Endodontic Cement (BioRoot RCS): Interactions with Human Periodontal Ligament Cells in Vitro. J. Endod. 2015;41:1469–1473. [CrossRef]
- Silva Almeida L.H., Moraes R.R., Morgental R.D., Pappen F.G. Are Premixed Calcium Silicate–based Endodontic Sealers Comparable to Conventional Materials? A Systematic Review of In Vitro Studies. J. Endod. 2017;43:527–535.. [CrossRef]
- Lim M., Jung C., Shin D.-H., Cho Y.-B., Song M. Calcium silicate-based root canal sealers: A literature review. Restor. Dent. Endod. 2020;45:e35. [CrossRef]
- Zordan-Bronzel C.L., Tanomaru-Filho M., Rodrigues E.M., Chávez-Andrade G.M., Faria G., Guerreiro-Tanomaru J.M. Cytocompatibility, bioactive potential and antimicrobial activity of an experimental calcium silicate-based endodontic sealer. Int. Endod. J. 2019;52:979–986. [CrossRef]
- Urban K., Neuhaus J., Donnermeyer D., Schäfer E., Dammaschke T. Solubility and pH Value of 3 Different Root Canal Sealers: A Long-term Investigation. J. Endod. 2018;44:1736–1740.. [CrossRef]
- Candeiro G.T.d.M., Correia F.C., Duarte M.A.H., Ribeiro-Siqueira D.C., Gavini G. Evaluation of Radiopacity, pH, Release of Calcium Ions, and Flow of a Bioceramic Root Canal Sealer. J. Endod. 2012;38:842–845. [CrossRef]
- Hage, W.; De Moor, R.J.G.; Hajj, D.; Sfeir, G.; Sarkis, D.K.; Zogheib, C. Impact of Different Irrigant Agitation Methods on Bacterial Elimination from Infected Root Canals. Dent. J. 2019, 7, 64. [CrossRef]
- Kapralos V., Koutroulis A., Ørstavik D., Sunde P.T., Rukke H.V. Antibacterial Activity of Endodontic Sealers against Planktonic Bacteria and Bacteria in Biofilms. J. Endod. 2018;44:149–154. [CrossRef]
- Siqueira, J.F., Jr.; Rôças, I.N. Present status and future directions: Microbiology of endodontic infections. Int. Endod. J. 2021. Int Endod J. 2022; 55: 512-530. [CrossRef]
- Garg A, Mala K, Kamath PM. Biofilm models in endodontics-A narrative review. J Conserv Dent. 2021 Jan-Feb;24(1):2-9. Epub 2021 Jul 5. PMID: 34475672; PMCID: PMC8378488. [CrossRef]
- Jhajharia K, Parolia A, Shetty KV, Mehta LK. Biofilm in endodontics: A review. J Int Soc Prev Community Dent. 2015;5:1–2. [CrossRef]
- Alghamdi F, Shakir M. The influence of Enterococcus faecalis as a dental root canal pathogen on endodontic treatment: A systematic review. Cureus. 2020 Mar 13;12(3). [CrossRef]
- Colaco AS. Extreme resistance of Enterococcus faecalis and its role in endodontic treatment failure. Prog Med Sci. 2018;2(1):9-13. [CrossRef]
- Sfeir G, Zogheib C, Patel S, Giraud T, Nagendrababu V, Bukiet F. Calcium silicate-based root canal sealers: A narrative review and clinical perspectives. Materials. 2021 Jul 15;14(14):3965.. [CrossRef]
- Bukhari S., Karabucak B. The Antimicrobial Effect of Bioceramic Sealer on an 8-week Matured Enterococcus faecalis Biofilm Attached to Root Canal Dentinal Surface. J. Endod. 2019;45:1047–1052. [CrossRef]
- Šimundić Munitić M, Poklepović Peričić T, Utrobičić A, Bago I, Puljak L. Antimicrobial efficacy of commercially available endodontic bioceramic root canal sealers: A systematic review. PLoS One. 2019;14(10):e0223575. [CrossRef]
- Šimundić Munitić M, Budimir A, Jakovljević S, Anić I, Bago I. Short-Term Antibacterial Efficacy of Three Bioceramic Root Canal Sealers Against Enterococcus Faecalis Biofilms. Acta Stomatol Croat. 2020 Mar;54(1):3-9. PMID: 32523152; PMCID: PMC7233124. [CrossRef]
- Wang Z, Shen Y, Haapasalo M. Antimicrobial and Antibiofilm Properties of Bioceramic Materials in Endodontics. Materials (Basel). 2021 Dec 10;14(24):7594. PMID: 34947188; PMCID: PMC8706218. [CrossRef]
- Zhang H, Shen Y, Ruse ND. Antibacterial activity of endodontic sealers by modified direct contact test against Enterococcus faecalis. J Endod. 2009. July;35(7):1051–5. [CrossRef]
- de Souza LC, Neves GS, Kirkpatrick T, Letra A, Silva R. Physicochemical and Biological Properties of AH Plus Bioceramic. Journal of Endodontics. 2023 Jan 1;49(1):69-76. [CrossRef]
- Kharouf N, Arntz Y, Eid A, Zghal J, Sauro S, Haikel Y, Mancino D. Physicochemical and antibacterial properties of novel, premixed calcium silicate-based sealer compared to powder–liquid bioceramic sealer. Journal of Clinical Medicine. 2020 Sep 25;9(10):3096. [CrossRef]
- Harini Priya M, Bhat SS, Sandeep Hegde K. Comparative evaluation of bactericidal potential of four root canal filling material against microflora of infected non-vital primary teeth. J Clin Pediatr Dent. 2010;35(1):23–29. [CrossRef]
- Saha S, Samadi F, Jaiswal JN, et al. Antimicrobial activity of different endodontic sealers: an in vitro evaluation. J Indian Soc Pedod Prev Dent. 2010;28(4):251–257. [CrossRef]
Disclaimer/Publisher’s Note: The statements, opinions and data contained in all publications are solely those of the individual author(s) and contributor(s) and not of MDPI and/or the editor(s). MDPI and/or the editor(s) disclaim responsibility for any injury to people or property resulting from any ideas, methods, instructions or products referred to in the content. |
© 2023 by the authors. Licensee MDPI, Basel, Switzerland. This article is an open access article distributed under the terms and conditions of the Creative Commons Attribution (CC BY) license (http://creativecommons.org/licenses/by/4.0/).
Copyright: This open access article is published under a Creative Commons CC BY 4.0 license, which permit the free download, distribution, and reuse, provided that the author and preprint are cited in any reuse.


