
Submitted:
24 April 2023
Posted:
25 April 2023
You are already at the latest version
Preprints on COVID-19 and SARS-CoV-2
Abstract
The last decade was characterized by the reduction of hospital beds throughout Europe. When facing Covid pandemic, this has been an issue of major importance as hospitals were seriously overloaded with an unexpected growth in demand. The dichotomy formed by the scarcity of beds and the need for acute care was handled by the Bed Management (BM) function. This study explores how BM was able to help the solidness of the healthcare system, managing hospital beds at best and recruiting others in different set-tings as intermediate care, in a large Local Health Authority (LHA) in central Italy. Ad-ministrative data show how the provision of appropriate care was achieved recruiting approximately 500 beds belonging to private healthcare facilities affiliated with the re-gional healthcare system and exercising at best the BM function. The ability of the system to absorb the extra demand caused by Covid was made possible using intermediate care beds, which allowed to stretch the logistic boundaries of the hospitals, and by the promptness of Bed Management in converting beds in Covid beds and reconverting them and timely managing internal patient logistic, thus creating space according to the healthcare demand.
Keywords:
Covid pandemic
; Bed Management
; system solidness.
1. Introduction
Bed Management (BM) is a form of proactive resource control based on a constant assessment of hospital services and incoming patients flow from the Emergency Department (ED) towards the most appropriate setting of care [1]. Boaden and colleagues [2] define it as the process of reconciliation between the demand and the supply of beds, a scarce resource. BM is generally carried out by a dedicated team, that provides real-time operational status of the capacity to receive of a hospital. The BM team is usually formed by nurses [3] and many hospitals around the world adopted various forms of electronic systems to help with the necessity of having a real-time availability beds’ status [4]. A recent systematic review [5] underlines that the appropriateness of this function depends on a variety of uncertain factors which may take the form of patient length of stay (LoS), fluctuations in healthcare demand, unexpected admissions, just to name a few. The complex nature of BM classifies it as part of the Operations Management (OM), a variety of managerial practices that designs and controls the production processes and the production of services. It is referred at as the way in which the organization creates the highest level of efficiency possible [6]. BM is a function that must be deeply rooted in the hospital structure as it must consider the reality constraints, namely the number of available beds and make them available with the appropriateness due to the patient condition. These functions generate data, or routinely collected health data, that were the base for this paper. This latter analyses the timeliness and the ability of a BM team operations in a large LHA in central Italy during the Covid outbreak. This unparalleled calamity gave the opportunity to observe the organizational behaviour of the healthcare system during a public health crisis that presented not only clinical, but also managerial criticalities. The first two waves of the infection spreading took place in the time frame from the 15th of March 2020 and the 15th of May 2020 and the second from the 15th of September to the 15th of December 2020. The analysis performed are aimed at describing the commitment in providing care for Covid infected and non-infected patients, creating a “bed-buffer” through the recruitment of approximately 500 beds from the intermediate care setting.
1.1. An Italian Case Study:
The OECD Report “Health at a glance” 2019 [7] shows how Italy is characterized by a low number of hospital beds: 2.6 beds per 1000 inhabitants. This is the result of policies aimed at reducing acute care beds, in line with general European trend: since 2000 in all EU countries, the number of beds per capita fell by 20% [8]. The Italian National Healthcare System (NHS) is regionally based, the State holds the power to address and control the regional policies and outcomes and public care is largely free of charge. The 20 Regions are free to organize the provision of care in the way they estimate to be the best to meet their residents’ needs. In 2015 a reorganization of the hospital care network was undertaken, and alternative forms of hospitalization were created (e.g., community care facilities, intermediate care facilities) alongside with a binding hospital planning criterion: the equipment of hospital beds must not exceed 3,7 beds per 1000 inhabitants.
This case study focuses on the USL Toscana Centro (USLTC), an LHA with a catchment area of 1.700.000 inhabitants on a surface of 5000 square kilometres (that coincide with the medium-sized cities of Firenze, Prato, Pistoia and Empoli) in which 13 hospitals are based. This LHA integrates different services that extend from the prevention of illnesses to the long-term care: Table 1 summarizes its activity during 2020:
To cope with the Covid emergency, the Italian Ministry of Health increased the number of inpatients and Intensive Care Unit (ICU) beds, the latter being a worldwide utter concern [9]. At the end of summer 2019, other interventions were put in place to reinforce both community care and intermediate care with the aim to relieve the pressure on hospitals, although with a different capacity throughout the Italian regions [10]. Pecoraro et al. [11] describe how the robustness of Italian (and Spanish) hospitals’ structural components was much smaller than German and French, that could count on a larger number of beds, which mitigated the effects of the massive request of hospitalization at the beginning of the pandemic. The starting point was not the best, but as presented in recent literature [11], Tuscany reported positive results in bed managing during Covid pandemic, and this is attributed to the ability to handle complex cases determining a short length of stay (LoS) when compared to the national average [12].
This study aims at describing monthly trends of Covid and No-Covid bed use during the first two waves of the pandemic and the intermezzo in three care settings: (i) ICU and sub-acute ICU (sub-ICU, a step-down from intensive care setting which still provides more intensive care then the inpatients setting), (ii) inpatient (internal medicine, surgery), (iii) intermediate care, through the use of administrative healthcare data.
Concerning intermediate care, it has to be said that they are meant to be a place for mostly chronically ill, elderly patients, a middle level between acute hospital care and basic care. During the pandemic they were used as a buffer, a way to alleviate the pressure on hospitals, and it was crucial to their functioning [13, 14].
2. Materials and Methods
Before getting to the core of the paper, a clarification about the way beds is counted when occupied by an infected patient is necessary, as reported in Figure 1:
In a room with non-infected patients, beds are all available and computed as physically employable. If the room hosts an infected patient as in the case of Covid infection, not all the beds are available, hence computable, even if vacant. This is crucial to understand that hospital beds are not a flexible, or at least little fungible, resource. In the eventuality of a droplet transmitted virus, as the Coronavirus, a droplet isolation protocol has to be put in place [15] and this implies having less space for beds, the number of which is reduced.
Data for the analysis were gathered from the administrative data flows. In particular, the consulted information flows were the Hospital Discharge Record flow, the Intermediate Care Occupancy flow, and the administrative data used to populate CROSS (Centrale Remota per le Operazioni di Soccorso Sanitario, Remote Central for Health Rescue Operations) in the aforementioned periods of time, identified as first pandemic wave, second pandemic wave and intermezzo period. The CROSS system is a patient’s placement tool: Regions can activate it when no beds are available in their territories and ask other Regions for help. Its basic requirement is the ability to ensure, at least for the first 72 hours after the emergency hospitalization of the patient, adequate space availability, technological equipment, and human resources to offer the patient the best care possible. Data were extracted from a database that the Bed Manager created ad hoc and from the various interfaced used in the LHA.
We first explored the number of hospitalized patients and the mortality rates among the different settings. Finally, we calculated both the monthly number of available beds and the Beds Occupancy Rate (BOR), namely occupied inpatient beds as % of available beds over the observation period (first wave, intermezzo and second wave) in the three settings of interest to investigate if BM was able to remove the bottleneck created by Intensive care units (ICU) and Sub-ICU through the fast conversion and reconversion of beds from No-Covid to Covid (and vice-versa). Although there is no consensus over the ideal BOR percentage, 85% might be considered an optimal threshold to reduce the risk of bed shortages [16].
BOR parameter has taken on particular importance during the pandemic, stimulating the creation of tools to explore and track different Countries’ decisions. As an example, the Oxford COVID-19 Government Response Tracker (OxCGRT) is a database that tracks and shows Governments’ responses in relation to changes in the pandemic patterns, deciding policies like lockdowns, contact tracing activities, various types of containment in relation to parameters as BOR [17].
3. Results
During the entire period 7098 patients were admitted. 742 died (10.4%), 46 (4%) of which died in the Intermediate care setting as shown in Table 2. As expected, the highest in-hospital mortality rate was among ICU-sub-ICU patients (29%).
In the observation period, 88 patients were assessed in the Emergency Department (ED) and sent directly to Intermediate care. Table 3 resumes the breakdown of the hospital re-admission of the 88 patients that were directly sent to the Intermediate care setting when diagnosed.
The re-admission of 88 patients was necessary because patients faced subtle deterioration of their clinical condition after it appeared manageable, if not under resolution. In Table 4, total monthly Covid and No-Covid beds and BORs are reported for the first wave, the intermezzo (after the national lockdown) and second wave. As a side note, this data collection begun after ten days from the pandemic outbreak in Tuscany. Indeed, the system had no idea about the nature of the thread as no objective data were available (21) given that the first Italian case was notified on the 20th of February 2020. Healthcare personnel was literally unaware of the kind of response to put in place as nothing was known on the natural history of the infection, namely symptoms, adequate treatments, and recovery time.
The BOR has varied throughout the two waves, with a first peak in April, when the Intermediate Care beds worked as a system outlet valve: they registered a BOR of 83% while the BOR of Inpatient beds was at 71%. During the summer months all the Intermediate Care beds were reconverted into No-Covid beds, to allow the existing No-Covid healthcare demand to be addressed. In the same intermezzo period, the No-Covid Inpatients BOR has recorded a decline to 23%. During the second wave, the number of hospitalized patients was higher than the one registered in April, as all the beds were saturated: ICU and sub-ICU’s BOR was 78%, inpatients’ BOR and Intermediate Care’s BOR were 90% and 98% respectively. The ICU and sub-ICU occupancy rate during the first wave was lower because of the higher mortality rate, as the treatments were administered to patients empirically, that is based on clinical hypothesis yet not supported by complete information. Data show a greater use of ICU and sub-ICU beds and a minor use of Inpatients beds during the first wave as ICU and sub-ICU were extended to operating rooms, transforming them into negative pression-rooms. Intermediate Care beds were activated “on demand”: during summer there was no need to occupy them. Conversely, in autumn during the second wave were increased to sustain the system in coping with the healthcare demand increase. In Figure 2, the total availability and total occupancy of beds in the entire territory of the USLTC is reported in the period between the 15th of March and the 15th of December: as it shows in the trend of Covid beds, in the first months of the pandemic, a lot of beds were unoccupied. This can be attributed both to the lack of elements of evaluation of the virus behaviour and to the total suspension of all elective operating sessions. After the summer intermezzo, the difference between total beds and occupied beds is strongly reduced, especially from mid-October onwards. This trend demonstrates how the BM function was more than efficient in managing the processes of conversion and re-conversion of beds and how it was able to take full advantage of the additional beds from the intermediate care sector.
For what concerns the trend in No-Covid beds, the delta between available and occupied beds is bigger. This can be this can be and imputed to the slowdown suffered by elective surgery.
4. Discussion and Conclusions
Covid pandemic created several issues of major importance, among which a serious hospitals overload due to an unexpected growth in demand. We investigated the relationship between Covid and No-Covid beds during the first two waves of the pandemic in three settings: inpatients, ICU and sub-ICU, Intermediate care. Inpatients and Intermediate care beds were characterized by a very high BOR during the first wave, which was even higher in the second wave. The number of admissions was really high, as well as the mortality. The ability of the system to absorb the extra demand caused by Covid was made possible using intermediate care beds, which allowed to stretch the logistic boundaries of the hospitals [18] and by the promptness of Bed Management in converting beds in Covid beds and reconverting them and timely managing internal patient logistic, thus creating space according to the healthcare demand. This study presents several limitations: data were not promptly registered, and they refer to a single LHA. We described a system that appeared to be resilient, as the system has responded to pandemic pressures, but it is not possible to evaluate its performance as a benchmark is missing. In order to compare the efficiency of the management, especially for what concerns the BM, we should have data related to the same period of other similar companies in size and available staff. What is certain is that the healthcare system that we used to know doesn’t exist anymore, and the changes that Countries around the world will have to undergo mainly relate to the strengthening of the community care. As Griffin et al. highlight [19], during pandemic times is important to balance the connection between the hospital and the territory it serves: the hospital can be the first responder, but not the only one. Data support the choice to rely on intermediate care beds to relieve pressure from the hospitals, and therefore treat a larger number of patients [20].
Author Contributions
For research articles with several authors, a short paragraph specifying their individual contributions must be provided. The following statements should be used “Conceptualization, CB, MV, ES; methodology, MV, CS.; software, CS.; validation, CB MV, CS and ES.; formal analysis, MV, CS.; investigation, CB, ES.; resources, ES.; data curation, CS .; writing—original draft preparation, CB, MV, CS.; writing—review and editing, CB, MV, CS.; visualization PZ.; supervision, MV PZ.; project administration, MV.; All authors have read and agreed to the published version of the manuscript.”
Funding
This research received no external funding
Institutional Review Board Statement
the study did not require ethical approval, as not involving humans or animals.
Conflicts of Interest
The authors declare no conflict of interest.
References
- Howell E, Bessman E, Kravet S, Kolodner K, Marshall R, Wright S. Active bed management by hospitalists and emergency department throughput. Ann Intern Med. 2008;149(11):804–10. [CrossRef]
- Boaden R, Proudlove N, Wilson M. An exploratory study of bed management. J Manag Med. 1999; [CrossRef]
- Proudlove N, Boaden R, Jorgensen J. Developing bed managers: the why and the how. J Nurs Manag. 2007;15(1):34–42. [CrossRef]
- Balaji R, Brownlee M. Bed management optimization. From Infosys http//www infosyspublicservices com/industries/healthcare/Documents/hospital-bed-management pdf. 2009;
- He L, Madathil SC, Oberoi A, Servis G, Khasawneh MT. A systematic review of research design and modeling techniques in inpatient bed management. Comput Ind Eng. 2019;127:451–66. [CrossRef]
- Schroeder RG, Goldstein SM, Rungtusanatham MJ. Operations management. Vol. 1081. McGraw-Hill New York; 1993.
- OECD. Health at a Glance. 2019;
- OECD. Health at a Glance 2020. 2020.
- Goic M, Bozanic-Leal MS, Badal M, Basso LJ. COVID-19: Short-term forecast of ICU beds in times of crisis. PLoS One. 2021;16(1):e0245272. [CrossRef]
- Bosa I, Castelli A, Castelli M, Ciani O, Compagni A, Galizzi MM, et al. Response to COVID-19: was Italy (un) prepared? Heal Econ Policy Law. 2021;1–13.
- Pecoraro F, Clemente F, Luzi D. The efficiency in the ordinary hospital bed management in Italy: an in-depth analysis of intensive care unit in the areas affected by COVID-19 before the outbreak. medRxiv. 2020; [CrossRef]
- Sant’Anna SS. Welfare e salute in Toscana. welfare e salute in Toscana. Press Service Srl Firenze; 2019.
- Agnoletti V, Russo E, Circelli A, Benni M, Bolondi G, Martino C, et al. From intensive care to step-down units: Managing patients throughput in response to COVID-19. Int J Qual Heal Care. 2021; [CrossRef]
- Trentini F, Marziano V, Guzzetta G, Tirani M, Cereda D, Poletti P, et al. Pressure on the Health-Care System and Intensive Care Utilization During the COVID-19 Outbreak in the Lombardy Region of Italy: A Retrospective Observational Study in 43,538 Hospitalized Patients. Am J Epidemiol. 2022;191(1):137–46. [CrossRef]
- Tarrac SE. Application of the updated CDC isolation guidelines for health care facilities. AORN J. 2008;87(3):534–46. [CrossRef]
- OECD. OECD (2021), Health at a Glance 2021: OECD Indicators, OECD Publishing, Paris, https://doi.org/10.1787/ae3016b9-en. Sage Publications Sage CA: Los Angeles, CA; https://doi.org/10.1787/ae3016b9-en.
- Hale T, Angrist N, Goldszmidt R, Kira B, Petherick A, Phillips T, et al. A global panel database of pandemic policies (Oxford COVID-19 Government Response Tracker). Nat Hum Behav. 2021;5(4):529–38. https://doi.org/10.1038/s41562-021-01079-8.
- WHO. Hospital readiness checklist for COVID-19 interim version February 24 2020. World Health Organization. Regional Office for Europe; 2020.
- Griffin KM, Karas MG, Ivascu NS, Lief L. Hospital preparedness for COVID-19: a practical guide from a critical care perspective. Am J Respir Crit Care Med. 2020;201(11):1337–44. https://doi.org/10.1164/rccm.202004-1037cp.
- Sweeney J, Soutar G, Mazzarol T. Factors Enhancing the Effect of Word of Mouth on Consumer Outcomes. In: Factors Enhancing the Effect of Word of Mouth on Consumer Outcomes. IAE Aix en Provence; 2006. p. 826–41.
Figure 1.
How to compute beds when an infected patient is sharing space with other non-infected patients.
Figure 1.
How to compute beds when an infected patient is sharing space with other non-infected patients.
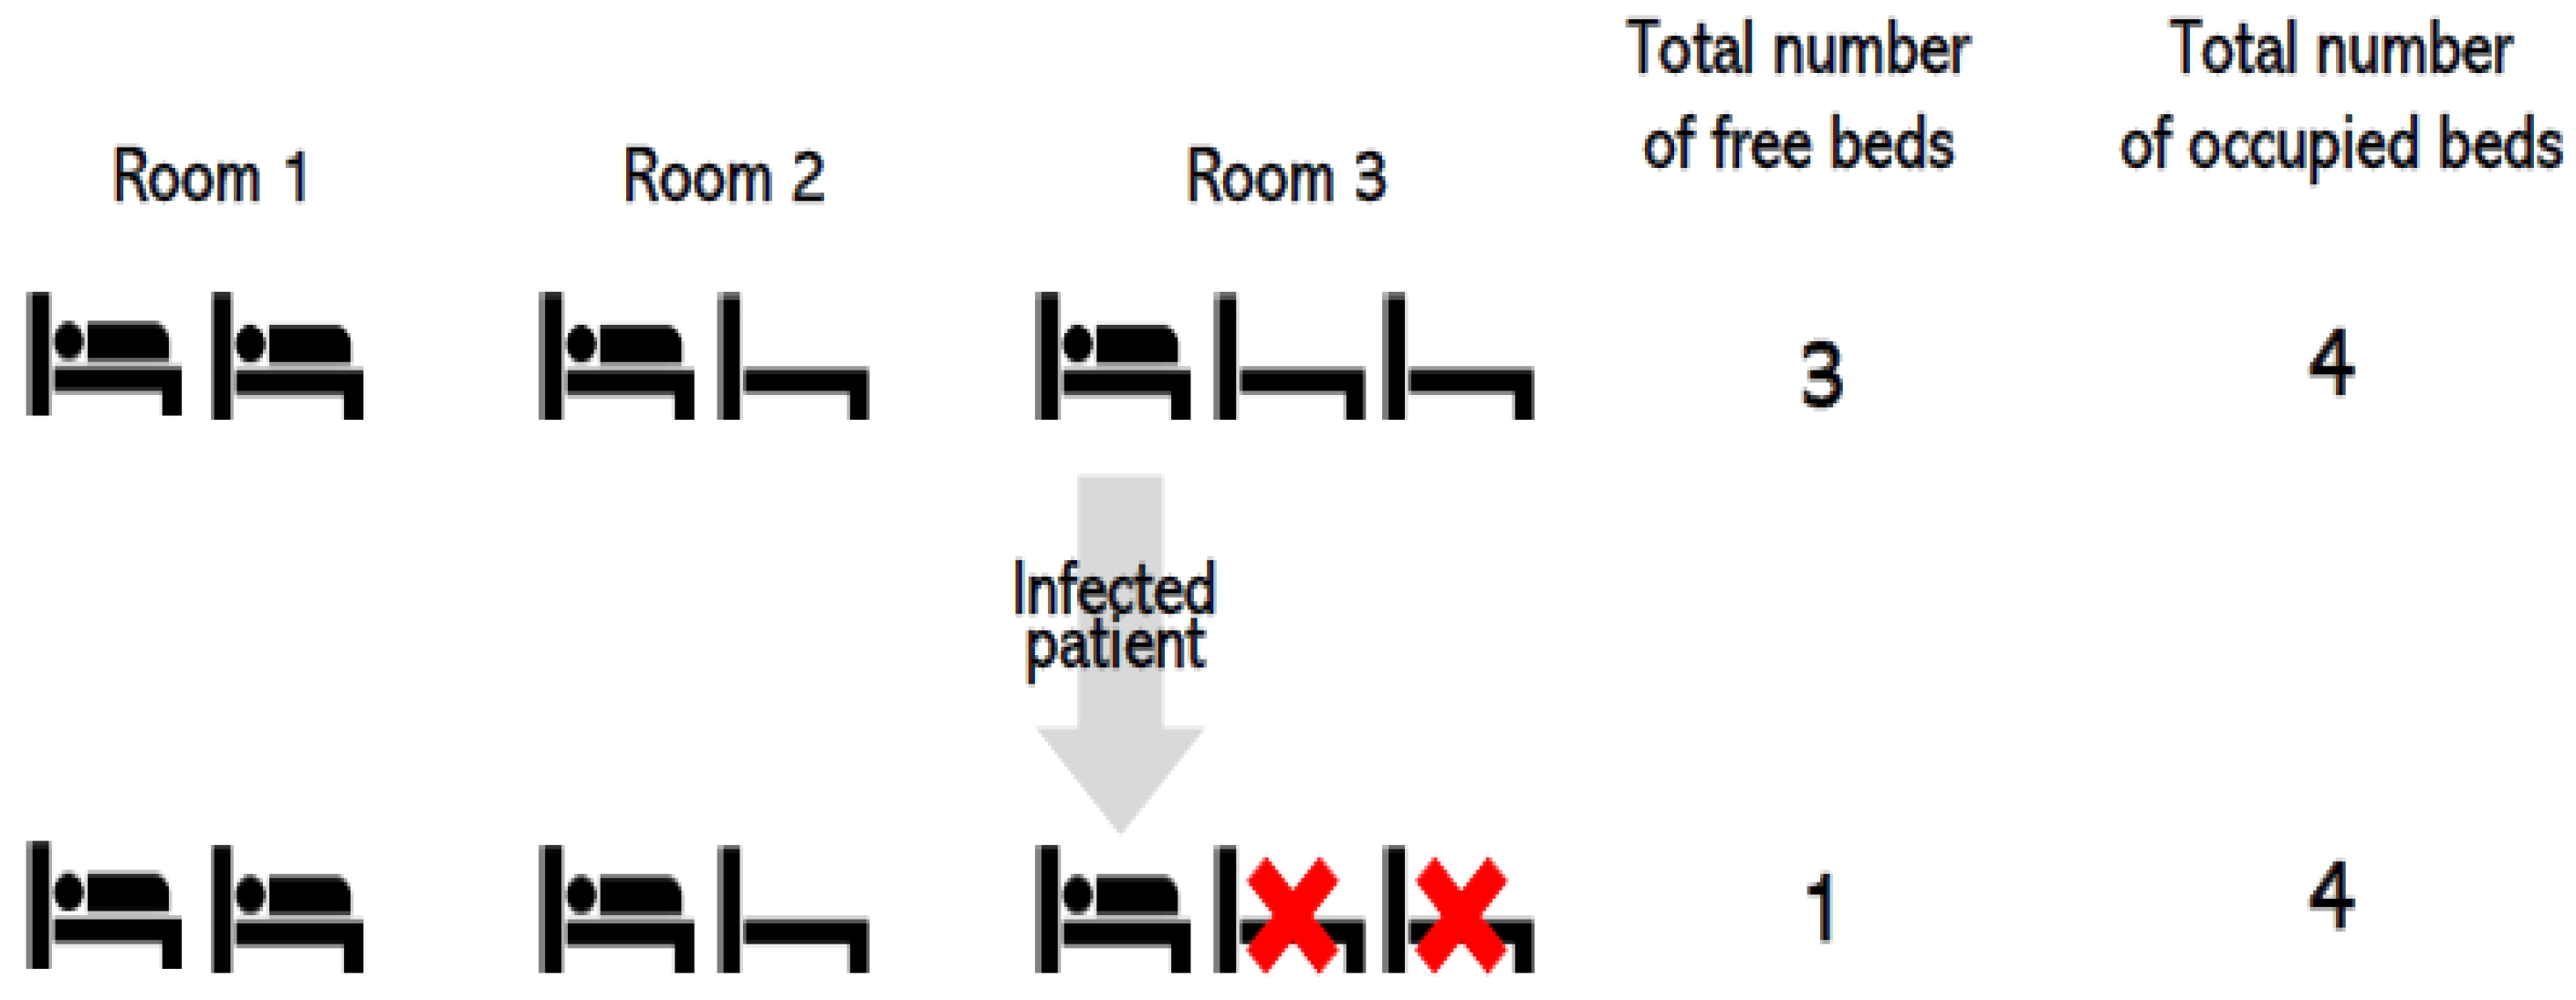
Figure 2.
Trends in total Covid and No-Covid beds/occupied beds from the 15th of March to the 15th of December 2020.
Figure 2.
Trends in total Covid and No-Covid beds/occupied beds from the 15th of March to the 15th of December 2020.
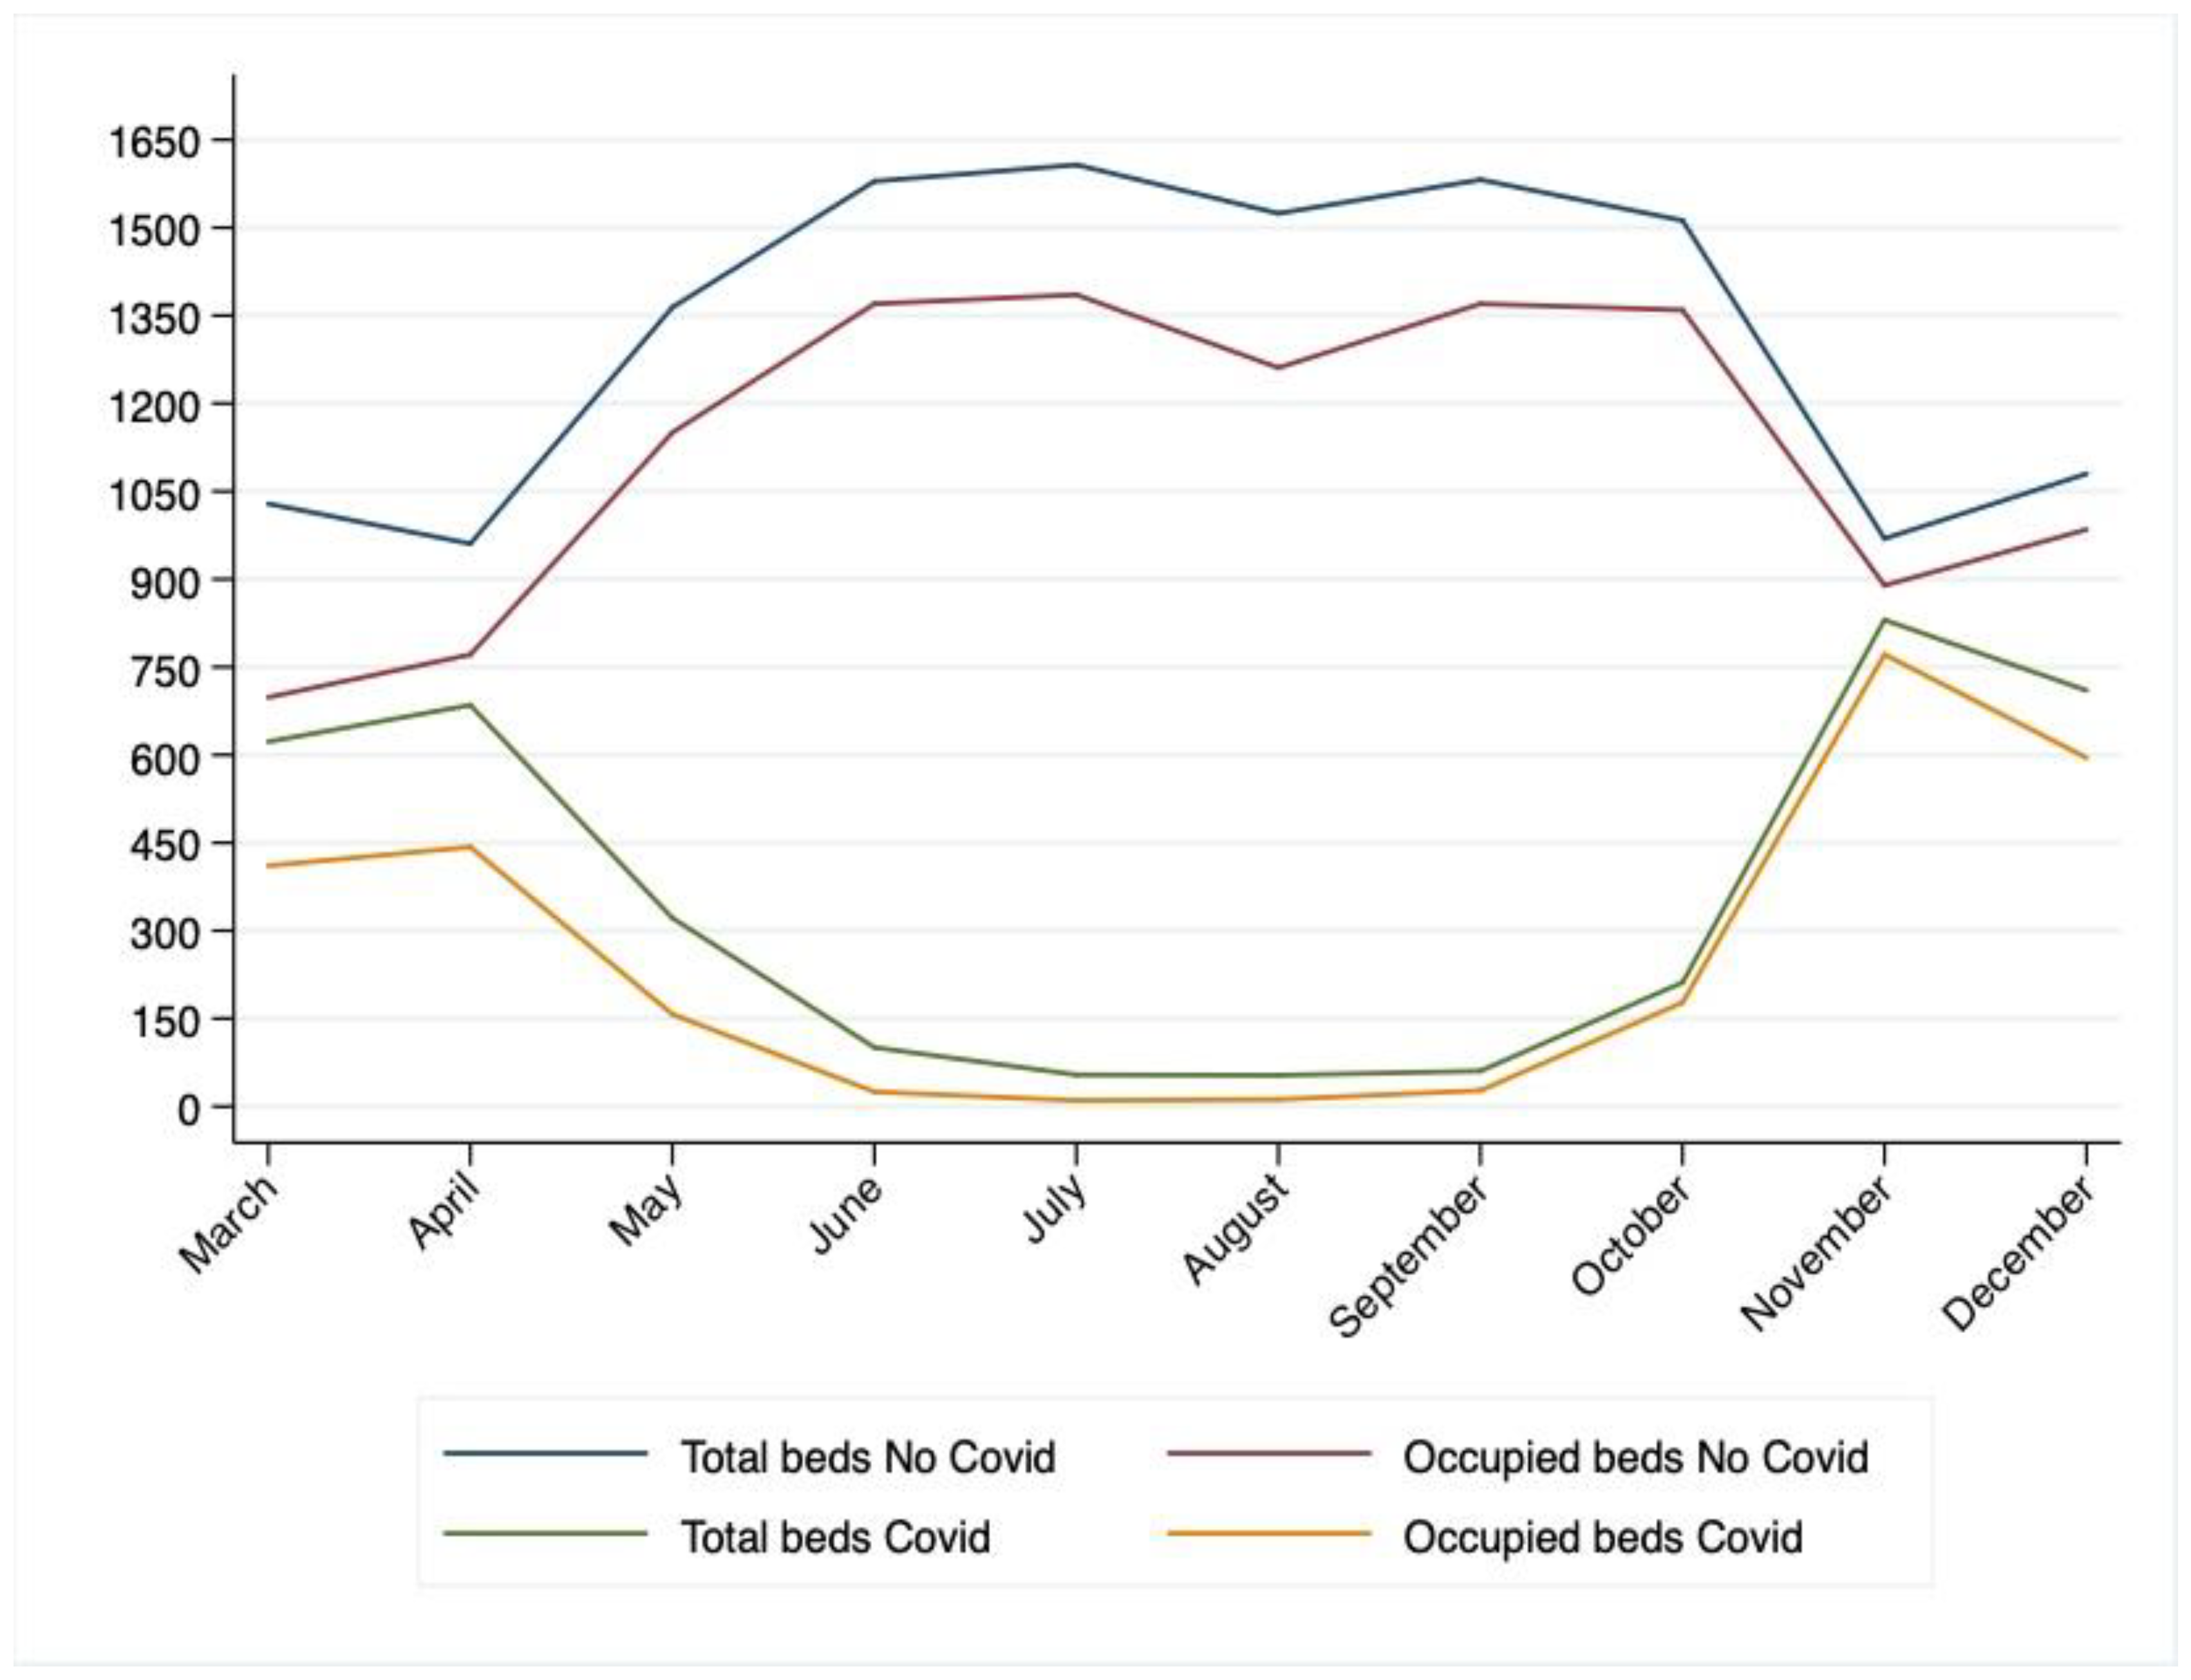

Table 1.
USLTC, 2020 activities.
| Year | Acute Beds | Occupancy Days | ED Accesses | Surgeries | Outpatient Services |
|---|---|---|---|---|---|
| 2020 | 2735 | 668.094 | 416.566 | 58.786 | 22.734.702 |
Table 2.
Total number of assessed and deceased patients 03/15/2020-12/15/2020.
| Setting | Admitted | Deceased | In-Hospital Mortality |
|---|---|---|---|
| Intermediate care | 1124 | 46 | 4% |
| Inpatient | 5470 | 549 | 10% |
| ICU-sub ICU | 504 | 147 | 29% |
| Total | 7098 | 742 | 10% |
Table 3.
hospital re-admission of patients initially assigned to the Intermediate care setting.
| Month | Hospital Covid Readmissions from Intermediate Care |
|---|---|
| March | 0 |
| April | 15 |
| May | 26 |
| June | 17 |
| July | 1 |
| August | 0 |
| September | 1 |
| October | 6 |
| November | 5 |
| December | 17 |
Table 4.
Number of Covid and No- Covid beds and BORs during the first wave, the intermezzo and the second wave.
Table 4.
Number of Covid and No- Covid beds and BORs during the first wave, the intermezzo and the second wave.
| Timing | Month | Setting | Covid Total Beds | BOR Covid | No-Covid Total Beds | BOR No-Covid |
|---|---|---|---|---|---|---|
| Wave 1 | 3-May | Intermediate care | 35 | 35% | 0 | 0% |
| Wave 1 | 3-May | Inpatients | 449 | 71% | 954 | 68% |
| Wave 1 | 3-May | ICU-sub ICU | 146 | 57% | 75 | 63% |
| Wave 1 | 4-April | Intermediate care | 90 | 83% | 0 | 0% |
| Wave 1 | 4 April | Inpatients | 454 | 66% | 895 | 81% |
| Wave 1 | 4 April | ICU-sub ICU | 141 | 48% | 65 | 67% |
| Wave 1 | 5-May | Intermediate care | 123 | 69% | 14 | 64% |
| Wave 1 | 5-May | Inpatients | 241 | 50% | 1136 | 88% |
| Wave 1 | 5-May | ICU-sub ICU | 63 | 39% | 109 | 70% |
| Intermezzo | 5-May | Intermediate care | 94 | 51% | 33 | 56% |
| Intermezzo | 5-May | Inpatients | 86 | 33% | 1321 | 84% |
| Intermezzo | 5-May | ICU-sub ICU | 44 | 27% | 118 | 75% |
| Intermezzo | 6-June | Intermediate care | 41 | 39% | 53 | 57% |
| Intermezzo | 6-June | Inpatients | 41 | 23% | 1383 | 89% |
| Intermezzo | 6-June | ICU-sub ICU | 23 | 6% | 143 | 75% |
| Intermezzo | 7-July | Intermediate care | 0 | 0% | 52 | 51% |
| Intermezzo | 7-July | Inpatients | 32 | 31% | 1408 | 89% |
| Intermezzo | 7-July | ICU-sub ICU | 22 | 0% | 147 | 71% |
| Intermezzo | 8-August | Intermediate care | 0 | 0% | 38 | 58% |
| Intermezzo | 8-August | Inpatients | 31 | 37% | 1340 | 85% |
| Intermezzo | 8-August | ICU-sub ICU | 22 | 2% | 145 | 67% |
| Intermezzo | 9-September | Intermediate care | 0 | 0% | 39 | 81% |
| Intermezzo | 9-September | Inpatients | 34 | 59% | 1378 | 87% |
| Intermezzo | 9-September | ICU-sub ICU | 22 | 16% | 144 | 72% |
| Wave 2 | 9-September | Intermediate care | 0 | 0% | 57 | 65% |
| Wave 2 | 9-September | Inpatients | 41 | 63% | 1401 | 90% |
| Wave 2 | 9-September | ICU-sub ICU | 24 | 19% | 144 | 76% |
| Wave 2 | 10-October | Intermediate care | 40 | 90% | 72 | 80% |
| Wave 2 | 10-October | Inpatients | 167 | 90% | 1305 | 92% |
| Wave 2 | 10-October | ICU-sub ICU | 37 | 55% | 136 | 78% |
| Wave 2 | 11-November | Intermediate care | 100 | 98% | 45 | 99% |
| Wave 2 | 11-November | Inpatients | 626 | 93% | 828 | 93% |
| Wave 2 | 11-November | ICU-sub ICU | 104 | 86% | 96 | 78% |
| Wave 2 | 12-December | Intermediate care | 118 | 94% | 45 | 82% |
| Wave 2 | 12-December | Inpatients | 493 | 83% | 938 | 93% |
| Wave 2 | 12-December | ICU-sub ICU | 100 | 78% | 96 | 80% |
Disclaimer/Publisher’s Note: The statements, opinions and data contained in all publications are solely those of the individual author(s) and contributor(s) and not of MDPI and/or the editor(s). MDPI and/or the editor(s) disclaim responsibility for any injury to people or property resulting from any ideas, methods, instructions or products referred to in the content. |
© 2023 by the authors. Licensee MDPI, Basel, Switzerland. This article is an open access article distributed under the terms and conditions of the Creative Commons Attribution (CC BY) license (http://creativecommons.org/licenses/by/4.0/).
Copyright: This open access article is published under a Creative Commons CC BY 4.0 license, which permit the free download, distribution, and reuse, provided that the author and preprint are cited in any reuse.


