1. Introduction
With global warming and sustainable development, renewable energy has developed rapidly during the last few decades. Wind energy is one of the primary types of renewable energy, and the installation is more concentrated than solar energy. The high penetration of offshore wind farms causes the concern about frequency and voltage stability. Thus, many countries have requested wind farms to provide voltage support at the point of connection in their grid codes [
1,
2]. Using the power electronic converter, the doubly-fed induction generator(DFIG) and full converter wind turbine (FCWT) can provide reactive power support to the system's voltage [
3]. To connect an offshore wind farm, the HVDC transmission system is much more suitable than the HVAC transmission system, with a transmission distance of over 100 kilometers and a capacity larger than 100 MVA [
4]. Besides, voltage source converter-based high voltage direct current(VSC-HVDC) can control active and reactive power independently [
5], which makes it control the voltage easily. Without the consideration of reactive power compensations like Static Synchronous Compensators (STATCOM) or Static Var Compensators (SVC), this study first tested various control methods for wind turbines and VSC-HVDC system.
With a high penetration of wind power generation, the voltage issues become important. The Power-Voltage analysis [
6] about static voltage stability indicated that the voltage would collapse without any contingency if a transfer of wind power generation increases. Meanwhile, it only raises a small transfer limit by installing more reactive compensation resources. In the aspect of dynamic voltage stability, compared to a stiff system, a weak grid is generally concerned about overvoltage after a grid fault owing to a higher sensitivity of dV/dQ [
7]. The voltage variation to reactive power injection is defined as the grid strength, presented by the Short Circuit Ratio (SCR). The voltage at a strong grid with a high SCR fluctuates less than a weak grid with a small SCR [
8]. Reference [
9] provides a study about the influence of SCR on the voltage control of wind power plants. It shows that it is easier to impact the voltage at the point of common coupling (PCC) with a lower SCR value. In reference [
10], it divided the voltage control method of a large-scale wind farm into three categories: decentralize, centralized and hierarchical controls. The reactive power capability of different wind turbines varies according to wake effects; thus, reference [
11] proposed an adaptive Q-V method that allows wind turbines with more reactive power capability to provide more reactive power. Then, the adaptive and fixed Q-V schemes were simulated by considering different grid stiffness and disturbance types. Reference [
12] presented both variable voltage droop control and constant droop control to reduce the voltage fluctuation caused by varying loads at PCC. A reactive power coordination control strategy was proposed in [
13] to optimize voltage quality and minimize power loss using a genetic algorithm; moreover, the control method was confirmed better than the unit power factor by investigaing the maximum delta voltage and the voltage characteristic coefficient in a test system integrated with three wind farms. To sum up, two factors that influence the voltage regulation in an offshore wind farm include the capability of reactive power supported from wind turbines and the grid strength at PCC.
Besides wind turbines, reactive power compensation devices also play a vital role in voltage regulation. Reference [
14] utilized STATCOM with CMC-based topology, and the effect was examined to resolve voltage fluctuation. Reference [
15] suggested potential methods that can improve the voltage stability of wind farms:. one is to install a static var compensator (SVC) to provide dynamic reactive power support, and the other is to select a doubly fed induction generator(DFIG) that can control reactive power flexibly without installing reactive power compensation devices. After a three-phase short circuit fault, the problem of overvoltage could cause wind turbines to trip off. Thus, a coordinated control between SVC and DFIG can decrease the magnitude of overvoltage compared to the use of SVC only [
16].
Compared to traditional AC transmission, VSC-HVDC can enhance the voltage stability by providing extra reactive power [
17]. In [
18], the stability analysis was carried out for a 100MW solar plant through a connection of HVDC. Reference [
19] implemented a system simulation and showed the voltage at PCC during a three-phase short circuit fault. The simulation considered different levels of wind power penetration with VSC-HVDC connection. The results showed that the voltage at the PCC is proportional to the wind power interation. In reference [
20], the control strategy that considers wind farm, STATCOM and HVDC was tested by load switching and three-phase short circuit fault, where the offshore wind farm is connected by the LCC-HVDC transmission system. Reference [
21] showed that the control scheme of VSC-HVDC can influence the maximum transfer of active power. In reference [
22,
23,
24], some voltage control methods for a VSC-HVDC connected weak grid were proposed. Two control modes were proposed in [
25,
26] by coordinating wind generators with VSC-HVDC based on model predict control. The normal operation mode can maintain a stable voltage and reduce power loss, while the corrective mode can help the voltage reach 1.0 p.u. rapidly when wind turbines were reconnected to the grid after a storm. The control method presented in [
27] can minimize power loss of offshore wind farms, increase the amount of active power transfer, and improve voltage stability during system transients. From the above literature reviews, the HVDC-connected system can provide a better performance than the AC-connected system.
2. Various Voltage Control Methods
In this study, the control methods are separated into two parts. The first part is about the control methods for wind turbines, which is introduced in section 2.1, while the second part is the control methods for VSC-HVDC, which is presented in section 2.2.
2.1. Wind farm control
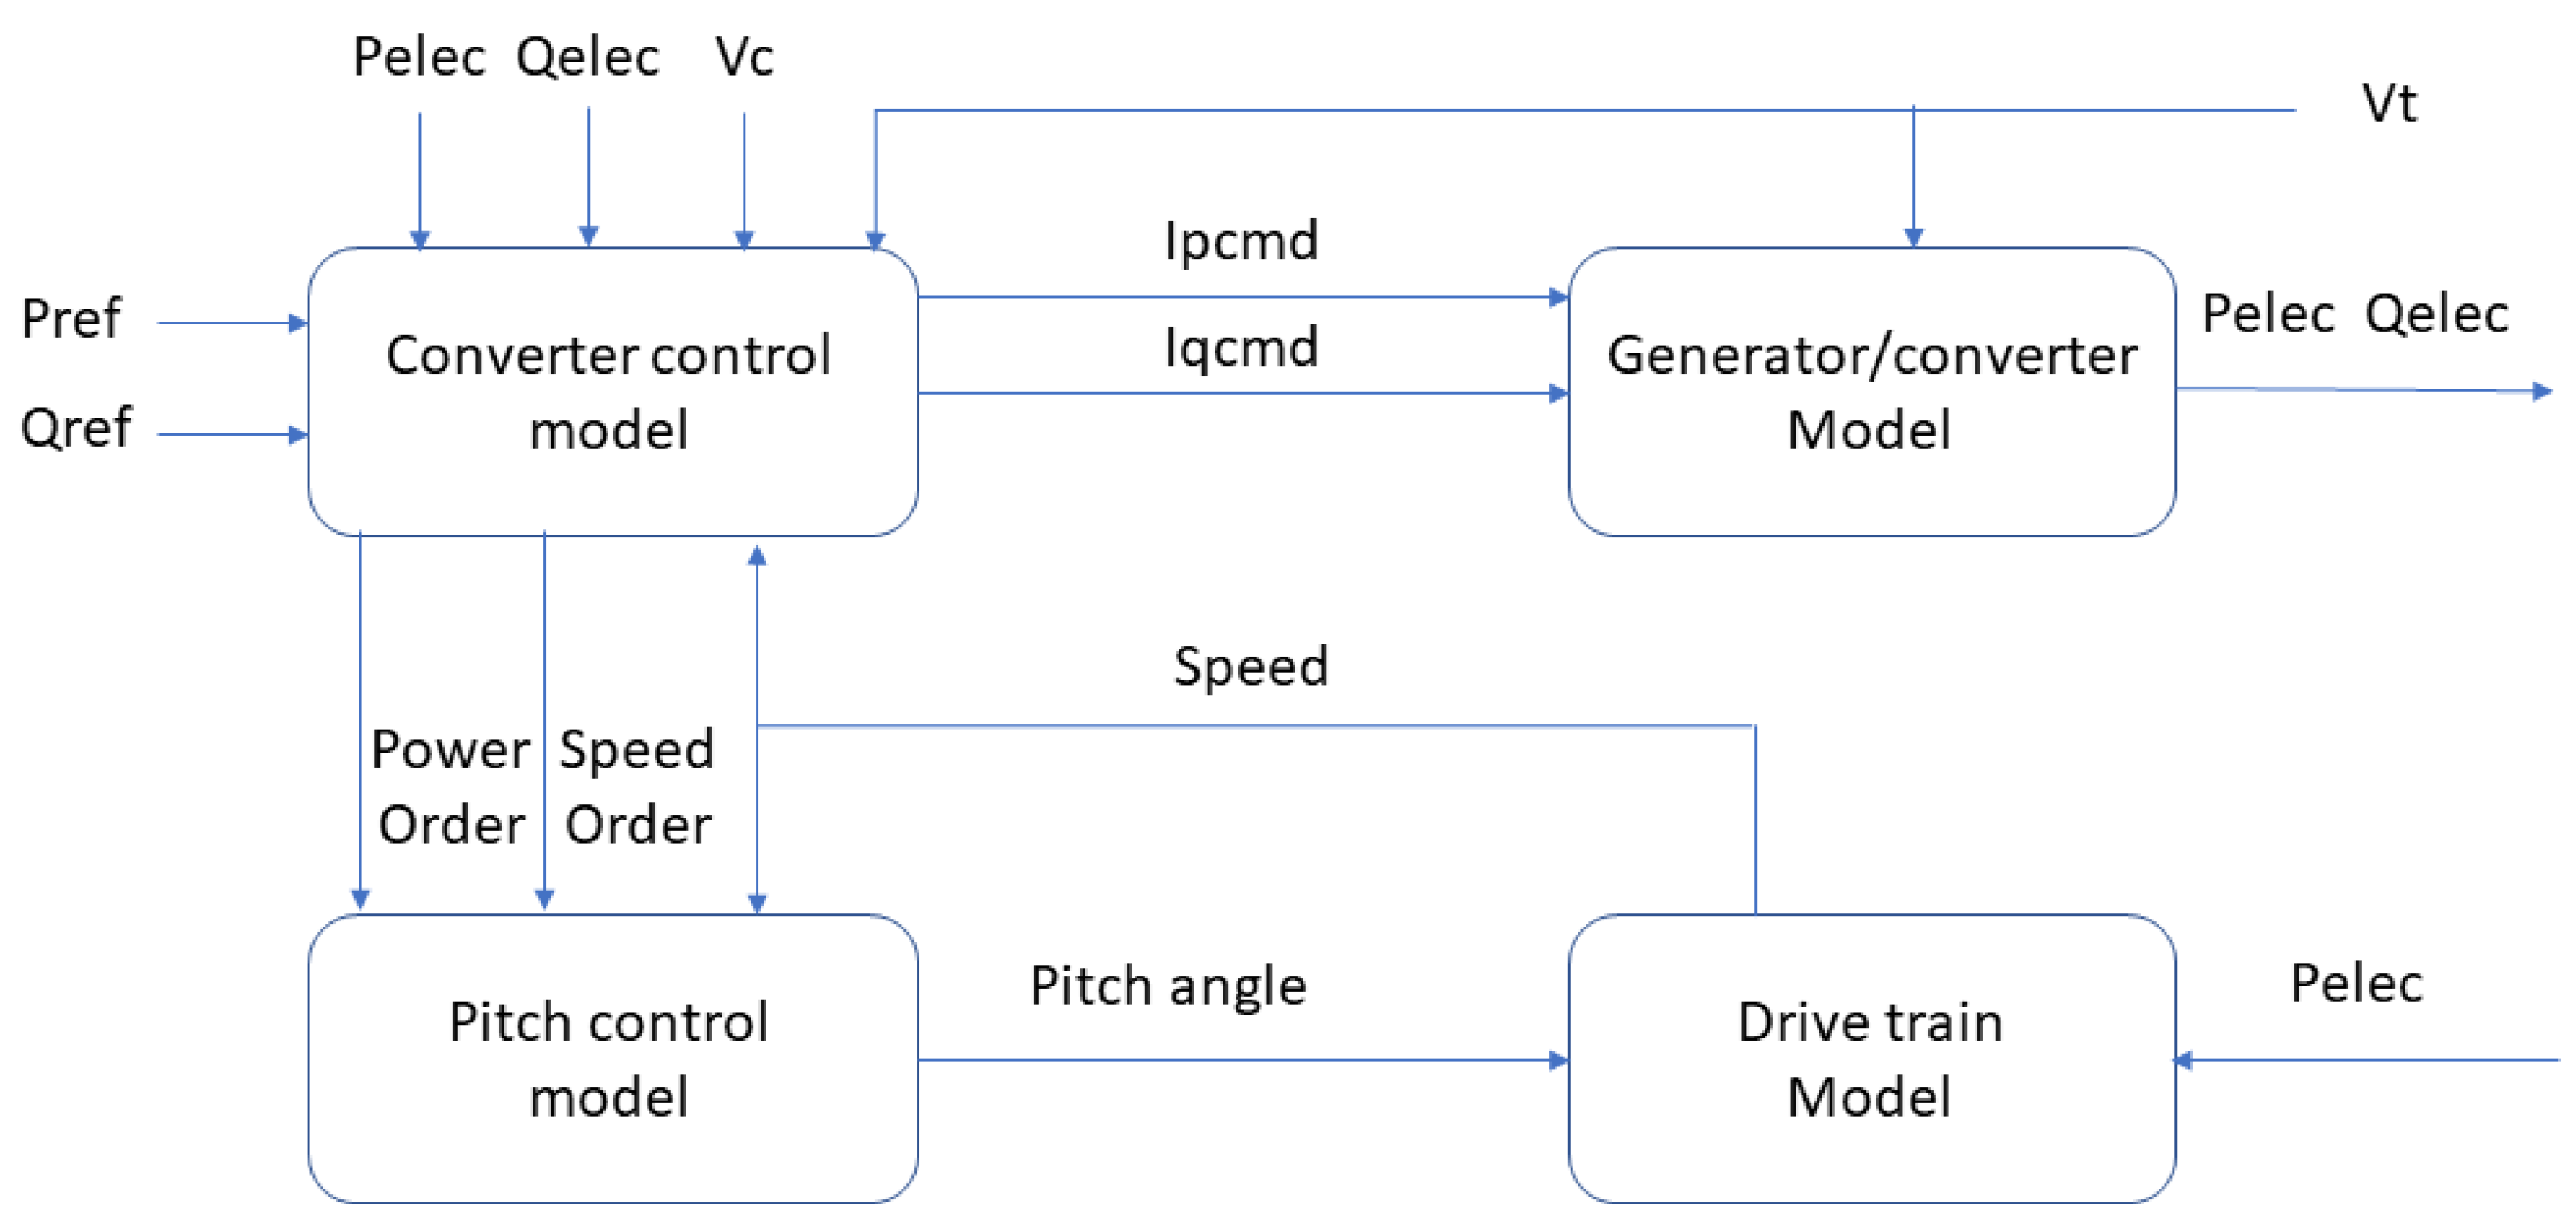
In this study, the DFIG-based wind turbine was used based on the generic model, and its block diagram is listed in
Figure 1. There are four main blocks inside the generic model: the converter control model, the generator/converter model, the pitch control model, and the drive train model. The reactive power reference (Qref) generated by QV, voltage droop or other controls is sent to the converter control model to obtain the required voltage. The detailed description of each model can be found in [
28,
29].
2.1.1. PQ diagram
The main restriction of the reactive power supported by a wind turbine is its stator current and rotor current.
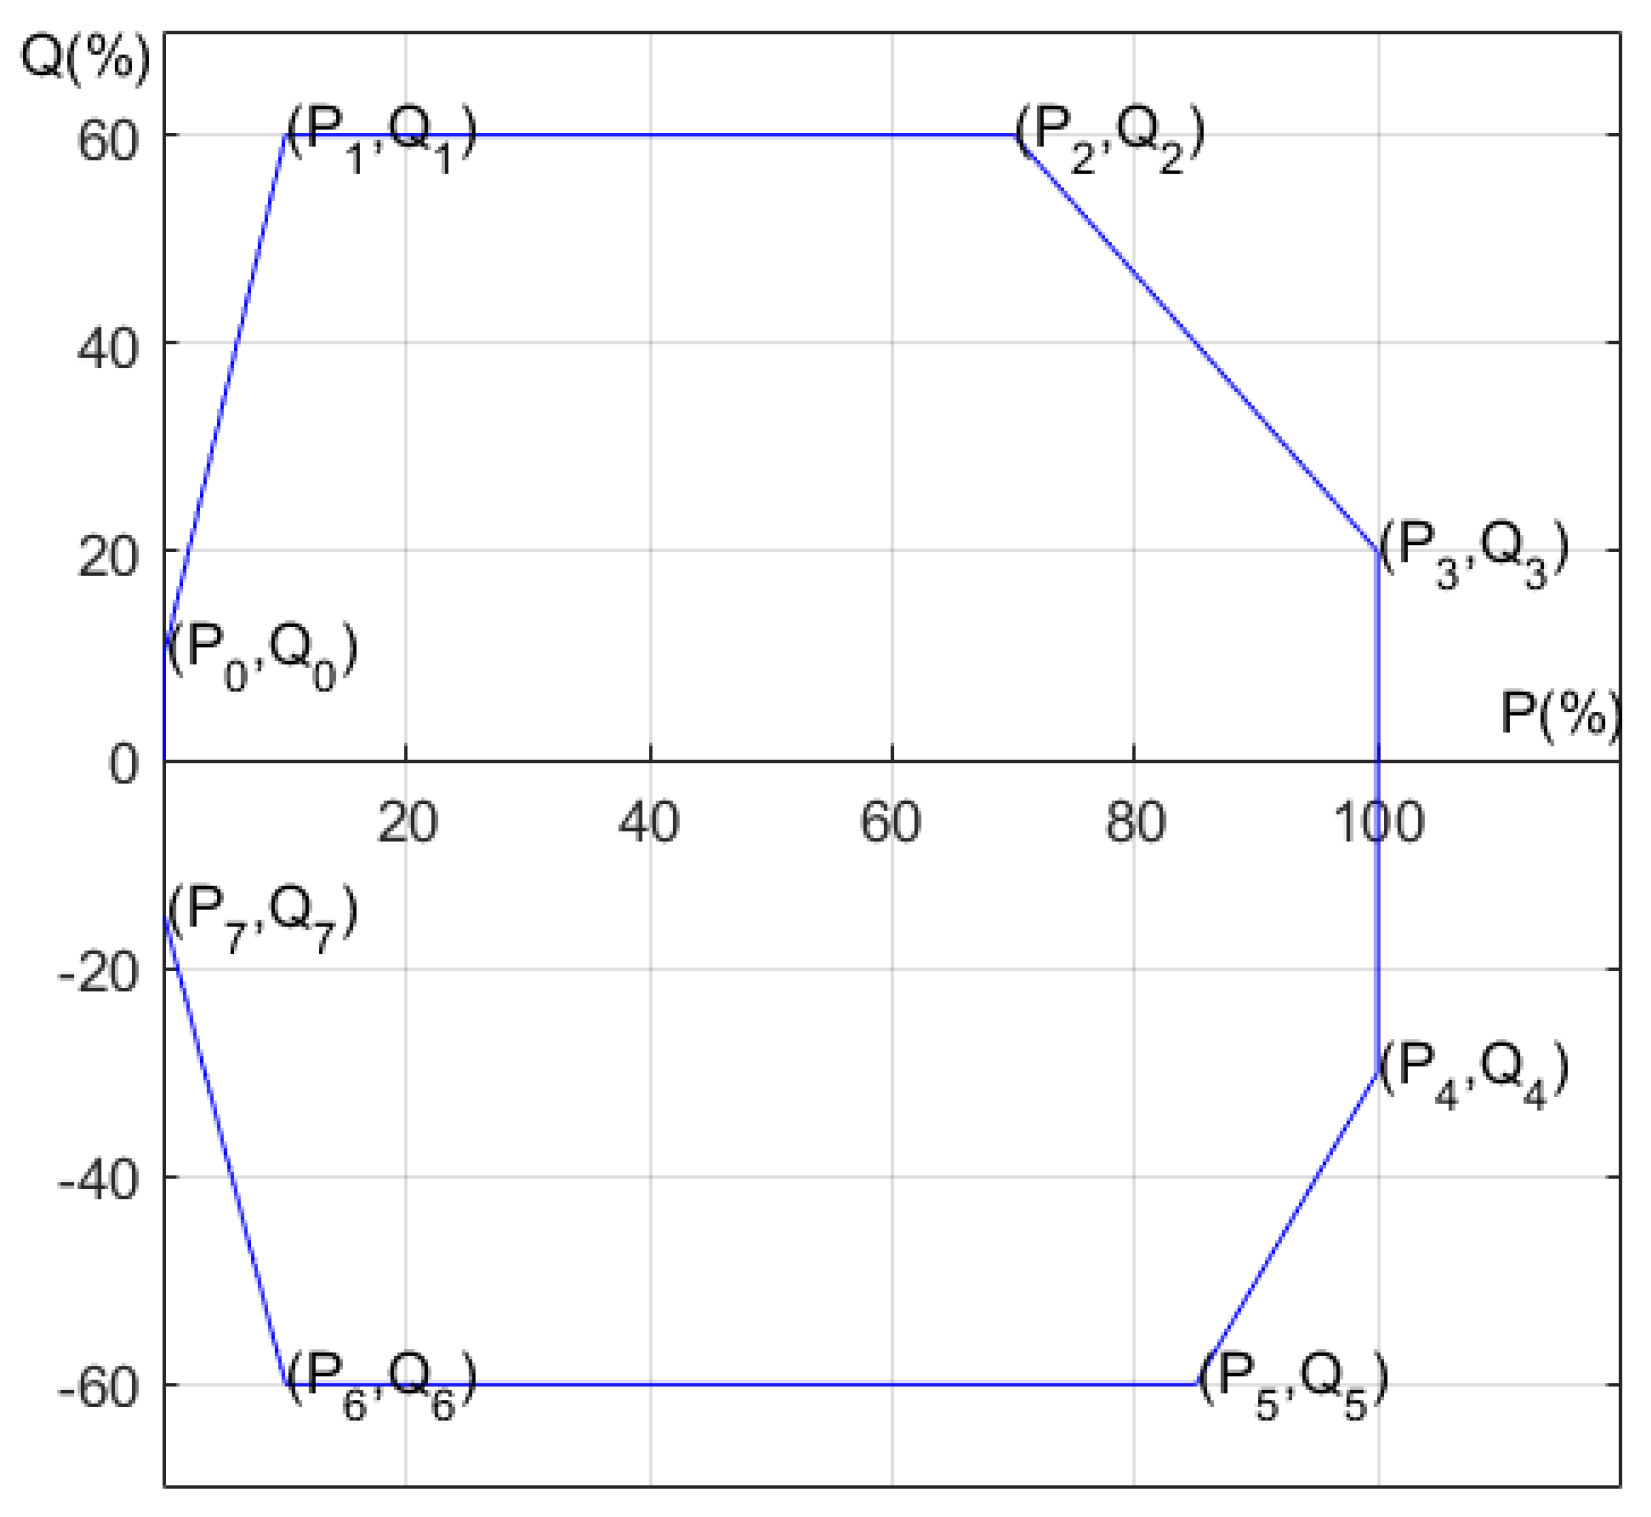
Figure 2 shows a PQ diagram from the stator current of a DFIG [
9], which indicates the maximum reactive power absorbed or provided by a DFIG is based on its active power. For instance,
Table 1 shows the relationship between active and reactive power for a DFIG-based wind turbine. As the active power is the maximal, the reactive power can be supported or absorbed by 20% and 30% of capacity, respectively. However, if active power is below the maximum, the supported or absorbed reactive power can be increased. That is, the controller of a wind turbine can control its reactive power according to its PQ diagram.
2.1.2. QV control
The adaptive QV control enables a wind turbine to provide more reactive power.
Figure 3 shows the block diagram to obtain the gain kq_i used in
Figure 4. First, the upper Qmax_i and lower limit Qmin_i of a wind turbine are determined in the adaptive QV controller based on the desired PQ diagram. Next, the gain kq_i at each wind turbine is obtained by considering its reactive power limit. This control method can control the voltage at the PCC and the terminal of each wind turbine. For example, in
Figure 4, the limit of ±0.1(i.e., the block of “limit” in
Figure 4 ) restricts the difference between the reference voltage (Vref_pcc) and the measured voltage(Vmeas_pcc) at the PCC [
11]. Next, the difference between the reference voltage and the measured voltage at the wind turbine is added into the output signal from the limit to obtain the error signals. Finally, the required Qref during the fault can be computed. In constrast, the QV gain of the fixed QV control is set to 5 in this study.
2.1.3. Voltage droop control
The voltage droop control is a kind of reactive control method. The functional theory of the voltage droop control is similar to the frequency control of a synchronous generator. It can stabilize the voltage by providing or absorbing reactive power from wind turbines. The conventional voltage droop is expressed as
where Vmeas_pcc is the voltage that measures at the PCC; Vref_pcc is the voltage reference at the PCC; Qref_Pre-fault_i is the original reference value of reactive power from a wind turbine; Qref_During The Fault_i is the new reference value of reactive power from a wind turbine. The coefficient 1/Ru is the reciprocal of kq_i. The structure of voltage droop control is shown in
Figure 5.
1.2. VSC-HVDC control
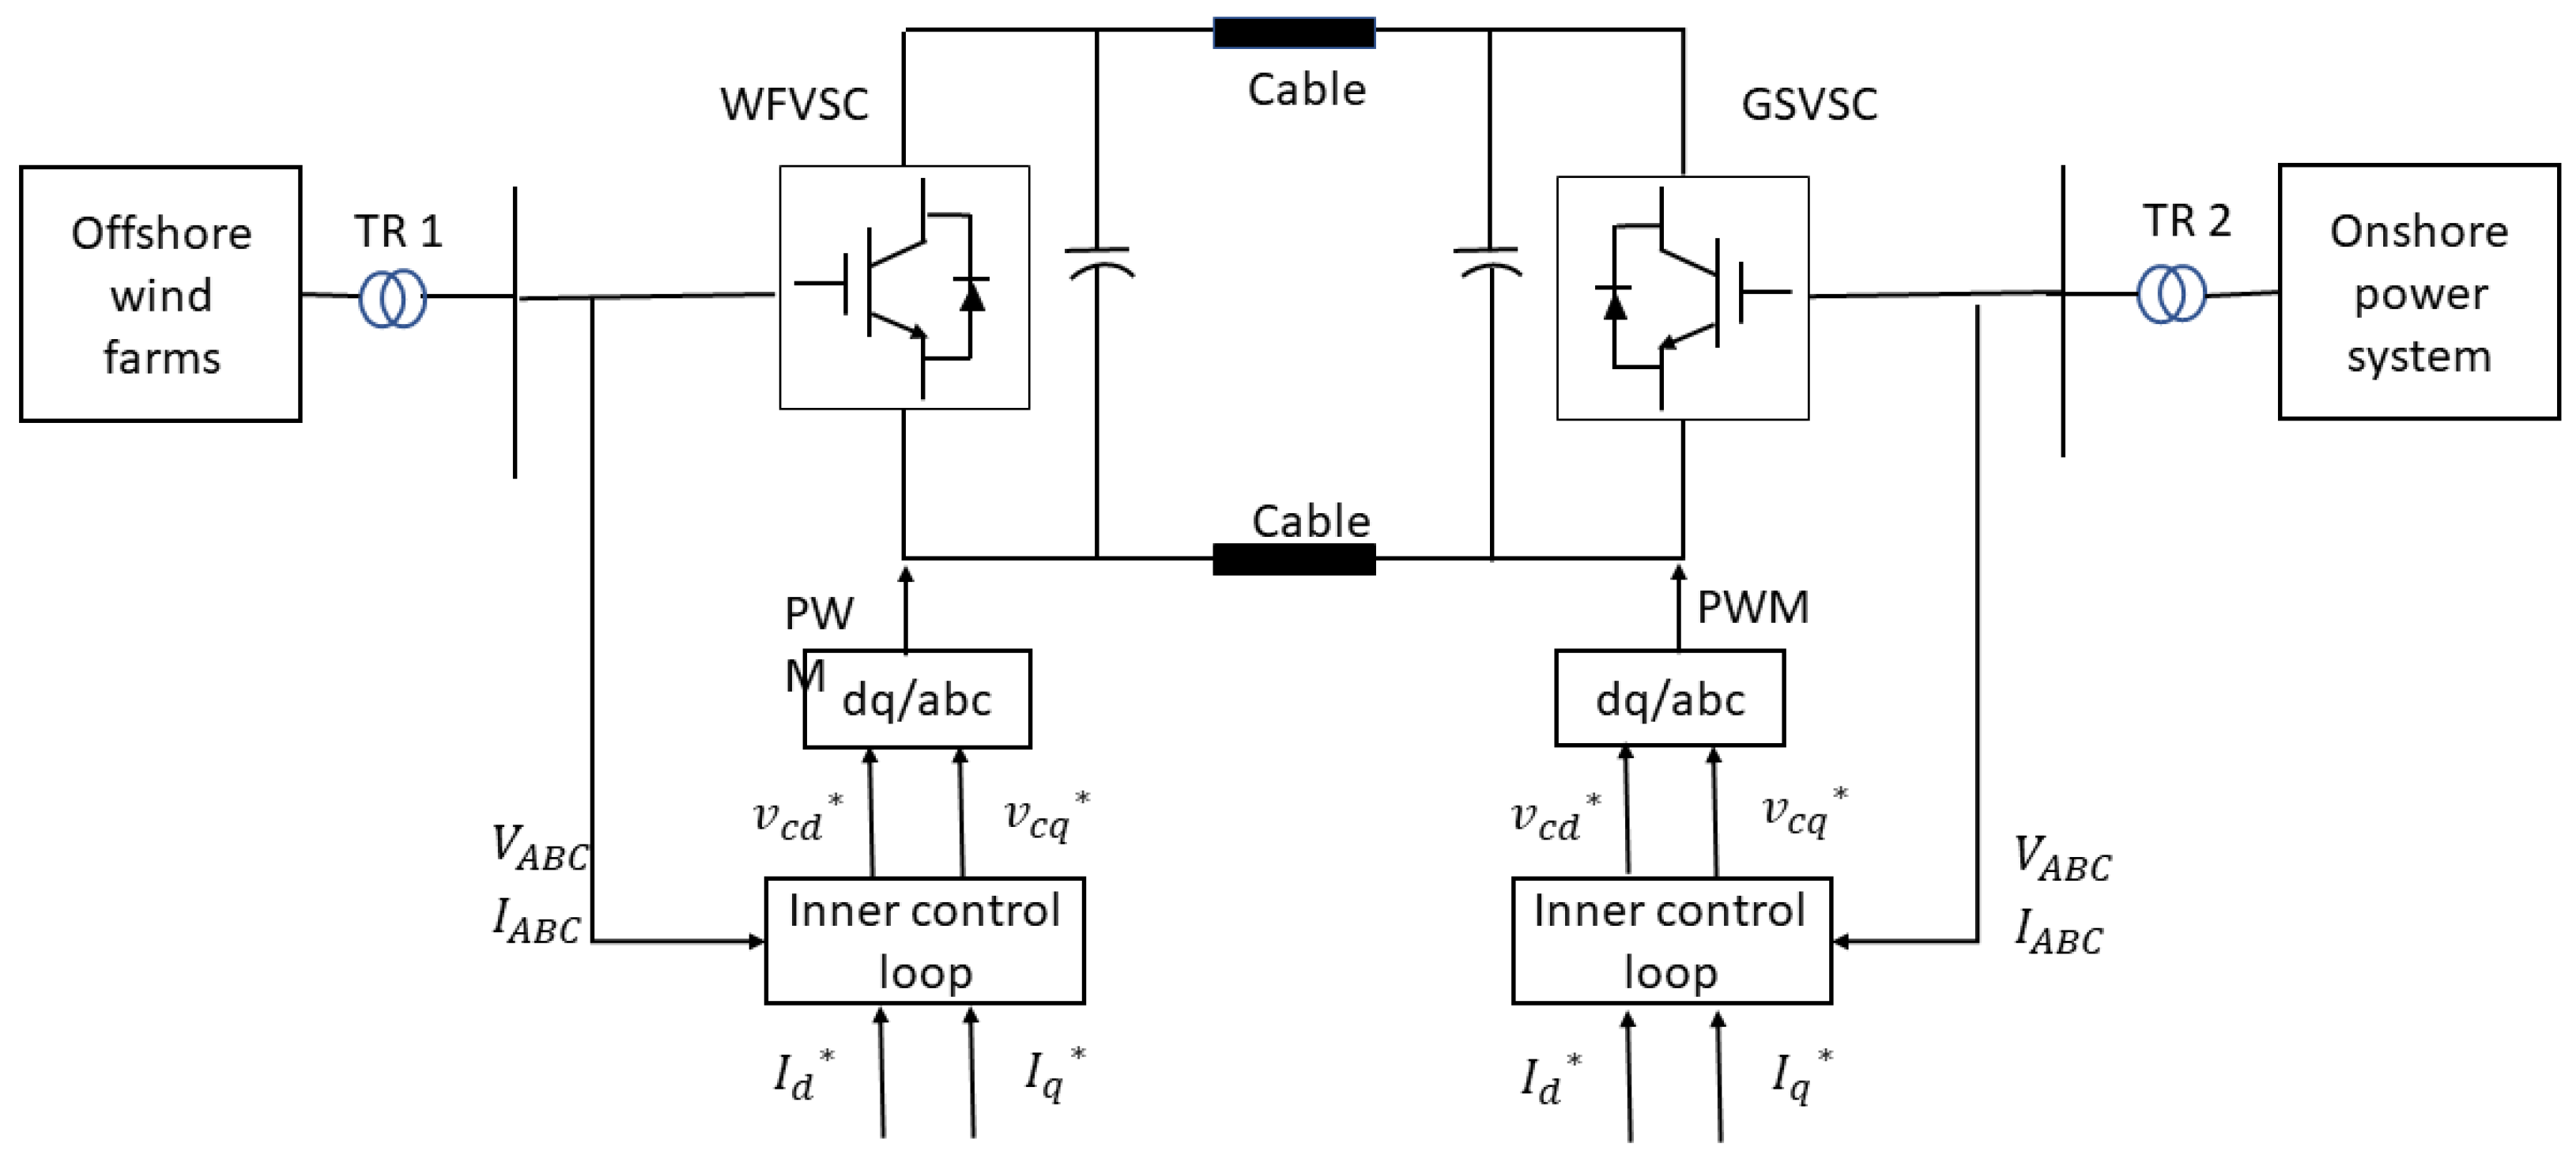
Figure 6 shows the control strategy of a VSC-HVDC connected offshore wind farm (OWF). The Id_ref of inner control is derived from either V_DC control or P control at the GSVSC or WFVSC. The Iq_ref of inner control is derived from the proposed control method to control the voltage at PCC. A detailed description of the inner control loop, V_DC control and P control can be obtained from [
30,
31].
2.2.1. Power factor control
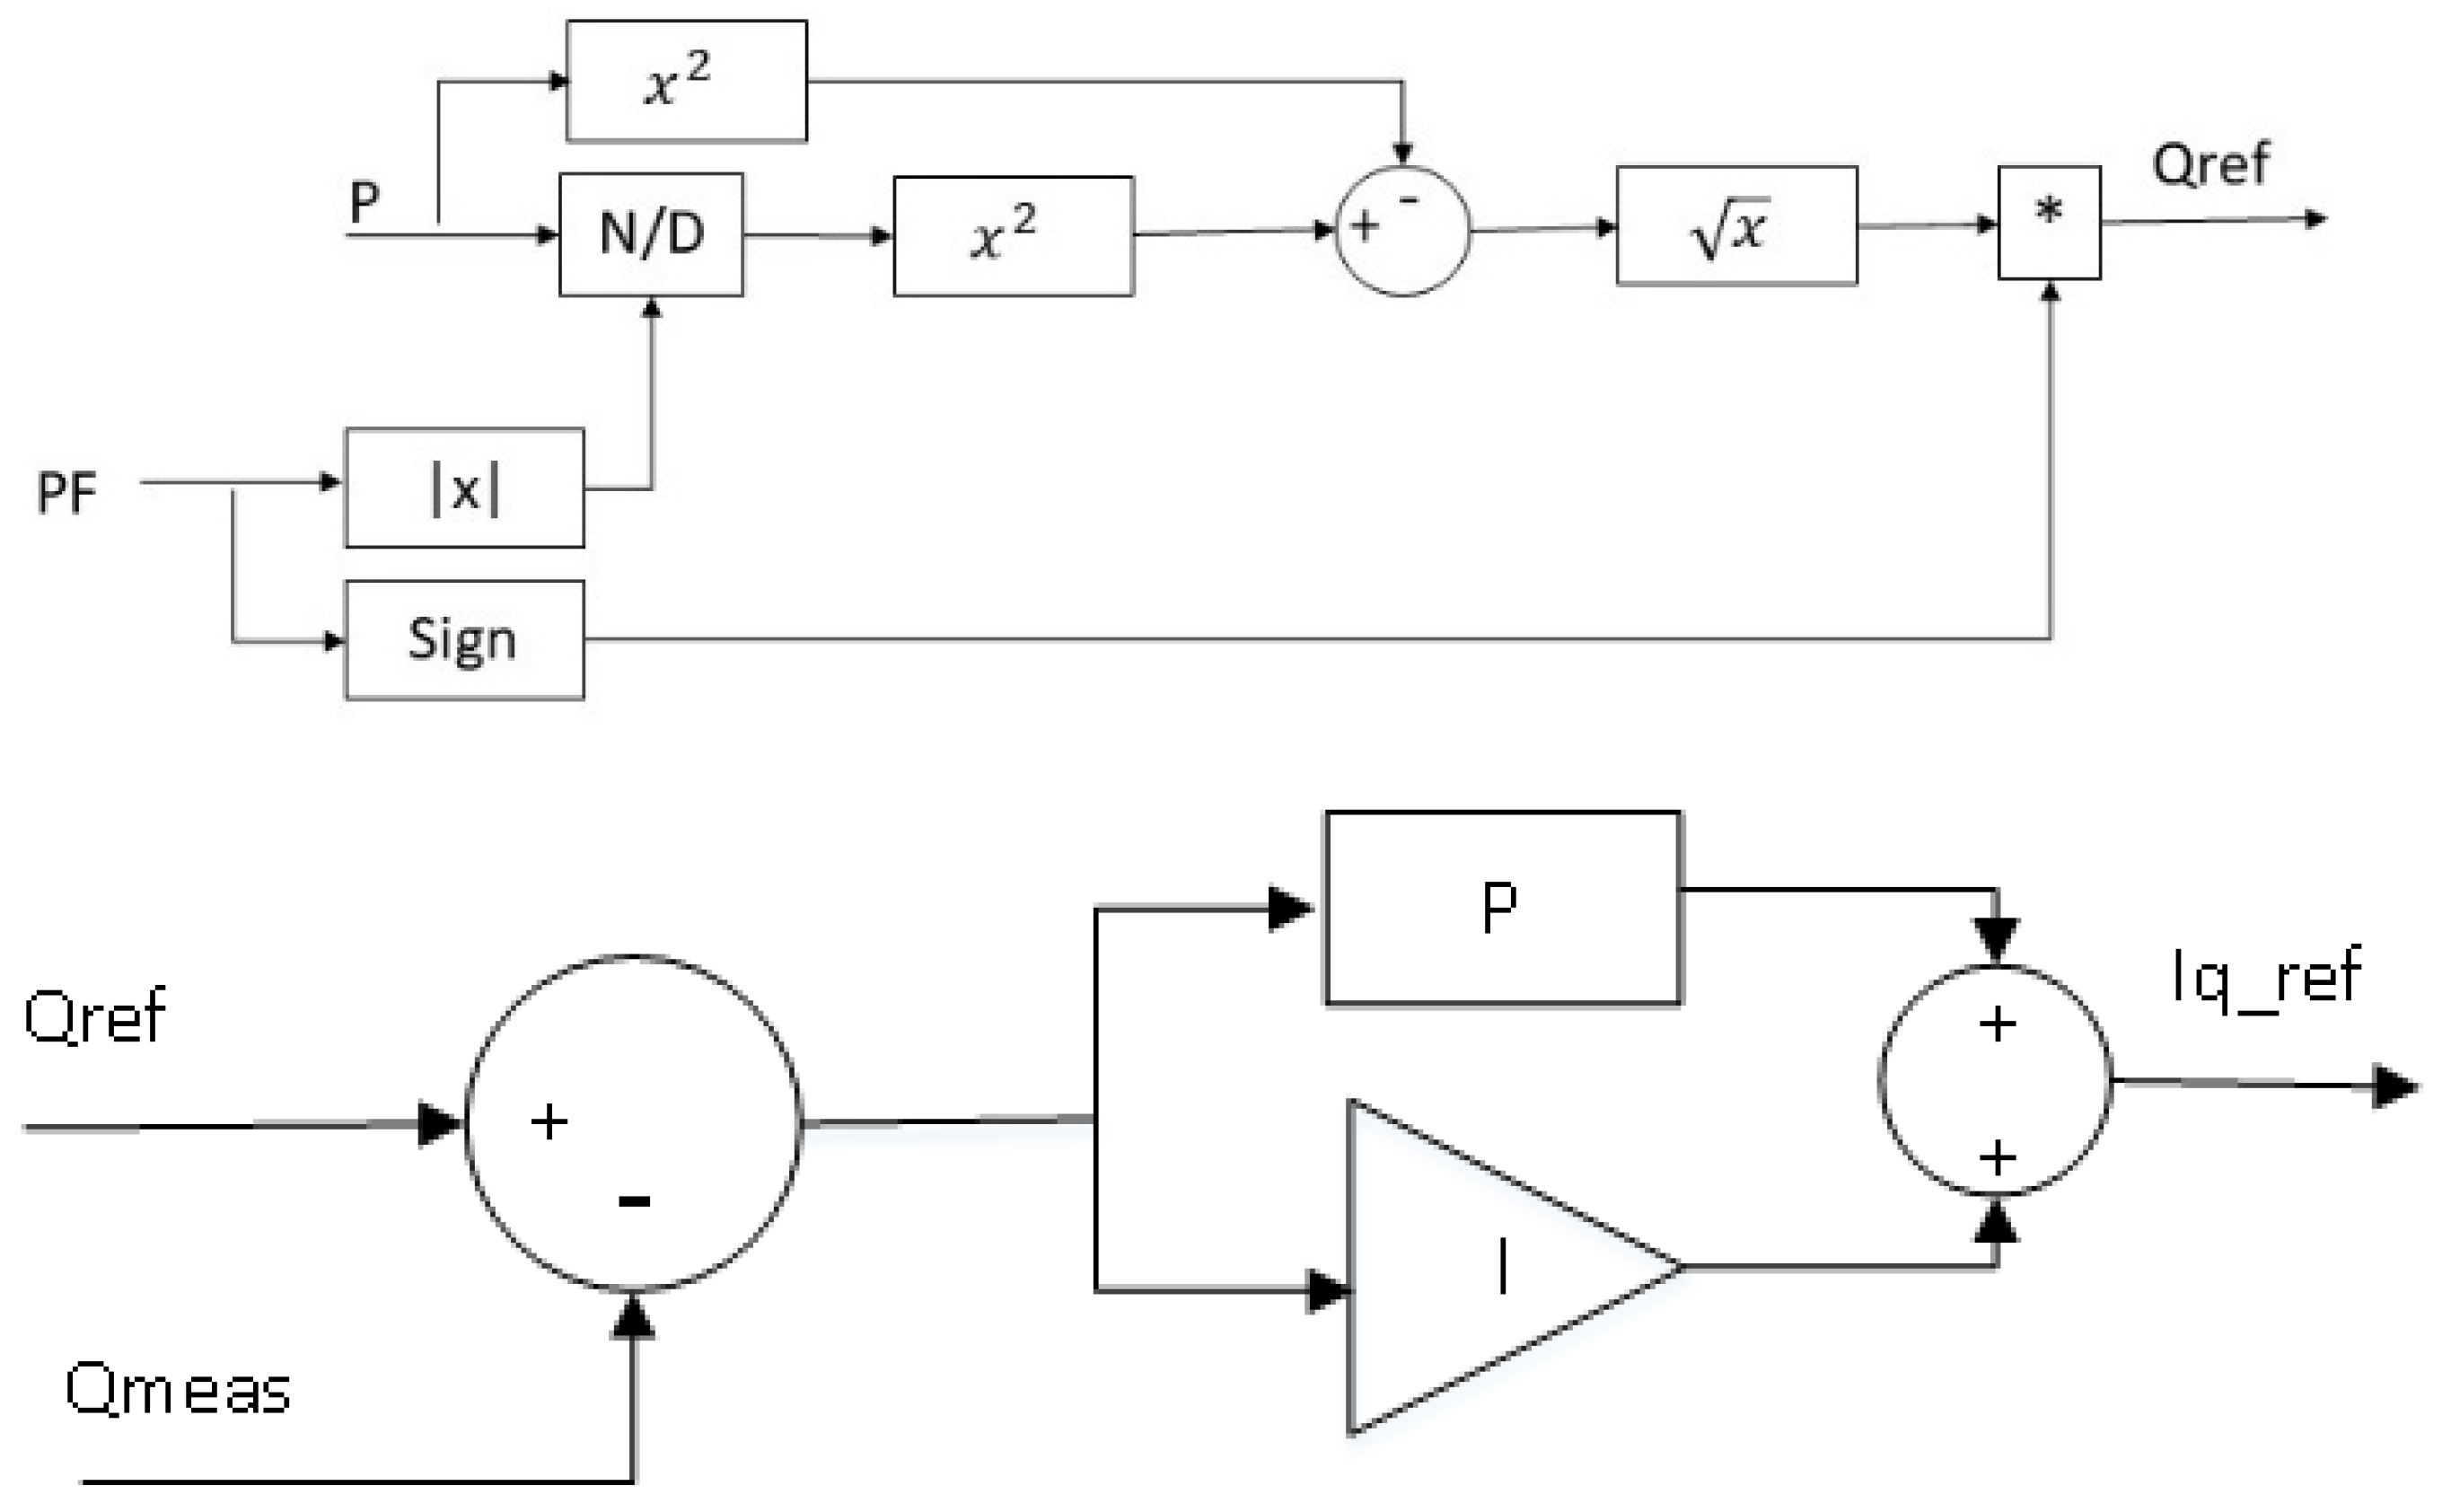
Figure 7 shows the block diagram of power factor control, where both power factor and active power are used to obtain the required reactive power. The sign of the power factor can identify that the reactive power is provided or absorbed. Finally,
is sent to the Q controller to compare with the measured reactive power
at the PCC, and the error between them is sent to the PI controller to obtain
.
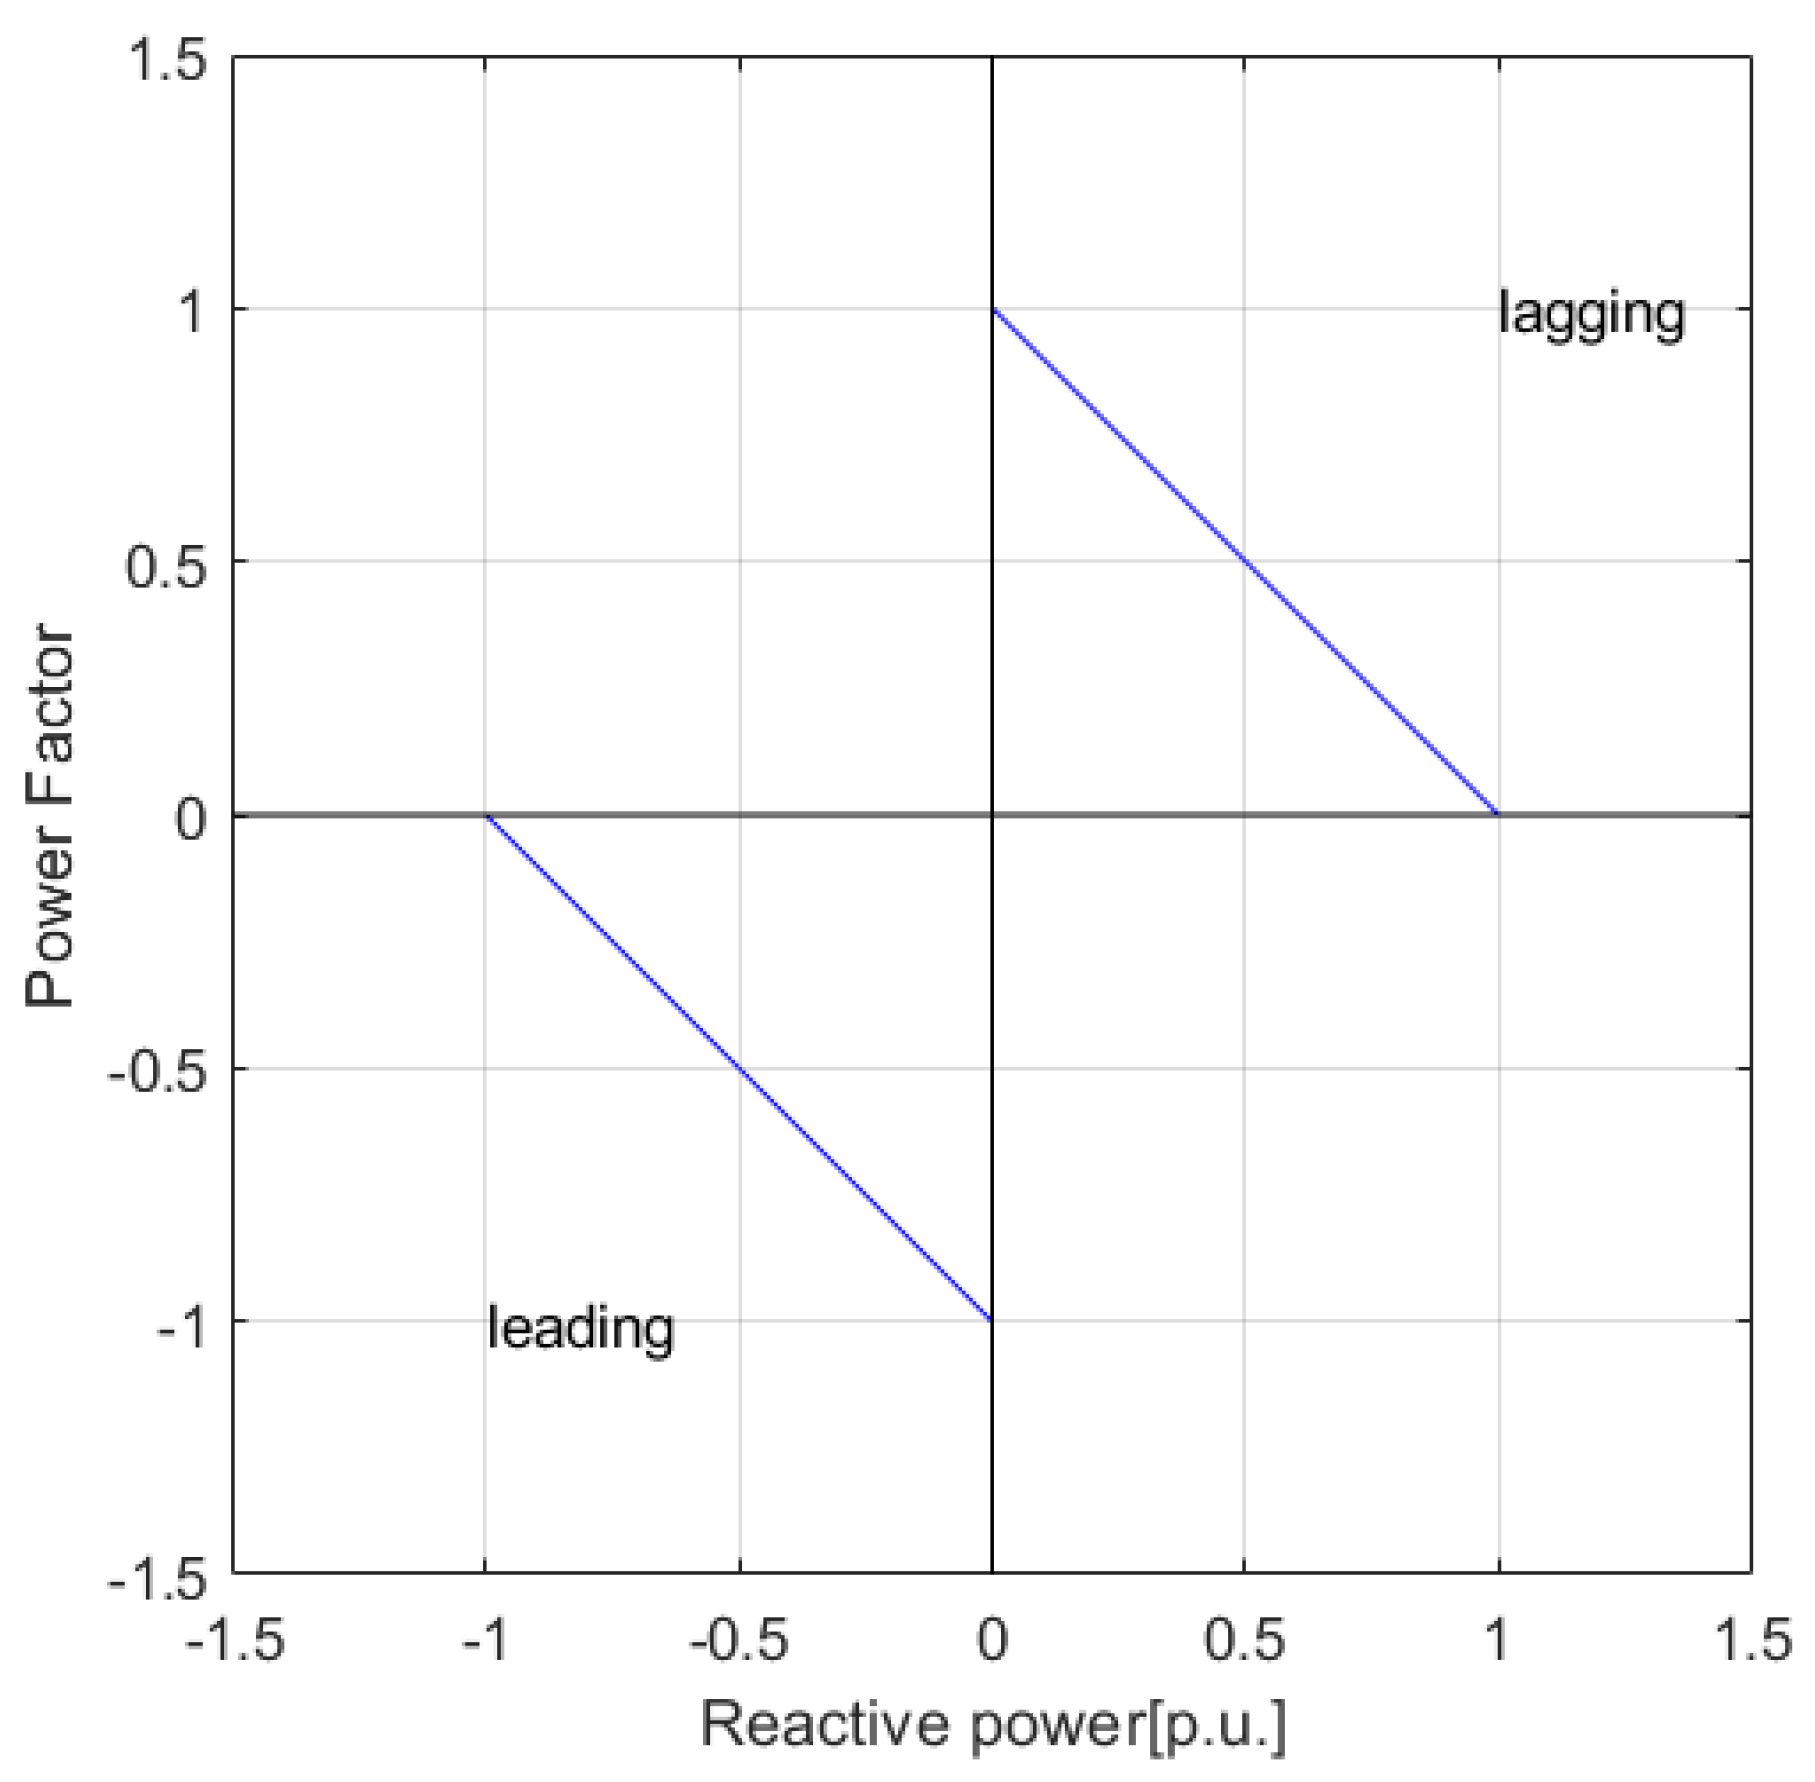
Figure 8 shows the relationship between reactive power and power factor. To identify the leading or lagging power factor,
Figure 8 uses different signs to present them. For instance, a negative sign indicates a leading power factor that a wind turbine absorbs reactive power ; the sign is positive for a lagging power factor.
2.2.2. Vac-Q droop control
Figure 9 shows the block diagram for the Vac-Q droop control. In this figure, the deadband can set an acceptable voltage margin that the controller doesn’t trigger, which only provide a desired reactive power. While the voltage exceeds the range, the controller can provide or absorb reactive power for voltage support. The Qref_During The Fault is sent to Qref and Qmeas to get Iq_ref.
2.2.3. Voltage control
Voltage control uses the error between the reference voltage V_ref and the measured voltage V_meas; then the error between them is sent into the PI controller. The output of PI controller is Iq_ref that can adjust reactive power to maintain the voltage at the reference value. The topology of voltage control is shown in
Figure 10.
3. Results and Discussions
3.1. Simulation topology of the used AC system and HVDC system
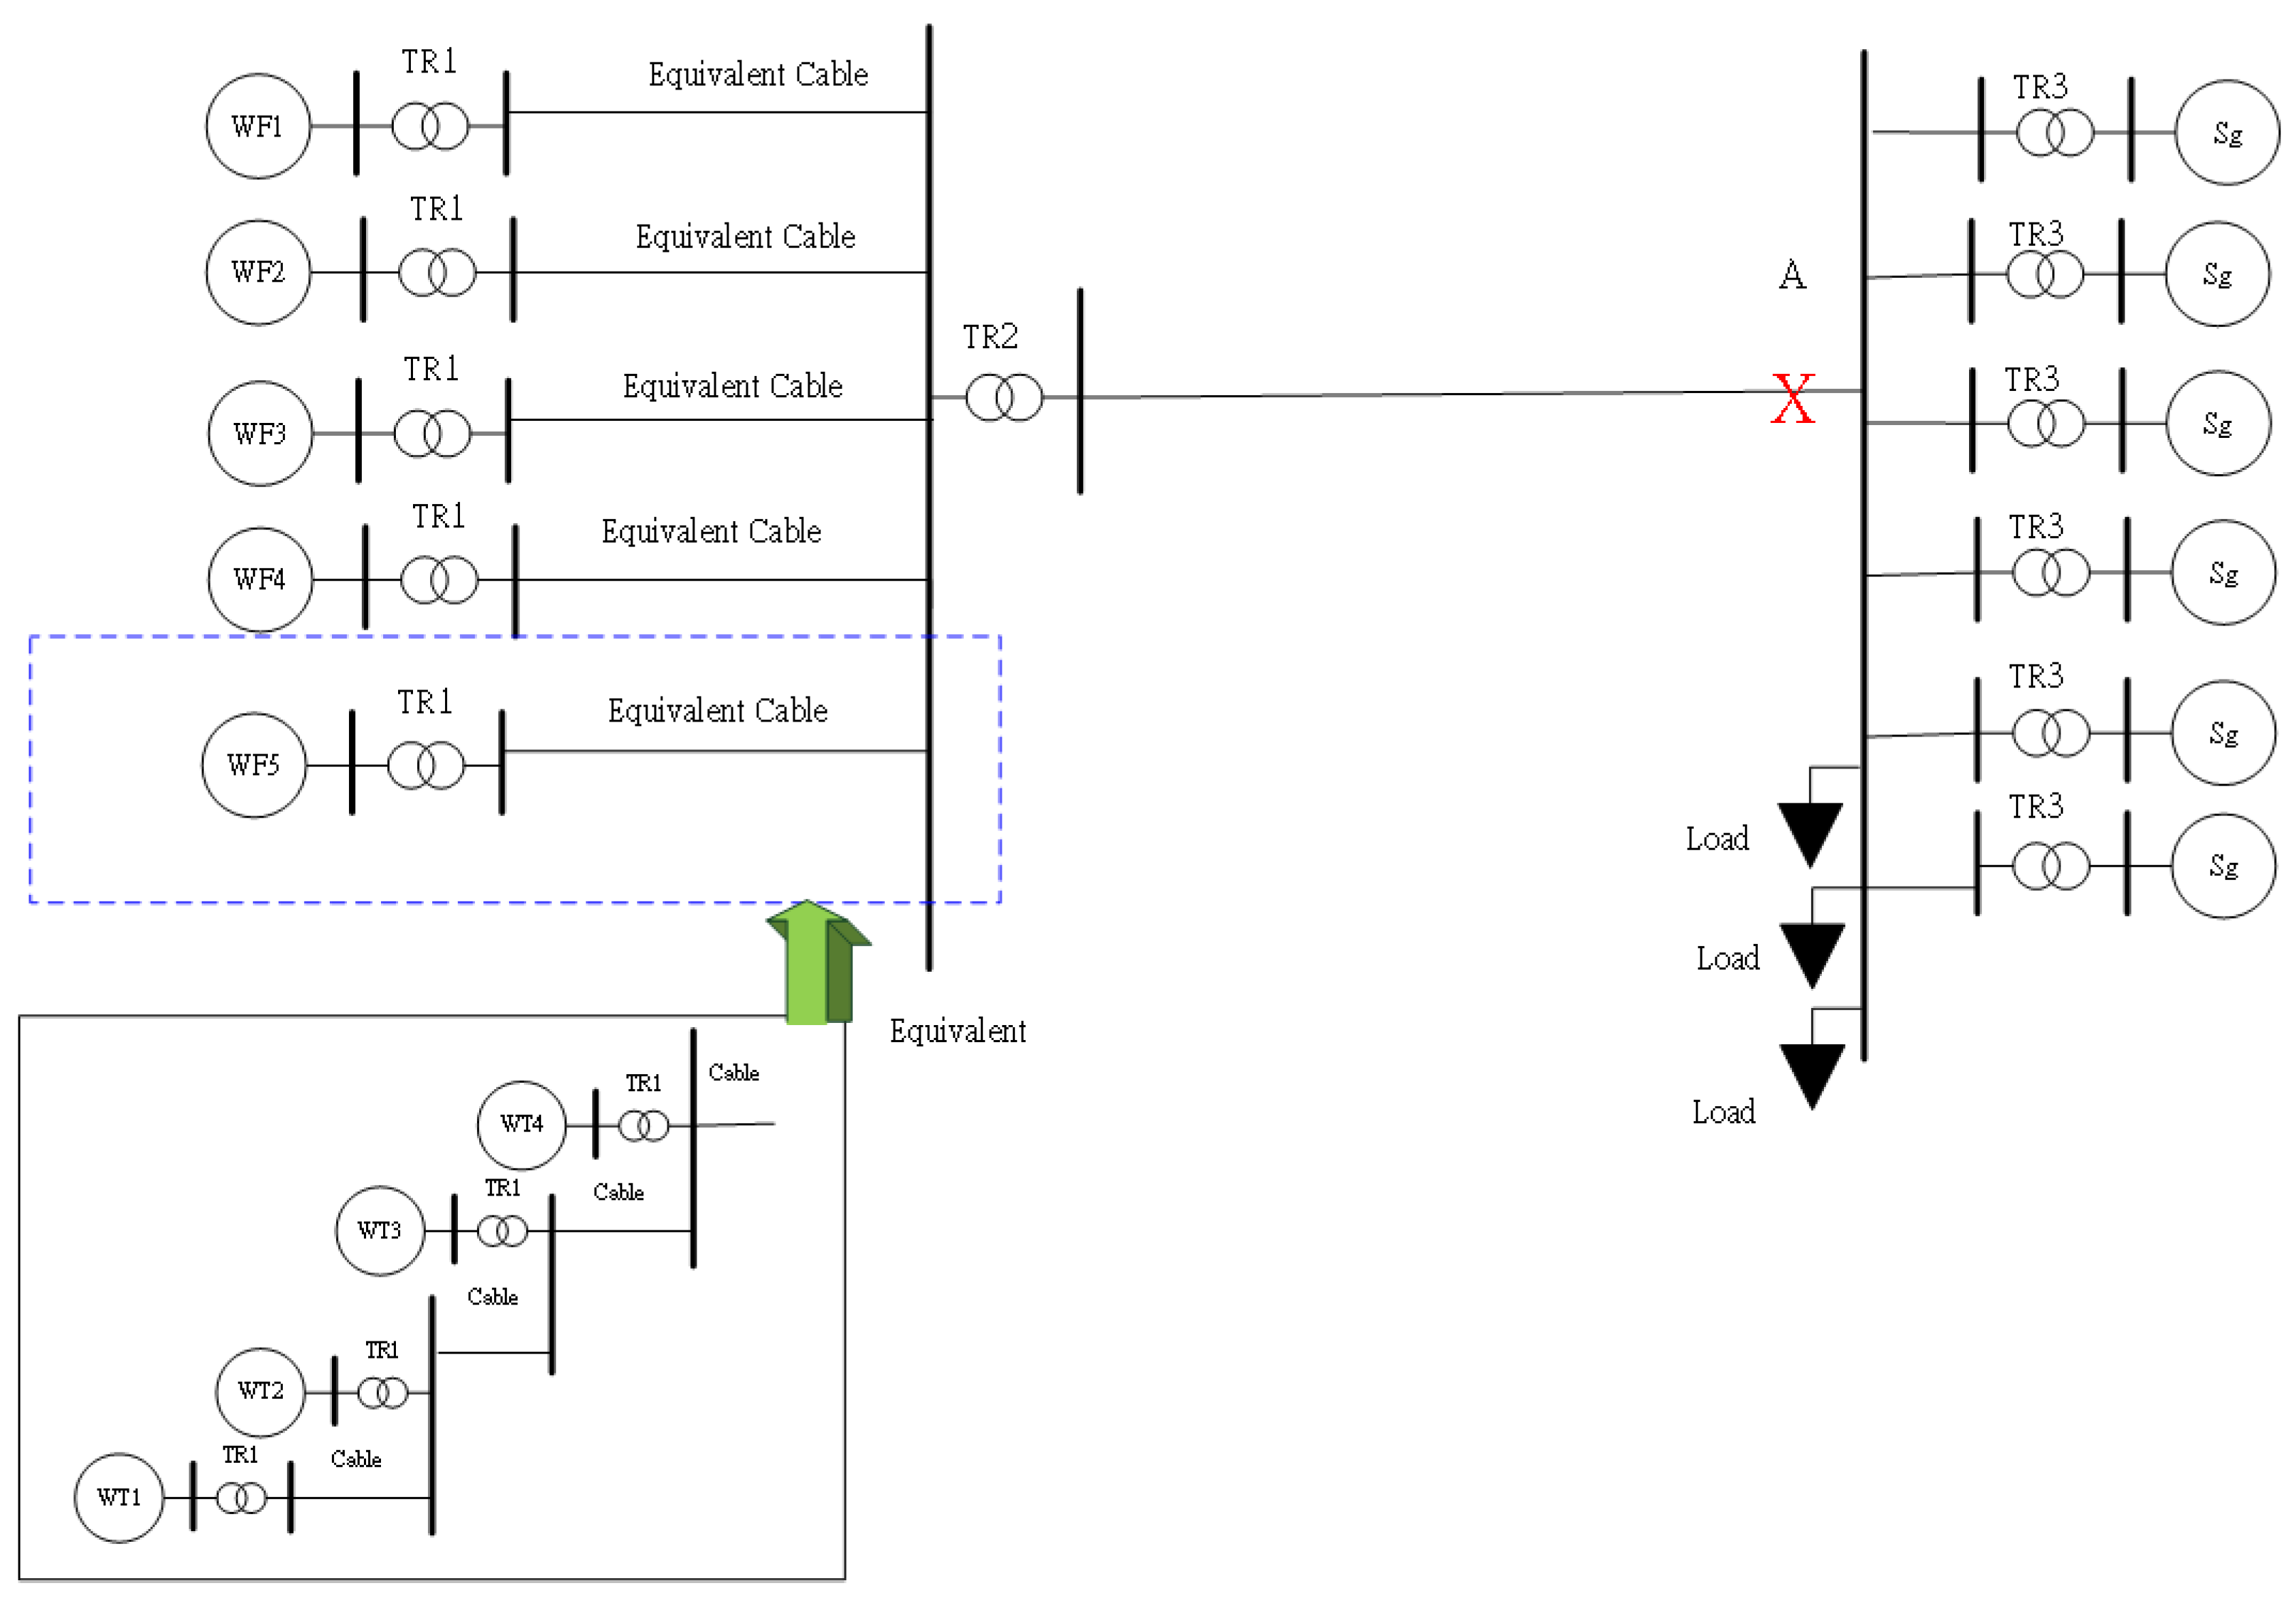
To investigate the effect of the proposed methods on the system voltage, the simulations have been done in an AC test system, which consisted of equivalent wind farms and an onshore power system, as shown in
Figure 11; in addition,
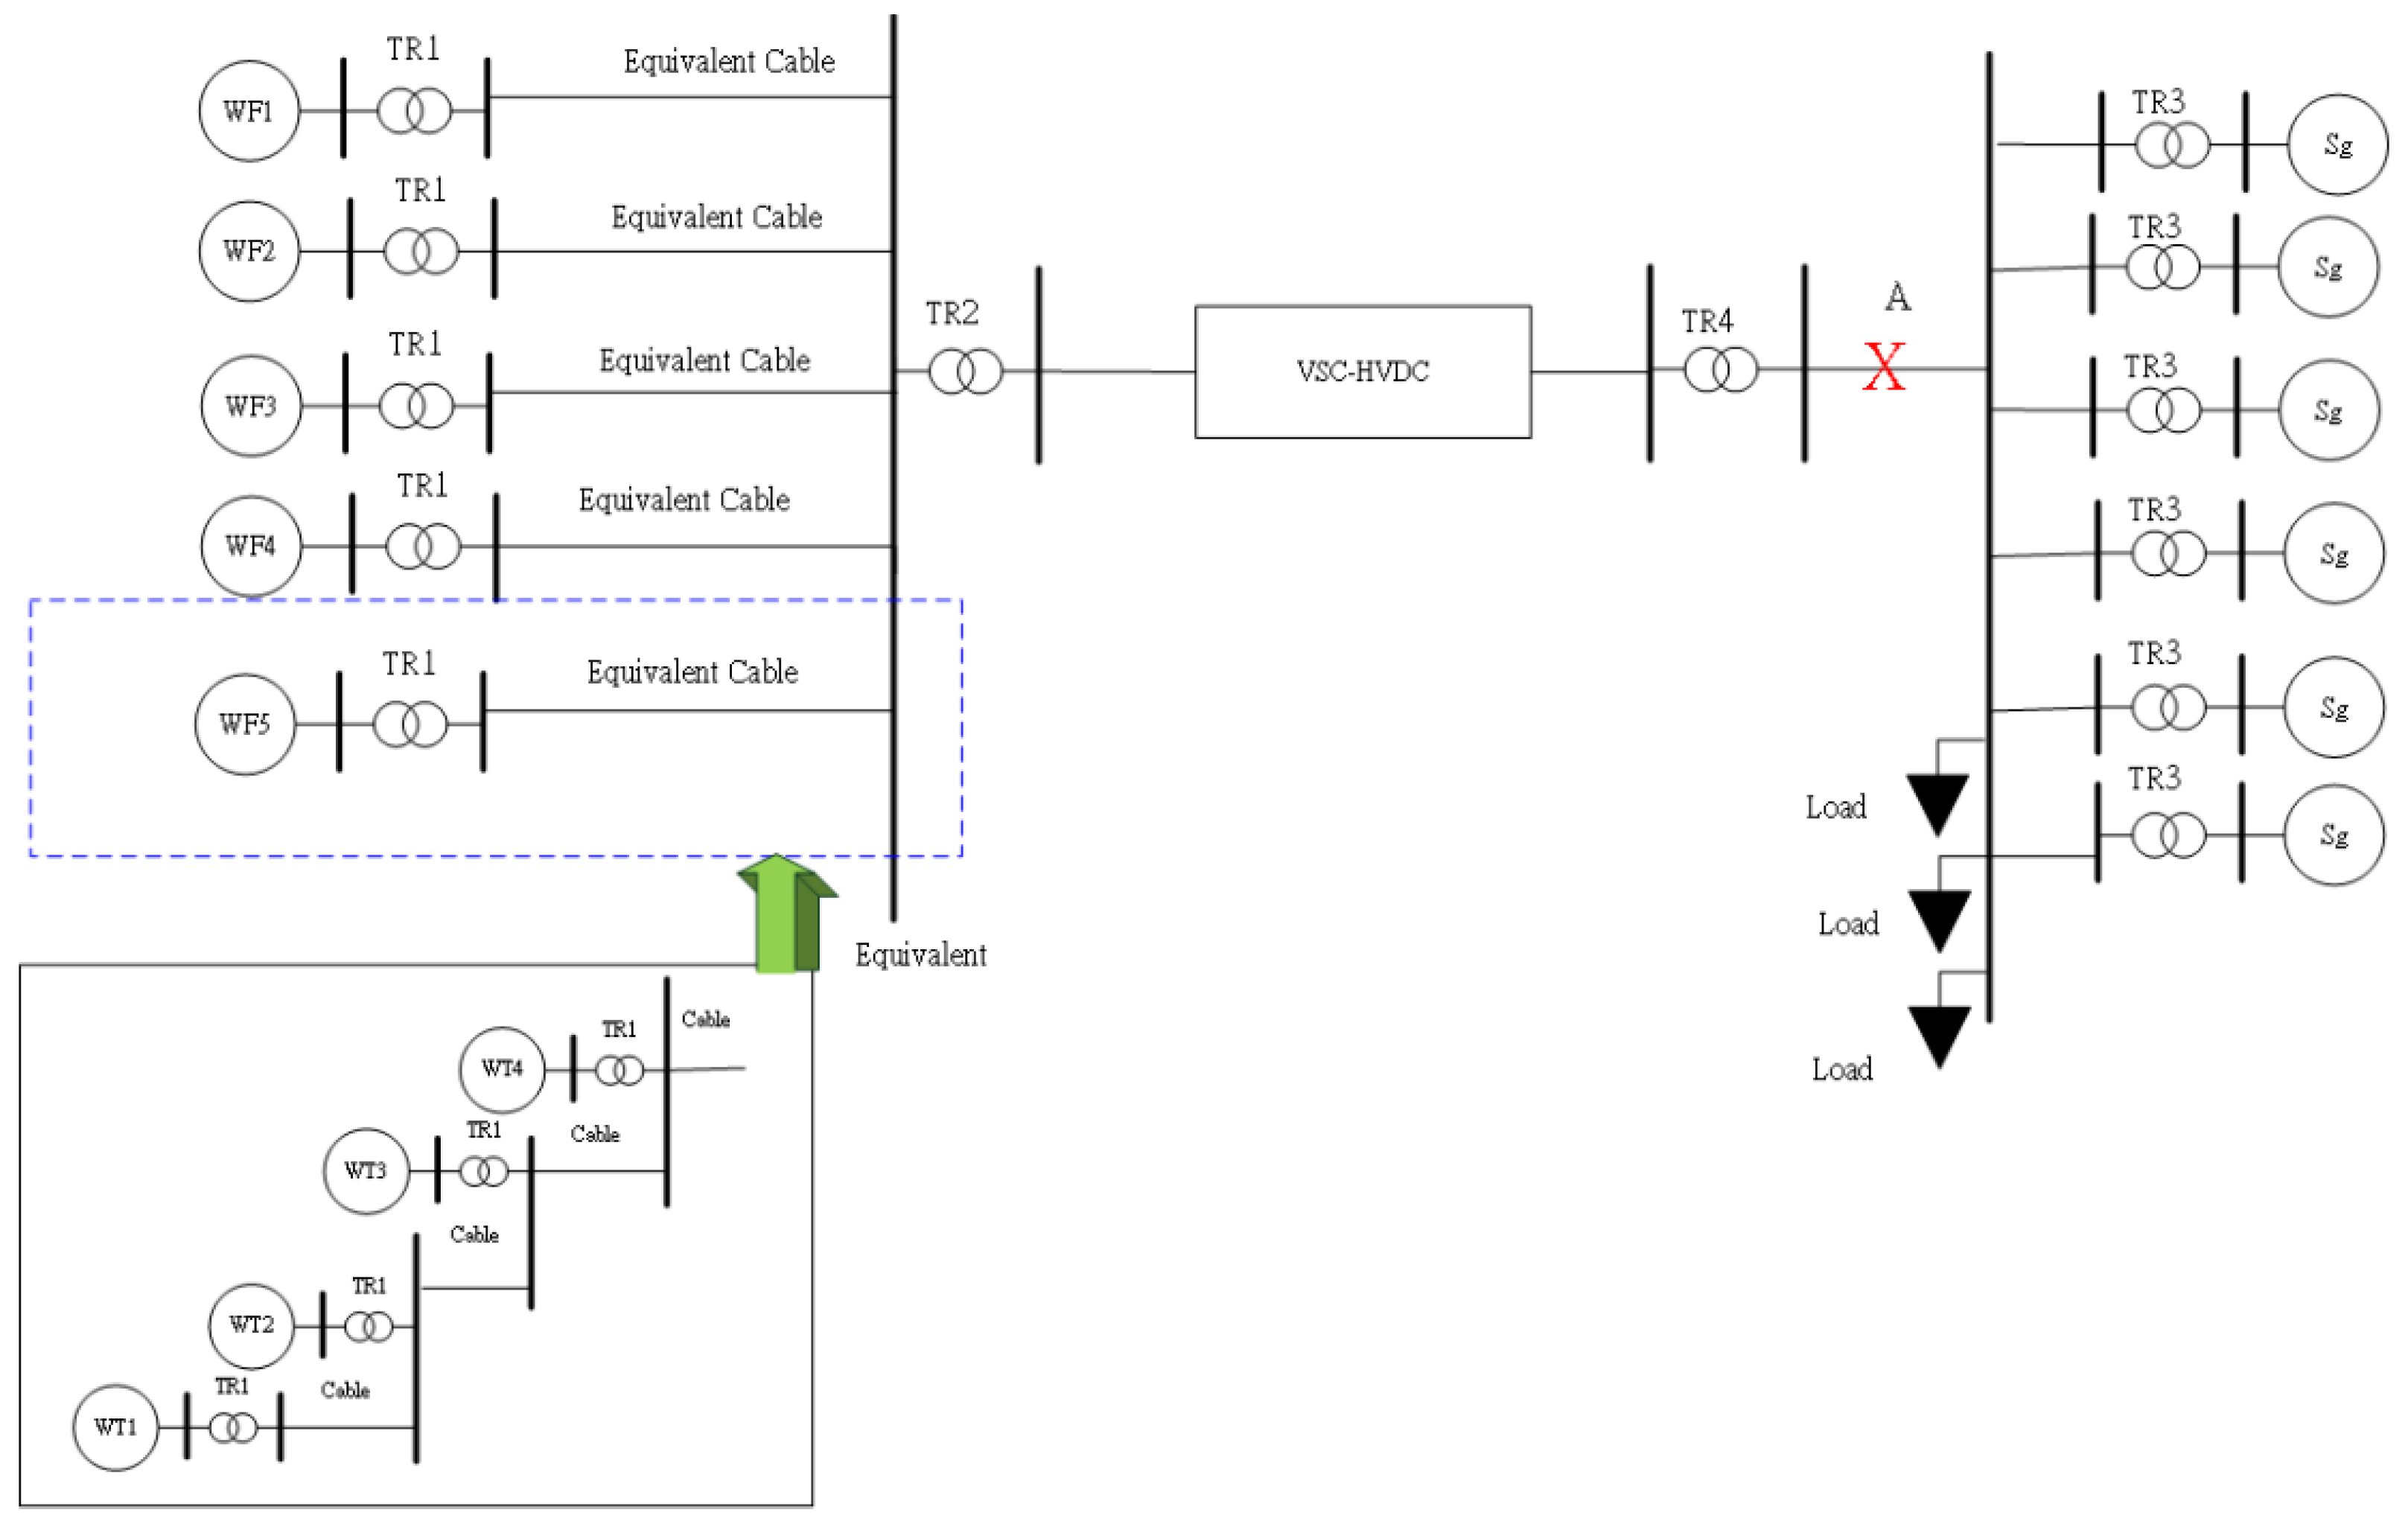
Figure 12 shows the HVDC test system. Each equivalent wind farm includes four wind turbines with a rated power of 8 MW each. The total rated power of the offshore wind farm is 160 MW. On the onshore grid, there are six synchronous generators with a rated power of 125MW each.
Table 2 shows the assumed wind speeds for WTs.
Table 3 indicates the parameter of the cable. The turns ratio of the transformer in TR1 and TR2 is 0.69KV/66KV and 66KV/161KV, respectively.
3.2. A reactive load is added to the system with an AC transmission system
To investigate whether the proposed methods can work adequately in the AC system or not, an increase of reactive load (180MVar) is added into the system in 8s.
Figure 13 shows that the transient voltage curve at the PCC using the Adaptive QV, Fixed QV, Variable droop and Constant droop controls.
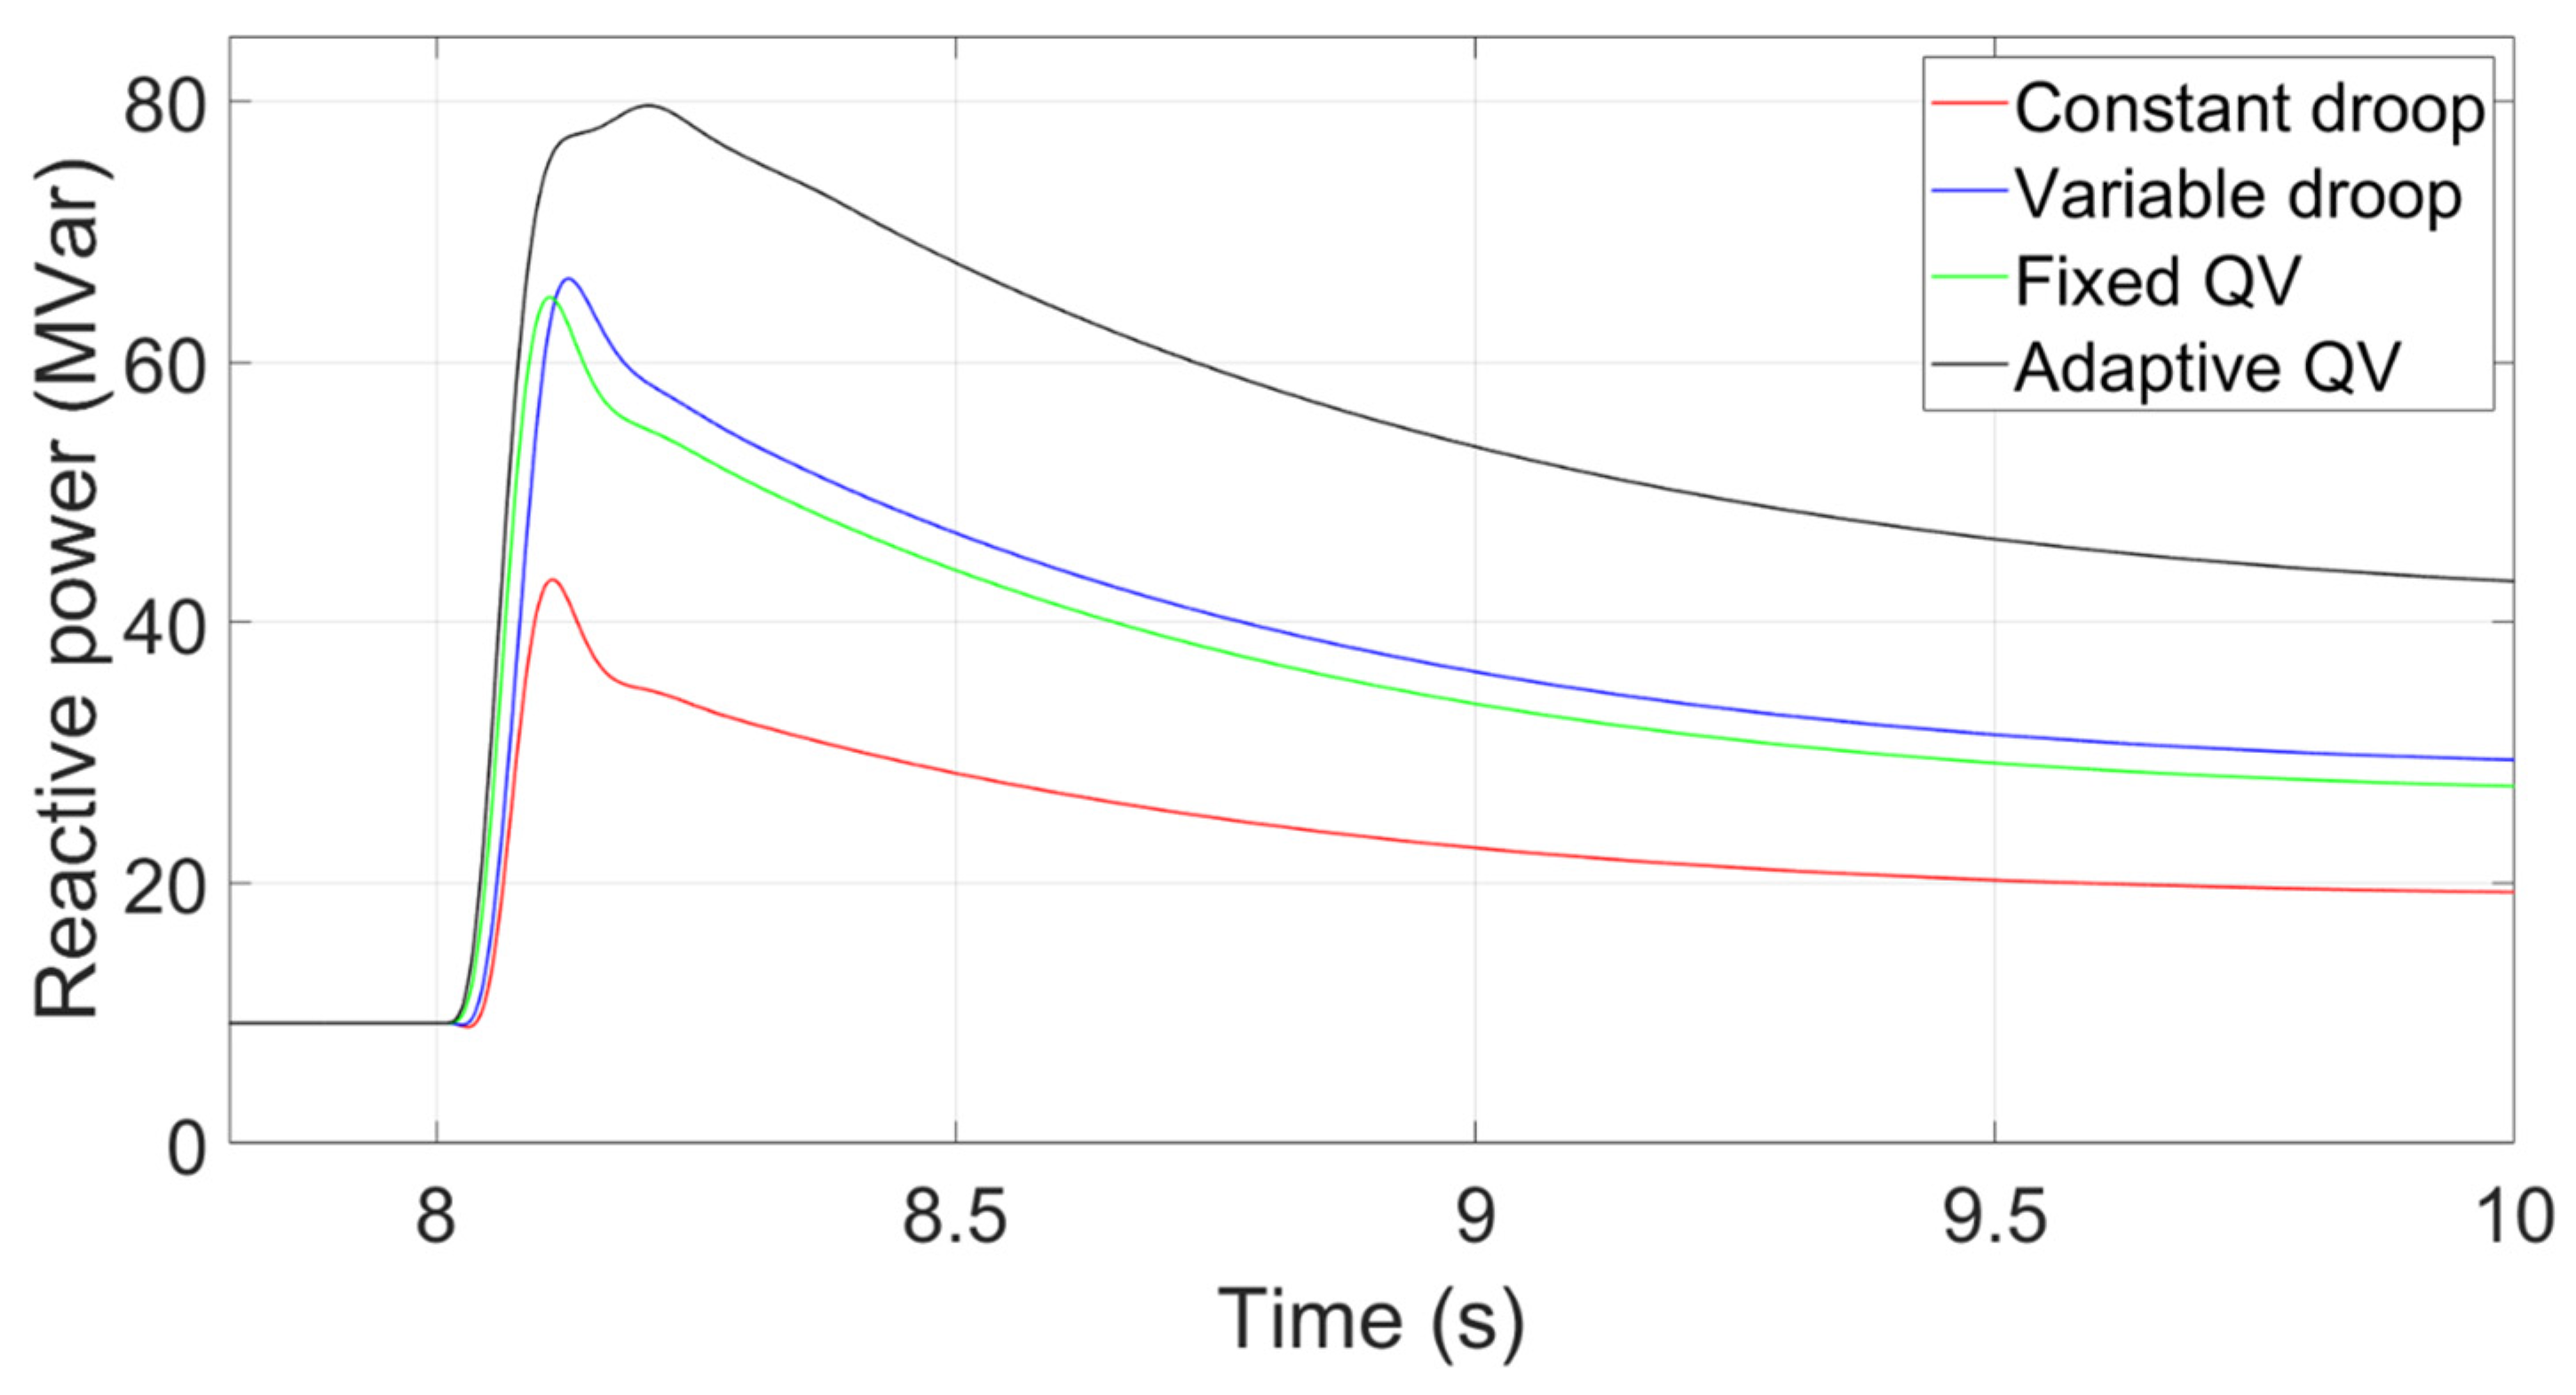
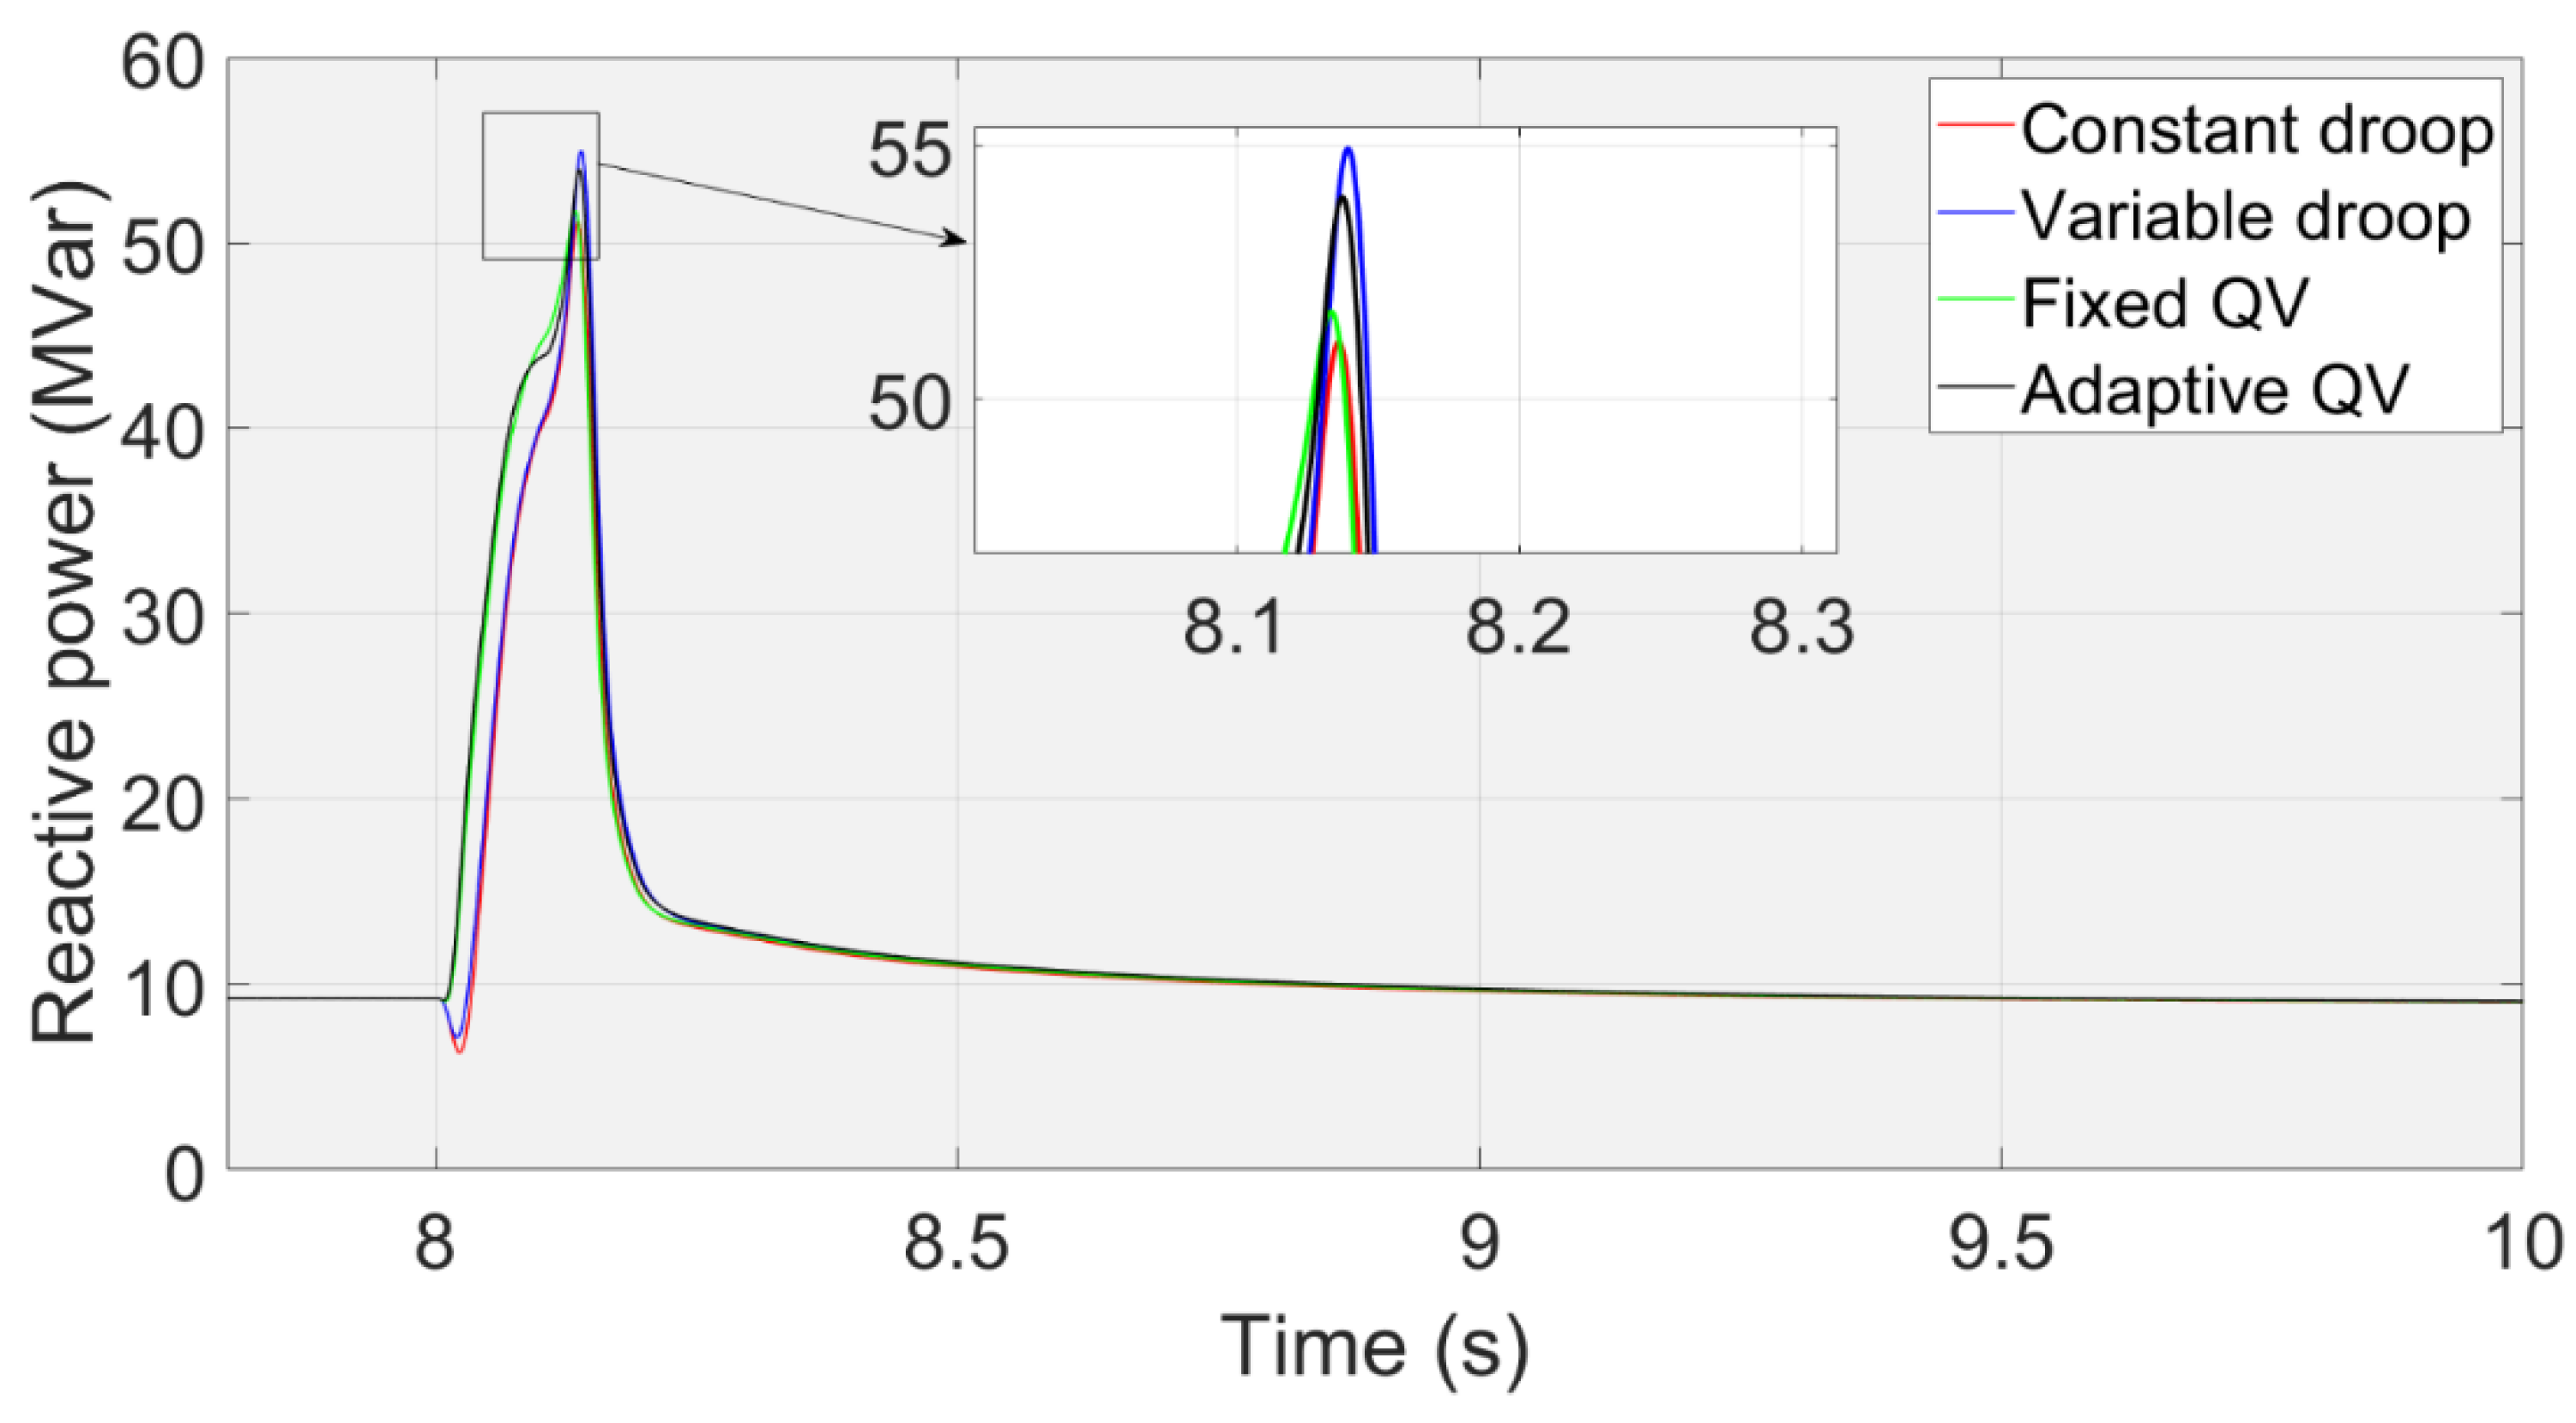
Figure 14 shows the transient reactive power that inserts into the PCC with the corresponding control methods. The voltage nadir using the fixed QV is higher than that using the variable droop control, although the peak reactive power using the fixed QV is lower than that using the variable droop control, because the fixed QV method has the characteristics of rapid response. That is, the response time of reactive power is quick.
3.3. A reactive load is added to the system with a VSC-HVDC transmission system
To investigate whether the proposed methods can work appropriately in the HVDC-connected wind power system, a reactive load (180MVar) is assumed to be added into the system in 8s. The power factor of power factor control and Vac-Q droop control is set to 0.97 leading.
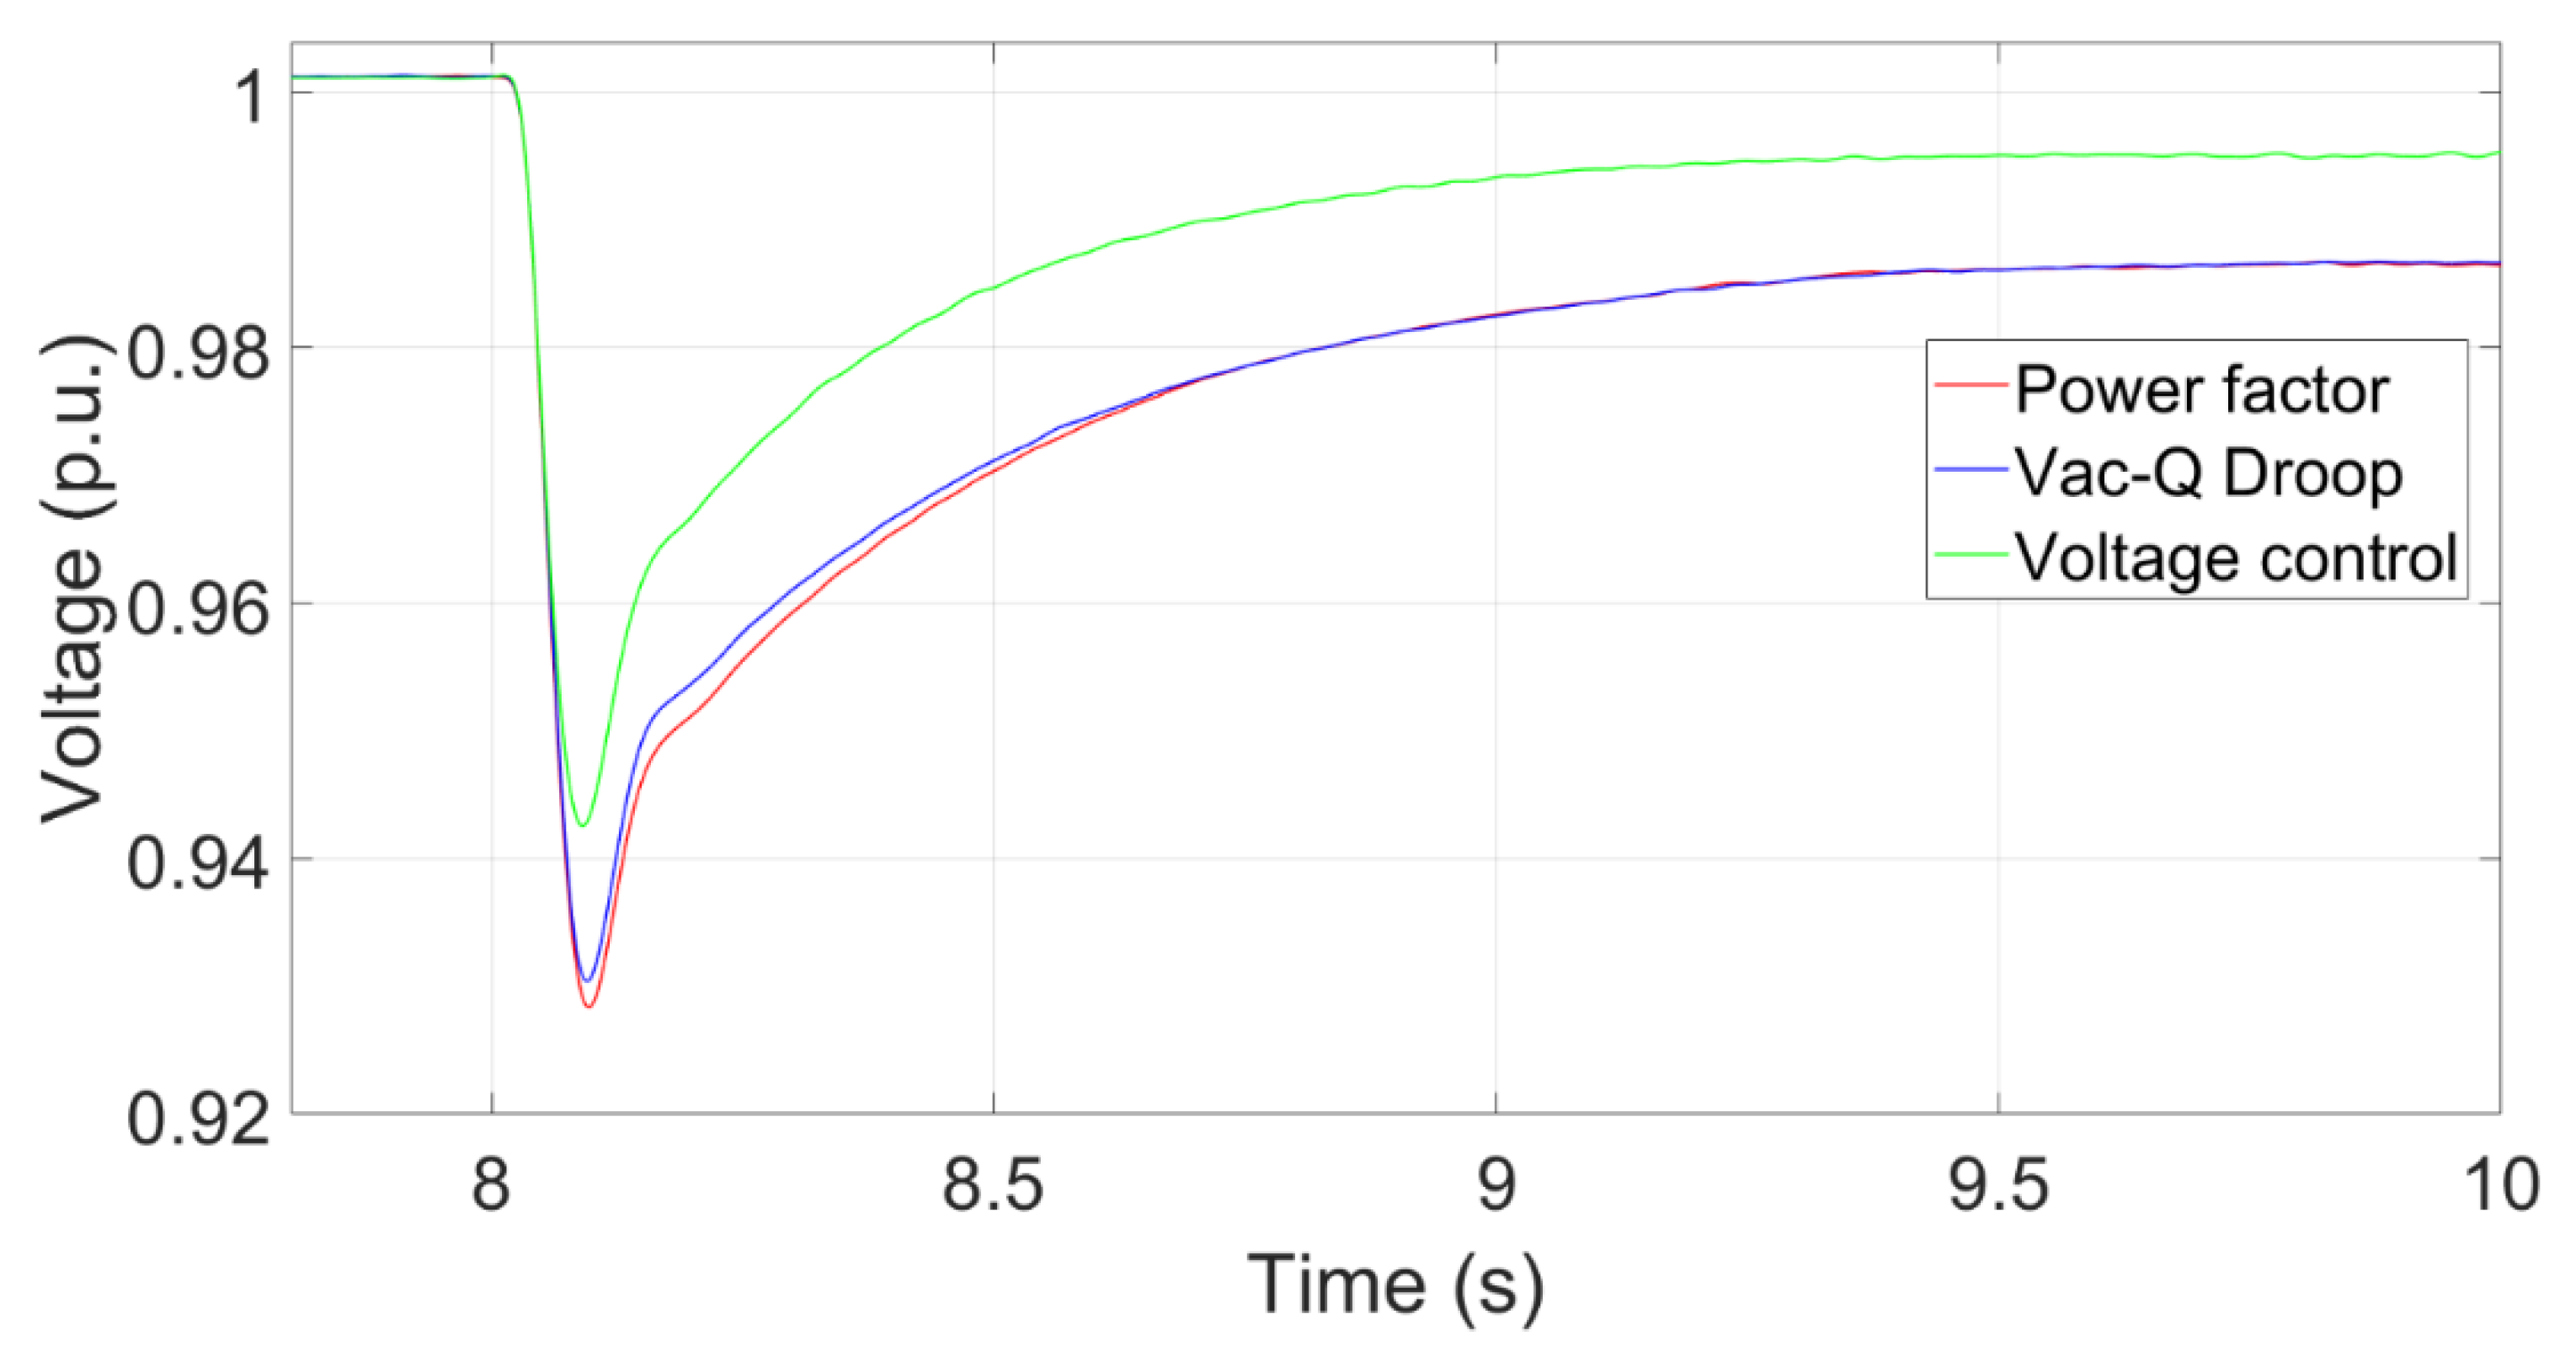
Figure 15 shows that the transient voltage curve at the PCC using the Voltage control, Vac-Q Droop and Power factor controls. The voltage by using the voltage control recovers quickly because it provides a rapid reactive power response after the reactive power load is added. The transient voltage using the power factor control drops the most because it maintains a constant power factor without providing extra reactive power.
3.4. Three-phase short circuit fault at the system with an AC transmission system
In this study, a three-phase short circuit fault for 100ms occurs at 8s in point A (Figs. 11 and 12).
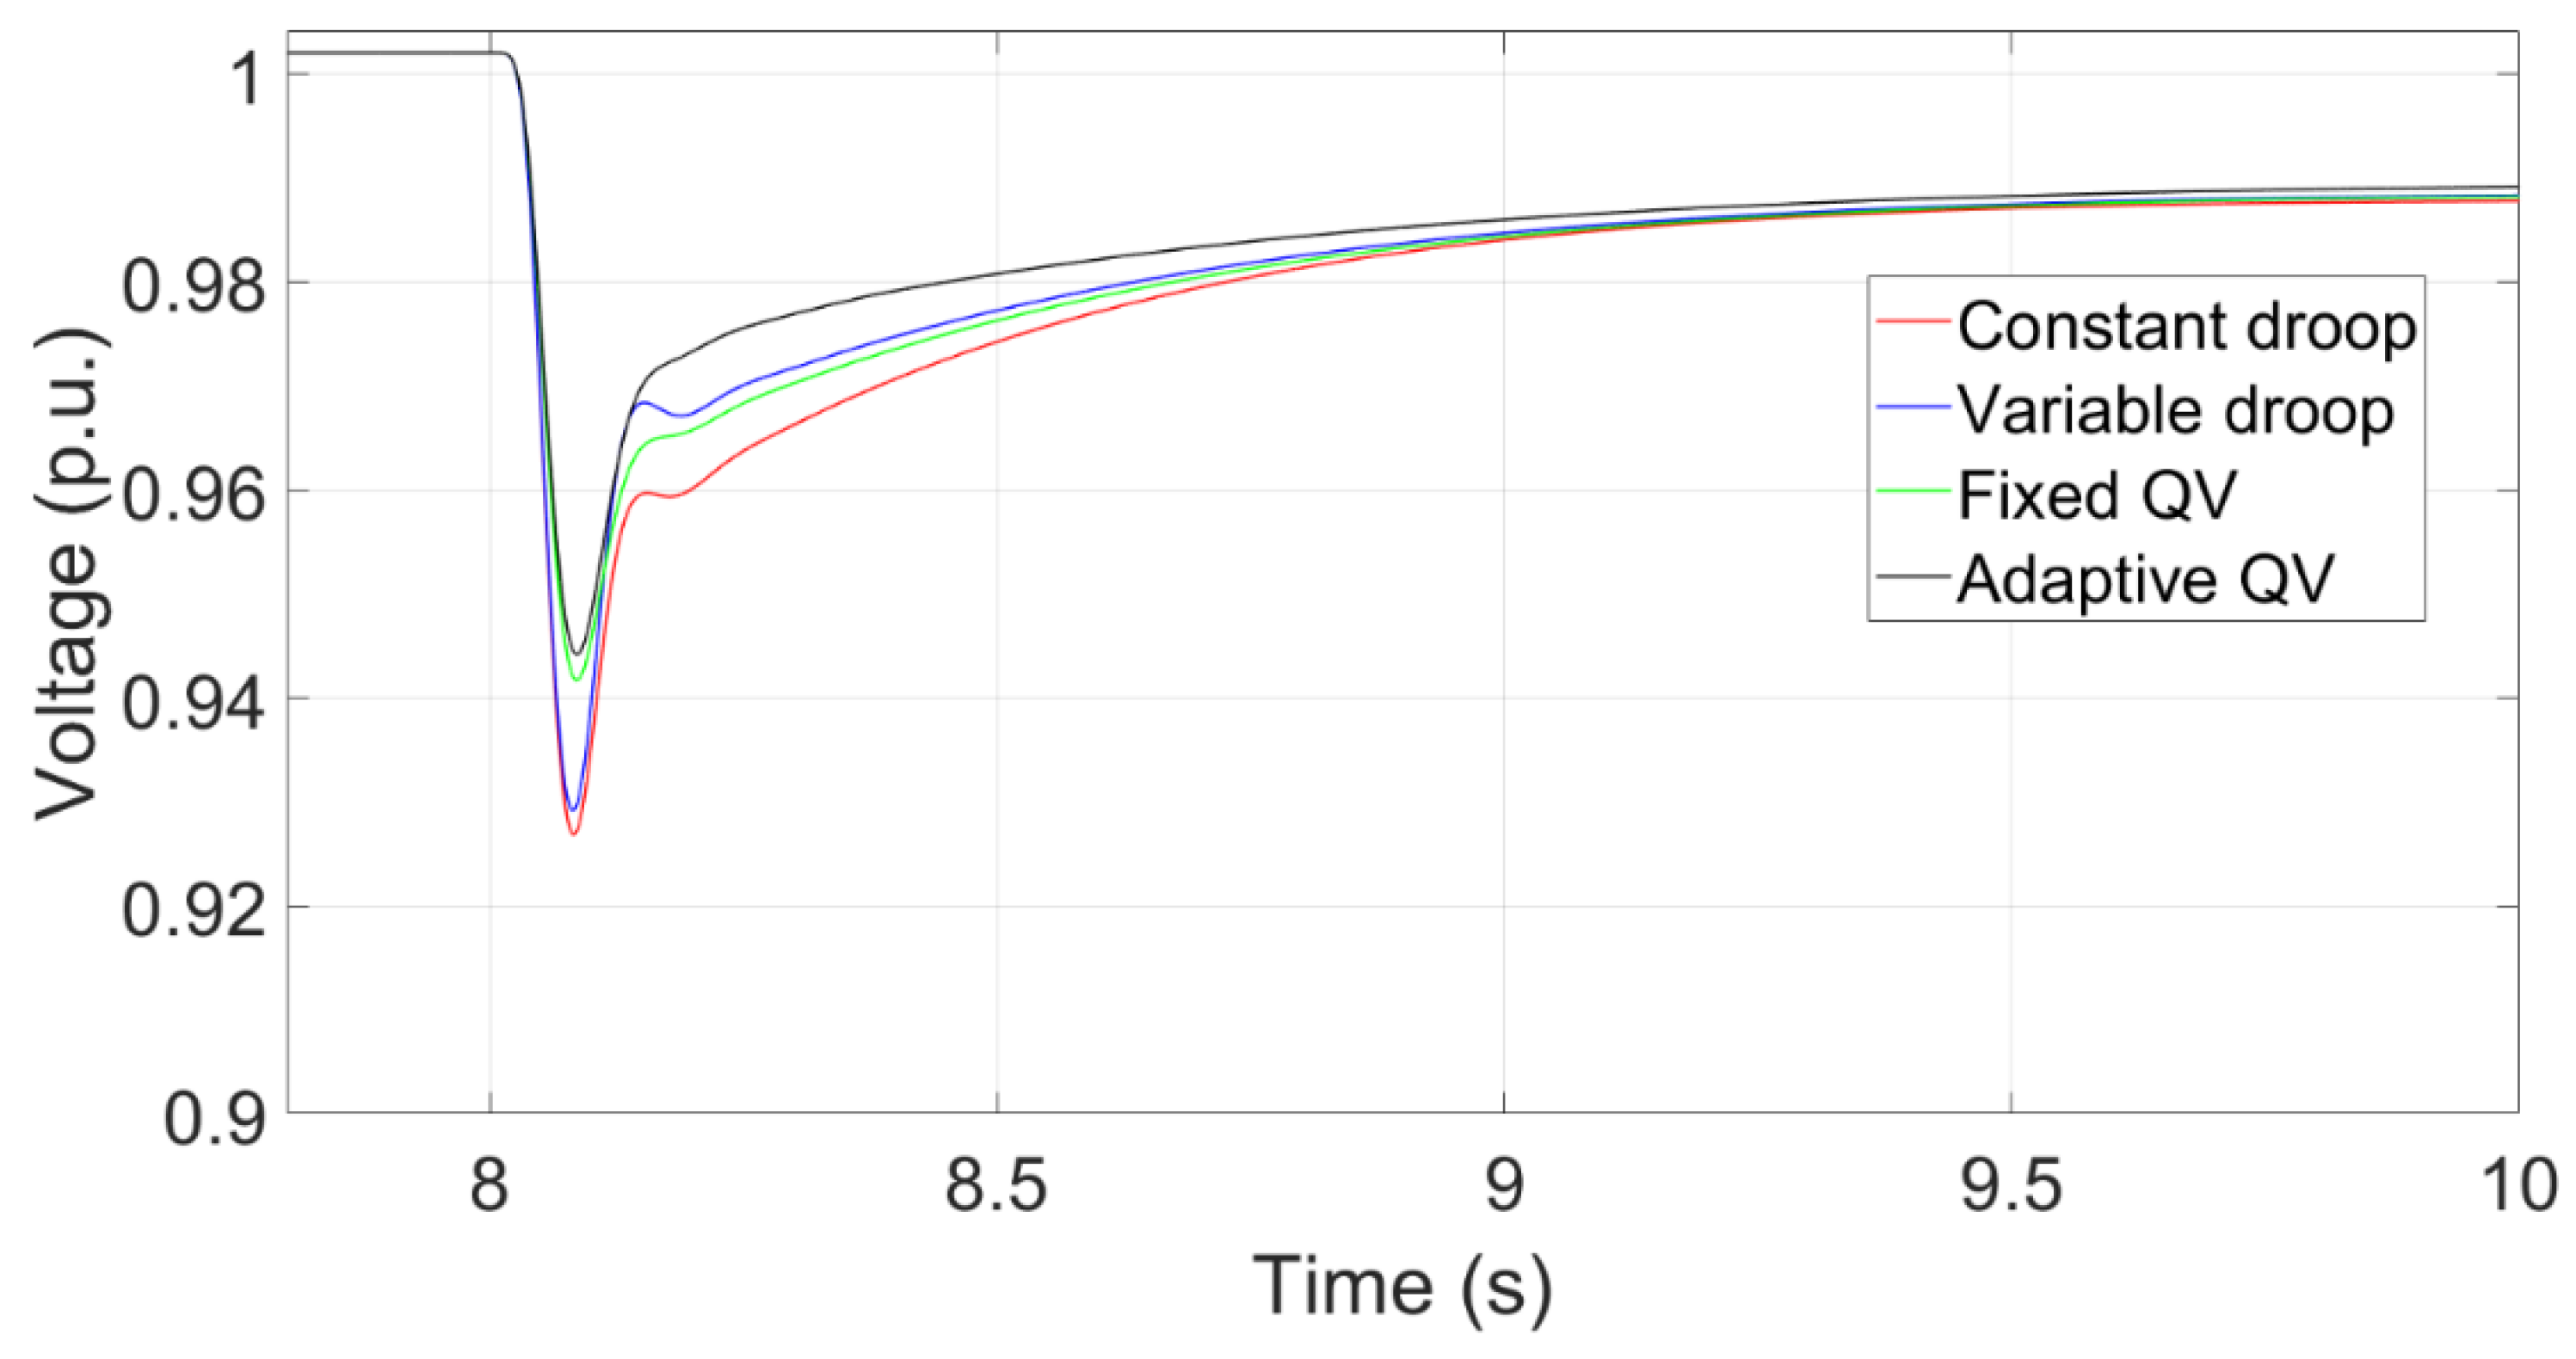
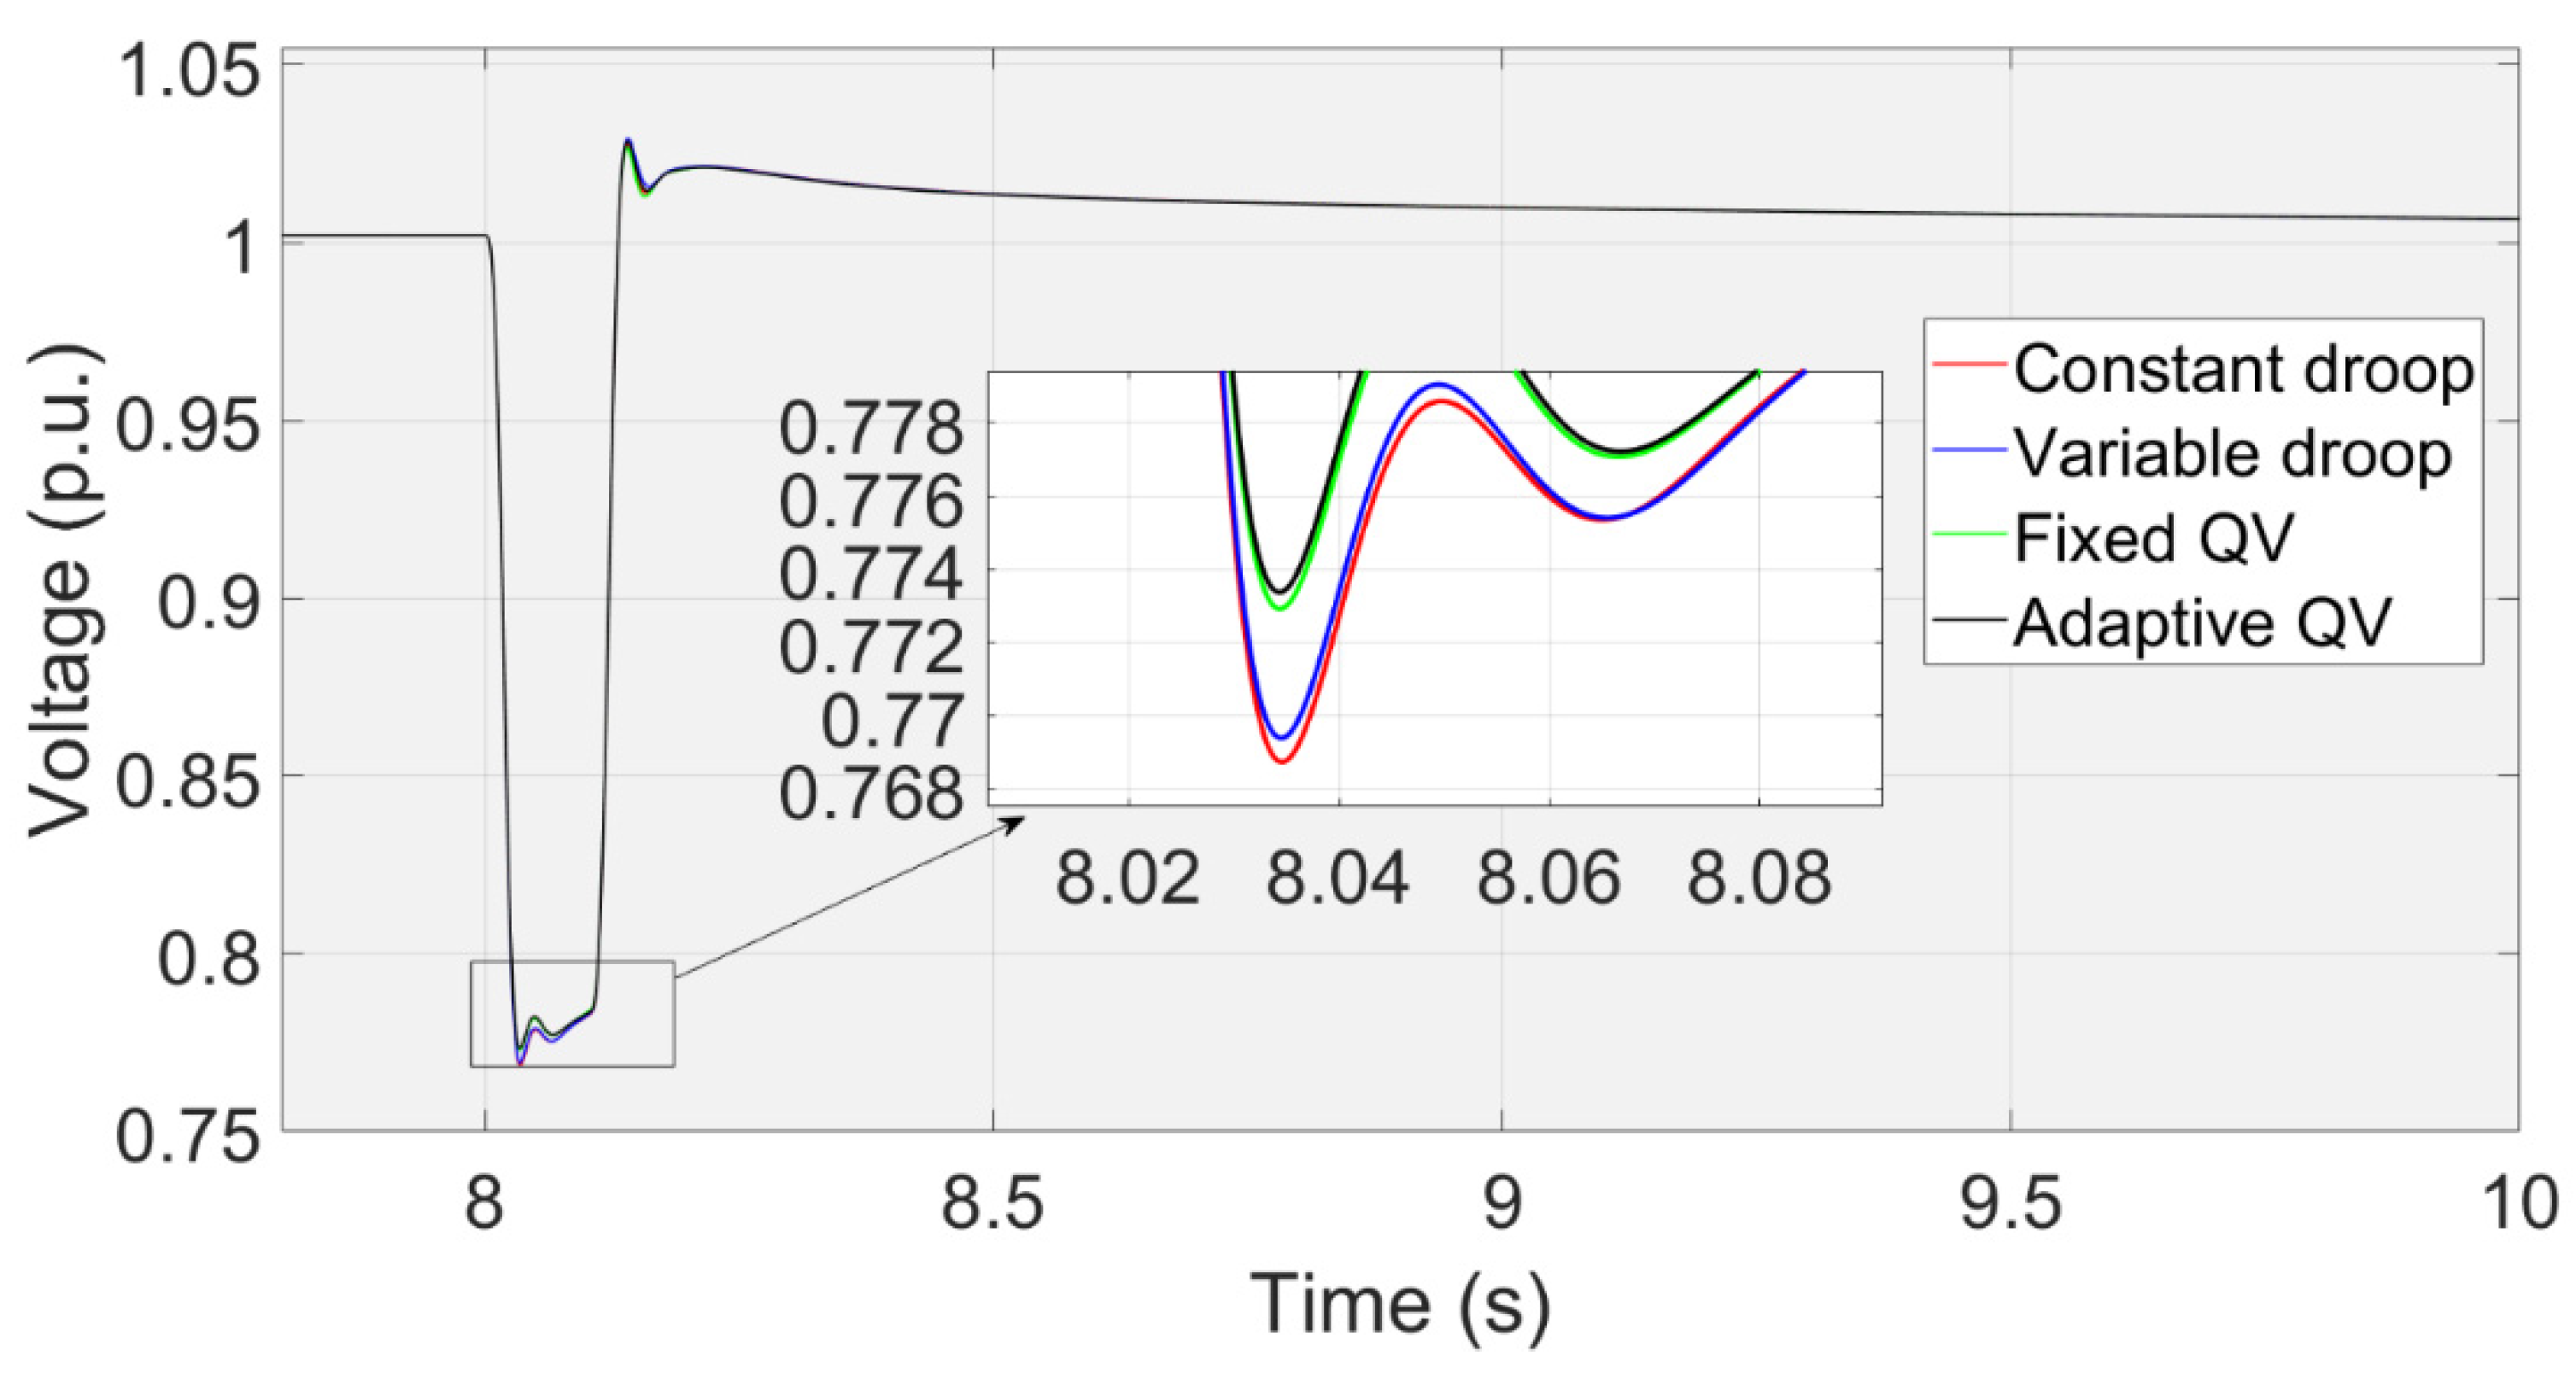
Figure 17 shows that the transient voltage curve at the PCC using Adaptive QV, Fixed QV, Variable droop and Constant droop controls.
Figure 18 shows the maximum reactive power that inserts into the PCC using Variable droop control, Adaptive QV, Fixed QV, and Constant droop control. Like the case in
Section 3.2, the characteristics of the QV method with a rapid response can cause a higher voltage nadir than the droop control. The transient voltage using adaptive QV or fixed QV is similar, while the voltage using the variable droop or the constant droop control is similar. The voltage nadir at the PCC can be improved slightly using adaptive QV or fixed QV, which is like the simulation results in [
11].
3.5. Three-phase short circuit fault at the system with a VSC-HVDC transmission system
A three-phase short circuit fault for 100 ms occurs at 8s in the point A.
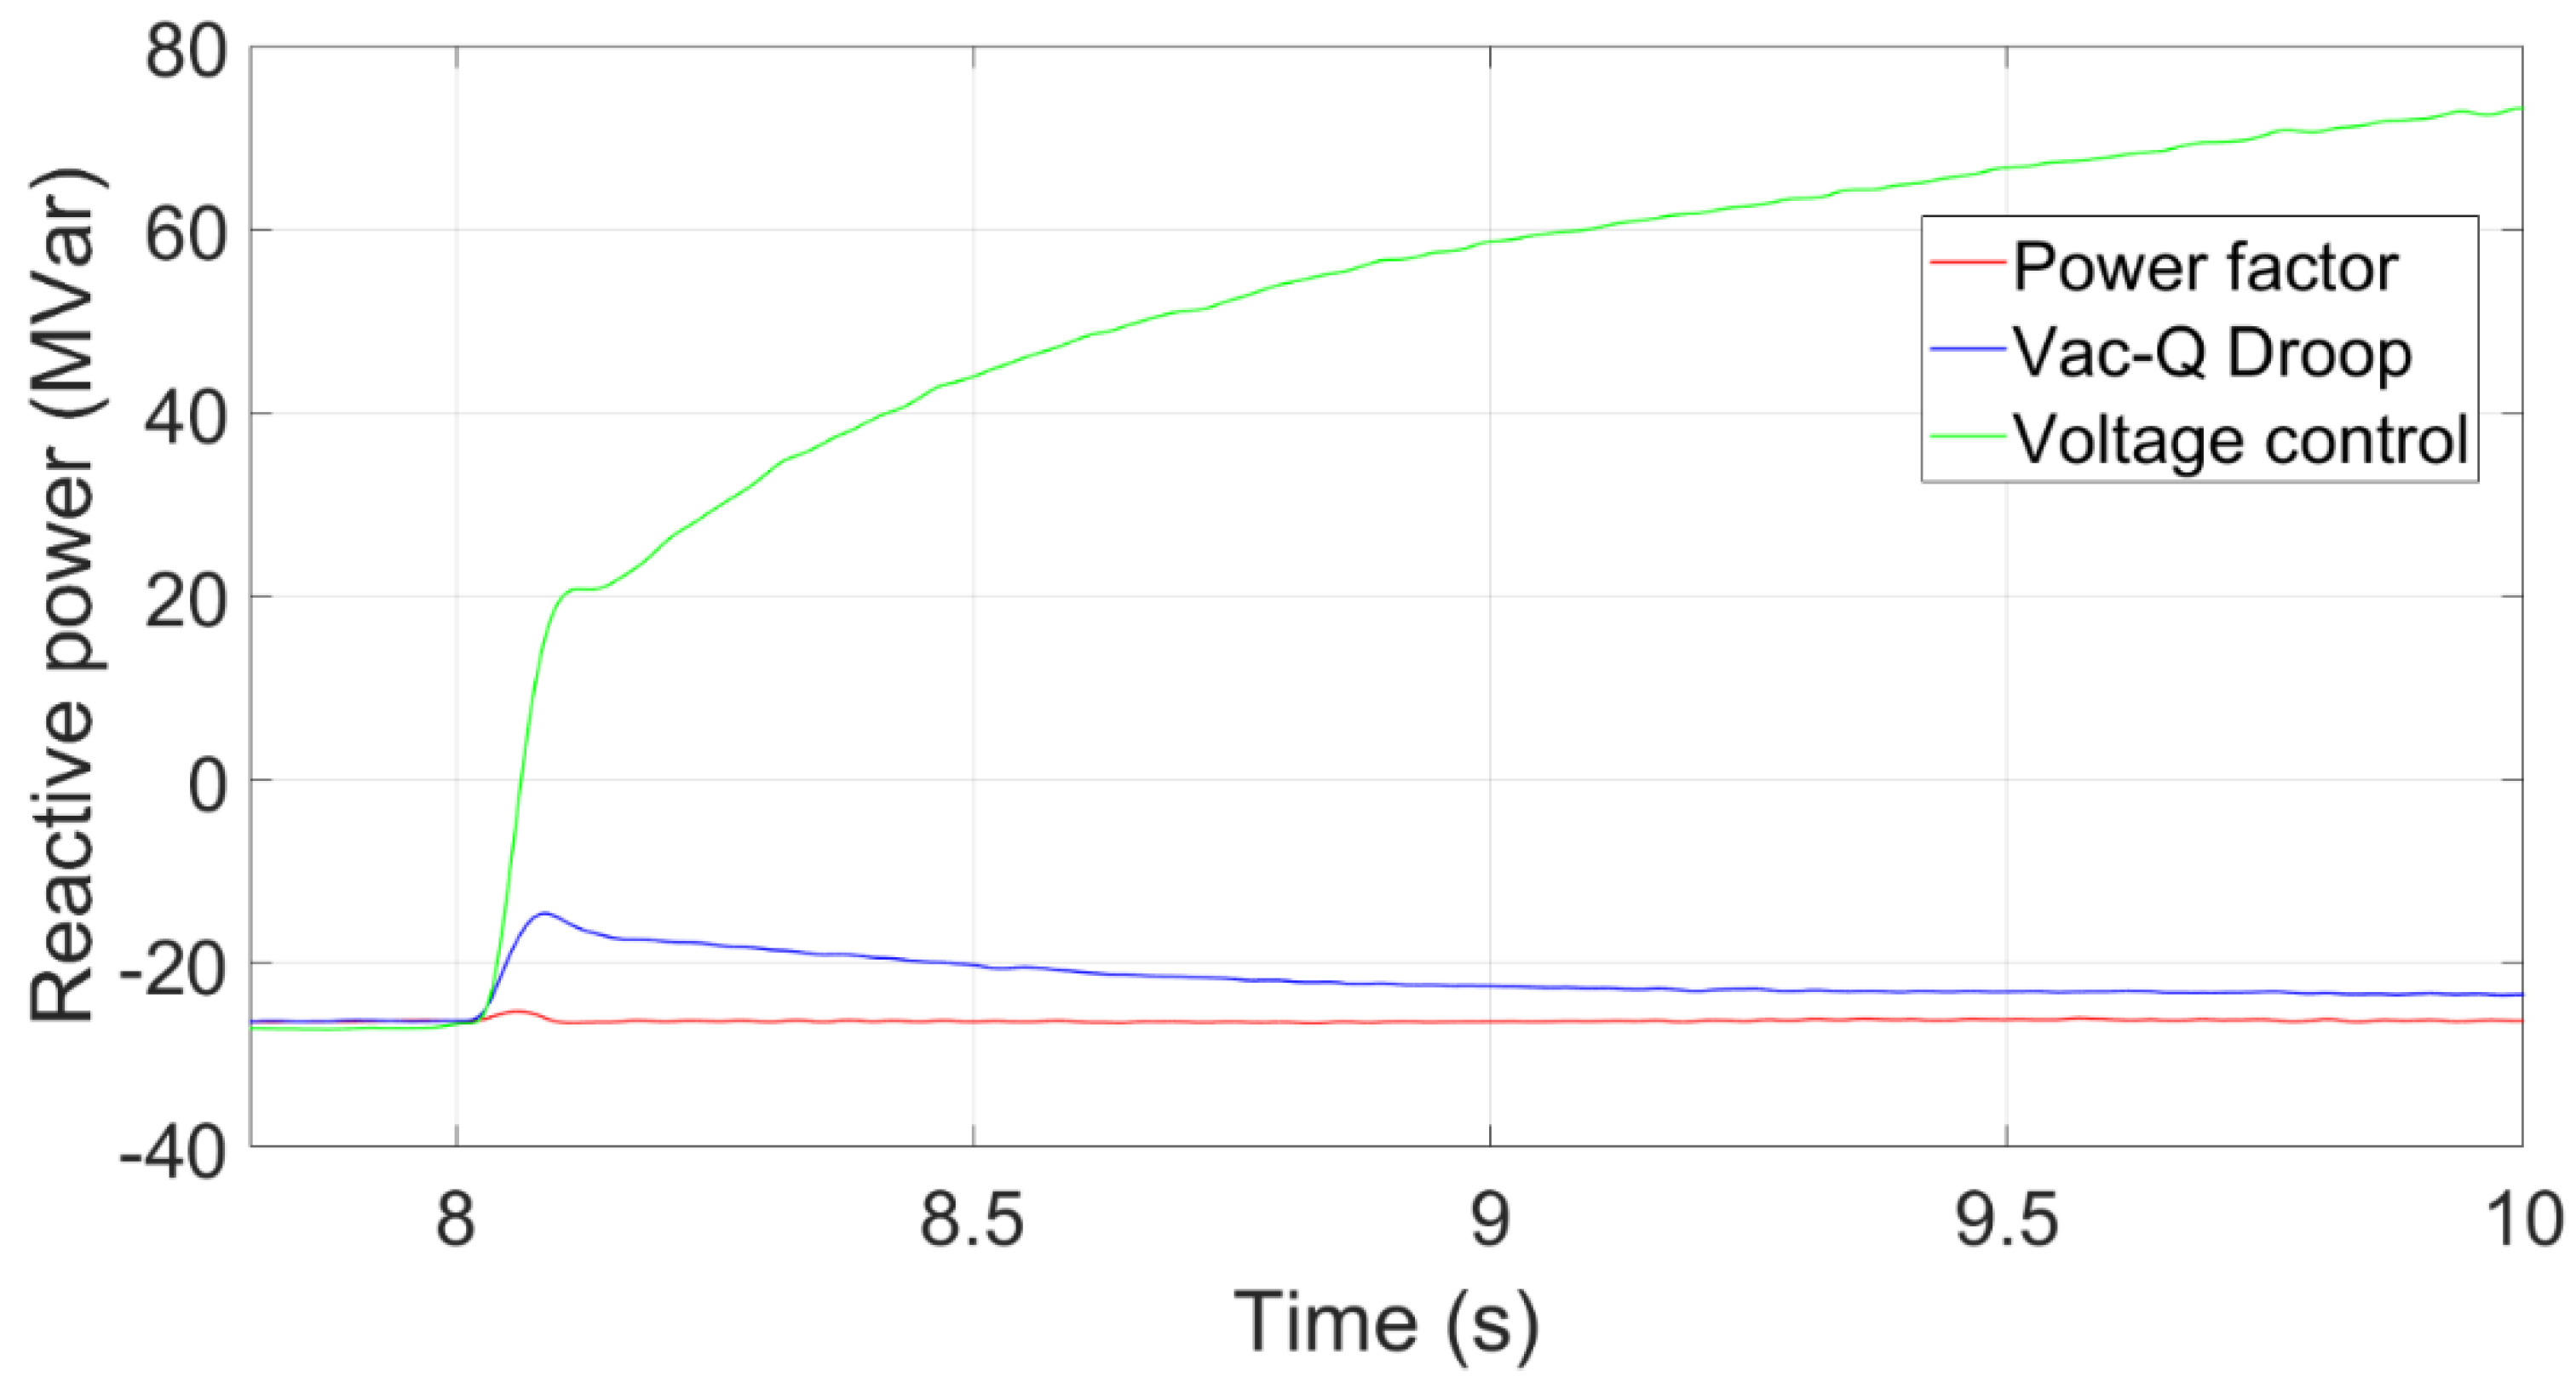
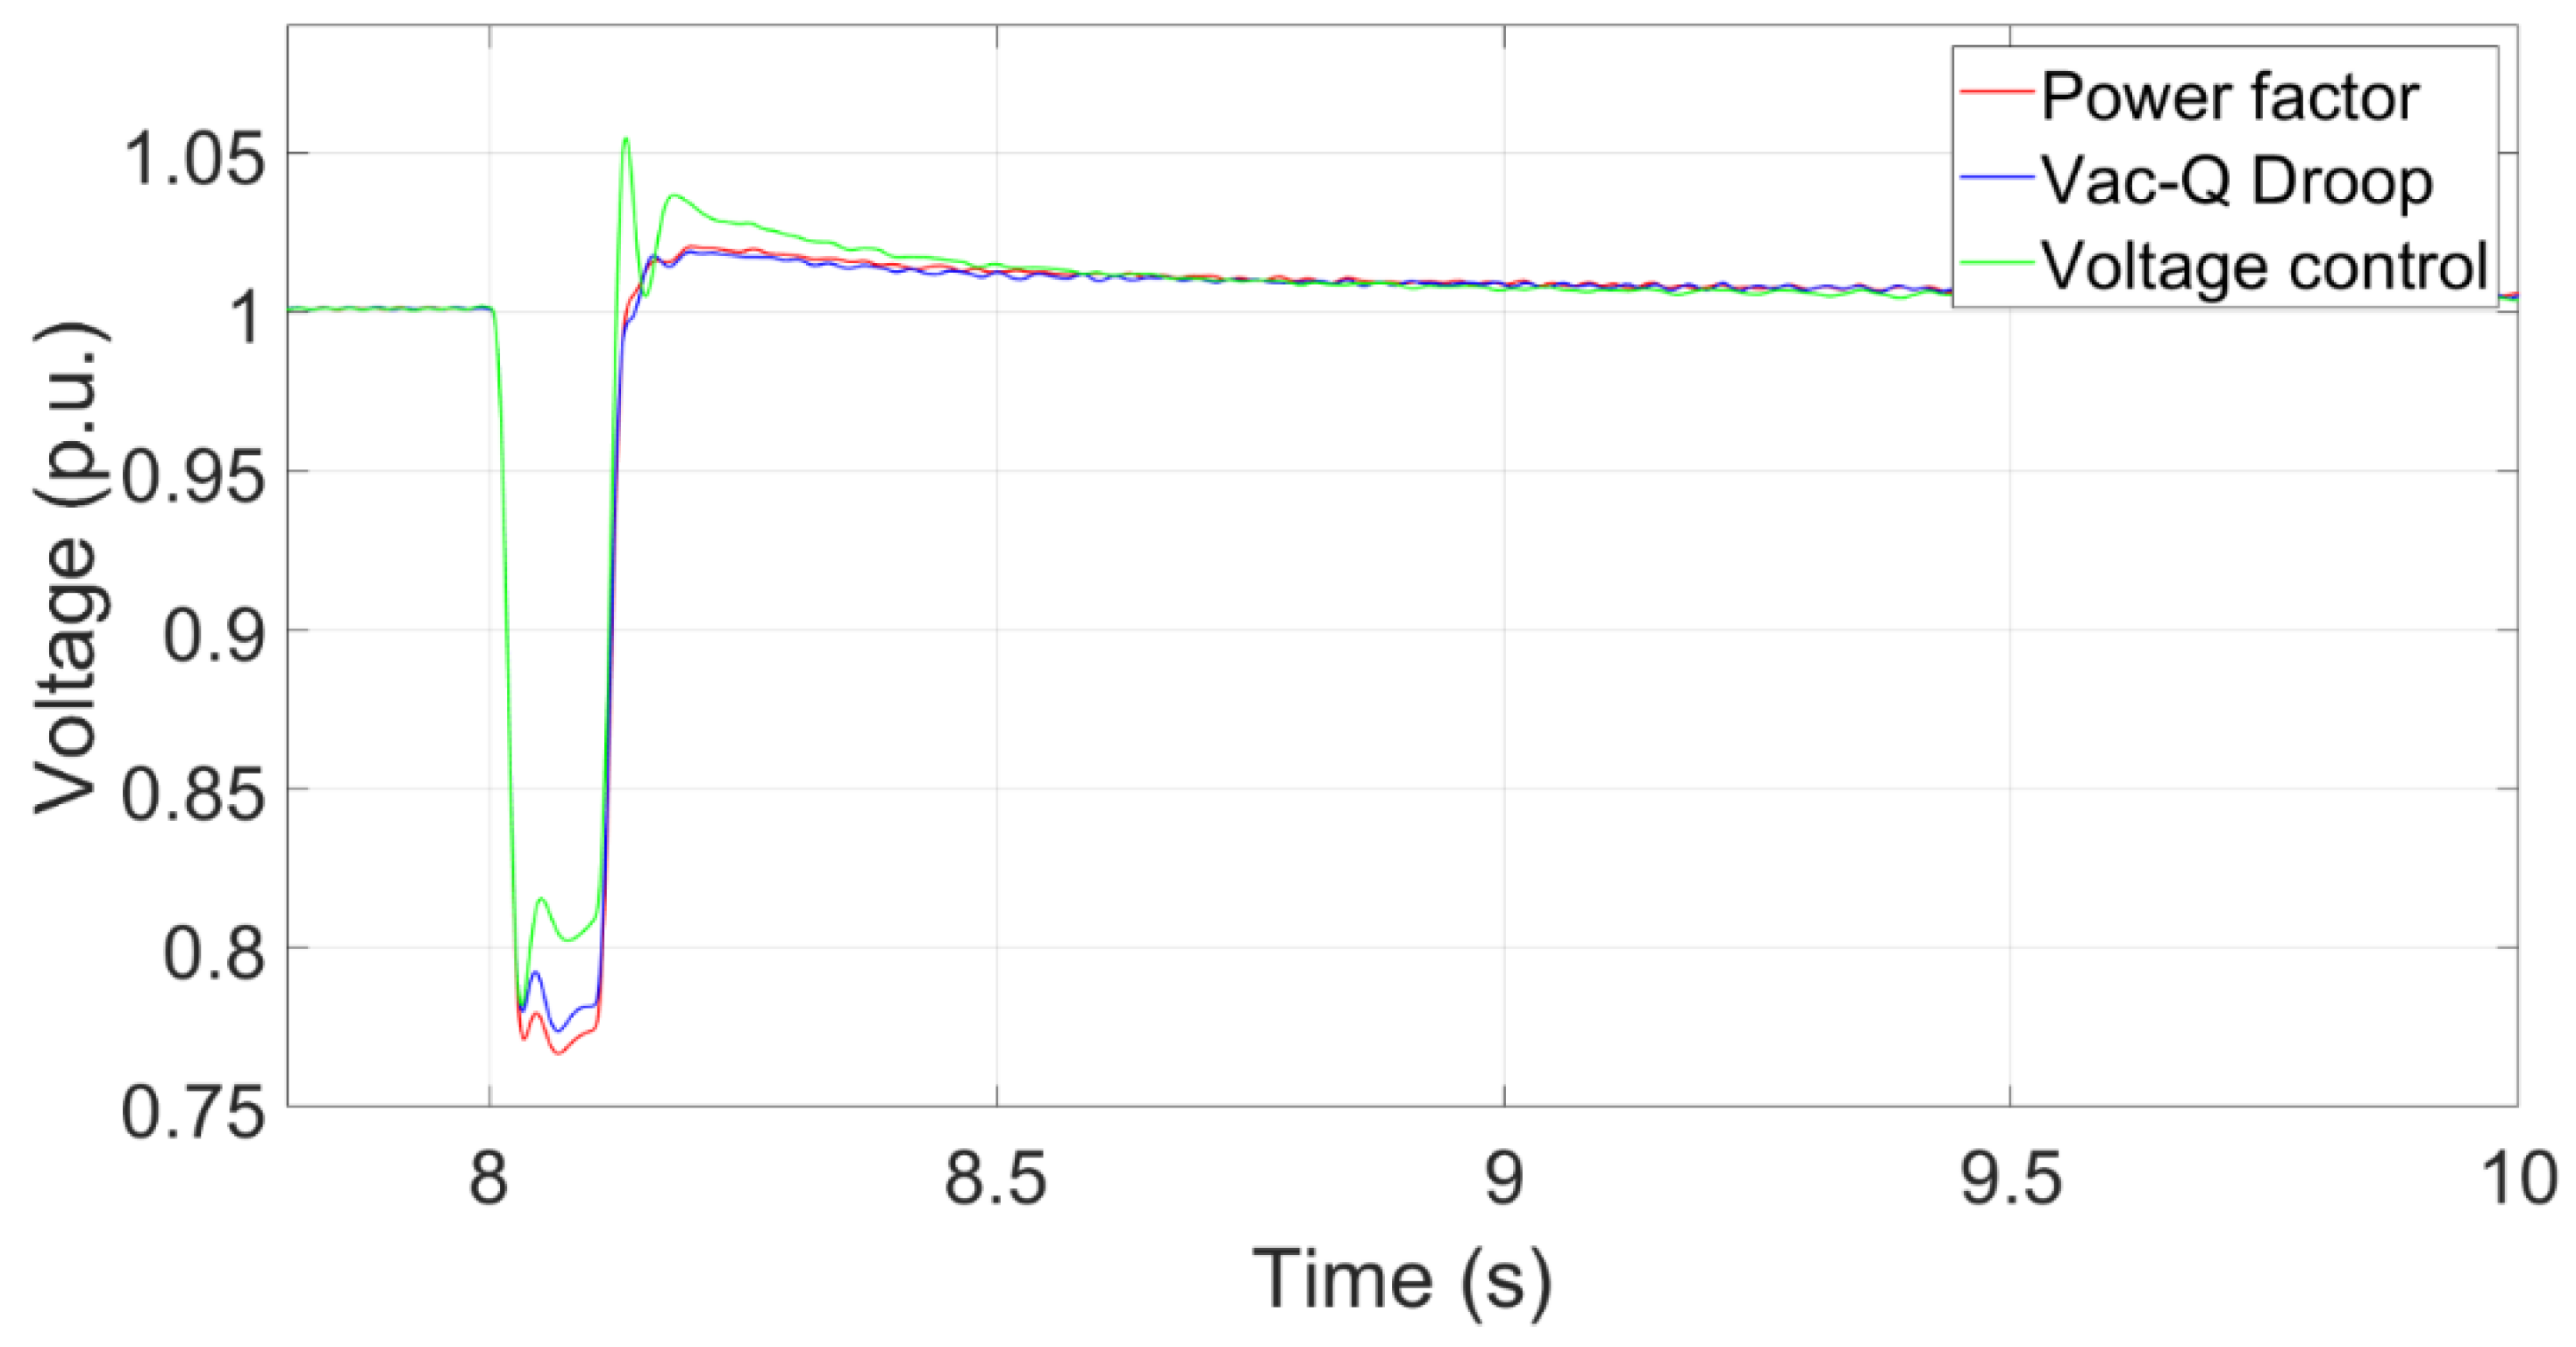
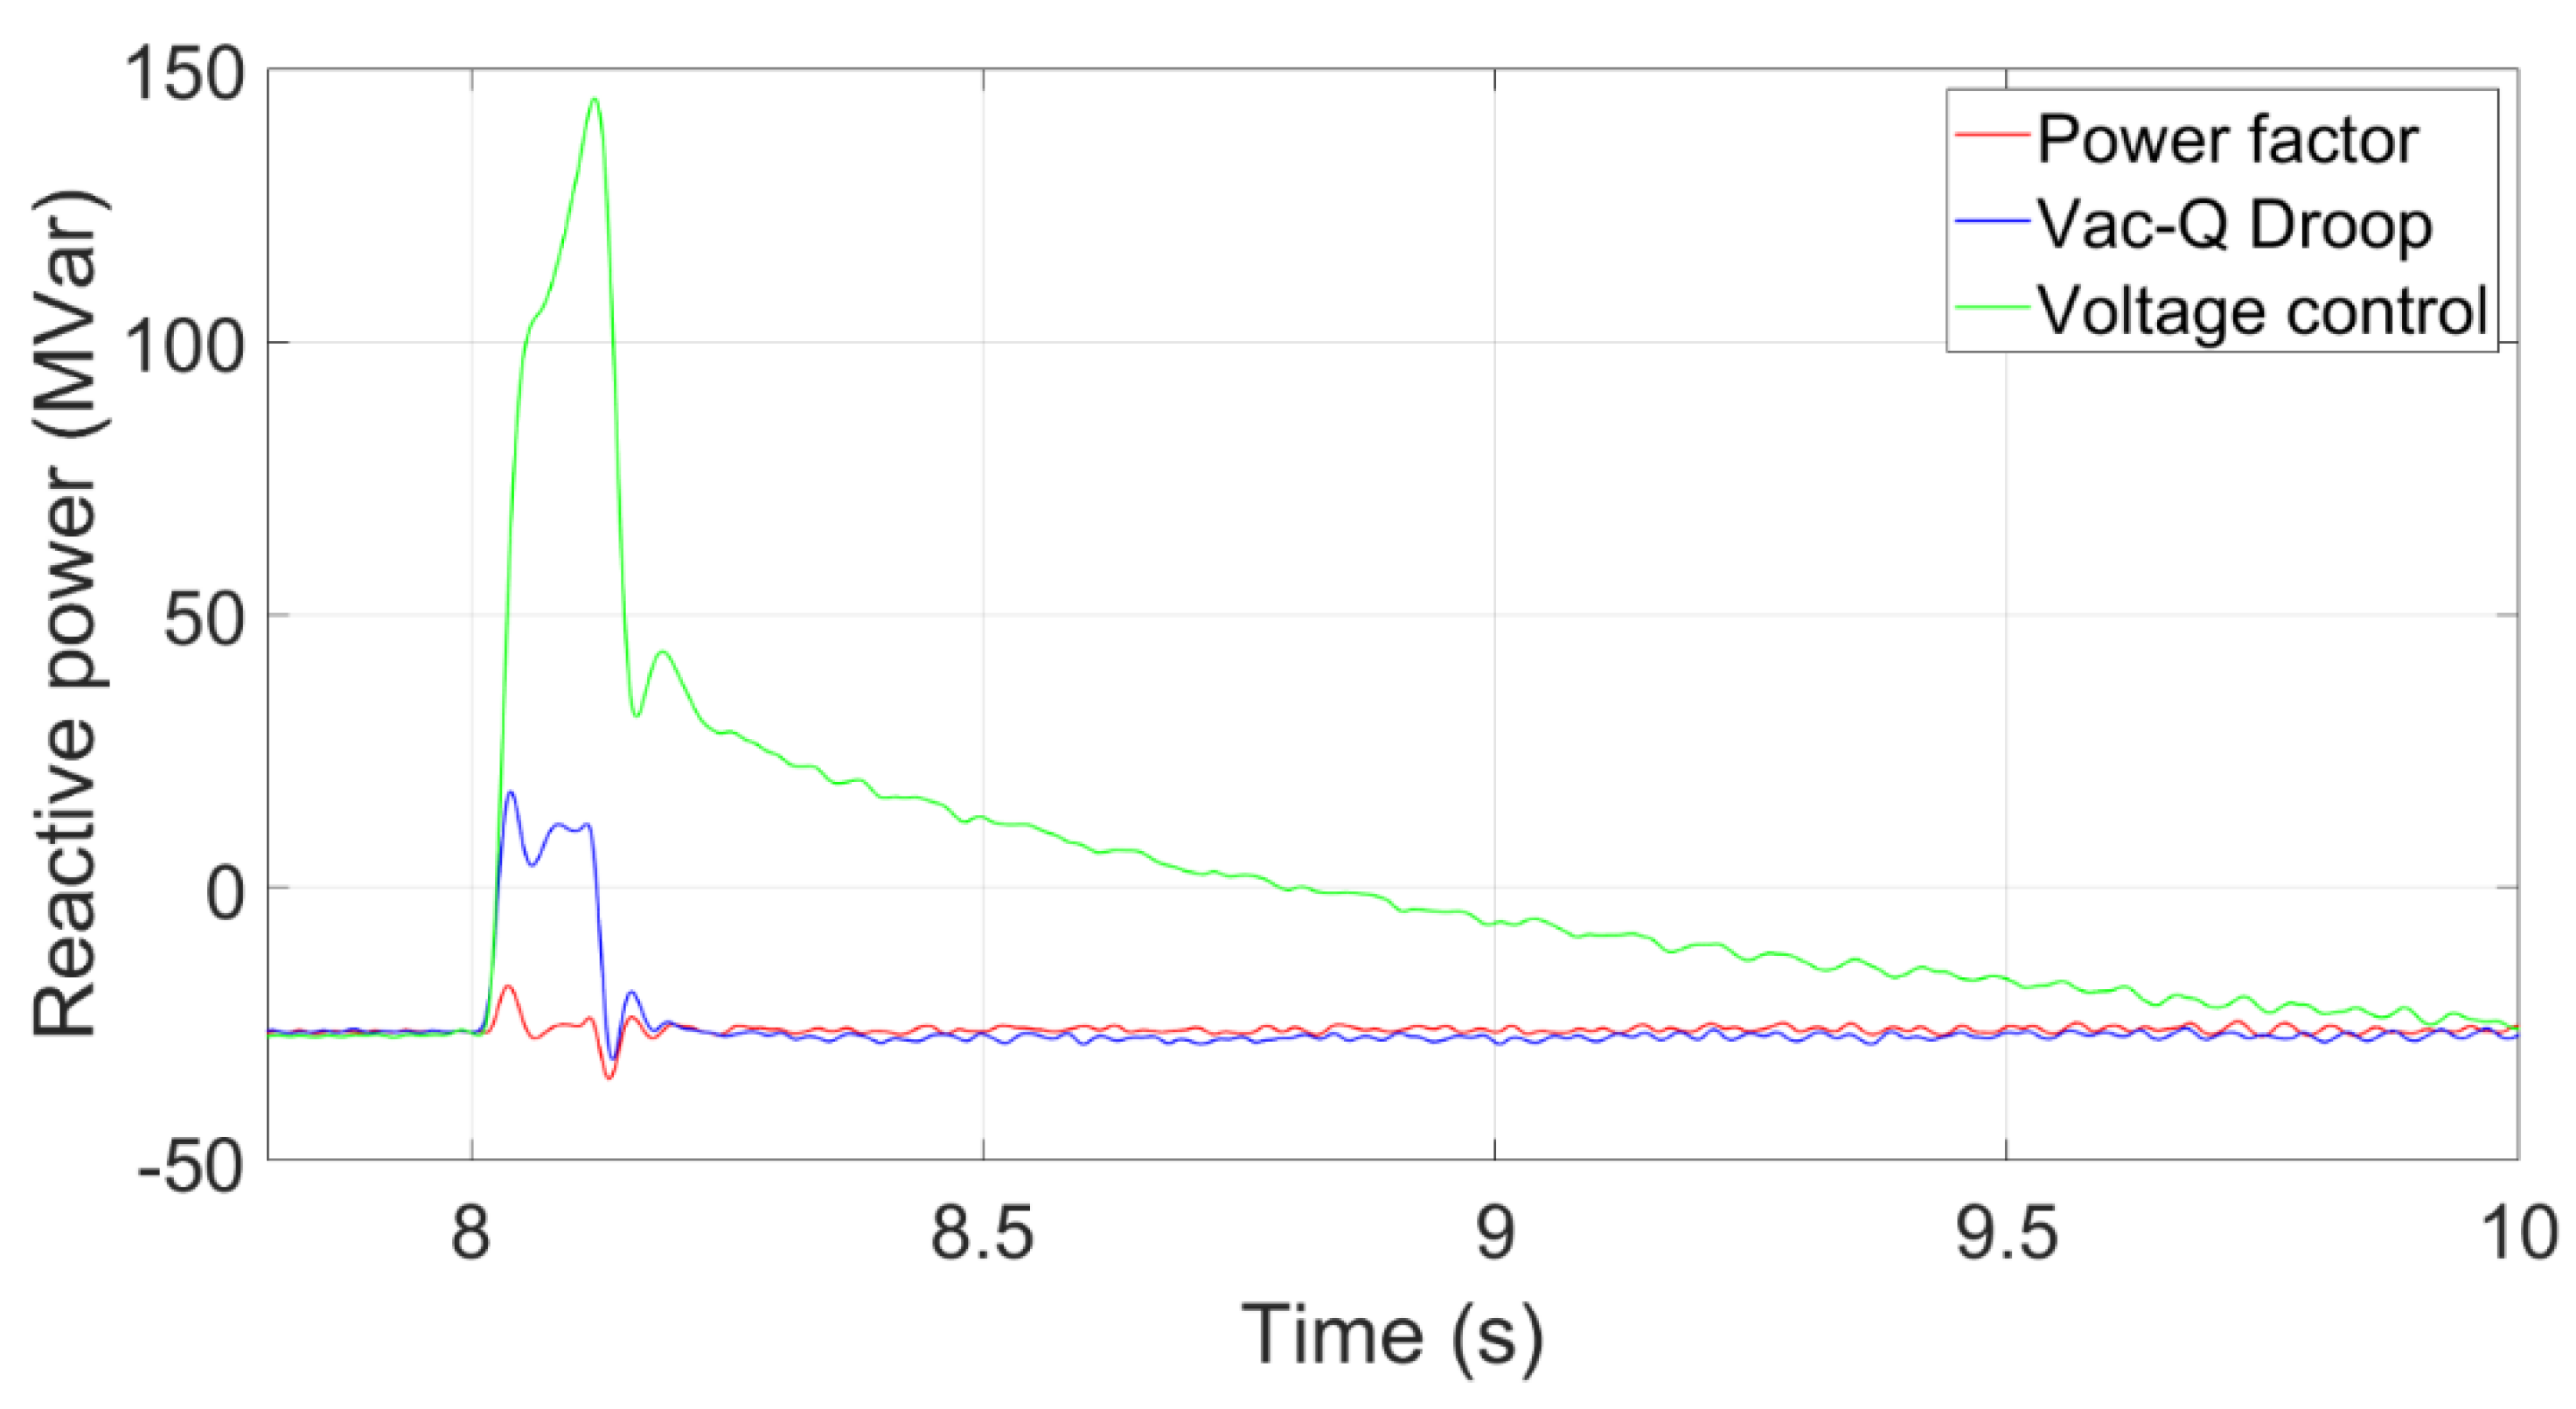
Figure 19 shows the transient voltage curves at the PCC using Voltage control, Vac-Q Droop and Power factor control. The voltage at the PCC using Vac-Q droop control recovers quicker than that using the power factor control because it provides an extra reactive power after the fault. A large kd value in the Vac-Q droop control can provide more reactive power. The voltage at the PCC using the voltage control becomes sightly higher after the fault because this control method can provide much reactive power.
3.6. Comparison of an increase of reactive power load at both systems with different transmisison types
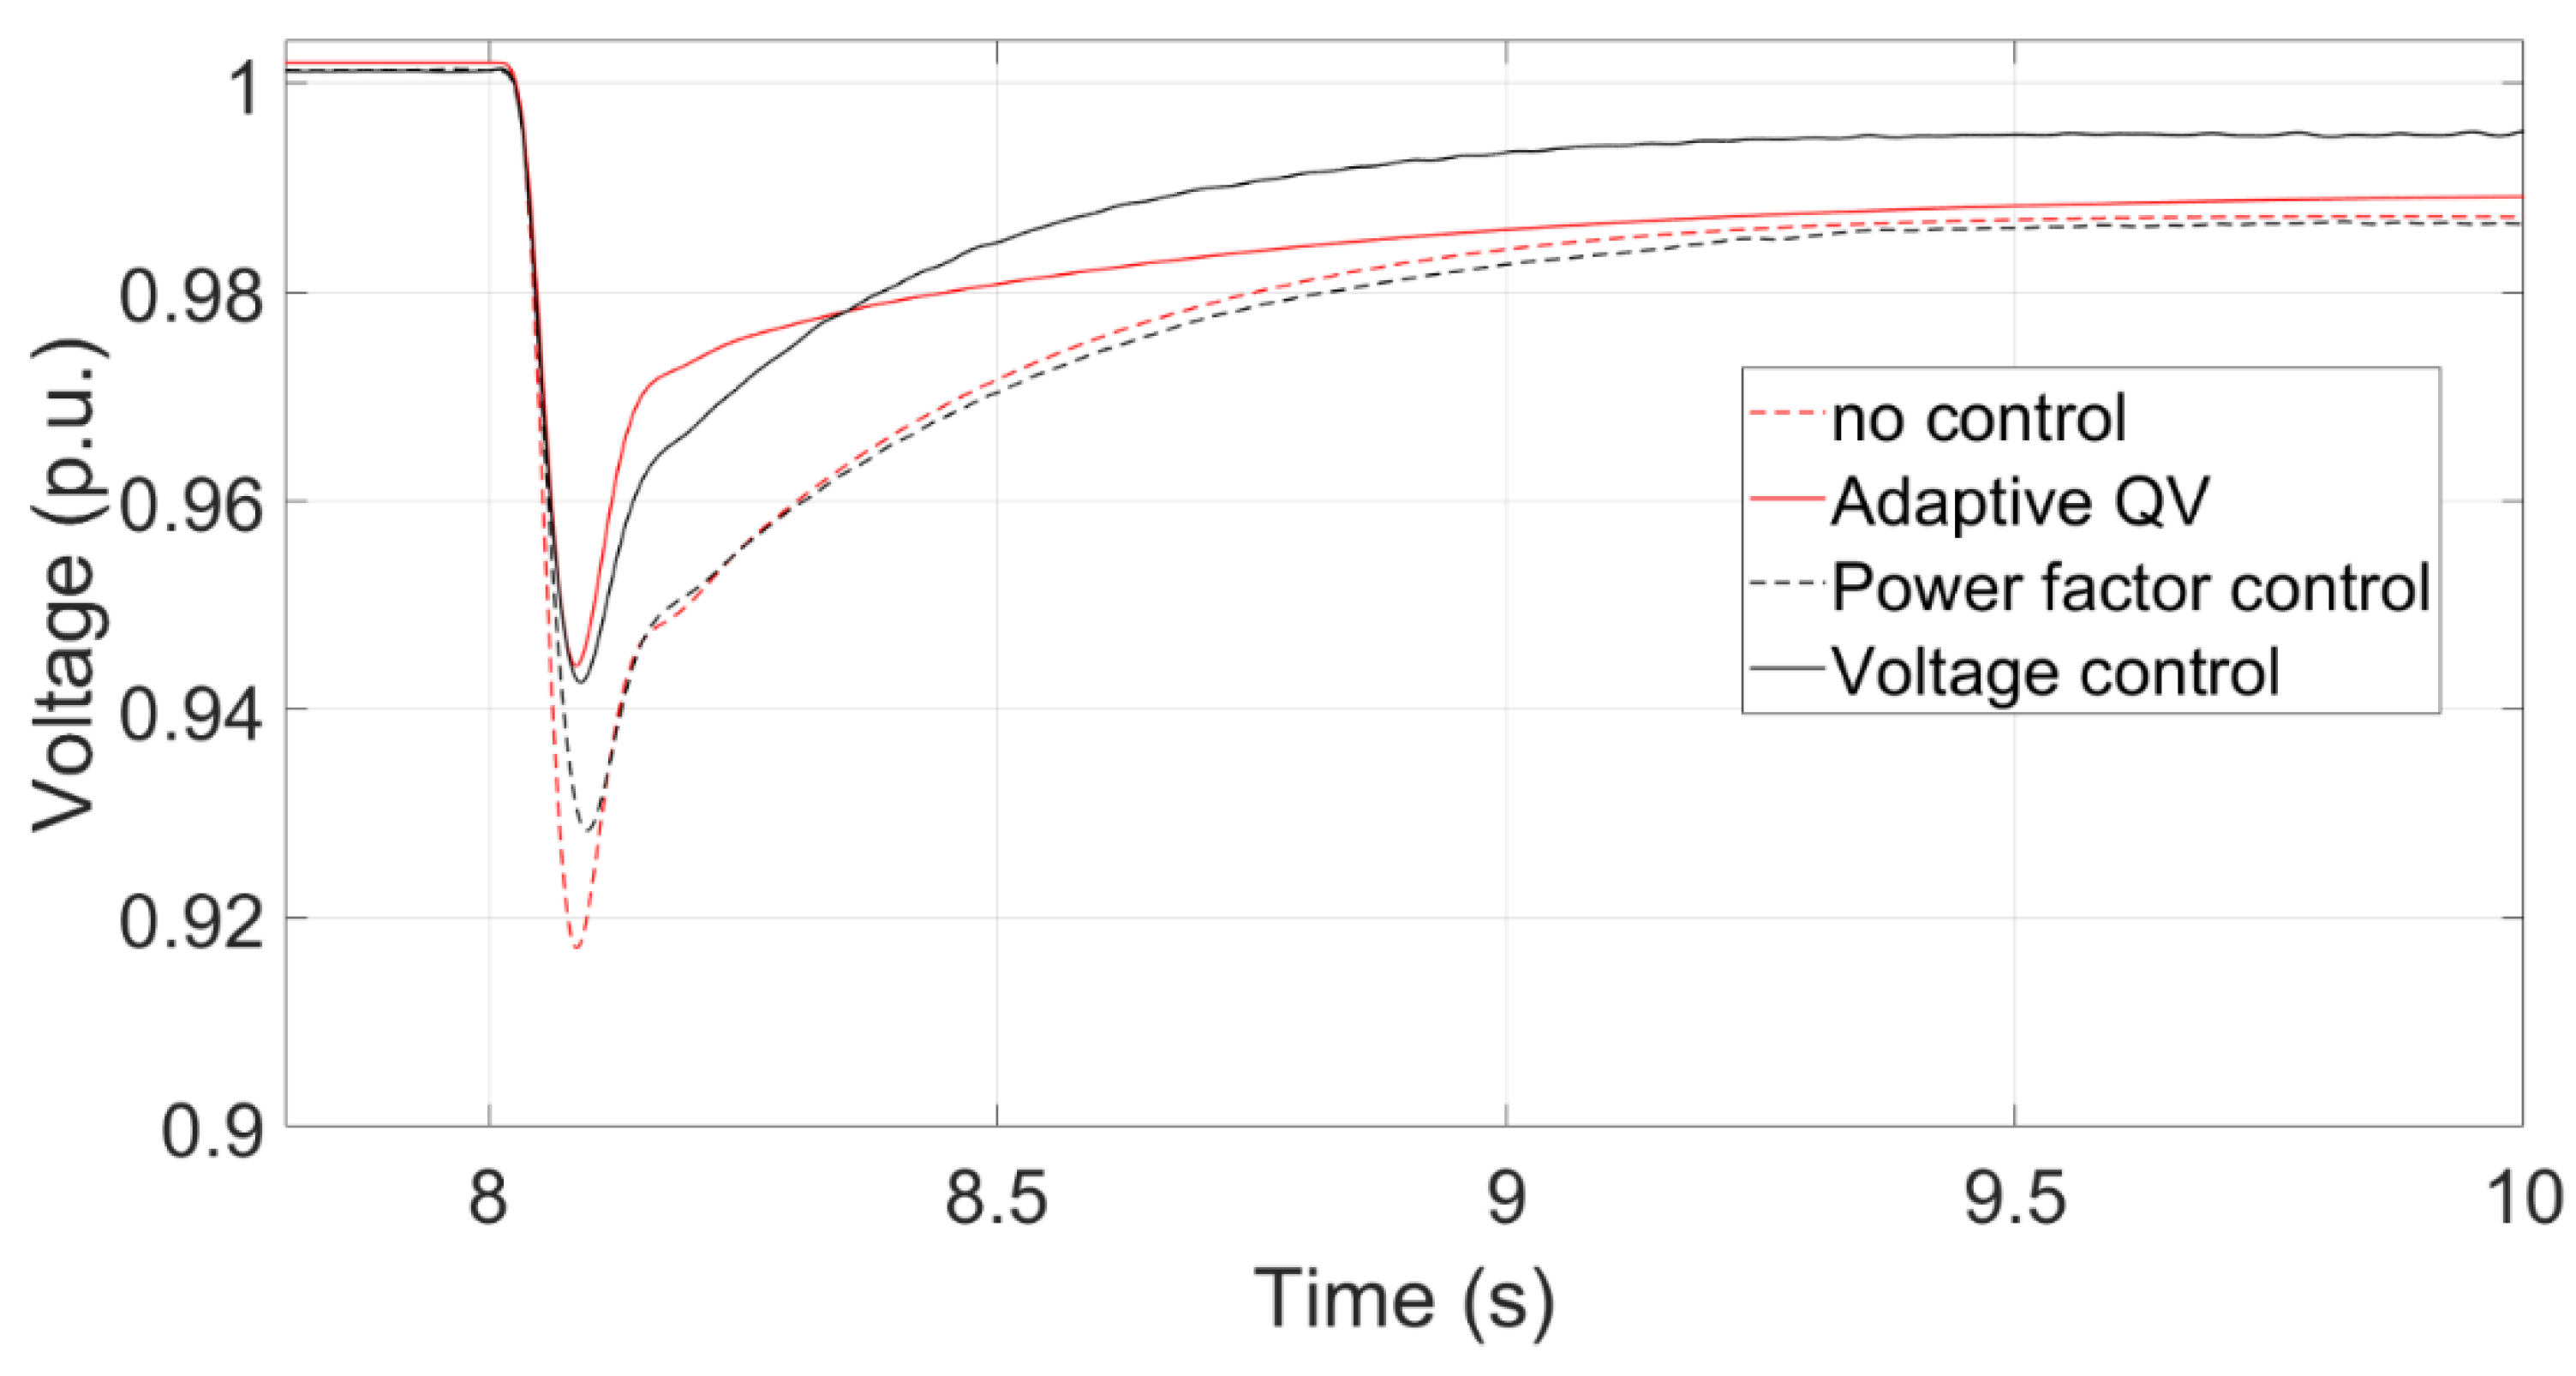
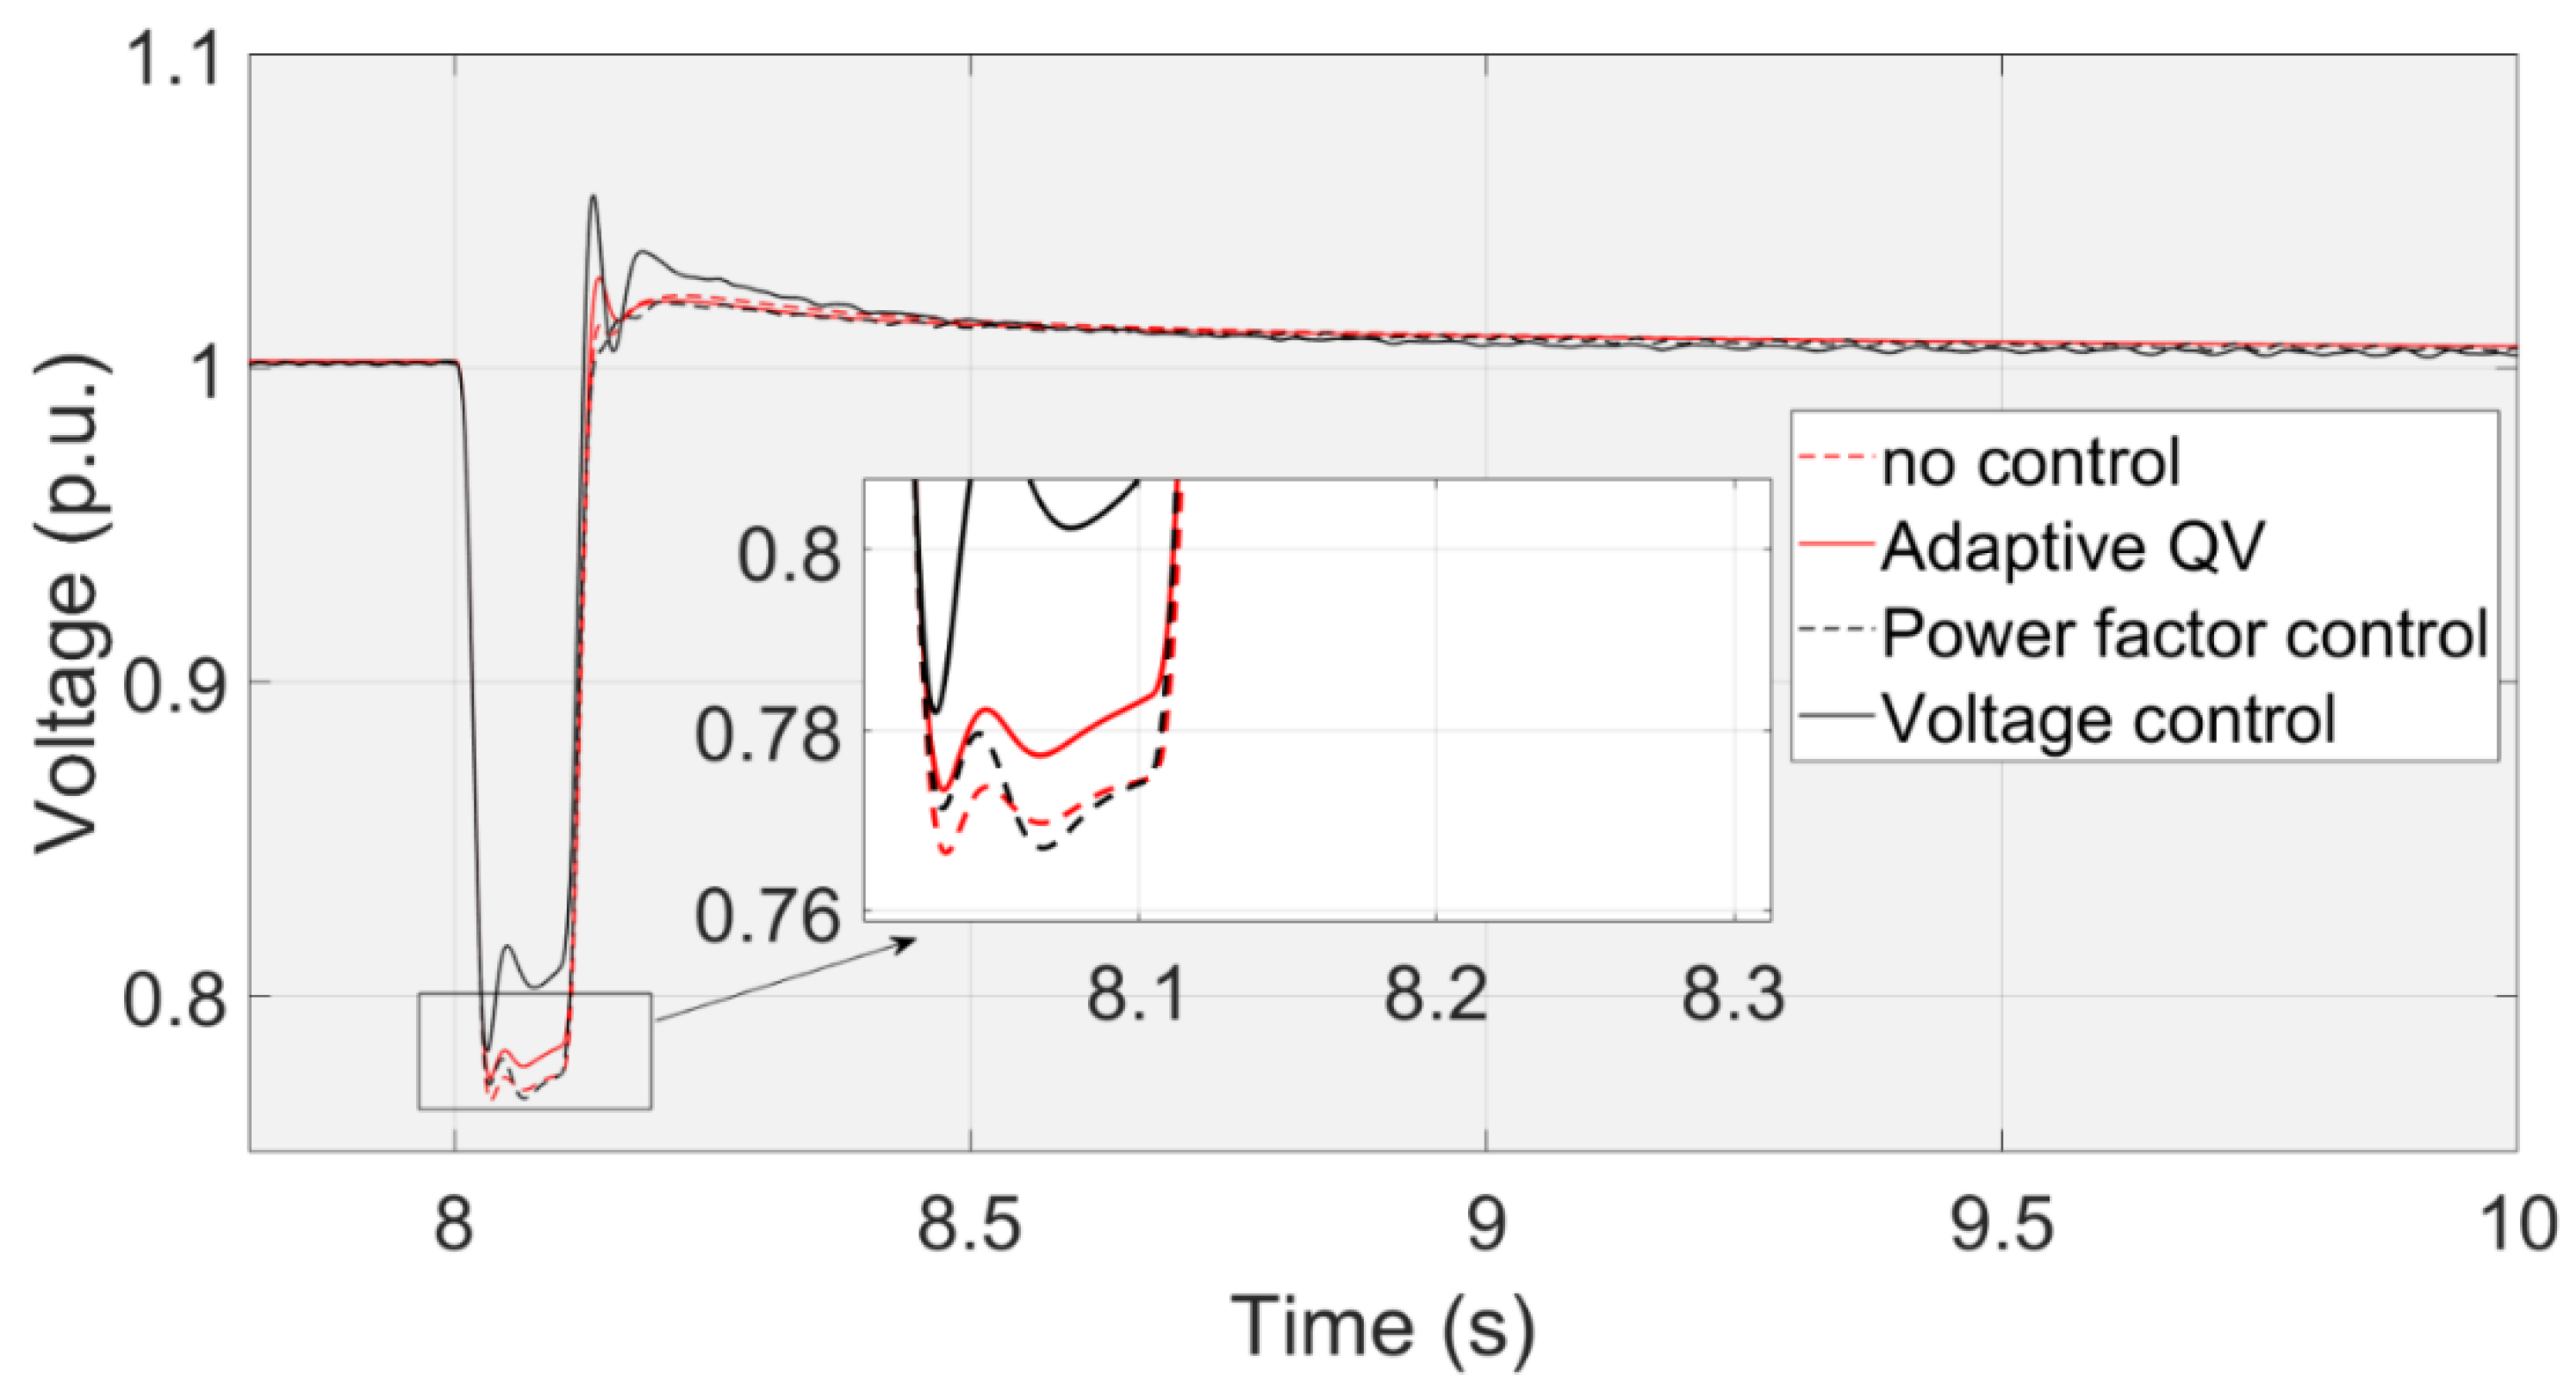
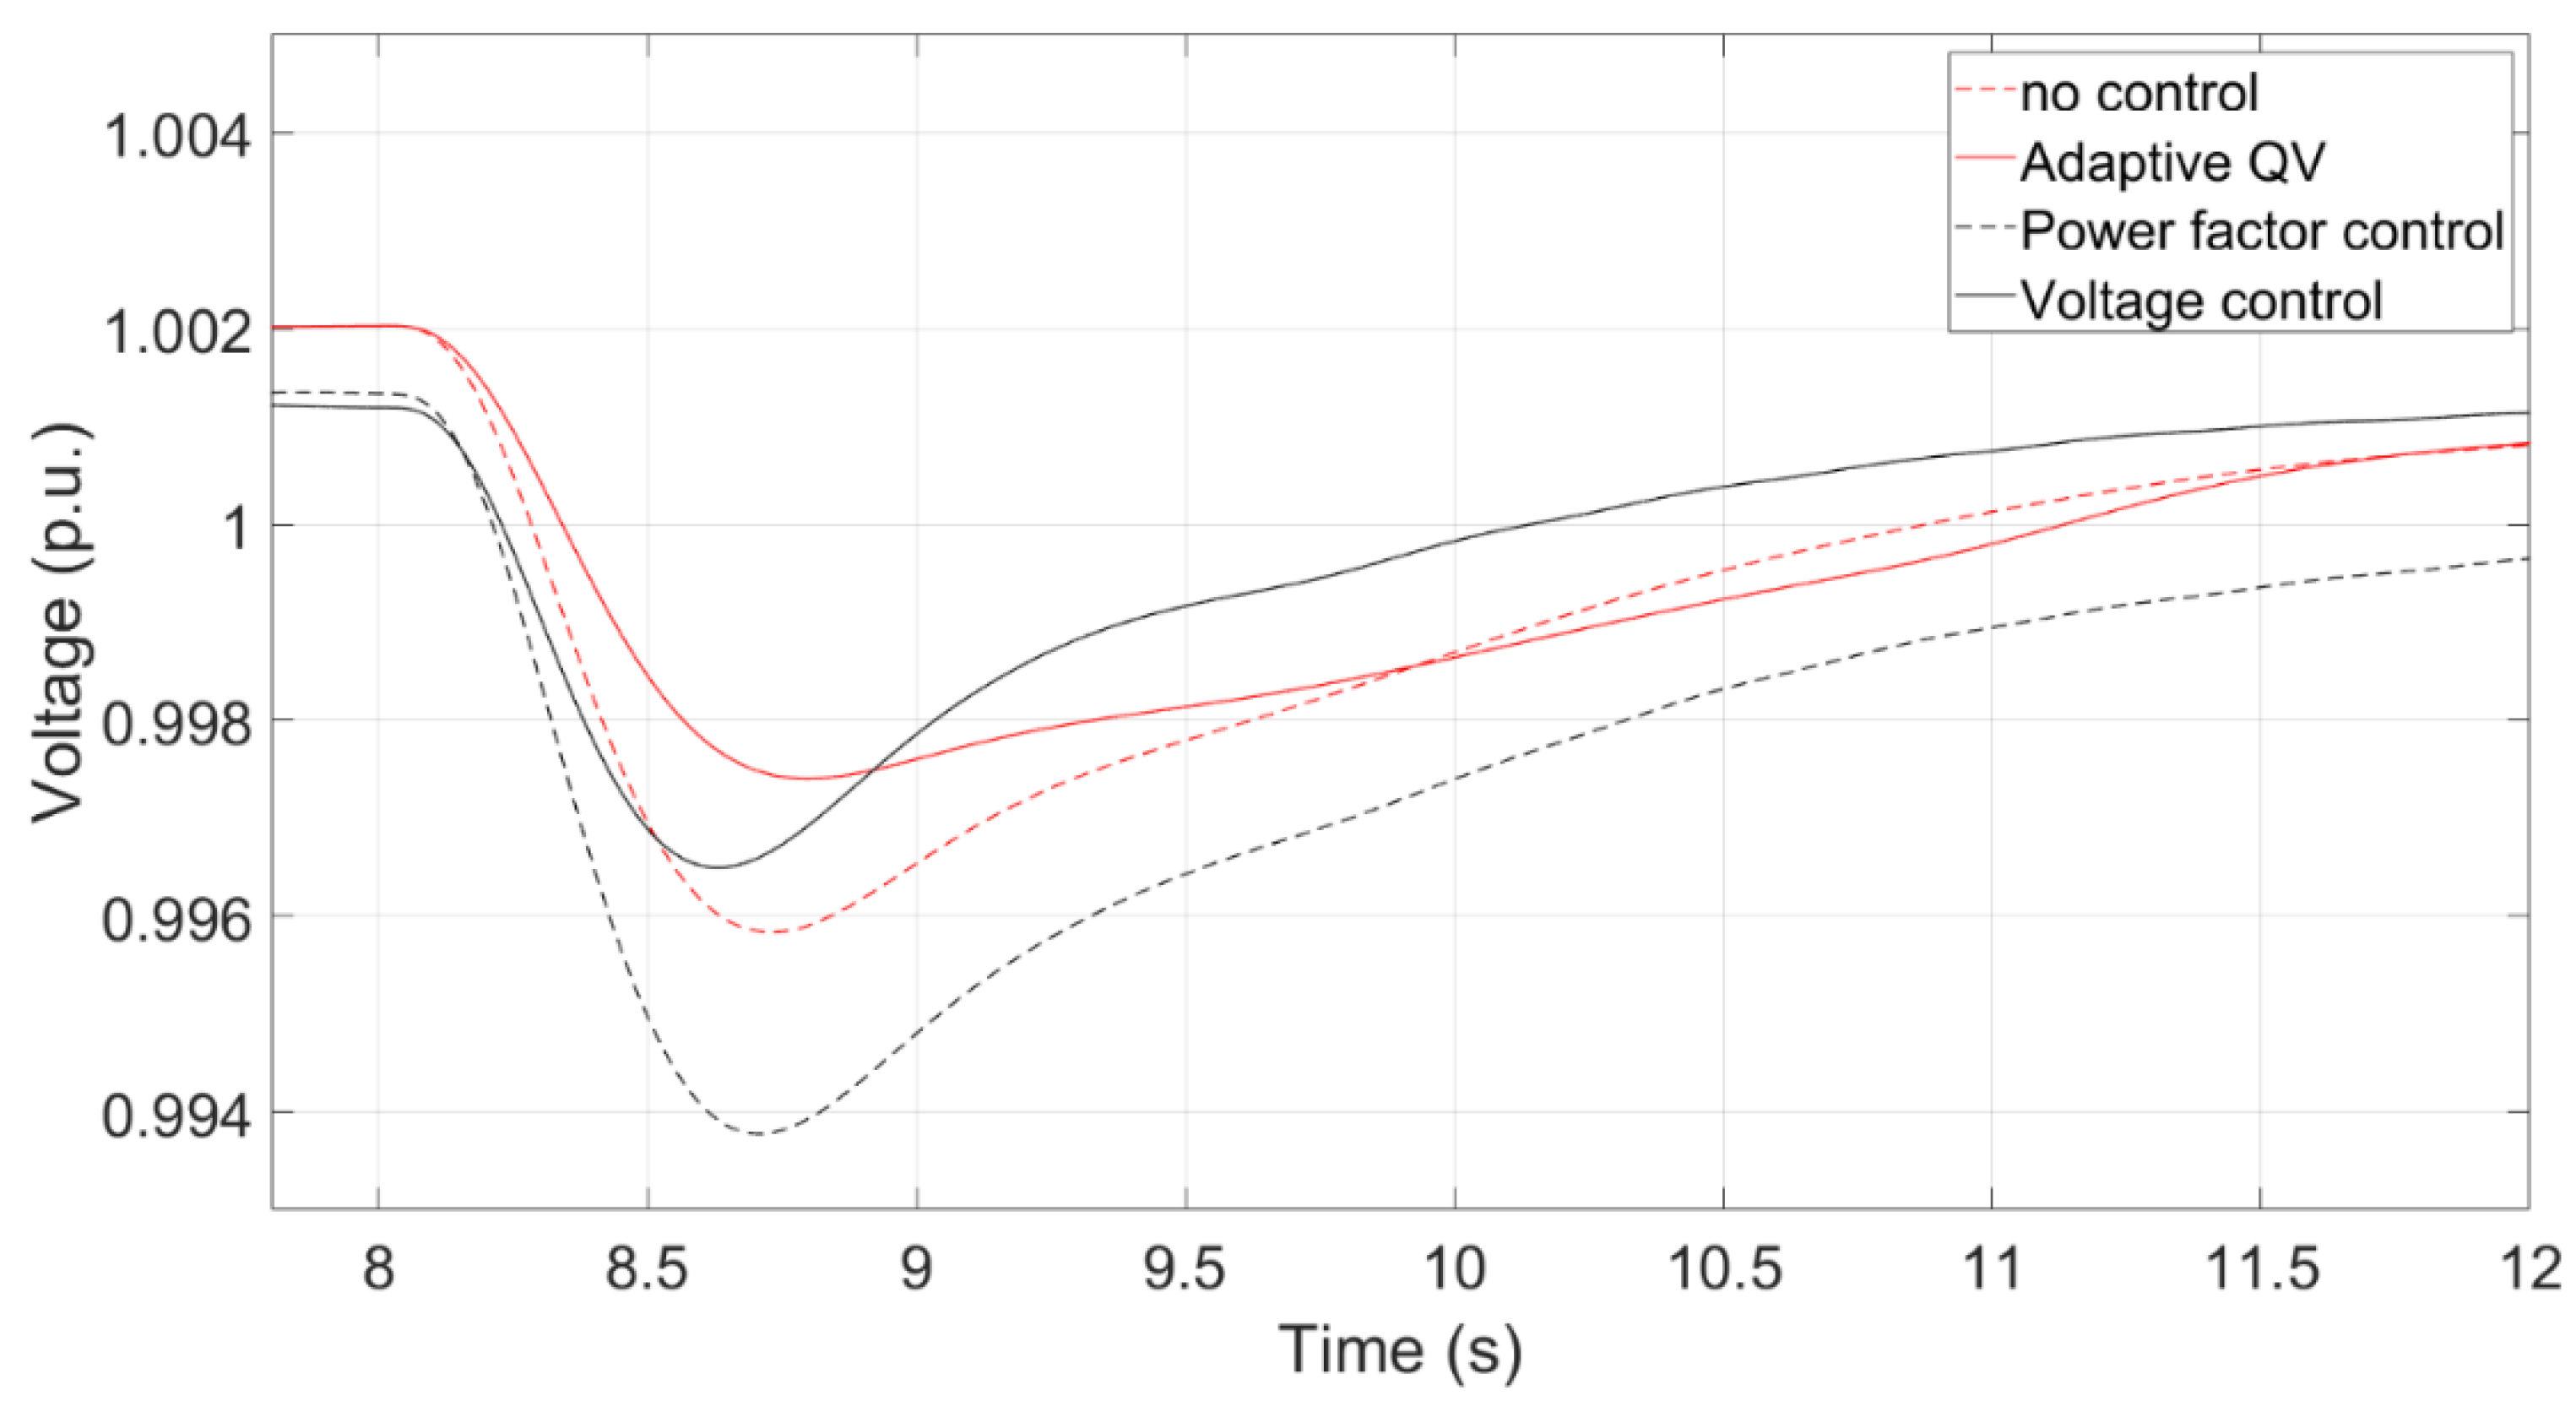
Figure 21 summarizes that the transient voltage curves at PCC using Adaptive QV, Voltage control, Power factor control, and no control. The red line and black line represent the transient voltage based on the AC and HVDC transmission systems, respectively. Notably, there is no any control for the power factor-based method in the HVDC transmission system. The voltage drop is less if any control method is implemented at both AC and HVDC transmission systems because they can provide extra reactive power after the fault. Without a doubt, the voltage nadir with controls is higher than those without any control. The voltage nadir using the adaptive QV is higher than that using the voltage control because of the the parameters of PI controller. The PI parameter can be adjusted to avoid providing much reactive power during a three-phase short circuit fault, which causes overvoltage after a fault.
3.7. Comparison of three-phase short circuit fault at both transmission systems
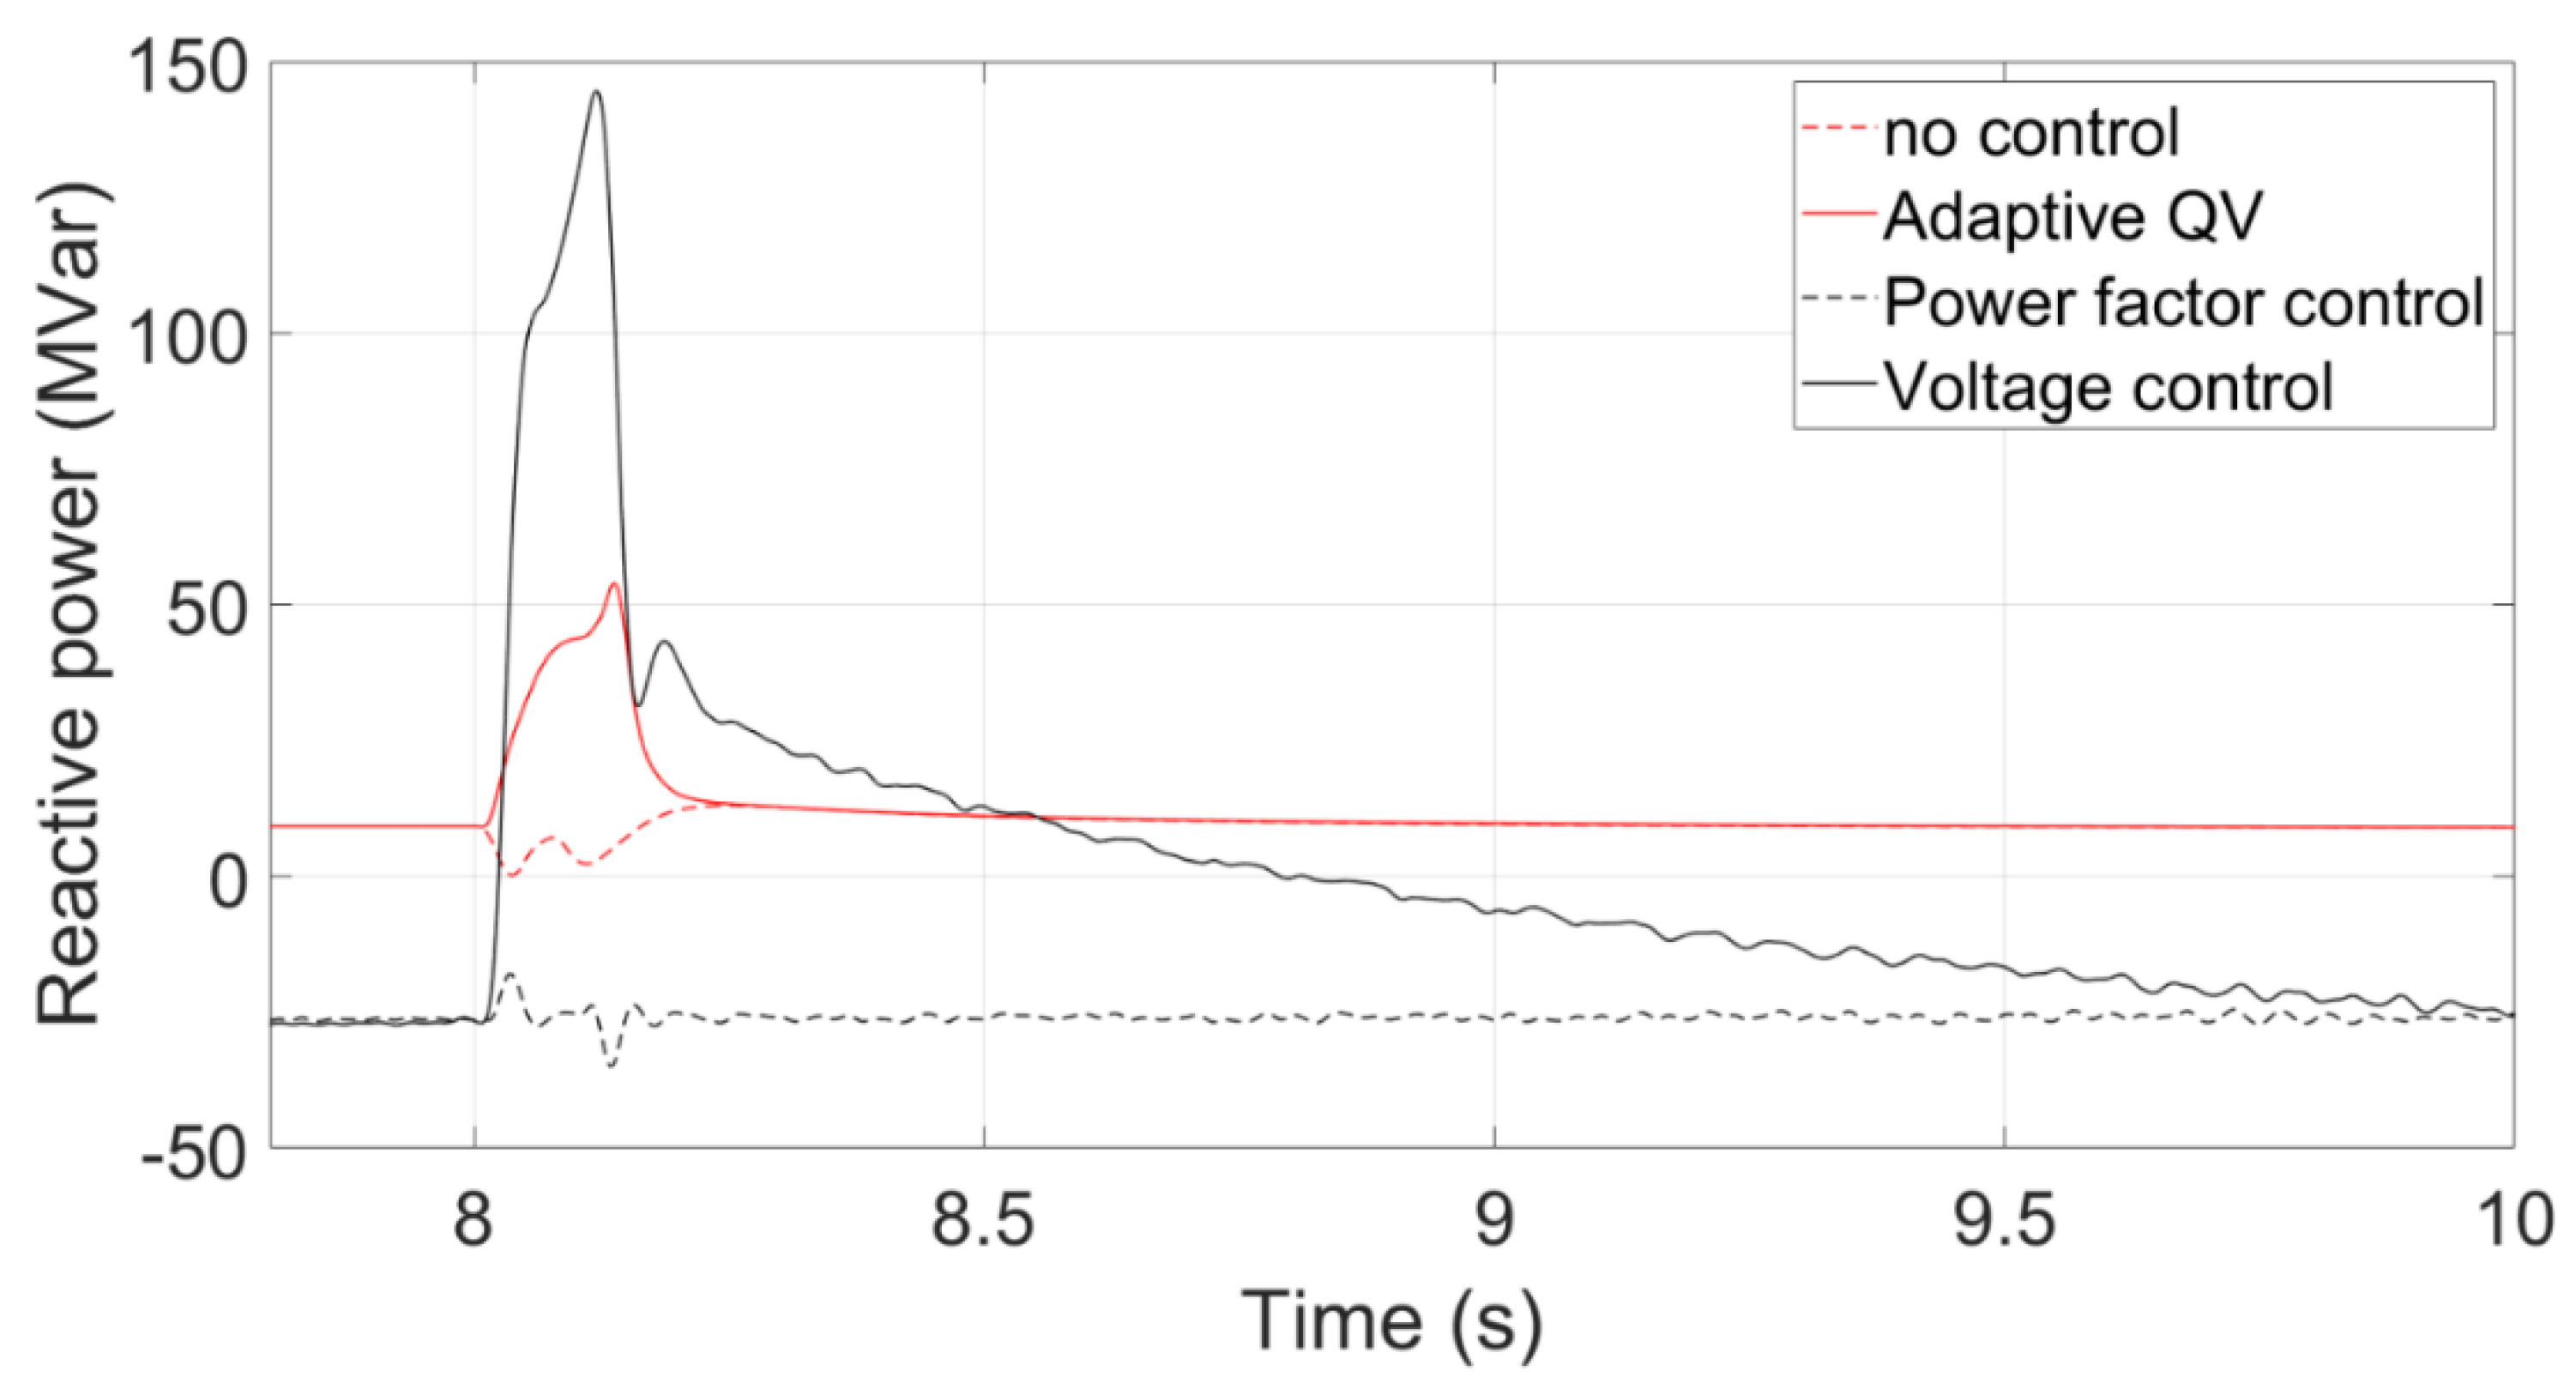
Figure 23 shows the transient voltage curves at the PCC using the Voltage control, Adaptive QV, Power factor control, and no any control. The voltage nadir using the voltage control is higher than that using the adaptive QV control because the reactive power using the voltage control can be increased quickly.
3.8. Comparison of tripping of synchronous generators at both transmission systems
In is assumed that a synchronous generator is tripped at 8s, and
Figure 25 shows the simulation results, which reveals that the influence on voltage is less.
4. Conclusions
With a high penetration of wind power generation in a power system, wind turbines should provide more ancillary services like traditional synchronous generators. Thus, some voltage control methods, such as voltage droop control and QV control, have been proposed recently. Besides, many offshore wind farms will be installed in the world, and high voltage direct current-based transmission systems should be utilized to connect wind farms and the main power grid, especially when the installed capacity or the transmission distance of offshore wind farms is increased. Therefore, this study compared both voltage droop control and QV control for wind turbines, and both voltage control and Vac-Q control for HVDC transmission systems. In addition, equivalent wind farms are also established.
From the simulation results based on the test system, the transient voltage nadir using any control is higher than that without any control, and the QV control can achieve a better result compared to the droop control in both scenarios. Additionally, the voltage nadir using the voltage control with a HVDC transimission system is higher than that with an AC transmission system during a three-phase fault.
Author Contributions
Conceptualization, Wu, Y.-K. and Gau, D.-Y. ; methodology, Wu, Y.-K. and Gau, D.-Y.; validation, Wu, Y.-K.; formal analysis, Gau, D.-Y. and Trinh Duc Tung; investigation, Wu, Y.-K.; resources, Wu, Y.-K.; data curation, Wu, Y.-K.; writing—original draft preparation, Gau, D.-Y. and Trinh Duc Tung; writing—review and editing, Wu, Y.-K.; visualization, Wu, Y.-K.; supervision, Wu, Y.-K.; project administration, Wu, Y.-K.; funding acquisition, Wu, Y.-K.. All authors have read and agreed to the published version of the manuscript.
Funding
This research was funded by the Ministry of Science and Technology (MOST) of Taiwan, grant number MOST 110-2221-E-194 -029 -MY2
Institutional Review Board Statement
Not applicable.
Informed Consent Statement
Not applicable.
Acknowledgments
This work is financially supported by the Ministry of Science and Technology (MOST) of Taiwan under Grant MOST 110-2221-E-194 -029 -MY2
Conflicts of Interest
The authors declare no conflict of interest.
References
- Y.-K. Wu, S.-M. Chang, and P. Mandal, "Grid-connected wind power plants: A survey on the integration requirements in modern grid codes," IEEE Transactions on Industry Applications, vol. 55, no. 6, pp. 5584-5593, 2019. [CrossRef]
- A. Ellis et al., "Review of existing reactive power requirements for variable generation," in 2012 IEEE Power and Energy Society General Meeting, 2012, pp. 1-7: IEEE. [CrossRef]
- J. A. Martin and I. A. Hiskens, "Reactive power limitation due to wind-farm collector networks," in 2015 IEEE Eindhoven PowerTech, 2015, pp. 1-6: IEEE. [CrossRef]
- R. Sharma, "Electrical structure of future off-shore wind power plant with a high voltage direct current power transmission," 2012.
- B. Silva, C. Moreira, L. Seca, Y. Phulpin, and J. P. Lopes, "Provision of inertial and primary frequency control services using offshore multiterminal HVDC networks," IEEE Transactions on sustainable Energy, vol. 3, no. 4, pp. 800-808, 2012. [CrossRef]
- M. Nawir, O. Adeuyi, G. Wu, and J. Liang, "Voltage stability analysis and control of wind farms connected to weak grids," 2017. [CrossRef]
- J. Schmall, S.-H. Huang, Y. Li, J. Billo, J. Conto, and Y. Zhang, "Voltage stability of large-scale wind plants integrated in weak networks: An ERCOT case study," in 2015 IEEE Power & Energy Society General Meeting, 2015, pp. 1-5: IEEE. [CrossRef]
- S.-H. Huang, J. Schmall, J. Conto, J. Adams, Y. Zhang, and C. Carter, "Voltage control challenges on weak grids with high penetration of wind generation: ERCOT experience," in 2012 IEEE Power and Energy Society General Meeting, 2012, pp. 1-7: IEEE. [CrossRef]
- J. Martínez, P. C. Kjær, P. Rodriguez, and R. Teodorescu, "Design and analysis of a slope voltage control for a DFIG wind power plant," IEEE Transactions on Energy Conversion, vol. 27, no. 1, pp. 11-20, 2011. [CrossRef]
- Q. Li, Y. Zhang, T. Ji, X. Lin, and Z. Cai, "Volt/var control for power grids with connections of large-scale wind farms: A review," IEEE Access, vol. 6, pp. 26675-26692, 2018. [CrossRef]
- J. Kim, J.-K. Seok, E. Muljadi, and Y. C. Kang, "Adaptive Q–V scheme for the voltage control of a DFIG-based wind power plant," IEEE Transactions on Power Electronics, vol. 31, no. 5, pp. 3586-3599, 2015. [CrossRef]
- Y. Li, Z. Xu, J. Zhang, and K. Meng, "Variable droop voltage control for wind farm," IEEE Transactions on Sustainable Energy, vol. 9, no. 1, pp. 491-493, 2017. [CrossRef]
- B. Liu, X. Zhang, D. Kong, X. Liu, and X. Chang, "Research on Reactive Power and Voltage Coordination Control Strategy for Multi-wind Farm Connecting to Power Grid," in 2019 IEEE Innovative Smart Grid Technologies-Asia (ISGT Asia), 2019, pp. 1633-1637: IEEE. [CrossRef]
- C. Han et al., "STATCOM impact study on the integration of a large wind farm into a weak loop power system," IEEE Transactions on Energy conversion, vol. 23, no. 1, pp. 226-233, 2008. [CrossRef]
- Z. Mi, H. Tian, Y. Yu, X. Su, X. Fan, and J. Feng, "Study on voltage stability of power grid with large scale wind farm interconnected," in 2009 International Conference on Sustainable Power Generation and Supply, 2009, pp. 1-6: IEEE. [CrossRef]
- R. Ding, C. Meng, and Y. Qiao, "The coordinating control of voltage and reactive power between SVC and DFIG after LVRT," in 2015 IEEE Eindhoven PowerTech, 2015, pp. 1-5: IEEE. [CrossRef]
- H. F. Latorre and M. Ghandhari, "Improvement of voltage stability by using VSC-HVdc," in 2009 Transmission & Distribution Conference & Exposition: Asia and Pacific, 2009, pp. 1-4: IEEE. [CrossRef]
- I. Hussein, S. Essallah, and A. Khedher, "Improvement of the Iraqi Super Grid Performance Using HVDC/HVAC Links by the Integration of Large-Scale Renewable Energy Sources," Energies, vol. 15, no. 3, p. 1142, 2022. [CrossRef]
- H. Liu and Z. Chen, "Impacts of large-scale offshore wind farm integration on power systems through VSC-HVDC," in 2013 IEEE Grenoble Conference, 2013, pp. 1-5: IEEE. [CrossRef]
- Xu, B. Liu, R. E. Torres-Olguin, and T. Undeland, "Grid integration of large offshore wind energy and oil & gas installations using LCC HVDC transmission system," in SPEEDAM 2010, 2010, pp. 784-791: IEEE. [CrossRef]
- O. Bernat and R. Preece, "Impact of VSC-HVDC reactive power control schemes on voltage stability," in 2019 IEEE Milan PowerTech, 2019, pp. 1-6: IEEE. [CrossRef]
- F. M. Arani and Y. A.-R. I. Mohamed, "Analysis and performance enhancement of vector-controlled VSC in HVDC links connected to very weak grids," IEEE Transactions on Power Systems, vol. 32, no. 1, pp. 684-693, 2016. [CrossRef]
- A. Egea-Alvarez, S. Fekriasl, F. Hassan, and O. Gomis-Bellmunt, "Advanced vector control for voltage source converters connected to weak grids," IEEE Transactions on Power Systems, vol. 30, no. 6, pp. 3072-3081, 2015. [CrossRef]
- Zhao, X. Yuan, J. Hu, and Y. Yan, "Voltage dynamics of current control time-scale in a VSC-connected weak grid," IEEE Transactions on Power systems, vol. 31, no. 4, pp. 2925-2937, 2015. [CrossRef]
- Y. Guo, H. Gao, Q. Wu, H. Zhao, and J. Østergaard, "Coordinated voltage control scheme for VSC-HVDC connected wind power plants," IET Renewable Power Generation, vol. 12, no. 2, pp. 198-206, 2018. [CrossRef]
- Y. Guo, H. Gao, Q. Wu, H. Zhao, J. Østergaard, and M. Shahidehpour, "Enhanced voltage control of VSC-HVDC-connected offshore wind farms based on model predictive control," IEEE Transactions on Sustainable Energy, vol. 9, no. 1, pp. 474-487, 2017. [CrossRef]
- J. N. Sakamuri, Z. H. Rather, J. Rimez, M. Altin, Ö. Göksu, and N. A. Cutululis, "Coordinated voltage control in offshore HVDC connected cluster of wind power plants," IEEE Transactions on Sustainable Energy, vol. 7, no. 4, pp. 1592-1601, 2016. [CrossRef]
- P. J. P. u. S. N. N.-.-.-w. N. Pourbeik, Issued to WECC REMTF and I. T. WG27, "Proposed changes to the WECC WT3 generic model for type 3 wind turbine generators," vol. 12, no. 16, p. 11, 2013.
- A. Ellis, Y. Kazachkov, E. Muljadi, P. Pourbeik, and J. Sanchez-Gasca, "Description and technical specifications for generic WTG models—A status report," in 2011 IEEE/PES Power Systems Conference and Exposition, 2011, pp. 1-8: IEEE. [CrossRef]
- G.-L. Lu, C.-H. Lin, and Y.-K. Wu, "Comparison of Communication-Based and Coordination-Based Frequency Control Schemes for HVdc-Connected Offshore Wind Farms," IEEE Transactions on Industry Applications, vol. 57, no. 4, pp. 3352-3365, 2021. [CrossRef]
- C.-H. Lin and Y.-K. Wu, "Overview of Frequency-Control Technologies for a VSC-HVDC-Integrated Wind Farm," IEEE Access, 2021. [CrossRef]
Figure 1.
The block diagram of the generic model of wind turbibe.
Figure 1.
The block diagram of the generic model of wind turbibe.
Figure 2.
The PQ diagram of a DFIG-based wind turbine.
Figure 2.
The PQ diagram of a DFIG-based wind turbine.
Figure 3.
The block diagram to obtain the kq_i.
Figure 3.
The block diagram to obtain the kq_i.
Figure 4.
The control block of the adaptive QV control.
Figure 4.
The control block of the adaptive QV control.
Figure 5.
The control block of the voltage droop control.
Figure 5.
The control block of the voltage droop control.
Figure 6.
The control strategy of VSC-HVDC connected OWF
Figure 6.
The control strategy of VSC-HVDC connected OWF
Figure 7.
Power factor control.
Figure 7.
Power factor control.
Figure 8.
Presentation of power factor.
Figure 8.
Presentation of power factor.
Figure 9.
control
Figure 9.
control
Figure 10.
Voltage control
Figure 10.
Voltage control
Figure 11.
AC Test system.
Figure 11.
AC Test system.
Figure 12.
HVDC Test system.
Figure 12.
HVDC Test system.
Figure 13.
Transient voltage curve with an AC transmission system.
Figure 13.
Transient voltage curve with an AC transmission system.
Figure 14.
Transient Reactive power with a AC transmission system.
Figure 14.
Transient Reactive power with a AC transmission system.
Figure 15.
Transient voltage curve with a VSC-HVDC transmission system.
Figure 15.
Transient voltage curve with a VSC-HVDC transmission system.
Figure 16.
Transient reactive power with a VSC-HVDC transmission system.
Figure 16.
Transient reactive power with a VSC-HVDC transmission system.
Figure 17.
The transient voltage at the PCC.
Figure 17.
The transient voltage at the PCC.
Figure 18.
The transient reactive power from the wind farm.
Figure 18.
The transient reactive power from the wind farm.
Figure 19.
The transient voltage at the PCC.
Figure 19.
The transient voltage at the PCC.
Figure 20.
The transient reactive power from the wind farm.
Figure 20.
The transient reactive power from the wind farm.
Figure 21.
Comparsion of transient voltage curves.
Figure 21.
Comparsion of transient voltage curves.
Figure 22.
Comparsion of reactive power curves.
Figure 22.
Comparsion of reactive power curves.
Figure 23.
Comparsion of transient voltage curves.
Figure 23.
Comparsion of transient voltage curves.
Figure 24.
Comparsion of reactive power curves.
Figure 24.
Comparsion of reactive power curves.
Figure 25.
Transient voltage in section 3.8.
Figure 25.
Transient voltage in section 3.8.
Table 1.
The PQ chart of a DFIG.
Table 1.
The PQ chart of a DFIG.
| Point |
P(%) |
Q (%) |
| 0 |
0 |
10 |
| 1 |
10 |
60 |
| 2 |
70 |
60 |
| 3 |
100 |
20 |
| 4 |
100 |
-30 |
| 5 |
85 |
-60 |
| 6 |
10 |
-60 |
| 7 |
0 |
-15 |
Table 2.
Wind speed of equivalent WFs.
Table 2.
Wind speed of equivalent WFs.
| Numer of Wind farm |
Wind speed(m/s) |
| 1 |
11.6 |
| 2 |
11.4 |
| 3 |
10.6 |
| 4 |
10 |
| 5 |
9 |
Table 3.
Parameters of cable.
Table 3.
Parameters of cable.
| |
Before equivalent |
After equivalent |
| R (Ohms) |
0.045 |
0.084375 |
| L (mH) |
0.371362 |
0.696303 |
| C (uF) |
0.24 |
0.96 |
| Rate voltage(kv) |
66 |
66 |
|
Disclaimer/Publisher’s Note: The statements, opinions and data contained in all publications are solely those of the individual author(s) and contributor(s) and not of MDPI and/or the editor(s). MDPI and/or the editor(s) disclaim responsibility for any injury to people or property resulting from any ideas, methods, instructions or products referred to in the content. |
© 2023 by the authors. Licensee MDPI, Basel, Switzerland. This article is an open access article distributed under the terms and conditions of the Creative Commons Attribution (CC BY) license (http://creativecommons.org/licenses/by/4.0/).
