
Submitted:
19 April 2023
Posted:
19 April 2023
You are already at the latest version
Abstract
Accurate estimation of vehicle emissions is essential and can be helpful in the decision-making process. Thanks to calculation methods, it is possible to accurately estimate the emissions that result from driving a car and to determine their impact on, for example, the health of pedestrians who are on the pavement near an arterial road. Recent years have seen an increase in the use and importance of emission models, as well as vehicle traffic simulation models. Increasingly, emission models are being combined with traffic simulation models, as it is not practical to actually measure the on-road emissions of an entire fleet of vehicles over a given stretch of road. This paper provides an overview of the selected work on the topic of emission modelling and vehicle traffic simulation models. The models are distinguished according to their respective scales of accuracy, i.e., micro, meso, and macro. Selected work combining emission and traffic simulation models is also presented, as well as development trends in the field. In particular, the paper also highlights the fact of proper calibration of vehicle traffic simulation models in order to obtain the most reliable vehicle emissions results from computational models. The review of the works carried out may be helpful for future projects concerning the use of simulation tools for transport and environmental decision-makers in the area of arterial roads.
Keywords:
vehicles
; emission modelling
; traffic simulation
; air pollution
; emission compounds
1. Introduction
Air pollution is a major component of the risk to human health and the state of the environment [1]. Outdoor pollution is responsible for approximately 1.2 million annual deaths [2]. Road transport, which is widely considered the only major source of pollution in urban areas, contributes to this [3]. Therefore, great effort is being made to reduce the exhaust emissions from transport. As a result, many new vehicle designs and new fuel components are being implemented, as well as strengthening traffic management in cities to maximize traffic flow [4,5]. Vehicle emissions have become a key issue for the global community in recent years. The number of vehicles on the road is constantly increasing, compounding the problem and making road transport a major contributor to pollution [6,7]. The main components of vehicle exhaust include carbon monoxide (CO), nitrogen oxides (NOx), total hydrocarbons (THC), particulate matter (PM), and greenhouse gases such as carbon dioxide (CO2) [8,9,10].
Vehicle exhaust emissions depend on many factors. Estimating emissions is challenging and depends, among other things, on the scale at which vehicle emissions are measured. [11,12]. Exhaust emissions in terms of modelling depend, among other things, on the vehicle category but also on the traffic flow of a certain group of vehicles. These emissions depend on a number of factors, e.g., the specification of the fuel used, the emission control technology, the environmental and operational conditions of the vehicle (driving style, contribution of cold-start emissions, etc.). [13,14]. Vehicle emission models are used to accurately estimate emissions from road transport. It is important to understand the connection between vehicle emissions and the environment in order to develop, among other things, strategies that can minimize the impact of exhaust emissions on the environment. For this purpose, vehicle emission model and vehicle traffic simulation models are used.
Vehicle emission models estimate the amount of exhaust emissions based on various input data. These data are differentiated according to the scale of the model used [15,16]. Examples of input data can be detailed vehicle data, for example, engine specifications, driving conditions, and fuel properties [17,18]. Traffic simulations can be a certain complement to emission models. Traffic simulation allows for a virtual representation of real-world traffic scenarios, allowing for the analysis of vehicle interactions and their impact on the, immediate environment and the health of pedestrians travelling on arterial roads [19,20,21]. To generate a certain set of vehicle traffic data, simulators allow valuable information to be provided on the magnitude of vehicle emissions versus, for example, air quality to inform decision makers in controlling air pollution [22,23].
Models to estimate vehicle emissions are becoming increasingly sophisticated and extensive [24]. This is undoubtedly related to the increasing number of vehicles and the diversity of pollutants, modifications, and fuel types used [25]. For emission models, it is as important to distinguish between models for different engine thermal states, e.g., cold start, hot running, etc. The first emission models, which were developed in the 1980s and 1990s, allowed the prediction of emissions from the warmed-up state of a vehicle's engine for only a few major emission components based on certified test data. Modern emission models allow the estimation of all known exhaust compounds, regulated and unregulated, also estimate fuel consumption, and are based on data from actual road tests under different driving conditions [26]. The first emission models were based solely on data from a dozen vehicles, while the current emission models use data from thousands of different vehicles [27]. Over the years, the approach has also changed from the classic modelling for driving mode (acceleration, deceleration, idle, cruise) to also include other variables, such as data from vehicle engines: engine load, speed, engine temperature, air-to-fuel ratio, etc [28,29].
This paper is a literature synthesis of the current state-of-the-art in the field of exhaust emission models and traffic simulation. The topics described could be helpful to those involved in modelling vehicle traffic and modelling environmental aspects more widely. This work is divided into 3 main parts. The first presents the characteristics of the described topic based on a Web of Science core collection search. This is followed by a description of vehicles, the main components of exhaust gases, a description of selected emission models and traffic simulators, examples of their use, and trends, and further developments in the field. The work also considers the problem of calibrating vehicle traffic summation models for a more accurate estimation of vehicle emissions.
The scope of the work also includes a comparison of exhaust emission models with selected parameters. Such an overview of the work could be helpful for those seeking information on the complexity and usefulness of emission models and their potential use for traffic simulation purposes. The numerous examples and comparisons could also be useful to decision makers in traffic management. Based on the review, recommendations on the usefulness of the selected models were also developed in terms of their potential use for traffic simulation and environmental analysis of the impact of road transport on exhaust emissions for use by transport decision-makers.
2. Methodology and characteristics of the literature review
The general structure of the paper is shown in Figure 1. The literature review was based on prior identification of the main keywords of the topic under analysis. This analysis was based on the The Web of Science Core Collection search engine. Web of Science Core Collection is a database of scholarly literature that provides access to some of the world's most influential scientific, technical, and medical research. It is widely considered one of the most comprehensive and authoritative sources of research information and it is widely used by researchers [30,31].
The general research methodology for the literature analysis of the topic described was based on a preliminary identification of the main tools that are used in the context of emissions modelling and traffic modelling. Subsequently, the paper describes selected emission models and traffic models, provides examples of the use of these tools, and identifies directions for further work.
The detailed description of the literature review methodology carried out on the topic described first dealt with identification. This identification consisted of the following:
- Analysis of vehicle exhaust components and modelling methods resulting from the method of data collection: chassis dynamometer data, road data using the PEMS system,
- Analysis of selected micro, meso and macro-scale exhaust emission models, their characteristics, and presentation of their main features;
- Analysis of selected micro, meso and macro traffic simulation models and their description.
The second step of the literature analysis consisted of providing examples for:
- Combining the use of emission models and traffic simulation models with their brief characteristics,
- Calibration of the simulation model and emission models as the main determinant of the results obtained.
In a third step, the paper describes recommendations for the applicability of the described emission models in combination with traffic simulation models. Future trends in the development of future simulation models are also described.
The following keywords were used to identify the main keywords linked to the topic in the Web of Science Core collection search: emission model and traffic simulation, and vehicle - 1250 results were retrieved (information obtained for 12 April 2023). No time frame was specified for the search. Figure 2 presents a keyword map based on the data recovered from the database and the VOSviewer software. From the keyword map, we can see which keywords occur most frequently for the topic described, for example. Based on this, we can see, e.g., keywords such as vt-micro, car following model, vissim, copert, sumo, etc. This makes it possible to pre-classify the most common emission models and simulators used in research. For such analyses, we can additionally search for new papers with the addition of a new key word related to, for example, the emission model. This way, it is additionally possible to determine the exact number of papers that use, among other things, the analysed tool. For example, with the additional keyword copert, we can find at least 155 work results. On this basis, a set of emission models and traffic simulation software’s were selected, which are described in the following section.
Based on data from the Web of Science Core collection, a world map was also generated showing the frequency of papers in the searched article database (Figure 3).
Figure 4 shows the number of records for the entries for the topics studied. From it we can see an upward trend for published works. The first records analysed date from 1997, while the most recent are from 2023.
The content presented in the paper in the field of emission and traffic simulation models can be useful and conditions in particular:
- The work presents an up-to-date overview of emission models indicating their calculation capabilities for a selected range of model inputs and outputs, which will speed up the process of selecting a suitable tool for those involved in modelling,
- The overview of the selected vehicle traffic simulation models presented can be useful for selecting a suitable tool with mapping vehicle traffic for different scales of accuracy,
- The link between the topic of emission models and the topic of traffic simulation models gives some insight into the capabilities of the software for different accuracy scales, which can also speed up the selection and correct use of a given tool for emission estimation and traffic simulation,
- The work presents the essence of calibration of emission and traffic simulation models in order to obtain results close to real values, which gives information for people modelling vehicle traffic and emissions, which parameters for which the models need to be calibrated and checked against real values, e.g., traffic volume or speed profile,
- From the whole work, the most important recommendations for emissions and traffic modelling have been selected,
- The work shows future trends in the modification of existing emission and traffic models as well as the development of completely new models.
3. Emission from vehicles –literature review
3.1. Main components of vehicle exhaust
Conventional internal combustion engines, as well as hybrid systems, are the main sources of exhaust pollutants in urban areas [32,33]. These emissions result from the combustion of both gaseous and liquid fuels. The main groups of exhaust emission components considering their formation and source include [34,35,36]:
- high-temperature combustion products such as nitrogen oxide (NOx),
- products of incomplete combustion, including particulate matter (PM), carbon monoxide (CO), and hydrocarbons (THC),
- combustion products from waste fuels, including heavy metals and sulphur oxides (SOx),
- products from other sources, e.g., volatile organic compounds (VOC),
- products of total combustion that generate the greenhouse effect (CO2).
PM can be classified into three types of categories: PM1, these are particles not exceeding 1 μm in diameter; PM2.5, particles not exceeding 2.5 μm in diameter; and PM10, particles not exceeding 10 μm in diameter (containing carbon particles) [37]. Motor vehicles are an important source of PM1 and PM2.5 emissions. For different engines, the particle emissions are different. Diesel engines emit mainly 20-130 μm, while petrol engines emit 20-60 μm [38,39].
In addition to emissions resulting from combustion processes, particulate matter is also produced as a result of the wear and friction of materials, mainly brake friction linings and vehicle tyres [40,41].
The harmful components of the exhaust gases contained in vehicle exhaust negatively affect human health and the state of the surrounding environment [42,43,44,45]:
- Carbon monoxide - The poisonous effect is due to the reaction of its combined with haemoglobin and metalloproteins; internal organs such as the heart, central nervous system is damaged; at low concentrations of gas, loss of consciousness occurs; CO shares in the inhaled air already at the level of 0.02% have a negative effect on human health, and life-threatening concentrations of 0.1% cause,
- Short-term exposure of nitrogen oxides to high concentrations leads to lung edema and death, lower concentrations cause the so-called silo disease; in addition to negative direct effects on human health, nitrogen oxides are the main cause of photochemical smog (Los Angeles-type smog), which appears over cities during hot, sunny weather.
- Carbon dioxide - one of the greenhouse gases,
- Hydrocarbons - one of the components of smog; they irritate the conjunctiva, cause allergies, and have strong carcinogenic effects,
- Particulate matter - breathing air polluted with PM2.5 can lead to atherosclerosis, complications of pregnancy, and respiratory diseases; PM10 can contain toxic substances such as polycyclic aromatic hydrocarbons (e.g. benzo/a/pyrene), dioxins and furans, which are carcinogenic; the limit level for the average concentration is 50 µg/m3 and must not exceed more than 35 days per year; particulate matter is part of London smog, which occurs mainly occurs in the months of November to February during temperature inversions.
In view of the increasing emission of exhaust pollutants, coordinated action is being taken in the European Union to reduce the harmful effects of vehicle exhaust. One of the key decisions to reduce exhaust emissions was the introduction of EURO standards [46]. Currently, the regulations cover NOx, THC, CO, and PM emissions [47]. The New European Driving Cycle (NEDC) test, which was carried out under controlled laboratory conditions to ensure the reproducibility and comparability of the results obtained, was used to determine motor vehicle emissions until September 2017 [48,49]. However, it was found that the NEDC test often did not reflect the conditions actually experienced when driving on public roads [50,51]. To improve the emissions and fuel consumption that occur when driving under road conditions, a new WLTP (World Harmonised Light Duty Procedure) driving test procedure was created [52]. With the new procedure, in addition to the determination of emissions during controlled driving tests with a chassis dynamometer, real driving emission (RDE) road tests are also carried out using mobile emission measurement systems - PEMS (Portable Emissions Measurement System) [53,54,55].
Based on the described dynamometer tests, initially using data from measurement bags in which car exhaust was collected, the first calculation models for exhaust emissions were developed [56]. As the first aggregations of emissions data were for bagged emissions, the models only allowed the calculation of emission factors. Subsequent emission tests involved modal analysis of the exhaust gas, which allows for a detailed analysis of the emissions of individual exhaust components during the entire dynamometer test. With the development of technology, today, the latest emission models are based on road tests that use on-board exhaust emission measurement systems (PEMS) to record the data [57,58].
3.2. Overview of selected exhaust emission models
Emission models are divided according to their precision scale into macro (regional, national area), meso (local area) and micro (areas of a dedicated part of a city, intersection road sections) [59].
- Based on parameters: average speed, vehicle type, etc.
- Based on traffic parameters such as acceleration, deceleration, idle, and continuous driving.
- Models that require the uploading of speed profiles,
- Models that generate the speed profiles themselves as part of the emissions modelling process;
- Models that include uploaded velocity profiles.
3.2.1. Macroscopic emission models
Macroscopic models are mainly based on the parameter of the average driving speed in the analysed section of the road [64]. They are based on the relation presented in Equation (1)
where:
A,B,C,D - coefficients selected according to the type of vehicle and road,
V - average driving speed (km/h),
F - fuel consumption (l/100km).
In terms of modelling, fuel consumption is highly correlated with CO2 emissions, compared to CO, THC, and NOx [65].
The macro model is used to estimate fuel consumption and road traffic's environmental impact. They can determine the total energy consumption of projects and road infrastructure development strategies and assess the impact of greenhouse gas emissions on the study area. Some environmental impacts are local, regional, or global and can be short- and long-term. Macroscale emission models allow transport impacts to be determined on a large regional scale (regional transport corridors) [66,67].
An example of software that includes macroscale emission calculation models is the Operat FB package. It is used to model the dispersion of pollutants in ambient air from point, line, and surface sources [68]. It has a "car" module, which makes it possible to calculate the emissions from car traffic on roads. Pollutant emission results are calculated according to the EMEP/Corinair B710 and B760 methodology [69]. This involves calculating the hot emissions from the exhaust of the vehicle engine, the cold emissions arising at the start of engine operation, and the evaporative emissions, the sources of which include changes in the volume of fuel vapour in the vehicle tanks and the cooling of the tank after the vehicle engine has stopped. Brake pads and abrasion can also be calculated [70]. The Corinair model distinguishes more than 200 vehicle categories, allocated to six groups: passenger vehicles, vans, lorries, buses, mopeds, and motorbikes. A further criterion for classification is the engine capacity of the vehicle and the compliance with a given emission standard. To calculate emissions, it is necessary to specify the share of specific vehicles in a given section of the road, specify their speed, and indicate whether the trip was made on an urban, suburban, or motorway road section [71].
Another model to calculate macroscale emissions is COPERT. It is based on European data using: kilometreage, vehicle structure, driving speed, humidity, and air temperature. Emission factors are calculated for the following vehicle categories [72,73]:
- passenger cars,
- vans (<3.5t),
- lorries (>3.5t),
- motorbikes and mopeds.
In the COPERT model, emissions are calculated based on Equation (2):
where:
Ei - emission of exhaust component i (g),
FCj,m - fuel consumption for vehicle category j, using fuel m (kg),
EFi,j,m - fuel consumption emission factor of component i for vehicle category j and fuel m (g/kg).
We can consider petrol, diesel, LPG, and CNG as fuels in this model [74].
For US emissions data, the MOBILE model is used, which was developed by the US EPA [75]. This model includes data from vehicle manufacturers collected by CARB and the EPA. Emissions are calculated for a given class of postvehicle traffic conditions for assumed traffic conditions. Emission calculations take into account model calibration factors such as operating condition, vehicle specifications, and the surrounding environment [76,77].
Another example is the model for calculating emissions developed by the European Union, called Artemis. Calculate the total emissions of a given traffic component as a product of a given emission factor and the amount of vehicle traffic activity. Unlike other models, emission factors are calculated as a result of the kinematics of vehicle movement in the modelled area. This approach to calculating emissions is contained in three steps [78,79]:
- identification of cycles by the kinematics of vehicle motion,
- selection of an appropriate cycle representing a specific group, which determines the corresponding emission factors for road activities,
- determination of correction factors to determine reference emission factors.
The current approach to macroscale emission models used for the determination of harmful exhaust components is based on two calculation steps. The first is the selection of a set of emission factors that determine the emissions for a given traffic condition, while the second stage is the assessment of vehicle activity in the area under study. Emissions are calculated by multiplying these two stages. However, this methodology has two main disadvantages:
- inaccuracy of emission results - most of the data included in the macro models are based on measured emissions data from engine dynamometers, while the driving cycles that are used do not correctly represent real-world driving (e.g., they take into account frequent rapid acceleration or braking); in addition, as a result of the detection of manipulation of emission results by some car manufacturers, they may not be fully reliable,
- Inadequate characterisation of current driver behaviour - current methods of determining emission factors are based on the average driving performance over a predetermined driving cycle used for certifying vehicles with emission standards; recent modifications to the introduction of the new driving cycle have rendered older generation cycles obsolete.
3.2.2. Microscopic emission models
Microscale models need a large amount of data related to measurements of vehicle parameters such as acceleration, speed, but also road parameters such as terrain gradient and position coordinates [80]. Microscale models usually have a recording resolution of 1s. To date, several microscale models have been developed that are based both on vehicle exploration parameters, such as engine power, and vehicle speed [81].
A classification of microscale models that takes into account the type of data used for input includes [82,83,84,85]:
- -
- based on speed profile: Enviver Versit+, VT, RoundaboutEM,
- -
- based on vehicle parameters, such as power: CSIRO, CMEM, VT-CPFM, LPGemission,
- -
- combining the above methods.
The power-based CMEM model was developed in 2006. Emission processes fall into different categories that correspond to physical phenomena associated with vehicle operation. Each component of the exhaust gas is modelled analytically and includes parameters specific to its generation process [86]. In developing these models, emissions were measured both directly in the engine and at the exhaust outlet of the vehicle under study. In total, more than 300 vehicles were tested under laboratory conditions for three driving cycles [87]. Developing this type of model requires a large amount of data. To calculate real-time emissions,many physical variables must be collected and vehicle speed profiles must be entered.
Another model based on engine power is CSIRO. This model predicts fuel consumption, THC, and CO emissions very well, in relation to brake and road test data [88].
The power equation used in this model is shown as follows:
where:
Zt - vehicle power,
Zd - vehicle power to overcome internal losses; Zd = 2,3610-7V2M,
Zr - vehicle power to overcome rolling resistance; Zr=(3,7210-5V+3,0910-8V2)M,
Za - vehicle power to overcome air resistance; Za = 1,2910-5CdAV3,
Ze - power needed to overcome the inertia force and climbing resistance;
Ze = 2,7810-4(a+gsinӨ)MV.
Zm - power lost to power the vehicle's accessories,
M - vehicle mass (kg),
V - vehicle speed (km/h),
a - vehicle acceleration (m/s2),
Cd - vehicle drag coefficient,
A - vehicle frontal area (m2),
Ө - road gradient (%).
The emission rate (Em) is calculated from Equation (4).
where:
α' - emissions at idle,
β' - emission per unit power output of the vehicle.
Equation (4) reflects the emissions when the engine is idle (or fuel consumption) when the useful power is equal to 0. This method can provide adequate estimates of emissions for microscale emission models. However, these results are based on the statistical average of power, fuel consumption, and emissions. In micromodelling, changes in the characteristics of the vehicle(e.g., age and catalytic converters) must be taken into account.
However, sometimes parameters such as the vehicle drag value are not available. This model uses vehicle-specific power (VSP), defined as the output of the engine per vehicle unit and expressed as a function of vehicle speed, road gradient, and acceleration [89]:
where:
VSP - vehicle specific power (kW/t),
V - vehicle speed (km/h),
a - vehicle acceleration (m/s2),
Ө - road gradient (%).
The proposed model [90] is based on the relationship between emissions and speed. The results show that exhaust emissions and fuel consumption increase as the speed increases, even when the vehicle accelerates. This phenomenon cannot be described in a model based on vehicle power [91]. The model is based on linear acceleration and speed regression and is relatively compatible with raw data (R2>0.92).Regression results are sensitive to the test methods used, that is, the cycles of driving and selected vehicles represent the composition of the fleet. The model is based on Equation (6):
where:
EM - instantaneous fuel consumption and emissions of harmful exhaust components,
- coefficients of the regression model for MOE; for speed i and for
acceleration j,
Vi - velocity (m/s),
Aj - acceleration (m/s2).
The model described in [92] contains 6 variable values. The emission functions for each vehicle provide on-the-fly results with speed and acceleration inputs, using nonlinear multiple linear regressions. The model was calibrated using emissions data from 25 vehicles (6 buses, 2 trucks, and 17 cars). As a result of the fact that the data from the tests obtained revealed a clear distinction in emissions for the acceleration and braking phases, the entire data set was divided into 3 elements, namely: acceleration, greater than 0.5 m/s2; deceleration less than -0.5 m/s2, constant speed driving and idling. The model can be used to estimate NOx emissions, volatile organic compounds (VOCs), CO2, and PM. The model has the form shown in Equation (7):
where:
Vn(t) - vehicle speed n at time t,
An(t) - acceleration of vehicle n at time t,
Eo(t - lower emission limit for a specific emission type of an exhaust constituent [g/s],
f1 – f6 - emission constants determined by regression analysis for a given type of vehicle and exhaust constituents.
As part of Enviver, the VERSIT+ speed profile-based emissions model includes a variable related to the vehicle's driving cycle. From the speed profiles obtained in Vissim, emission factors (g/km) can be estimated for different classes of vehicles [93]. VERSIT+ offers 246 emissions models for each category and toxic exhaust component. The speed profiles used in the model represent actual roadto thoseconditions,asto thoseopposed derived from the New European Driving Cycle (NEDC) [94]. The emission factors (EFj,k,l) were obtained by multiple linear regression to find the empirical relationship between emission rates, speed profiles, and dynamic variables [95]. Road transportation exhaust emissions(g/h) for specific exhaust components in one or more road sections are calculated from equation 8:
where:
EFj,k,l - average emission factor (g/km),
j - emission component,
k - vehicle class,
l - speed profile,
TVk,m - volume of - road traffic (vehicles / h),
m - road section,
Lm - length of the road section (km).
Another software package in which the emissions of harmful exhaust components can be calculated on the microscale is the AVL simulation package, in particular, Cruise, which uses Matlab/Simulink for modelling and simulation processes [96,97]. In addition to estimating model emissions, it is also possible to calculate vehicle fuel consumption. This package is designed to model any vehicle powertrain configuration (including EVs, fuel cells, and HEVs) [98]. To estimate the emissions, it is necessary to determine the trajectory using an uploaded speed profile. For speed profiles, there is a free choice, depending on whether we estimate vehicle emissions for a driving test, for example, WLTC, FTP-75, NEDC, or for a real-world driving trip [99]. The modelling approach in the AVL simulation package includes detailed vehicle specifications and projections for selected chassis components, for which we have the freedom to model shape [100].
3.2.3. Comparison of selected emission models
A summary of the selected emission models in terms of their scale, the input data needed for the calculation, and the main model-specific features is presented below in the form of Table 1. Information on the availability of an update is also provided, which may be helpful for those wishing to make up-to-date estimates of vehicle emissions. The update feature is also relevant in the context of new vehicle designs that are approved for road use, while they need further testing of actual road emissions to provide valuable data for updating emission models. Updating emission models will also be a challenge in the context of the upcoming EURO7 emission standards, which will be a new emissions standard and will revolutionise the subject of vehicle emissions.
The selected emission models presented above, together with their characteristics, mainly apply to the micro- and macro-scale. For the given example micro- and macro-scales, Table 1 also gives examples of the input data required for the model emissions calculation. For example, for macroscale models, it is necessary to determine the average speed of the vehicles, their type structure, the fuel used, the vehicle load, and, for example, the percentage of urban, extra-urban, and motorway driving [x]. For the macro input data, data on ambient conditions such as minimum, maximum, and average temperatures for the whole year for the given months as well as the prevailing atmospheric humidity are often also required [x]. For the micro scale, a vehicle speed profile recorded at a frequency of at least 1 Hz is usually the basic parameter required. Such input data can be obtained from the vehicle's GPS and OBDII system, or, for example, can be obtained as simulation data. Most simulation software’s, such as Vissim or Matlab Simulink, allow the generation of vehicle parameter data from the simulation, and these data are then loaded into microscale models. Sometimes, for the specifics of some microscale models, it is necessary to adapt the input file for the appropriate coding for the emission model, e.g., when uploading speed profiles to Enviver Versit+, it is necessary to adapt the input data and save them in .fzp format.
Table 2 and Table 3 show the characteristics of the selected parameters for selected emission models. Table 2 deals with the estimation of the emission for a selected component of the exhaust gas and shows which model offers the calculation possibilities for a given emission factor. Table 3, on the other hand, shows the emission calculation possibilities for a given vehicle category for selected emission models.
Based on Table 2, it can be observed that the lower the detail of the model (macroscale models), theoretically they allow emission calculations for a larger number of exhaust components. Microscale models are characterised by lower emission estimates. This is due to the fact that micro-scale models allow for the generation of detailed second-by-second emission profiles, which are generally difficult to obtain when building an emission model. Macroscale models allow for either averaged estimates or emission factors, which is simpler to model, as it allows for a larger margin of error.
Figure 5 shows the overall combination of the emission models for different scales for different transport models of vehicle traffic simulations. From it, it can be seen for which example applications and input data the emissions of vehicle exhaust components can be estimated. However, an unambiguous link between a given emission model and a given type of vehicle traffic simulation is not clear-cut, as will be shown later in the presentation of case studies of other works.
3.3. Traffic simulation tools and exhaust emissions
Traffic simulation techniques have been used since the middle of the 20th century. The intensive development of information technology, including numerical computer techniques coupled with high-powered computers, has contributed significantly to the development of modern computational procedures used in traffic engineering. These procedures take into account an increasing group of factors that affect the complex phenomenon of traffic [123]. Three levels of analysis have emerged: network - macro, local - micro, and intermediate - meso. Macroscopic models assess vehicle traffic at a high level of aggregation as traffic flow (the number of vehicles passing a given point in an hour) without focussing on its components (vehicles) [124]. Microscopic models describe the behaviour of the units that make up the traffic stream, as well as the interactions that occur between them [125]. Mesoscopic models, on the other hand, are characterised by an intermediate level of detail. They describe individual vehicles, but do not take into account the relationships between them [126].
Macroscopic models are used to estimate the emission of exhaust pollutants on the basis of the average speed and kilometres travelled by a specific group of vehicles. Microscopic models, on the other hand, simulate the movement of individual vehicles included in traffic streams, giving them specific speeds and accelerations, creating very large amounts of data when recording these situations. These data are successively used by additional applications to calculate vehicle emissions [127,128].
One example of traffic microsimulation software is TRANSIMS. It is a system that enables the analysis of transport systems on a regional scale. It contains a number of modules, among which we can highlight the Traffic Microsimulator. It is based on the theory of cellular automata (CA) system and uses the Nagel-Schreckenberg model [129]. The main feature of CA-based models is temporal and spatial discretisation. For this reason, each path in the network is divided into small cells of equal size. Each cell can be in one of two states: occupied by a vehicle or empty. Due to this simplification, compared to other microscale models, the model is efficient and can be applied practically to simulate large and complex regional and even national road networks [130]. TRANSIMS is also equipped with an additional module that is used to evaluate vehicle emissions from the model. It allows the estimation of THC, CO, and NOx [131].
The software for traffic microsimulation is SUMO (Simulation for Urban Mobility). It is a system developed by the German Aerospace Centre (DLR). It includes the Krauss leader driving model, an extension of the Gipps model, and the Krajzewicz lane change model [132,133]. The system allows traffic simulations for different types of vehicles and different intersections with or without traffic lights, and for different road networks with more than 10,000 roads. SUMO also allows dynamic traffic distribution procedures and graphical visualisation of traffic in 2D [134]. It also allows for the estimation of exhaust emissions based on the HBEFA and PHEM models, which provide results for CO2, CO, THC, NOx, PM, and vehicle fuel consumption [135].
The most popular software for traffic microsimulation is Vissim. It is a system developed by the German company PTV. It uses the psychophysiological model of Wiedemann’s driver behaviour [136,137] to model driving behind the leader. Based on Wiedemann's work is a rule-based model of lane change [138]. The Vissim software does not follow the classical approach of modelling a road network with a dedicated graph consisting of vertices (nodes) and edges (segments). Instead, the road network is built using sections connected to each other by connectors. This solution makes it possible to model almost any road system. Vissim is not only characterised by a high degree of accuracy in modelling the geometry and parameters of the road network, but also enables a precise representation of vehicle traffic. In addition to simulating the movement of motor vehicles, the programme allows the simulation of the movement of pedestrians, cyclists, motorbikes, and rail vehicles. It is also possible to use a dynamic traffic distribution in the programme, in which the driver learning process is carried out iteratively [139]. The system has the ability to visualise simulations in both two-dimensional and three-dimensional graphics. The leader driving model used in the programme also describes the boundaries between the distinguished states, which are [140,141]:
- free driving,
- approaching,
- dependent driving,
- braking.
In the software, in addition to the 1974 Wiedemann model, there is also the 1999 model, which is more extensive (with a greater number of calibration parameters). For vehicle emissions, the software uses an additional module, Enviver, which uses the VERSIT+ emissions model developed by the Netherlands Organisation for Applied Scientific Research (TNO) and also the integrated ESTM BOSH emission model [142,143].
3.4. Simulation of vehicle traffic and emission models - examples
The emission models described above are used in vehicle movement simulation studies. The use of these models is noted in many cases for Vissim and SUMO. The models represent the movement of vehicles on a micro scale; i.e., in addition to measuring parameters such as speed, vehicle acceleration, they measure any relationships that occur between vehicles appearing in the simulation. A similar use is for meso-scale models, except that the interaction between vehicles is then excluded. The typical use of these data is to use, among other things, the previously mentioned parameters for the computation of microscale emission models. However, it is possible to aggregate these data to some extent, i.e., to determine, for example, the average speed parameter or the distance travelled for a given vehicle or group of vehicles. As a result of such operations, it is also possible to use, e.g., emission models on a macro scale, for the input data, in addition to general parameters of the studied fleet, such as the number of vehicles, their type, size, and fulfilment of the emission class, need e.g., vehicle operation data, such as e.g., speed or vehicle load. Table 4 below shows a cross section of the work on vehicle traffic simulation and the calculation models used to assess emissions.
The large cross section of vehicle traffic and emission models used shows the wide applicability of such tools for estimating vehicle emissions into the environment. Table 1 shows a selection of works that combine the topics of emission models with vehicle traffic simulation models for the years 2015-2023. From this, it can be seen that the development of models at the micro- or macroscale does not always come down to using a model that corresponds to the scale of the simulation. Examples of the number of papers that use a particular type of software are as follows; based on the Web of Science core collection for a search of article abstracts where the key search term was simulation, emission, and Vissim for the years 2008-2023, 120 results were found. Using the same keywords, but for Visum software, 6 papers were found. On the other hand, 73 results were found for the SUMO traffic simulation tool.
Figure 6 shows the classification and grouping for the simulation models of the delineation for micro-, meso-, and macroscales. Some traffic simulation tools, for example, are located in two clusters; for example, for Vissim, the simulation can be carried out at two levels of detail: micro- and meso. The respective clusters of traffic simulators are combined with groups of emission models. For traffic simulators on the microscale, the connection to the emission model naturally occurs for the microscale emission models, but also for the macroscale models. The reason for this is that we can generate instantaneous speed and acceleration data from these models, which can then be aggregated and used to calculate, for example, the average speed of a vehicle. Such a parameter, together with traffic volume information, already allows such microscale simulation models to be used to calculate macroscale emissions.
3.5. Importance of traffic simulator calibration in the context of emission calculation
An important aspect in the context of emission and traffic simulation models is their appropriate calibration [160]. A previously performed analysis of papers in the Web of Science Core collection database confirmed this statement, while the calibration itself was found to be in the closest proximity to the main keyword emission. The calibration of various parameters in simulation models is crucial to achieve sufficiently good results for the application under analysis. The calibration aspect mainly concerns microscale models, where we have many vehicle movement parameters that affect their dynamics, and consequently the generated emissions. These parameters are strictly according to the particular driving model that is used in the application [161]. Examples include parameters such as minimum spacing between vehicles, the time it takes to join the traffic stream, acceleration from 80km/h, and any statistical distribution of speed and acceleration [162,163]. In Vissim, the parameters related to vehicle speed and acceleration are defined as the desired speed and acceleration and are functions that we can freely shape based on real data. If we do not perform this step of model calibration, the standard values of the model parameters provided by the software manufacturer are only applicable for specific conditions, which are not described in the software manual files. The model calibration should be performed not only for the national scale, but also for the regional scale. For example, the driving style of drivers in Tokyo, London, or Paris is different from that of drivers in smaller cities such as Enna, Görlitz, and Rzeszow [164,165]. The number of calibration variables in simulation models is usually large, which makes the process complicated for the normal user. Sometimes the calibration carried out is also wrong, because, for the vehicle traffic example, for simulation models, users are guided by the calibration of, e.g., the traffic volume parameter, so that the simulation is as close as possible to the real one, which is not efficient considering aspects of vehicle emissions [166].
For microscale simulation models, vehicle trajectories, vehicle speeds, and acceleration should be taken into account in particular [167]. The software-generated results of these trajectories should then be as close as possible to the real ones. Although some macro traffic characteristics, such as queues and travel times, are the results of the simulation, more detailed characteristics, such as speed and acceleration profiles, are not guaranteed to be realistic enough to predict emissions. To obtain an accurate estimate of emissions, calibration must be carried out from the perspective of real vehicle trajectories. In case studies, the default parameter settings of, e.g., VISSIM and AIMSUN microsimulation software’s did not produce realistic trajectory results [168,169,170]. It is clear that the default parameter settings do not produce an effective result for estimating emissions.
An overview of the work in which traffic simulation models were calibrated to estimate emissions from computational models is presented in Table 5.
4. Future steps in emission modelling and traffic simulation and recommendations
The subject of emissions modelling, as well as traffic modelling has developed rapidly in recent years. Initially, emission models were created on the basis of chassis dynamometer tests and the collection of emission data during their execution. Subsequent years and the technological development of emission measurement equipment made it possible to collect emission data while driving in real traffic conditions. This was made possible by PEMS equipment [181]. Many research institutes around the world now carry out vehicle emission tests in this way, generating large amounts of data that can then be used to develop new and more accurate emission models through processing [182,183].
In terms of vehicle traffic modelling, calibration of the traffic model is also an important topic in the work described earlier. The calibration of the traffic models for further analysis is of great importance because this process has a major impact on the results obtained from the exhaust emissions from simulated vehicles [184,185]. Traffic simulation calibration is the process of adjusting the simulation parameters in relation to the actual observed traffic conditions. This is crucial to ensure that accurate and reliable results are obtained. This process is usually concerned with adjusting parameters such as vehicle speed and acceleration, but also includes parameters related to, for example, vehicle spacing or determined issues of priority. Failure to carry out this process accurately, or omitting it altogether, can result in the results of differences in exhaust emissions, differences of up to several dozen percent [186]. In the context of emission calculations, acceleration and vehicle speed are the most important simulation parameters, particularly at the microscale.
Vehicle emission models need to be continuously developed and improved as more and more vehicles are put on the road every year. New vehicle designs require on-road emissions testing and the data collected is used to create new emissions models and update the current database. This applies to almost any scale of emission models. New hybrid vehicles are another challenge facing the aspect of emission modelling [187]. These vehicles do not always generate emissions while driving, which means that microscale models in particular need to be sensitive to such emission characteristics. To prepare, for example, an emissions map, modern emission models must show precisely where there are, for example, increased emissions [188]. In recent years, there has been an increase in the use of, for example, artificial intelligence computing methods so that newly developed models can reflect the emissions of hybrid vehicles [189,190].
There is also great potential in the use of data banks where information is collected, for example, for the management of a road section. Large amounts of data are generated for the main arterial roads in the city, which we can describe as big data sets. These data can also be processed in the context of accurately calibrating traffic simulation models, as well as being used as input data for emission models. The increased volume and detail of data also allows models to be developed with improved spatial resolution [191]. The development of more advanced mapping and geospatial technologies is leading to a greater focus on high-resolution emission models that take into account the unique characteristics of specific locations [192]. This is particularly relevant for traffic and emission simulations in urban areas. The increased accuracy of such models allows for better analysis of the spread of emissions near roads, pavements, cycleways, as well as in pedestrian crossing areas.
The directions for further work for both emission model and traffic simulation models are concerning electric vehicles. The traffic characteristics of these types of vehicles are somewhat different from those of conventional vehicles, i.e., they have different torque characteristics, resulting in a slightly different acceleration distribution of acceleration [193,194,195]. In the context of traffic simulation models, this state of affairs requires the additional calibration of vehicle movements with this type of vehicle. Regarding the modelling of emissions from EVs, it is important to consider the topic of energy efficiency, as the converted emissions generated by an EV depend on the power source used to charge this type of vehicle.
4.1. Recommendations on the applicability of emission models and traffic simulation models
Based on the information from the review of the work presented above, some recommendations can be made to those who are or will be, involved in the field of emissions modelling and traffic simulation. Selected recommendations for modelling are as follows:
- For microscale models, it is often necessary to collect data at a frequency of at least 1Hz, such data for road tests, e.g., for the speed parameter, can be obtained using GPS and the OBDII interface; traffic models such as, e.g. Vissim can also aggregate simulation data, which can then be exported to emission models such as Versit+,
- The combination of emission model and simulation models is not always at the same scale, and it is often possible to find work that uses microscale traffic models while using macroscale emission models for emission estimation,
- For microscale traffic models, it is possible to aggregate the results of, for example, all vehicle trips into the average speed parameter, which can be used as an input for the macroscale emission models,
- For both micro and macro scales, it is necessary to calibrate the traffic simulation models, as this has a significant impact on the emissions calculation,
- At the micro scale, calibration concerns parameters related to vehicle dynamics such as acceleration and desired speed, but also other parameters such as vehicle lateral distance, among others.
- Calibration is necessary because the emission models do not contain universal data that are characteristic of the whole world, and emission estimates are to a large extent influenced by the driving style of the driver, which varies according to the size and characteristics of the region.
- Standard settings of traffic simulation softwares for, e.g., Vissim and Aimsum often do not include actual vehicle trajectories.
5. Conclusions
The paper provides an overview of the emission models used for different traffic simulation methods for environmental analyses. The use of emission models with a combination of traffic simulation models is essential for transportation management and planning. This approach allows for a better understanding of the emissions generated by vehicles and their impact on air and environmental quality. In the context of emissions and traffic modelling, accurate calibration is necessary so that emission results can be reliably obtained. Simulation models are used as a tool to generate travel data from the input data of emission models. A common use of simulation is as a decision support tool, and the same is true for driving simulators, which can help decision makers in the road transport sector. The right choice of tools is crucial for an adequate understanding of the problem under analysis. The variety of tools available on the market, both in terms of emission models and traffic simulation models, is a challenge for those who wish to use them to calculate emissions from road transport sources. The paper also draws attention to the important aspect of calibrating traffic simulation models to obtain as reliable vehicle emission results as possible. For example, in the context of microscale models, it is important to obtain vehicle speed and acceleration profiles that are as close to the actual trajectories.
Future topics related to emissions and traffic modelling include better access to databases, which are created by road operators and which can be used to calibrate models, and the use of modern computing techniques based on artificial intelligence methods. Vehicle emission models and traffic simulators should be integrated with other models and data sources, such as land use and energy models, to provide a completer and more accurate picture of vehicle emissions generated. The shortcomings of the study are related to the choice of papers and models to be analysed, while the rationale for this is that it was guided by the popularity of the solutions used and the scope of the work had to be limited. Another shortcoming of the study is the broader description of topics related to artificial intelligence and support for modelling of vehicle traffic and emissions, while the shortcomings mentioned will also be the scope of new and other works.
Data Availability Statement
Not applicable
Conflicts of Interest
The authors declare no conflict of interest.
References
- Jin, Y.; Andersson, H.; Zhang, S. Air Pollution Control Policies in China: A Retrospective and Prospects. Int. J. Environ. Res. Public Health 2016, 13, 1219. [CrossRef]
- Bo, M., Salizzoni, P., Clerico, M., & Buccolieri, R. (2017). Assessment of indoor-outdoor particulate matter air pollution: A review. Atmosphere, 8(8), 136. [CrossRef]
- Inkinen, T., & Hämäläinen, E. Reviewing truck logistics: Solutions for achieving low emission road freight transport. Sustainability, 2020, 12(17), 6714. [CrossRef]
- Kuszewski, H.; Jaworski, A.; Mądziel, M. Lubricity of Ethanol–Diesel Fuel Blends—Study with the Four-Ball Machine Method. Materials 2021, 14, 2492. [CrossRef]
- Nellore, K., & Hancke, G. P. A survey on urban traffic management system using wireless sensor networks. Sensors, 2016, 16(2), 157. [CrossRef]
- Vidhi, R., & Shrivastava, P. A review of electric vehicle lifecycle emissions and policy recommendations to increase EV penetration in India. Energies, 2018, 11(3), 483. [CrossRef]
- Wang, L., Zhang, F., Pilot, E., Yu, J., Nie, C., Holdaway, J., ... & Krafft, T. (2018). Taking action on air pollution control in the Beijing-Tianjin-Hebei (BTH) region: progress, challenges and opportunities. International journal of environmental research and public health, 15(2), 306. [CrossRef]
- Liu, H., Wang, X., Zhang, D., Dong, F., Liu, X., Yang, Y., ... & Zheng, Z. (2019). Investigation on blending effects of gasoline fuel with N-butanol, DMF, and ethanol on the fuel consumption and harmful emissions in a GDI vehicle. Energies, 12(10), 1845. [CrossRef]
- Ziółkowski, A.; Fuć, P.; Lijewski, P.; Jagielski, A.; Bednarek, M.; Kusiak, W. Analysis of Exhaust Emissions from Heavy-Duty Vehicles on Different Applications. Energies 2022, 15, 7886. [CrossRef]
- Jaworski A., Lejda K., Mądziel M., Ustrzycki A.: Assessment of the emission of harmful car exhaust components in real traffic conditions. IOP Conf. Series: Materials Science and Engineering 421, 2018. [CrossRef]
- Kawamoto, R., Mochizuki, H., Moriguchi, Y., Nakano, T., Motohashi, M., Sakai, Y., & Inaba, A. (2019). Estimation of CO2 emissions of internal combustion engine vehicle and battery electric vehicle using LCA. Sustainability, 11(9), 2690. [CrossRef]
- Mazza, S., Aiello, D., Macario, A., & De Luca, P. (2020). Vehicular emission: estimate of air pollutants to guide local political choices. A case study. Environments, 7(5), 37. [CrossRef]
- Hu, H., Lee, G., Kim, J. H., & Shin, H. (2020). Estimating micro-level on-road vehicle emissions using the k-means clustering method with GPS big data. Electronics, 9(12), 2151. [CrossRef]
- Kachba, Y., Chiroli, D. M. D. G., T. Belotti, J., Antonini Alves, T., de Souza Tadano, Y., & Siqueira, H. (2020). Artificial neural networks to estimate the influence of vehicular emission variables on morbidity and mortality in the largest metropolis in South America. Sustainability, 12(7), 2621.
- Obaid, M., Torok, A., & Ortega, J. (2021). A comprehensive emissions model combining autonomous vehicles with park and ride and electric vehicle transportation policies. Sustainability, 13(9), 4653. [CrossRef]
- Zhang, Y., Zhou, R., Peng, S., Mao, H., Yang, Z., Andre, M., & Zhang, X. (2022). Development of Vehicle Emission Model Based on Real-Road Test and Driving Conditions in Tianjin, China. Atmosphere, 13(4), 595. [CrossRef]
- Zhai, Z., Tu, R., Xu, J., Wang, A., & Hatzopoulou, M. (2020). Capturing the variability in instantaneous vehicle emissions based on field test data. Atmosphere, 11(7), 765. [CrossRef]
- Wang, L., Chen, X., Xia, Y., Jiang, L., Ye, J., Hou, T., ... & Yu, S. (2022). Operational Data-Driven Intelligent Modelling and Visualization System for Real-World, On-Road Vehicle Emissions—A Case Study in Hangzhou City, China. Sustainability, 14(9), 5434. [CrossRef]
- Beza, A. D., Maghrour Zefreh, M., & Torok, A. (2022). Impacts of different types of automated vehicles on traffic flow characteristics and emissions: a microscopic traffic simulation of different freeway segments. Energies, 15(18), 6669. [CrossRef]
- Plakolb, S., Jäger, G., Hofer, C., & Füllsack, M. (2019). Mesoscopic urban-traffic simulation based on mobility behavior to calculate NOx emissions caused by private motorized transport. Atmosphere, 10(6), 293. [CrossRef]
- Gupta, M., Mohan, M., & Bhati, S. (2022). Assessment of air pollution mitigation measures on secondary pollutants PM10 and ozone using chemical transport modelling over megacity Delhi, India. Urban Science, 6(2), 27. [CrossRef]
- Liu, L., Zhang, X., Xu, W., Liu, X., Lu, X., Wang, S., ... & Zhao, L. (2017). Ground ammonia concentrations over China derived from satellite and atmospheric transport modeling. Remote Sensing, 9(5), 467. [CrossRef]
- Al-Turki, M., Jamal, A., Al-Ahmadi, H. M., Al-Sughaiyer, M. A., & Zahid, M. (2020). On the potential impacts of smart traffic control for delay, fuel energy consumption, and emissions: An NSGA-II-based optimization case study from Dhahran, Saudi Arabia. Sustainability, 12(18), 7394. [CrossRef]
- Maurer, R., Kossioris, T., Sterlepper, S., Günther, M., & Pischinger, S. (2023). Achieving Zero-Impact Emissions with a Gasoline Passenger Car. Atmosphere, 14(2), 313. [CrossRef]
- Progiou, A., Liora, N., Sebos, I., Chatzimichail, C., & Melas, D. (2023). Measures and Policies for Reducing PM Exceedances through the Use of Air Quality Modeling: The Case of Thessaloniki, Greece. Sustainability, 15(2), 930. [CrossRef]
- Koupal, J., Beardsley, M., Brzezinski, D., Warila, J., & Faler, W. (2010). US EPA’s MOVES2010 vehicle emission model: overview and considerations for international application. Ann Arbor, MI: US Environmental Protection Agency, Office of Transportation and Air Quality. http://www. epa. gov/oms/models/moves/MOVES2010a/paper137-tap2010. pdf.
- Ahn, K. (1998). Microscopic fuel consumption and emission modeling (Doctoral dissertation, Virginia Tech).
- Jamshidnejad, A., Papamichail, I., Papageorgiou, M., & De Schutter, B. (2017). A mesoscopic integrated urban traffic flow-emission model. Transportation Research Part C: Emerging Technologies, 75, 45-83. [CrossRef]
- Davis, N., Lents, J., Osses, M., Nikkila, N., & Barth, M. (2005). Development and application of an international vehicle emissions model. Transportation Research Record, 1939(1), 156-165. [CrossRef]
- Chen, B., & Shin, S. (2021). Bibliometric analysis on research trend of accidental falls in older adults by using Citespace—focused on web of science core collection (2010–2020). International journal of environmental research and public health, 18(4), 1663. [CrossRef]
- Barneo-Alcántara, M., Díaz-Pérez, M., Gómez-Galán, M., Carreño-Ortega, Á., & Callejón-Ferre, Á. J. (2021). Musculoskeletal disorders in agriculture: A review from web of science core collection. Agronomy, 11(10), 2017.
- Wallington, T. J., Anderson, J. E., Dolan, R. H., & Winkler, S. L. (2022). Vehicle Emissions and Urban Air Quality: 60 Years of Progress. Atmosphere, 13(5), 650. [CrossRef]
- Piracha, A., & Chaudhary, M. T. (2022). Urban air pollution, urban heat island and human health: a review of the literature. Sustainability, 14(15), 9234. [CrossRef]
- Holnicki, P., Nahorski, Z., & Kałuszko, A. (2021). Impact of vehicle fleet modernization on the traffic-originated air pollution in an urban area—A case study. Atmosphere, 12(12), 1581. [CrossRef]
- Ko, S., Park, J., Kim, H., Kang, G., Lee, J., Kim, J., & Lee, J. (2020). NOx emissions from Euro 5 and Euro 6 heavy-duty diesel vehicles under real driving conditions. Energies, 13(1), 218. [CrossRef]
- Hooftman, N., Oliveira, L., Messagie, M., Coosemans, T., & Van Mierlo, J. (2016). Environmental analysis of petrol, diesel and electric passenger cars in a Belgian urban setting. Energies, 9(2), 84. [CrossRef]
- Iqbal, A., Afroze, S., & Rahman, M. M. (2020). Vehicular PM emissions and urban public health sustainability: A probabilistic analysis for Dhaka City. Sustainability, 12(15), 6284. [CrossRef]
- Penkała, M., Ogrodnik, P., & Rogula-Kozłowska, W. (2018). Particulate matter from the road surface abrasion as a problem of non-exhaust emission control. Environments, 5(1), 9. [CrossRef]
- Giechaskiel, B., Forloni, F., Carriero, M., Baldini, G., Castellano, P., Vermeulen, R., ... & Fontaras, G. (2022). Effect of tampering on on-road and off-road diesel vehicle emissions. Sustainability, 14(10), 6065. [CrossRef]
- Kole, P. J., Löhr, A. J., Van Belleghem, F. G., & Ragas, A. M. (2017). Wear and tear of tyres: a stealthy source of microplastics in the environment. International journal of environmental research and public health, 14(10), 1265. [CrossRef]
- Bessagnet, B., Allemand, N., Putaud, J. P., Couvidat, F., André, J. M., Simpson, D., ... & Thunis, P. (2022). Emissions of Carbonaceous Particulate Matter and Ultrafine Particles from Vehicles—A Scientific Review in a Cross-Cutting Context of Air Pollution and Climate Change. Applied Sciences, 12(7), 3623. [CrossRef]
- Wang, L., Zhong, B., Vardoulakis, S., Zhang, F., Pilot, E., Li, Y., ... & Krafft, T. (2016). Air quality strategies on public health and health equity in Europe—a systematic review. International journal of environmental research and public health, 13(12), 1196. [CrossRef]
- Connerton, P., Vicente de Assunção, J., Maura de Miranda, R., Dorothée Slovic, A., José Pérez-Martínez, P., & Ribeiro, H. (2020). Air quality during COVID-19 in four megacities: lessons and challenges for public health. International Journal of Environmental Research and Public Health, 17(14), 5067.
- Sun, C., Zhang, J., Ma, Q., & Chen, Y. (2015). Human health and ecological risk assessment of 16 polycyclic aromatic hydrocarbons in drinking source water from a large mixed-use reservoir. International journal of environmental research and public health, 12(11), 13956-13969. [CrossRef]
- Haque, M. S., & Singh, R. B. (2017). Air pollution and human health in Kolkata, India: A case study. Climate, 5(4), 77.
- Selleri, T., Melas, A. D., Joshi, A., Manara, D., Perujo, A., & Suarez-Bertoa, R. (2021). An overview of lean exhaust denox aftertreatment technologies and nox emission regulations in the european union. Catalysts, 11(3), 404. [CrossRef]
- Selleri, T., Gioria, R., Melas, A. D., Giechaskiel, B., Forloni, F., Mendoza Villafuerte, P., ... & Suarez-Bertoa, R. (2022). Measuring Emissions from a Demonstrator Heavy-Duty Diesel Vehicle under Real-World Conditions—Moving Forward to Euro VII. Catalysts, 12(2), 184. [CrossRef]
- Liu, X., Zhao, F., Hao, H., Chen, K., Liu, Z., Babiker, H., & Amer, A. A. (2020). From NEDC to WLTP: Effect on the Energy Consumption, NEV Credits, and Subsidies Policies of PHEV in the Chinese Market. Sustainability, 12(14), 5747. [CrossRef]
- Lee, H., & Lee, K. (2020). Comparative evaluation of the effect of vehicle parameters on fuel consumption under NEDC and WLTP. Energies, 13(16), 4245. [CrossRef]
- Giakoumis, E. G., & Zachiotis, A. T. (2017). Investigation of a diesel-engined vehicle’s performance and emissions during the WLTC driving cycle—comparison with the NEDC. Energies, 10(2), 240. [CrossRef]
- Kaya, T., Kutlar, O. A., & Taskiran, O. O. (2018). Evaluation of the effects of biodiesel on emissions and performance by comparing the results of the new european drive cycle and worldwide harmonized light vehicles test cycle. Energies, 11(10), 2814. [CrossRef]
- Grigoratos, T., Agudelo, C., Grochowicz, J., Gramstat, S., Robere, M., Perricone, G., ... & Mathissen, M. (2020). Statistical assessment and temperature study from the interlaboratory application of the WLTP–brake cycle. Atmosphere, 11(12), 1309. [CrossRef]
- Bodisco, T., & Zare, A. (2019). Practicalities and driving dynamics of a real driving emissions (RDE) Euro 6 regulation homologation test. Energies, 12(12), 2306. [CrossRef]
- Andrych-Zalewska, M., Chlopek, Z., Merkisz, J., & Pielecha, J. (2022). Comparison of Gasoline Engine Exhaust Emissions of a Passenger Car through the WLTC and RDE Type Approval Tests. Energies, 15(21), 8157. [CrossRef]
- Pielecha, J., Skobiej, K., Gis, M., & Gis, W. (2022). Particle number emission from vehicles of various drives in the RDE tests. Energies, 15(17), 6471. [CrossRef]
- Varella, R. A., Giechaskiel, B., Sousa, L., & Duarte, G. (2018). Comparison of portable emissions measurement systems (PEMS) with laboratory grade equipment. Applied Sciences, 8(9), 1633. [CrossRef]
- Giechaskiel, B., Casadei, S., Rossi, T., Forloni, F., & Di Domenico, A. (2021). Measurements of the Emissions of a “Golden” Vehicle at Seven Laboratories with Portable Emission Measurement Systems (PEMS). Sustainability, 13(16), 8762. [CrossRef]
- Chen, J., Li, Y., Meng, Z., Feng, X., Wang, J., Zhou, H., ... & Wang, S. (2022). Study on Emission Characteristics and Emission Reduction Effect for Construction Machinery under Actual Operating Conditions Using a Portable Emission Measurement System (Pems). International Journal of Environmental Research and Public Health, 19(15), 9546. [CrossRef]
- Zhang, R., Wang, Y., Pang, Y., Zhang, B., Wei, Y., Wang, M., & Zhu, R. (2022). A Deep Learning Micro-Scale Model to Estimate the CO2 Emissions from Light-Duty Diesel Trucks Based on Real-World Driving. Atmosphere, 13(9), 1466. [CrossRef]
- Bifulco, G. N., Galante, F., Pariota, L., & Russo Spena, M. (2015). A linear model for the estimation of fuel consumption and the impact evaluation of advanced driving assistance systems. Sustainability, 7(10), 14326-14343. [CrossRef]
- Mądziel, M., Campisi, T. Assessment of vehicle emissions at roundabouts: acomparative study of PEMS data and microscale emission model. Archives of Transport 2022, 63(3), 35-51. [CrossRef]
- Smit, R., Ntziachristos, L., & Boulter, P. (2010). Validation of road vehicle and traffic emission models–A review and meta-analysis. Atmospheric environment, 44(25), 2943-2953. [CrossRef]
- Davis, N., Lents, J., Osses, M., Nikkila, N., & Barth, M. (2005). Development and application of an international vehicle emissions model. Transportation Research Record, 1939(1), 156-165.
- De Nunzio, G., Laraki, M., & Thibault, L. (2020). Road traffic dynamic pollutant emissions estimation: from macroscopic road information to microscopic environmental impact. Atmosphere, 12(1), 53. [CrossRef]
- Rakha, H. A., Ahn, K., Moran, K., Saerens, B., & Van den Bulck, E. (2011). Virginia tech comprehensive power-based fuel consumption model: model development and testing. Transportation Research Part D: Transport and Environment, 16(7), 492-503. [CrossRef]
- Obaid, M., & Torok, A. (2021). Macroscopic traffic simulation of autonomous vehicle effects. Vehicles, 3(2), 187-196. [CrossRef]
- Schnieder, M., Hinde, C., & West, A. (2022). Emission Estimation of On-Demand Meal Delivery Services Using a Macroscopic Simulation. International Journal of Environmental Research and Public Health, 19(18), 11667. [CrossRef]
- Sówka, I., Pawnuk, M., Miller, U., Grzelka, A., Wroniszewska, A., & Bezyk, Y. (2020). Assessment of the Odour Impact Range of a Selected Agricultural Processing Plant. Sustainability, 12(18), 7289. [CrossRef]
- Nowakowicz-Dębek, B., Wlazło, Ł., Szymula, A., Ossowski, M., Kasela, M., Chmielowiec-Korzeniowska, A., & Bis-Wencel, H. (2020). Estimating Methane Emissions from a Dairy Farm Using a Computer Program. Atmosphere, 11(8), 803. [CrossRef]
- Wlazło, Ł., Nowakowicz-Dębek, B., Ossowski, M., Stasińska, B., & Kułażyński, M. (2020). Estimation of ammonia emissions from a dairy farm using a computer program. Carbon Management, 11(2), 195-201.
- De Blasiis, M. R., Ferrante, C., Palmieri, F., & Veraldi, V. (2022). Coupling Virtual Reality Simulator with Instantaneous Emission Model: A New Method for Estimating Road Traffic Emissions. Sustainability, 14(11), 6793. [CrossRef]
- Li, F., Zhuang, J., Cheng, X., Li, M., Wang, J., & Yan, Z. (2019). Investigation and prediction of heavy-duty diesel passenger bus emissions in Hainan using a COPERT model. Atmosphere, 10(3), 106. [CrossRef]
- Jaworski, A.; Mądziel, M.; Kuszewski, H. Sustainable Public Transport Strategies—Decomposition of the Bus Fleet and Its Influence on the Decrease in Greenhouse Gas Emissions. Energies 2022, 15, 2238. [CrossRef]
- Ali, M., Kamal, M. D., Tahir, A., & Atif, S. (2021). Fuel consumption monitoring through COPERT model—A case study for urban sustainability. Sustainability, 13(21), 11614. [CrossRef]
- Weng, J., Wang, R., Wang, M., & Rong, J. (2015). Fuel consumption and vehicle emission models for evaluating environmental impacts of the ETC system. sustainability, 7(7), 8934-8949. [CrossRef]
- Dong, Y., Xu, J., Liu, X., Gao, C., Ru, H., & Duan, Z. (2019). Carbon emissions and expressway traffic flow patterns in China. Sustainability, 11(10), 2824. [CrossRef]
- Hagan, R., Markey, E., Clancy, J., Keating, M., Donnelly, A., O’Connor, D. J., ... & McGillicuddy, E. J. (2022). Non-Road Mobile Machinery Emissions and Regulations: A Review. Air, 1(1), 14-36. [CrossRef]
- Tucki, K. (2021). A Computer Tool for Modelling CO2 Emissions in Driving Cycles for Spark Ignition Engines Powered by Biofuels. Energies, 14(5), 1400. [CrossRef]
- El-Sehiemy, R., Hamida, M. A., Elattar, E., Shaheen, A., & Ginidi, A. (2022). Nonlinear Dynamic Model for Parameter Estimation of Li-Ion Batteries Using Supply–Demand Algorithm. Energies, 15(13), 4556. [CrossRef]
- Mao, F., Li, Z., & Zhang, K. (2021). A comparison of carbon dioxide emissions between battery electric buses and conventional diesel buses. Sustainability, 13(9), 5170. [CrossRef]
- Robinson, M. K., & Holmén, B. A. (2020). Hybrid-electric passenger car energy utilization and emissions: Relationships for real-world driving conditions that account for road grade. Science of The Total Environment, 738, 139692. [CrossRef]
- Mądziel, M., Campisi, T., Jaworski, A., & Tesoriere, G. (2021). The development of strategies to reduce exhaust emissions from passenger cars in Rzeszow city—Poland. a preliminary assessment of the results produced by the increase of e-fleet. Energies, 14(4), 1046. [CrossRef]
- Yu, Q., Lu, L., Li, T., & Tu, R. (2022). Quantifying the Impact of Alternative Bus Stop Platforms on Vehicle Emissions and Individual Pollution Exposure at Bus Stops. International Journal of Environmental Research and Public Health, 19(11), 6552. [CrossRef]
- Guérette, E. A., Chang, L. T. C., Cope, M. E., Duc, H. N., Emmerson, K. M., Monk, K., ... & Paton-Walsh, C. (2020). Evaluation of regional air quality models over Sydney, Australia: Part 2, comparison of PM2. 5 and ozone. Atmosphere, 11(3), 233. [CrossRef]
- Smit, R., & McBroom, J. (2009). Use of microscopic simulation models to predict traffic emissions. Road & Transport Research: A Journal of Australian and New Zealand Research and Practice, 18(2), 49-54.
- Scora, G., & Barth, M. (2006). Comprehensive modal emissions model (cmem), version 3.01. User guide. Centre for environmental research and technology. University of California, Riverside, 1070, 1580.
- Chamberlin, R., Swanson, B., Talbot, E., Dumont, J., & Pesci, S. (2011). Analysis of MOVES and CMEM for evaluating the emissions impact of an intersection control change (No. 11-0673).
- Smit, R., Ormerod, R., & Bridge, I. (2002). Vehicle emission models and their application-Emission inventories. Clean Air and Environmental Quality, 36(1), 30-34.
- Perugu, H. (2019). Emission modelling of light-duty vehicles in India using the revamped VSP-based MOVES model: The case study of Hyderabad. Transportation Research Part D: Transport and Environment, 68, 150-163. [CrossRef]
- Ahn, K., Rakha, H., Trani, A., & Van Aerde, M. (2002). Estimating vehicle fuel consumption and emissions based on instantaneous speed and acceleration levels. Journal of transportation engineering, 128(2), 182-190. [CrossRef]
- Rakha, H., & Ding, Y. (2003). Impact of stops on vehicle fuel consumption and emissions. Journal of transportation engineering, 129(1), 23-32. [CrossRef]
- Panis, L. I., Broekx, S., & Liu, R. (2006). Modelling instantaneous traffic emission and the influence of traffic speed limits. Science of the total environment, 371(1-3), 270-285. [CrossRef]
- Dias, H. L. F., Bertoncini, B. V., Oliveira, M. L. M. D., Cavalcante, F. S. Á., & Lima, E. P. (2017). Analysis of emission models integrated with traffic models for freight transportation study in urban areas. International Journal of Environmental Technology and Management, 20(1-2), 60-77.
- Borge García, R., Quaassdorff, C. V., Pérez Rodríguez, J., Paz Martín, D. D. L., Lumbreras Martin, J., Andrés Almeida, J. M. D., ... & Rodríguez Hurtado, M. E. (2015). Development of road traffic emission inventories for urban air quality modeling in Madrid (Spain).
- Quaassdorff, C., Borge, R., Pérez, J., Lumbreras, J., de la Paz, D., & de Andrés, J. M. (2016). Microscale traffic simulation and emission estimation in a heavily trafficked roundabout in Madrid (Spain). Science of the Total Environment, 566, 416-427. [CrossRef]
- Yang, Y., Zhao, H., & Jiang, H. (2010). Drive train design and modeling of a parallel diesel hybrid electric bus based on AVL/cruise. World Electric Vehicle Journal, 4(1), 75-81. [CrossRef]
- Ilimbetov, R. Y., Popov, V. V., & Vozmilov, A. G. (2015). Comparative Analysis of “NGTU–Electro” Electric Car Movement Processes Modeling in MATLAB Simulink and AVL Cruise Software. Procedia engineering, 129, 879-885.
- Srinivasan, P. (2009). Performance fuel economy and CO 2 prediction of a vehicle using AVL Cruise simulation techniques (No. 2009-01-1862). SAE Technical Paper.
- Cioroianu, C. C., Marinescu, D. G., Iorga, A., & Sibiceanu, A. R. (2017, October). Simulation of an electric vehicle model on the new WLTC test cycle using AVL CRUISE software. In IOP Conference Series: Materials Science and Engineering (Vol. 252, No. 1, p. 012060). IOP Publishing. [CrossRef]
- Wang, B. H., & Luo, Y. G. (2010, October). AVL cruise-based modeling and simulation of EQ6110 hybrid electric public bus. In 2010 International Conference on Computer Application and System Modeling (ICCASM 2010) (Vol. 7, pp. V7-252). IEEE.
- O'Driscoll, R., ApSimon, H. M., Oxley, T., Molden, N., Stettler, M. E., & Thiyagarajah, A. (2016). A Portable Emissions Measurement System (PEMS) study of NOx and primary NO2 emissions from Euro 6 diesel passenger cars and comparison with COPERT emission factors. Atmospheric environment, 145, 81-91. [CrossRef]
- Information related to COPERT emission model from the website: https://www.emisia.com/utilities/copert/, (Accesed on: 10.04.2023).
- Ozguven, E. E., Ozbay, K., & Iyer, S. (2013). A simplified emissions estimation methodology based on MOVES to estimate vehicle emissions from transportation assignment and simulation models. In 92nd Annual Meeting of the Transportation Research Board, Washington, DC.
- Information related to MOVES emission model from the website: https://www.epa.gov/moves, (Accesed on: 10.04.2023).
- Koupal, J., Michaels, H., Cumberworth, M., Bailey, C., & Brzezinski, D. (2002, April). EPA's plan for MOVES: a comprehensive mobile source emissions model. In Proceedings of the 12th CRC On-Road Vehicle Emissions Workshop, San Diego, CA (pp. 15-17).
- Wyatt, D. W., Li, H., & Tate, J. E. (2014). The impact of road grade on carbon dioxide (CO2) emission of a passenger vehicle in real-world driving. Transportation Research Part D: Transport and Environment, 32, 160-170. [CrossRef]
- Information related to PHEM emission model from the website: https://sumo.dlr.de/docs/Models/Emissions/PHEMlight.html, (Accesed on: 10.04.2023).
- Information related to CMEM emission model from the website: https://www.cert.ucr.edu/cmem, (Accesed on: 10.04.2023).
- De Coensel, B., Can, A., Degraeuwe, B., De Vlieger, I., & Botteldooren, D. (2012). Effects of traffic signal coordination on noise and air pollutant emissions. Environmental Modelling & Software, 35, 74-83. [CrossRef]
- Ligterink, N. E., De Lange, R., & Schoen, E. (2009, June). Refined vehicle and driving-behaviour dependencies in the VERSIT+ emission model. In ETAPP symposium (pp. 1-8).
- Rakha, H., Ahn, K., & Trani, A. (2003). Comparison of MOBILE5a, MOBILE6, VT-MICRO, and CMEM models for estimating hot-stabilized light-duty gasoline vehicle emissions. Canadian Journal of Civil Engineering, 30(6), 1010-1021. [CrossRef]
- Rakha, H., Ahn, K., & Trani, A. (2004). Development of VT-Micro model for estimating hot stabilized light duty vehicle and truck emissions. Transportation Research Part D: Transport and Environment, 9(1), 49-74. [CrossRef]
- Šarić, A.; Sulejmanović, S.; Albinović, S.; Pozder, M.; Ljevo, Ž. The Role of Intersection Geometry in Urban Air Pollution Management. Sustainability 2023, 15, 5234. [CrossRef]
- Ajtay, D., & Weilenmann, M. (2004). Static and dynamic instantaneous emission modelling. International Journal of Environment and Pollution, 22(3), 226-239. [CrossRef]
- Saharidis, G. K., & Konstantzos, G. E. (2018). Critical overview of emission calculation models in order to evaluate their potential use in estimation of Greenhouse Gas emissions from in port truck operations. Journal of Cleaner Production, 185, 1024-1031. [CrossRef]
- Bai, S., Eisinger, D., & Niemeier, D. (2009, January). MOVES vs. EMFAC: A comparison of greenhouse gas emissions using Los Angeles County. In Transportation Research Board 88th Annual Meeting, Paper (pp. 09-0692).
- Shah, S. D., Johnson, K. C., Miller, J. W., & Cocker III, D. R. (2006). Emission rates of regulated pollutants from on-road heavy-duty diesel vehicles. Atmospheric Environment, 40(1), 147-153.
- Boulter, P. G., McCrae, I. S., & Barlow, T. J. (2007). A review of instantaneous emission models for road vehicles.
- Esteves-Booth, A., Muneer, T., Kubie, J., & Kirby, H. (2002). A review of vehicular emission models and driving cycles. Proceedings of the Institution of Mechanical Engineers, Part C: Journal of Mechanical Engineering Science, 216(8), 777-797. [CrossRef]
- Colberg, C. A., Tona, B., Stahel, W. A., Meier, M., & Staehelin, J. (2005). Comparison of a road traffic emission model (HBEFA) with emissions derived from measurements in the Gubrist road tunnel, Switzerland. Atmospheric Environment, 39(26), 4703-4714. [CrossRef]
- Borge, R., de Miguel, I., de la Paz, D., Lumbreras, J., Pérez, J., & Rodríguez, E. (2012). Comparison of road traffic emission models in Madrid (Spain). Atmospheric Environment, 62, 461-471. [CrossRef]
- Information related to HBEFA emission model from the website: https://www.hbefa.net/e/index.html, (Accesed on: 11.04.2023).
- H. Khan, Z., Imran, W., Azeem, S., S. Khattak, K., Gulliver, T. A., & Aslam, M. S. (2019). A macroscopic traffic model based on driver reaction and traffic stimuli. Applied Sciences, 9(14), 2848.
- Lee, H. K., Lee, H. W., & Kim, D. (2001). Macroscopic traffic models from microscopic car-following models. Physical Review E, 64(5), 056126. [CrossRef]
- Krivda, V., Petru, J., Macha, D., & Novak, J. (2021). Use of microsimulation traffic models as means for ensuring public transport sustainability and accessibility. Sustainability, 13(5), 2709. [CrossRef]
- Ferrara, A., Sacone, S., Siri, S., Ferrara, A., Sacone, S., & Siri, S. (2018). Microscopic and mesoscopic traffic models. Freeway traffic modelling and control, 113-143.
- Ma, X., Jin, J., & Lei, W. (2014). Multi-criteria analysis of optimal signal plans using microscopic traffic models. Transportation Research Part D: Transport and Environment, 32, 1-14. [CrossRef]
- Marsden, G., Bell, M., & Reynolds, S. (2001). Towards a real-time microscopic emissions model. Transportation Research Part D: Transport and Environment, 6(1), 37-60.
- Kim, M., & Cho, G. H. (2020). Influence of evacuation policy on clearance time under large-scale chemical accident: an agent-based modeling. International Journal of Environmental Research and Public Health, 17(24), 9442. [CrossRef]
- Alghamdi, T., Mostafi, S., Abdelkader, G., & Elgazzar, K. (2022). A comparative study on traffic modeling techniques for predicting and simulating traffic behavior. Future Internet, 14(10), 294. [CrossRef]
- Li, M., Luo, D., Liu, B., Zhang, X., Liu, Z., & Li, M. (2022). Arterial coordination control optimization based on AM–BAND–PBAND model. Sustainability, 14(16), 10065.
- Olaverri-Monreal, C., Errea-Moreno, J., Díaz-Álvarez, A., Biurrun-Quel, C., Serrano-Arriezu, L., & Kuba, M. (2018). Connection of the SUMO microscopic traffic simulator and the unity 3D game engine to evaluate V2X communication-based systems. Sensors, 18(12), 4399. [CrossRef]
- Cárdenas-Benítez, N., Aquino-Santos, R., Magaña-Espinoza, P., Aguilar-Velazco, J., Edwards-Block, A., & Medina Cass, A. (2016). Traffic congestion detection system through connected vehicles and big data. Sensors, 16(5), 599. [CrossRef]
- Schweizer, J., Poliziani, C., Rupi, F., Morgano, D., & Magi, M. (2021). Building a large-scale micro-simulation transport scenario using big data. ISPRS International Journal of Geo-Information, 10(3), 165. [CrossRef]
- Kővári, B., Szőke, L., Bécsi, T., Aradi, S., & Gáspár, P. (2021). Traffic signal control via reinforcement learning for reducing global vehicle emission. Sustainability, 13(20), 11254.
- Chen, C., Zhao, X., Liu, H., Ren, G., Zhang, Y., & Liu, X. (2019). Assessing the influence of adverse weather on traffic flow characteristics using a driving simulator and VISSIM. Sustainability, 11(3), 830. [CrossRef]
- Ziemska-Osuch, M., & Osuch, D. (2022). Modeling the assessment of intersections with traffic lights and the significance level of the number of pedestrians in microsimulation models based on the PTV Vissim tool. Sustainability, 14(14), 8945. [CrossRef]
- Nalic, D., Pandurevic, A., Eichberger, A., Fellendorf, M., & Rogic, B. (2021). Software framework for testing of automated driving systems in the traffic environment of vissim. Energies, 14(11), 3135. [CrossRef]
- Severino, A., Pappalardo, G., Curto, S., Trubia, S., & Olayode, I. O. (2021). Safety evaluation of flower roundabout considering autonomous vehicles operation. Sustainability, 13(18), 10120. [CrossRef]
- Campisi T., Mądziel M., Nikiforiadis A., Basbas S., Tesoriere G. (2021) An Estimation of Emission Patterns from Vehicle Traffic Highlighting Decarbonisation Effects from Increased e-fleet in Areas Surrounding the City of Rzeszow (Poland). In: Gervasi O. et al. (eds) Computational Science and Its Applications – ICCSA 2021. ICCSA 2021. Lecture Notes in Computer Science, vol 12953. Springer, Cham.
- Al-Ahmadi, H. M., Jamal, A., Reza, I., Assi, K. J., & Ahmed, S. A. (2019). Using microscopic simulation-based analysis to model driving behavior: a case study of Khobar-Dammam in Saudi Arabia. Sustainability, 11(11), 3018. [CrossRef]
- Mądziel, M.; Jaworski, A.; Savostin-Kosiak, D.; Lejda, K. The Impact of Exhaust Emission from Combustion Engines on the Environment: Modelling of Vehicle Movement at Roundabouts. International Journal of Automotive and Mechanical Engineering 2020, 17(4), 8360-8371. [CrossRef]
- Ziemska, M. (2021). Exhaust emissions and fuel consumption analysis on the example of an increasing number of hgvs in the port city. Sustainability, 13(13), 7428. [CrossRef]
- Zhou, X., Tanvir, S., Lei, H., Taylor, J., Liu, B., Rouphail, N. M., & Frey, H. C. (2015). Integrating a simplified emission estimation model and mesoscopic dynamic traffic simulator to efficiently evaluate emission impacts of traffic management strategies. Transportation Research Part D: Transport and Environment, 37, 123-136. [CrossRef]
- Abou-Senna, H., Radwan, E., Westerlund, K., & Cooper, C. D. (2013). Using a traffic simulation model (VISSIM) with an emissions model (MOVES) to predict emissions from vehicles on a limited-access highway. Journal of the Air & Waste Management Association, 63(7), 819-831.
- Rodriguez-Rey, D., Guevara, M., Linares, M. P., Casanovas, J., Salmerón, J., Soret, A., ... & García-Pando, C. P. (2021). A coupled macroscopic traffic and pollutant emission modelling system for Barcelona. Transportation Research Part D: Transport and Environment, 92, 102725. [CrossRef]
- Samaras, C., Tsokolis, D., Toffolo, S., Magra, G., Ntziachristos, L., & Samaras, Z. (2019). Enhancing average speed emission models to account for congestion impacts in traffic network link-based simulations. Transportation Research Part D: Transport and Environment, 75, 197-210. [CrossRef]
- Mangones, S. C., Jaramillo, P., Fischbeck, P., & Rojas, N. Y. (2019). Development of a high-resolution traffic emission model: Lessons and key insights from the case of Bogotá, Colombia. Environmental Pollution, 253, 552-559. [CrossRef]
- Macedo, E., Tomás, R., Fernandes, P., Coelho, M. C., & Bandeira, J. M. (2020). Quantifying road traffic emissions embedded in a multi-objective traffic assignment model. Transportation Research Procedia, 47, 648-655. [CrossRef]
- Fan, J., Gao, K., Xing, Y., & Lu, J. (2019). Evaluating the effects of one-way traffic management on different vehicle exhaust emissions using an integrated approach. Journal of Advanced Transportation, 2019, 1-11. [CrossRef]
- Rodriguez-Rey, D., Guevara, M., Linares, M. P., Casanovas, J., Armengol, J. M., Benavides, J., ... & García-Pando, C. P. (2022). To what extent the traffic restriction policies applied in Barcelona city can improve its air quality?. Science of the Total Environment, 807, 150743. tps://doi.org/10.1016/j.scitotenv.2021.150743.
- Overtoom, I., Correia, G., Huang, Y., & Verbraeck, A. (2020). Assessing the impacts of shared autonomous vehicles on congestion and curb use: A traffic simulation study in The Hague, Netherlands. International journal of transportation science and technology, 9(3), 195-206. [CrossRef]
- Mądziel, M., & Campisi, T. (2023). Investigation of Vehicular Pollutant Emissions at 4-Arm Intersections for the Improvement of Integrated Actions in the Sustainable Urban Mobility Plans (SUMPs). Sustainability, 15(3), 1860. [CrossRef]
- Gao, J., Chen, H., Dave, K., Chen, J., & Jia, D. (2020). Fuel economy and exhaust emissions of a diesel vehicle under real traffic conditions. Energy Science & Engineering, 8(5), 1781-1792. [CrossRef]
- Adamidis, F. K., Mantouka, E. G., & Vlahogianni, E. I. (2020). Effects of controlling aggressive driving behavior on network-wide traffic flow and emissions. International journal of transportation science and technology, 9(3), 263-276. [CrossRef]
- Saedi, R., Verma, R., Zockaie, A., Ghamami, M., & Gates, T. J. (2020). Comparison of support vector and non-linear regression models for estimating large-scale vehicular emissions, incorporating network-wide fundamental diagram for heterogeneous vehicles. Transportation Research Record, 2674(5), 70-84. [CrossRef]
- Gräbe, R. J., & Joubert, J. W. (2022). Are we getting vehicle emissions estimation right?. Transportation Research Part D: Transport and Environment, 112, 103477.
- Fernandes, P., Bandeira, J. M., & Coelho, M. C. (2021). A macroscopic approach for assessing the environmental performance of shared, automated, electric mobility in an intercity corridor. Journal of Intelligent Transportation Systems, 1-17. [CrossRef]
- Jiang, Y., Ding, Z., Zhou, J., Wu, P., & Chen, B. (2022). Estimation of traffic emissions in a polycentric urban city based on a macroscopic approach. Physica A: Statistical Mechanics and its Applications, 602, 127391. [CrossRef]
- Chen, C., Zhao, X., Liu, H., Ren, G., Zhang, Y., & Liu, X. (2019). Assessing the influence of adverse weather on traffic flow characteristics using a driving simulator and VISSIM. Sustainability, 11(3), 830. [CrossRef]
- Ziemska-Osuch, M., & Osuch, D. (2022). Modeling the assessment of intersections with traffic lights and the significance level of the number of pedestrians in microsimulation models based on the PTV Vissim tool. Sustainability, 14(14), 8945. [CrossRef]
- Al-Ahmadi, H. M., Jamal, A., Reza, I., Assi, K. J., & Ahmed, S. A. (2019). Using microscopic simulation-based analysis to model driving behavior: a case study of Khobar-Dammam in Saudi Arabia. Sustainability, 11(11), 3018. [CrossRef]
- Li, S., Xiang, Q., Ma, Y., Gu, X., & Li, H. (2016). Crash risk prediction modeling based on the traffic conflict technique and a microscopic simulation for freeway interchange merging areas. International journal of environmental research and public health, 13(11), 1157. [CrossRef]
- Meiring, G. A. M., & Myburgh, H. C. (2015). A review of intelligent driving style analysis systems and related artificial intelligence algorithms. Sensors, 15(12), 30653-30682. [CrossRef]
- Nai, W., Yang, Z., Wei, Y., Sang, J., Wang, J., Wang, Z., & Mo, P. (2022). A comprehensive review of driving style evaluation approaches and product designs applied to vehicle usage-based insurance. Sustainability, 14(13), 7705. [CrossRef]
- Paszkowski, J., Herrmann, M., Richter, M., & Szarata, A. (2021). Modelling the effects of traffic-calming introduction to volume–delay functions and traffic assignment. Energies, 14(13), 3726. [CrossRef]
- Deluka Tibljaš, A., Giuffrè, T., Surdonja, S., & Trubia, S. (2018). Introduction of Autonomous Vehicles: Roundabouts design and safety performance evaluation. Sustainability, 10(4), 1060. [CrossRef]
- Jie, L., Van Zuylen, H., Chen, Y., Viti, F., & Wilmink, I. (2013). Calibration of a microscopic simulation model for emission calculation. Transportation Research Part C: Emerging Technologies, 31, 172-184. [CrossRef]
- Wilmink, I. R., Viti, F., Baalen, J. V., & Li, M. (2009). Emission modelling at signalised intersections using microscopic models.
- Li, J., Van Zuylen, H., Chen, Y., Viti, F., & Wilmink, I. (2009). Optimizing Traffic Control for Emission Reduction: the calibration of the simulation model. In Mobil. TUM 2009-International Scientific Conference on Mobility and Transport-ITS for larger Cities.
- Jie, L., Van Zuylen, H., Chen, Y., Viti, F., & Wilmink, I. (2013). Calibration of a microscopic simulation model for emission calculation. Transportation Research Part C: Emerging Technologies, 31, 172-184. [CrossRef]
- Nesamani, K. S., Chu, L., McNally, M. G., & Jayakrishnan, R. (2007). Estimation of vehicular emissions by capturing traffic variations. Atmospheric Environment, 41(14), 2996-3008. [CrossRef]
- Hirschmann, K., Zallinger, M., Fellendorf, M., & Hausberger, S. (2010, September). A new method to calculate emissions with simulated traffic conditions. In 13th International IEEE Conference on Intelligent Transportation Systems (pp. 33-38). IEEE.
- da Rocha, T. V., Leclercq, L., Montanino, M., Parzani, C., Punzo, V., Ciuffo, B., & Villegas, D. (2015). Does traffic-related calibration of car-following models provide accurate estimations of vehicle emissions?. Transportation research part D: Transport and Environment, 34, 267-280. [CrossRef]
- Kim, J., Kim, J. H., Lee, G., Shin, H. J., & Park, J. H. (2020). Microscopic traffic simulation calibration level for reliable estimation of vehicle emissions. Journal of Advanced Transportation, 2020, 1-13. [CrossRef]
- Swidan, H. (2011). Integrating AIMSUN Micro Simulation Model with Portable Emissions Measurement System (PEMS): Calibration and Validation Case Study.
- Sánchez, J. M., Ortega, E., Lopez-Lambas, M. E., & Martín, B. (2021). Evaluation of emissions in traffic reduction and pedestrianization scenarios in Madrid. Transportation research part D: transport and environment, 100, 103064. [CrossRef]
- Tomás, R. F., Fernandes, P., Macedo, E., Bandeira, J. M., & Coelho, M. C. (2020). Assessing the emission impacts of autonomous vehicles on metropolitan freeways. Transportation Research Procedia, 47, 617-624. [CrossRef]
- Garcia-Castro, A., Monzon, A., Valdes, C., & Romana, M. (2017). Modeling different penetration rates of eco-driving in urban areas: Impacts on traffic flow and emissions. International Journal of Sustainable Transportation, 11(4), 282-294. [CrossRef]
- Liao, R.; Chen, X.; Yu, L.; Sun, X. Analysis of Emission Effects Related to Drivers’ Compliance Rates for Cooperative Vehicle-Infrastructure System at Signalized Intersections. Int. J. Environ. Res. Public Health 2018, 15, 122. [CrossRef]
- Zhai, Z., Tu, R., Xu, J., Wang, A., & Hatzopoulou, M. (2020). Capturing the variability in instantaneous vehicle emissions based on field test data. Atmosphere, 11(7), 765. [CrossRef]
- Mądziel, M.; Jaworski, A.; Kuszewski, H.; Woś, P.; Campisi, T.; Lew, K. The Development of CO2 Instantaneous Emission Model of Full Hybrid Vehicle with the Use of Machine Learning Techniques. Energies 2022, 15, 142. [CrossRef]
- Wen, H. T., Lu, J. H., & Jhang, D. S. (2021). Features Importance Analysis of Diesel Vehicles’ NOx and CO2 Emission Predictions in Real Road Driving Based on Gradient Boosting Regression Model. International Journal of Environmental Research and Public Health, 18(24), 13044. [CrossRef]
- Chen, C., Zhao, X., Liu, H., Ren, G., Zhang, Y., & Liu, X. (2019). Assessing the influence of adverse weather on traffic flow characteristics using a driving simulator and VISSIM. Sustainability, 11(3), 830. [CrossRef]
- Al-Ahmadi, H. M., Jamal, A., Reza, I., Assi, K. J., & Ahmed, S. A. (2019). Using microscopic simulation-based analysis to model driving behavior: a case study of Khobar-Dammam in Saudi Arabia. Sustainability, 11(11), 3018. [CrossRef]
- Shao, Y., Han, X., Wu, H., & G. Claudel, C. (2019). Evaluating signalization and channelization selections at intersections based on an entropy method. Entropy, 21(8), 808. [CrossRef]
- Pielecha, J., Skobiej, K., & Kurtyka, K. (2020). Exhaust emissions and energy consumption analysis of conventional, hybrid, and electric vehicles in real driving cycles. Energies, 13(23), 6423. [CrossRef]
- Asher, Z. D., Galang, A. A., Briggs, W., Johnston, B., Bradley, T. H., & Jathar, S. (2018). Economic and efficient hybrid vehicle fuel economy and emissions modeling using an artificial neural network (No. 2018-01-0315). SAE Technical Paper.
- Abdullah, A. M., Usmani, R. S. A., Pillai, T. R., Marjani, M., & Hashem, I. A. T. (2021). An optimized artificial neural network model using genetic algorithm for prediction of traffic emission concentrations. International Journal of Advanced Computer Science and Applications, 12(6), 794-803. [CrossRef]
- Khurana, S., Saxena, S., Jain, S., & Dixit, A. (2021). Predictive modeling of engine emissions using machine learning: A review. Materials Today: Proceedings, 38, 280-284. [CrossRef]
- Batterman, S., Ganguly, R., & Harbin, P. (2015). High resolution spatial and temporal mapping of traffic-related air pollutants. International Journal of Environmental Research and Public Health, 12(4), 3646-3666. [CrossRef]
- Batterman, S., Ganguly, R., & Harbin, P. (2015). High resolution spatial and temporal mapping of traffic-related air pollutants. International Journal of Environmental Research and Public Health, 12(4), 3646-3666. [CrossRef]
- Mądziel, M.; Campisi, T. Energy Consumption of Electric Vehicles: Analysis of Selected Parameters Based on Created Database. Energies 2023, 16, 1437. [CrossRef]
- Amara-Ouali, Y., Goude, Y., Massart, P., Poggi, J. M., & Yan, H. (2021). A review of electric vehicle load open data and models. Energies, 14(8), 2233. [CrossRef]
- Kubik, A.; Turoń, K.; Folęga, P.; Chen, F. CO2 Emissions—Evidence from Internal Combustion and Electric Engine Vehicles from Car-Sharing Systems. Energies 2023, 16, 2185. [CrossRef]
Figure 1.
General structure of the work.
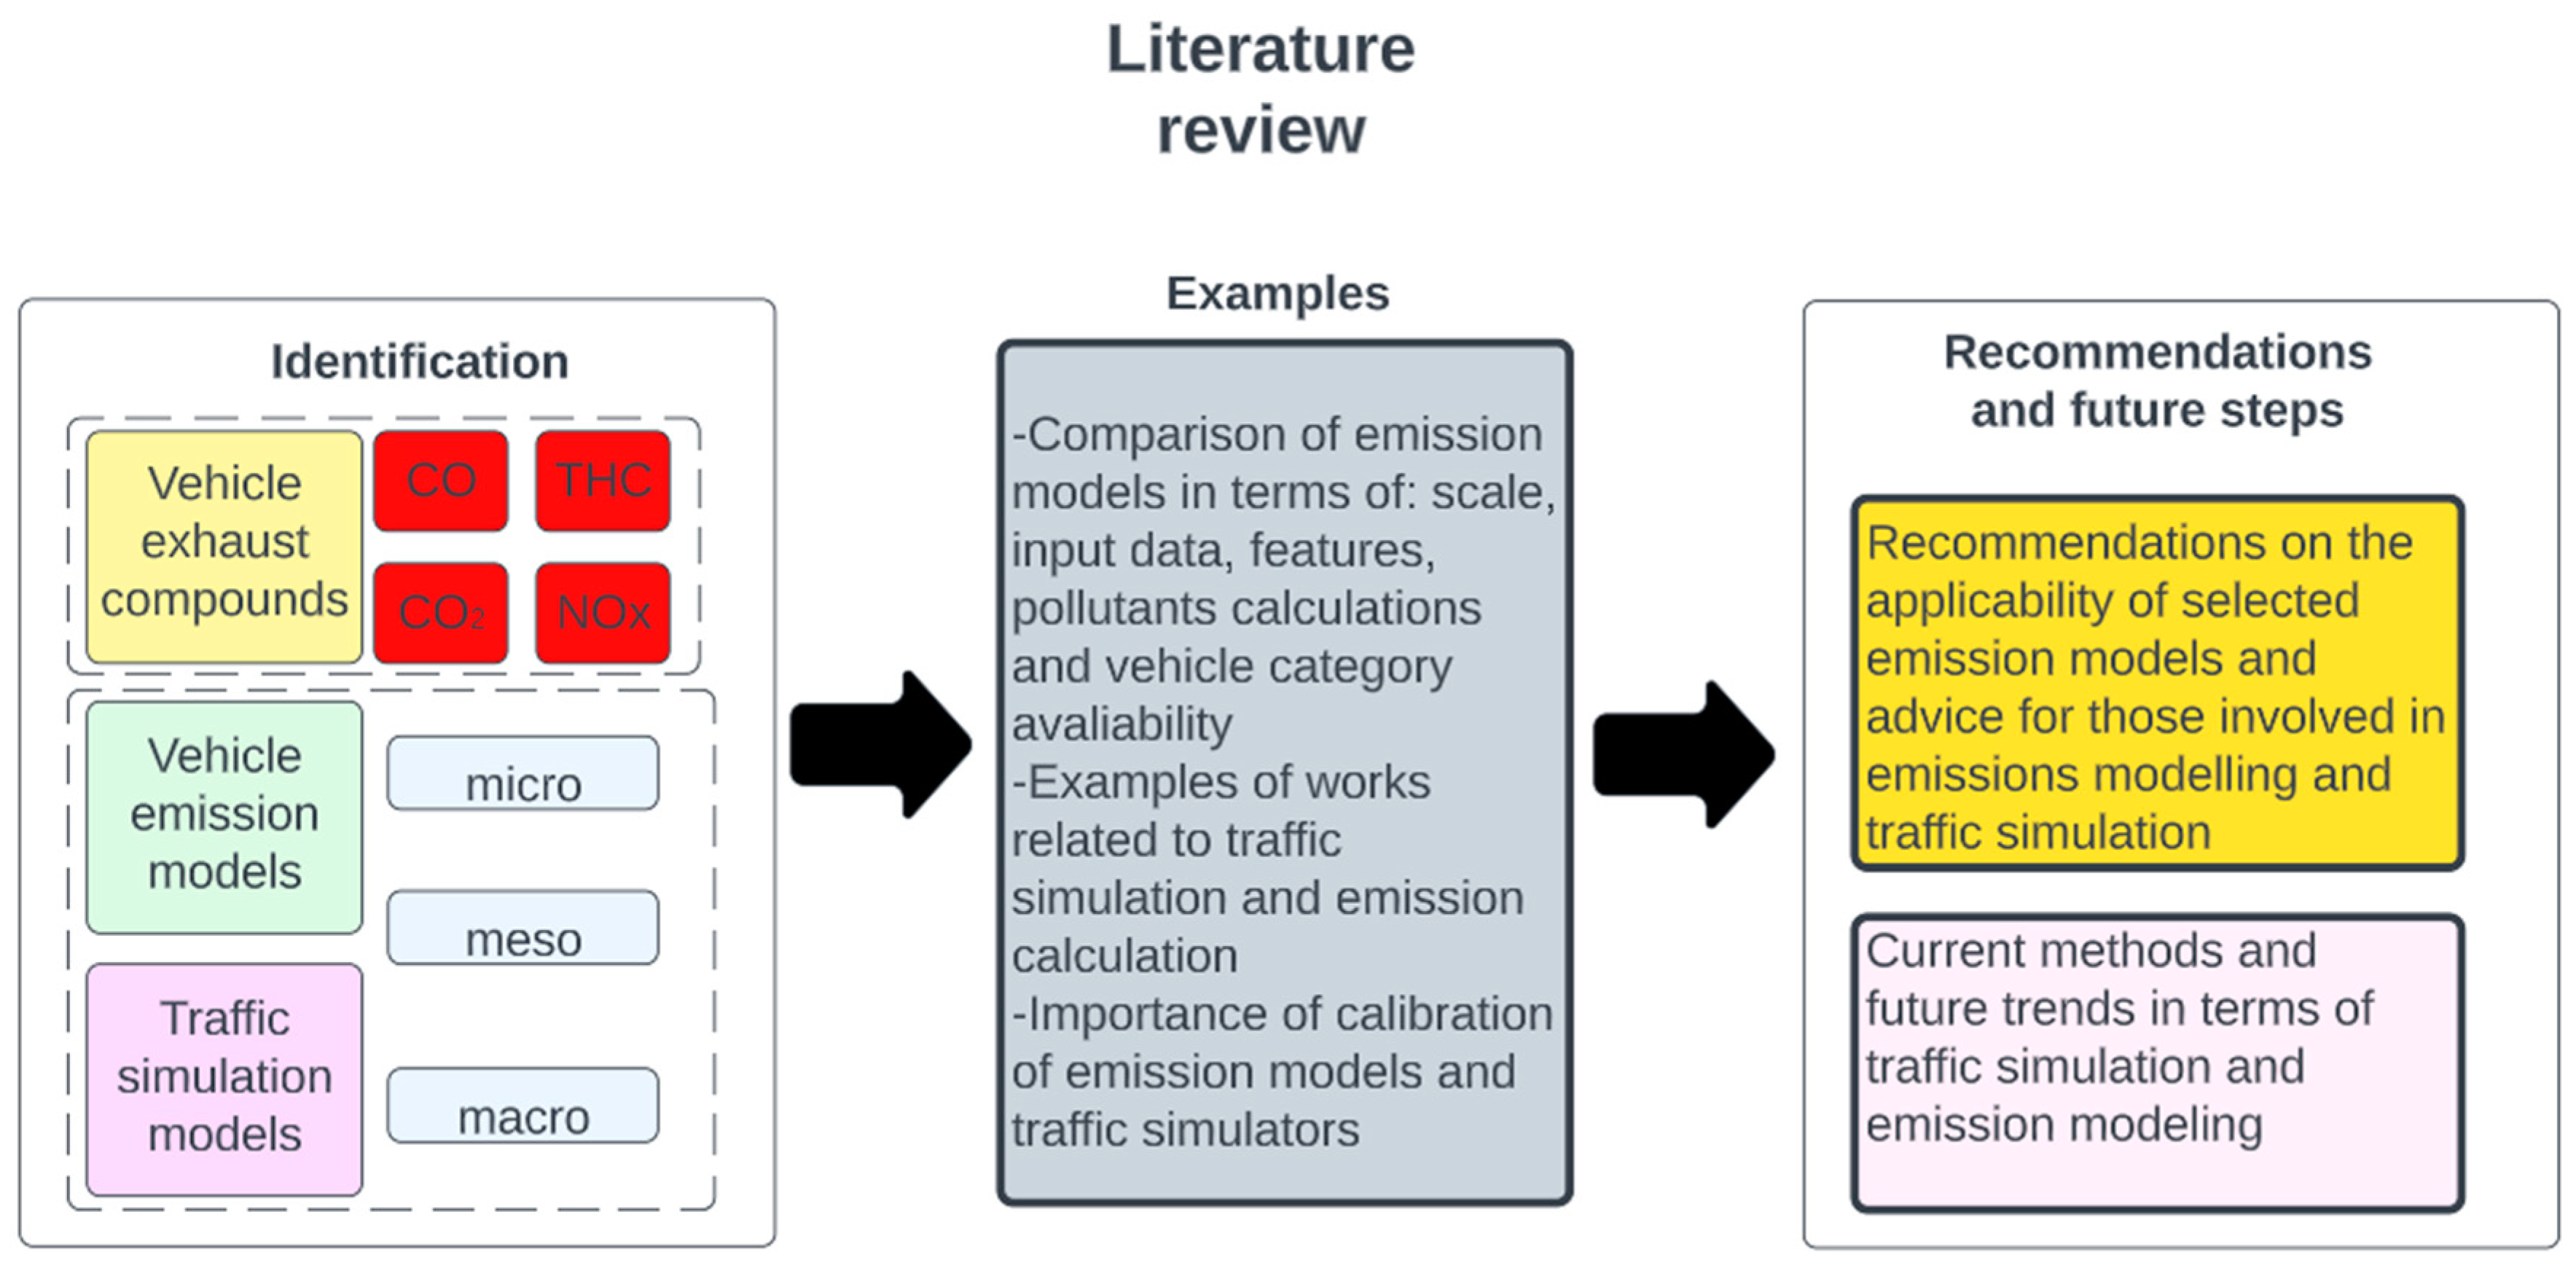
Figure 2.
VOSviewer connection map of keywords related to the described topic, based on data from Web of Science core collection.
Figure 2.
VOSviewer connection map of keywords related to the described topic, based on data from Web of Science core collection.
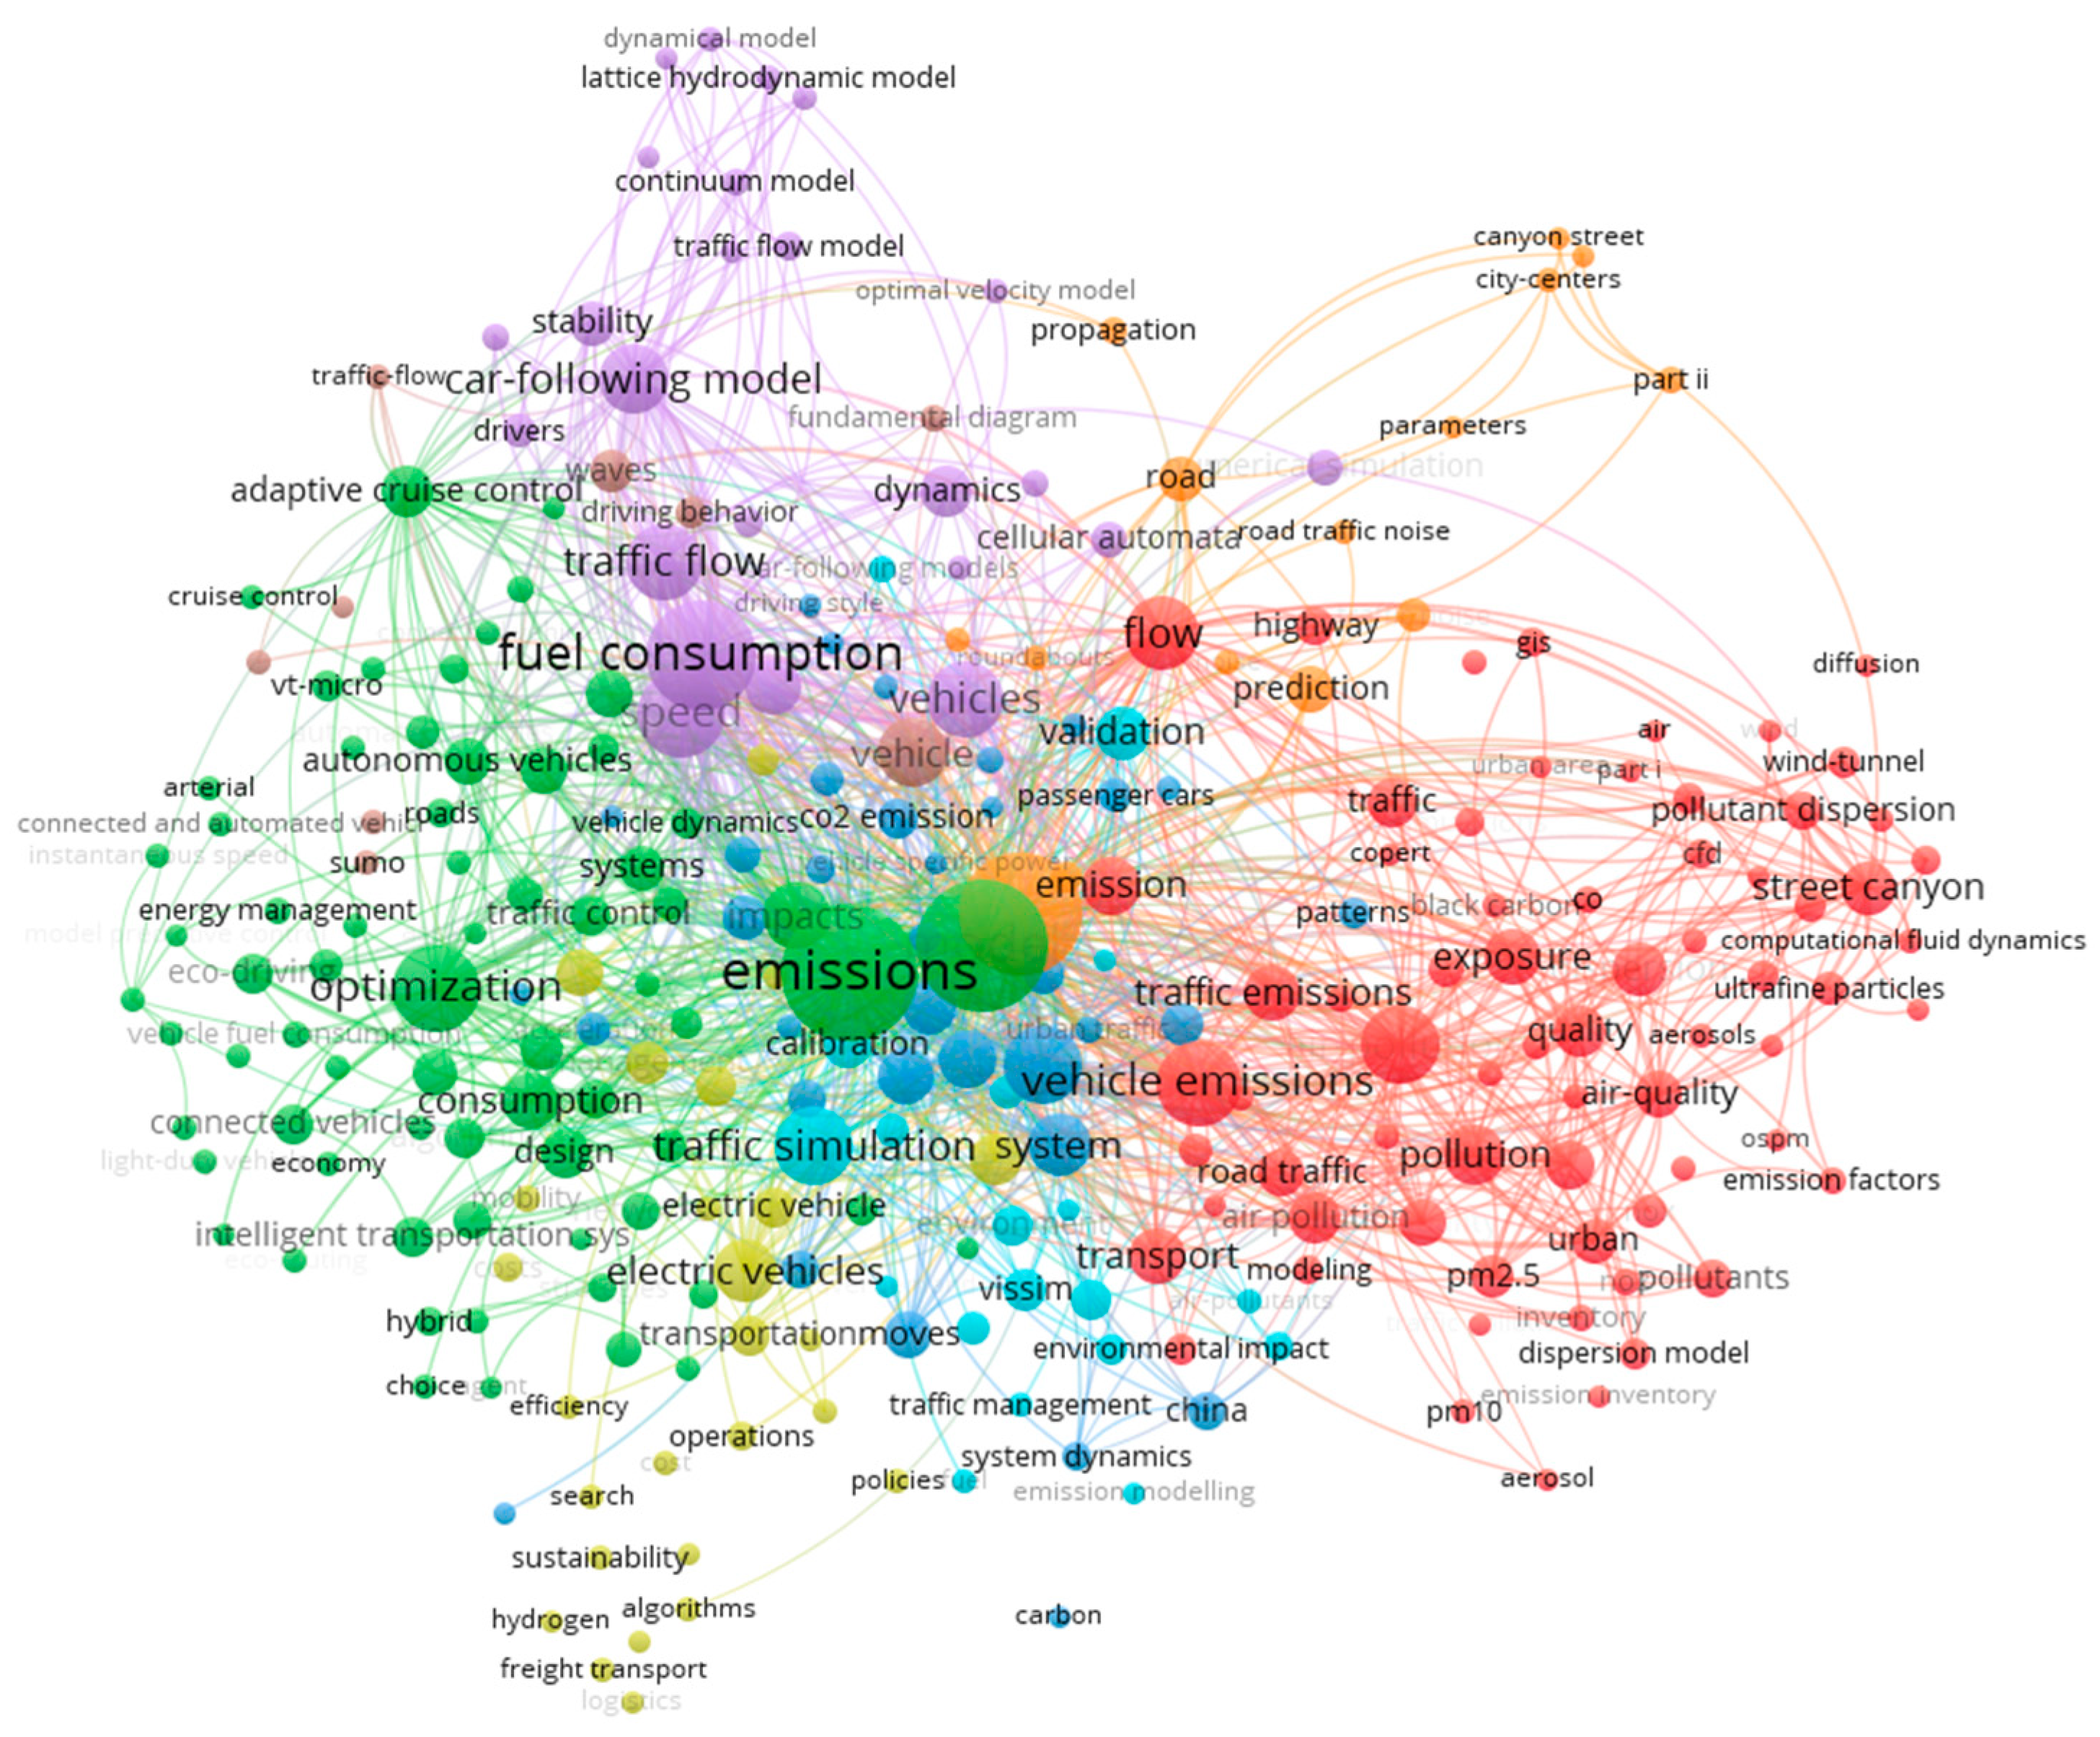
Figure 3.
World map of papers related to the described topic.
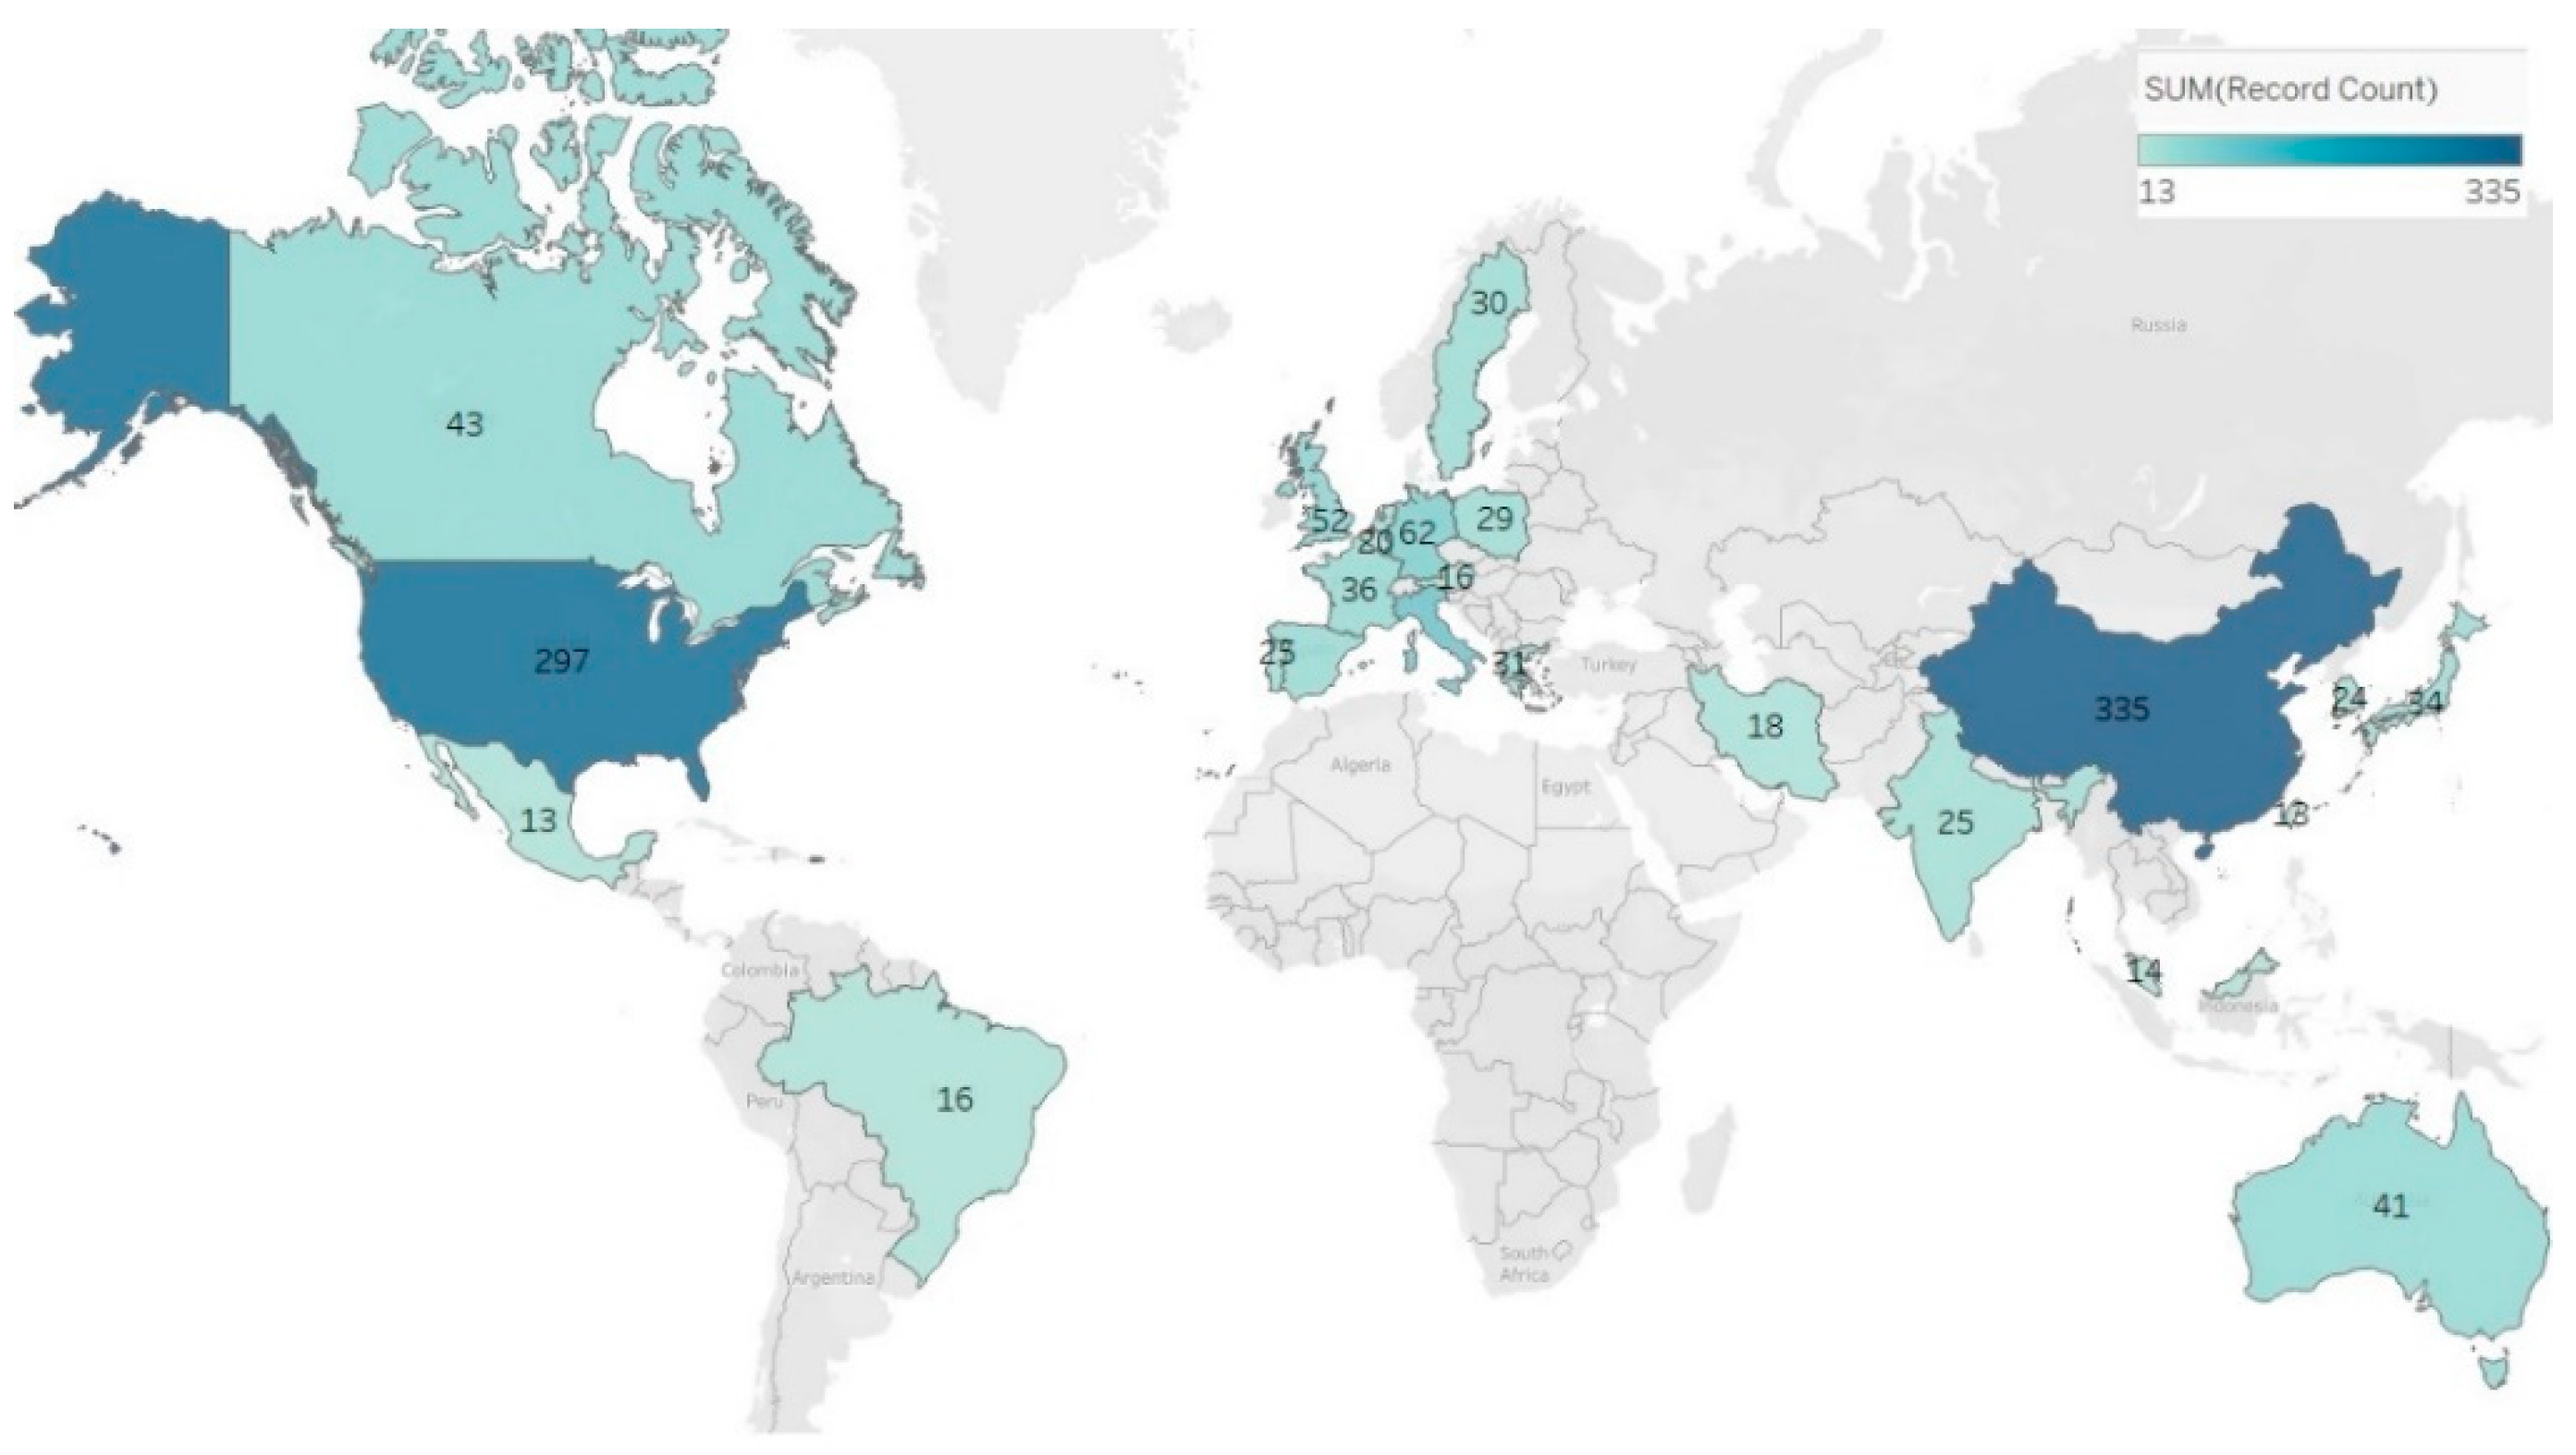
Figure 4.
Number of publications in relation to years related to the described topic.
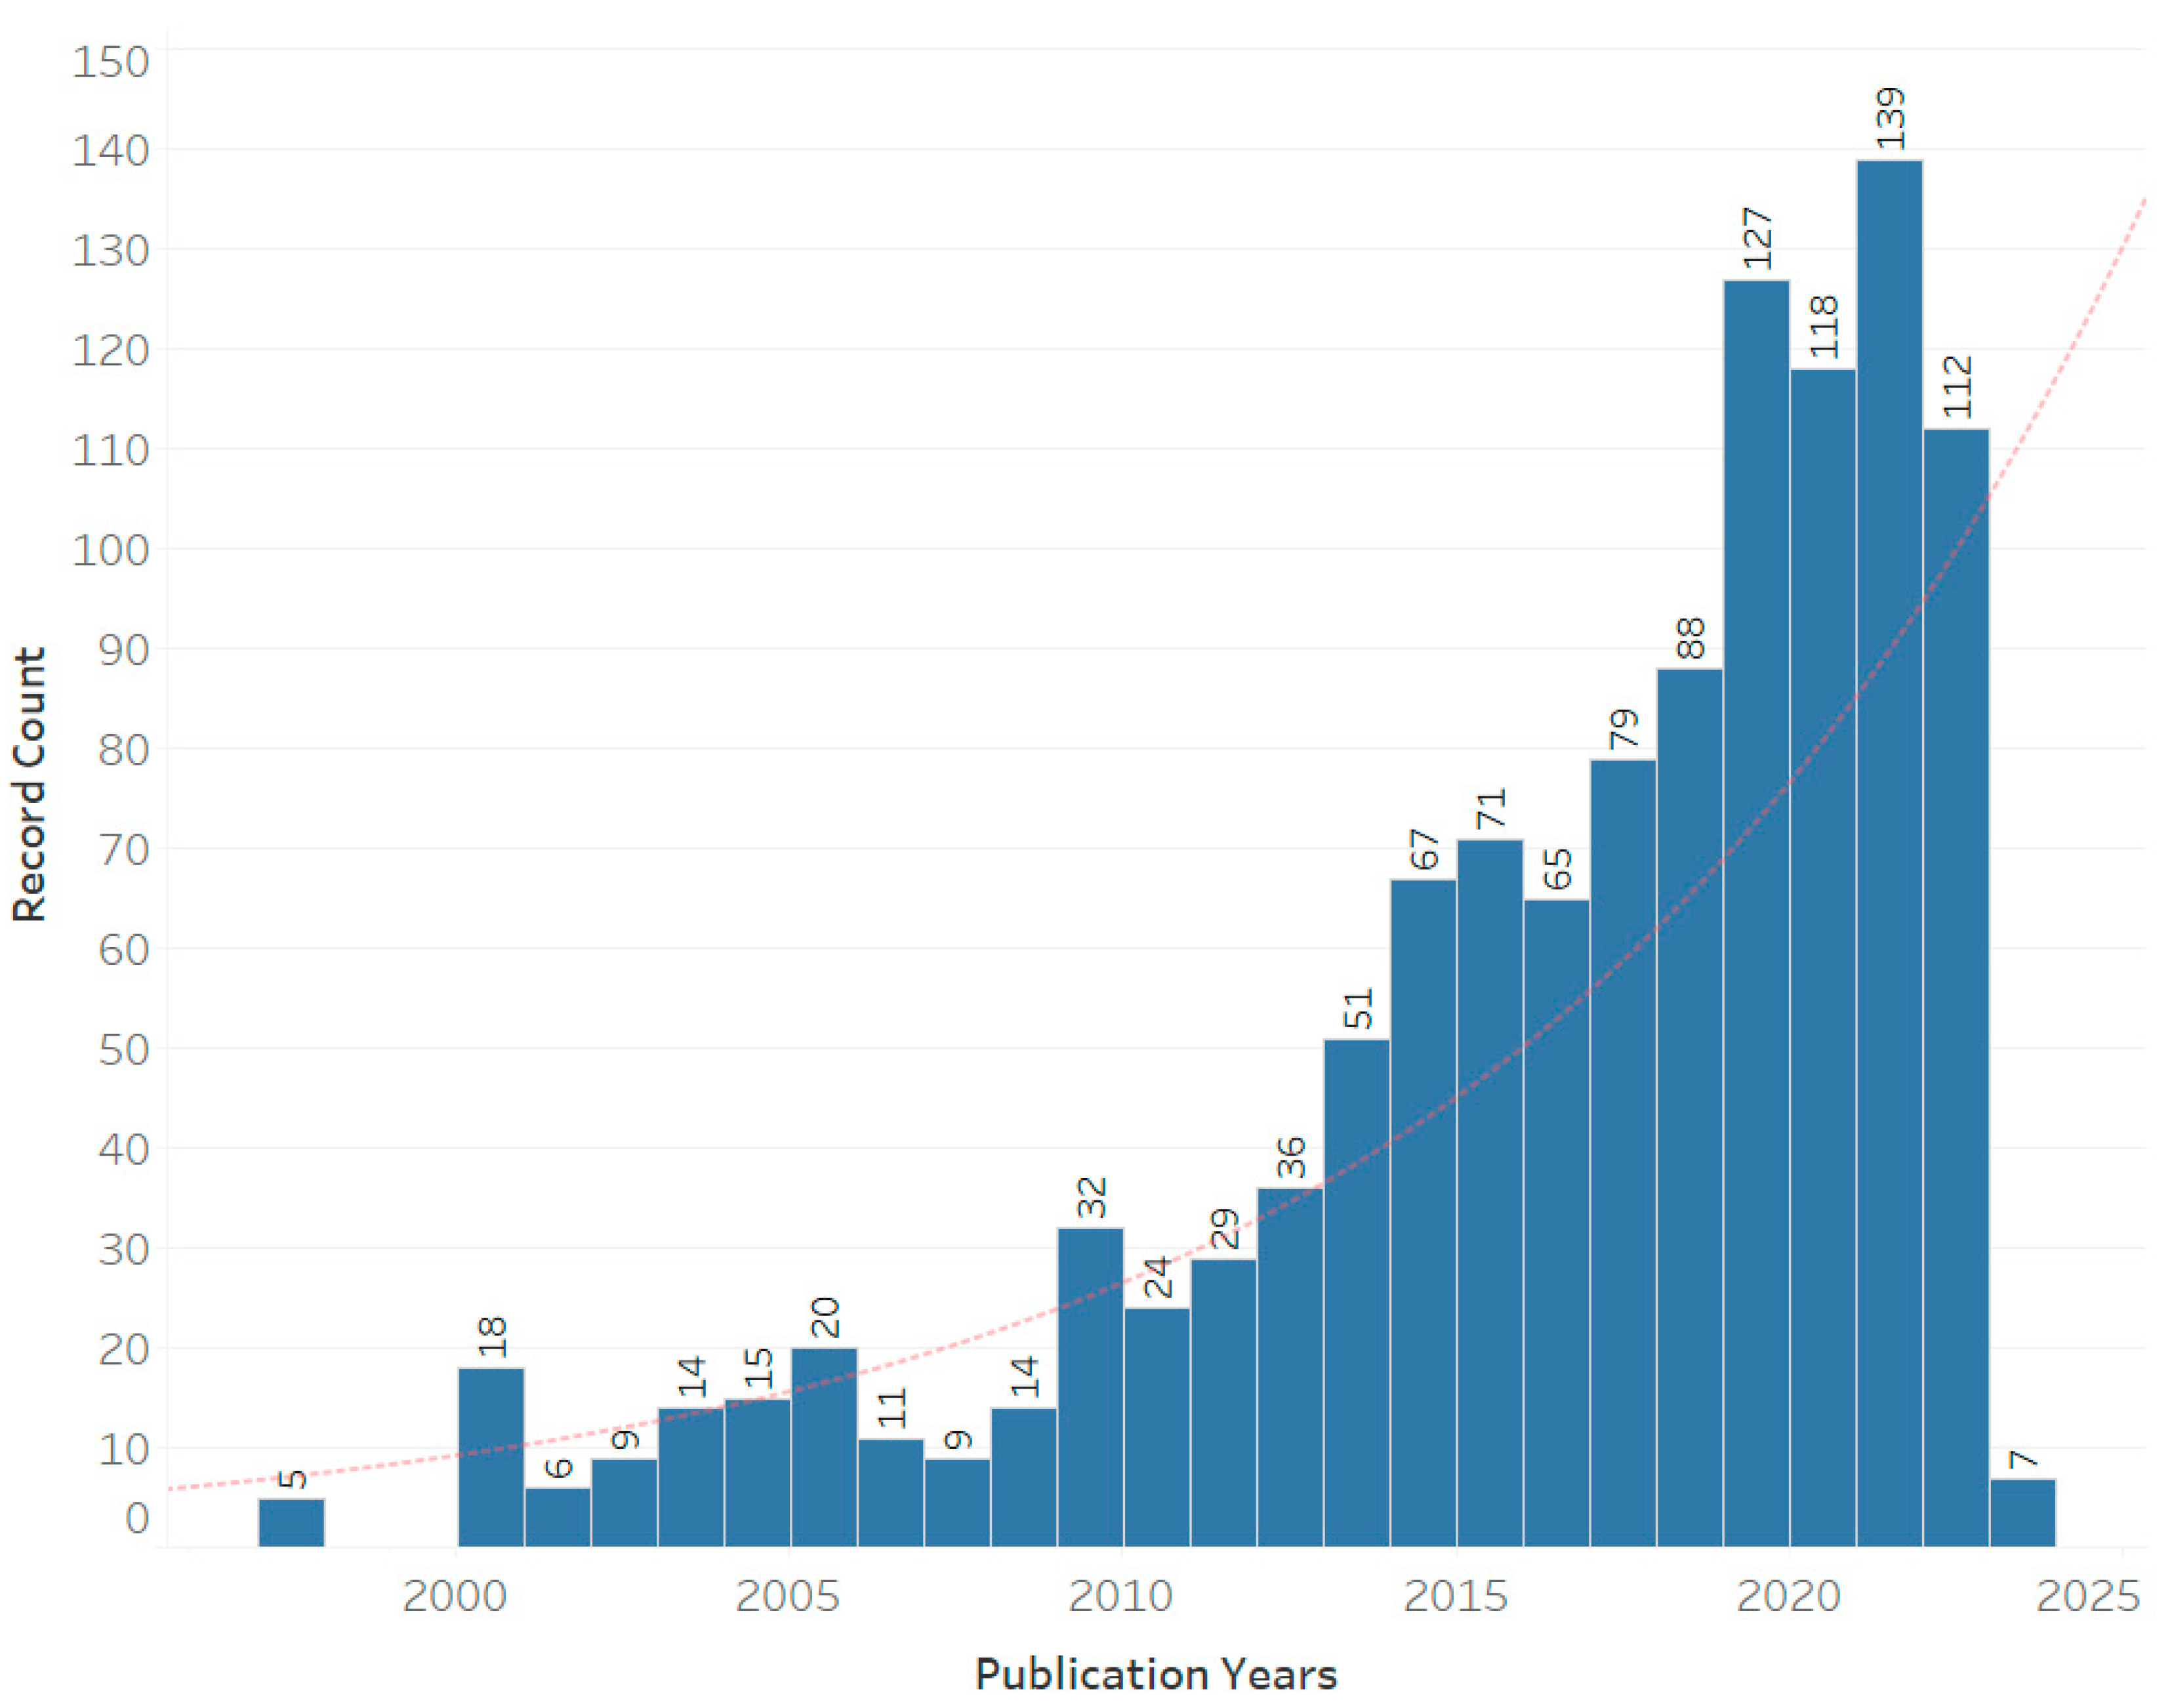
Figure 5.
Representation of the scale of the emission model to use for vehicle traffic models in relation to different scales of detail and input data.
Figure 5.
Representation of the scale of the emission model to use for vehicle traffic models in relation to different scales of detail and input data.
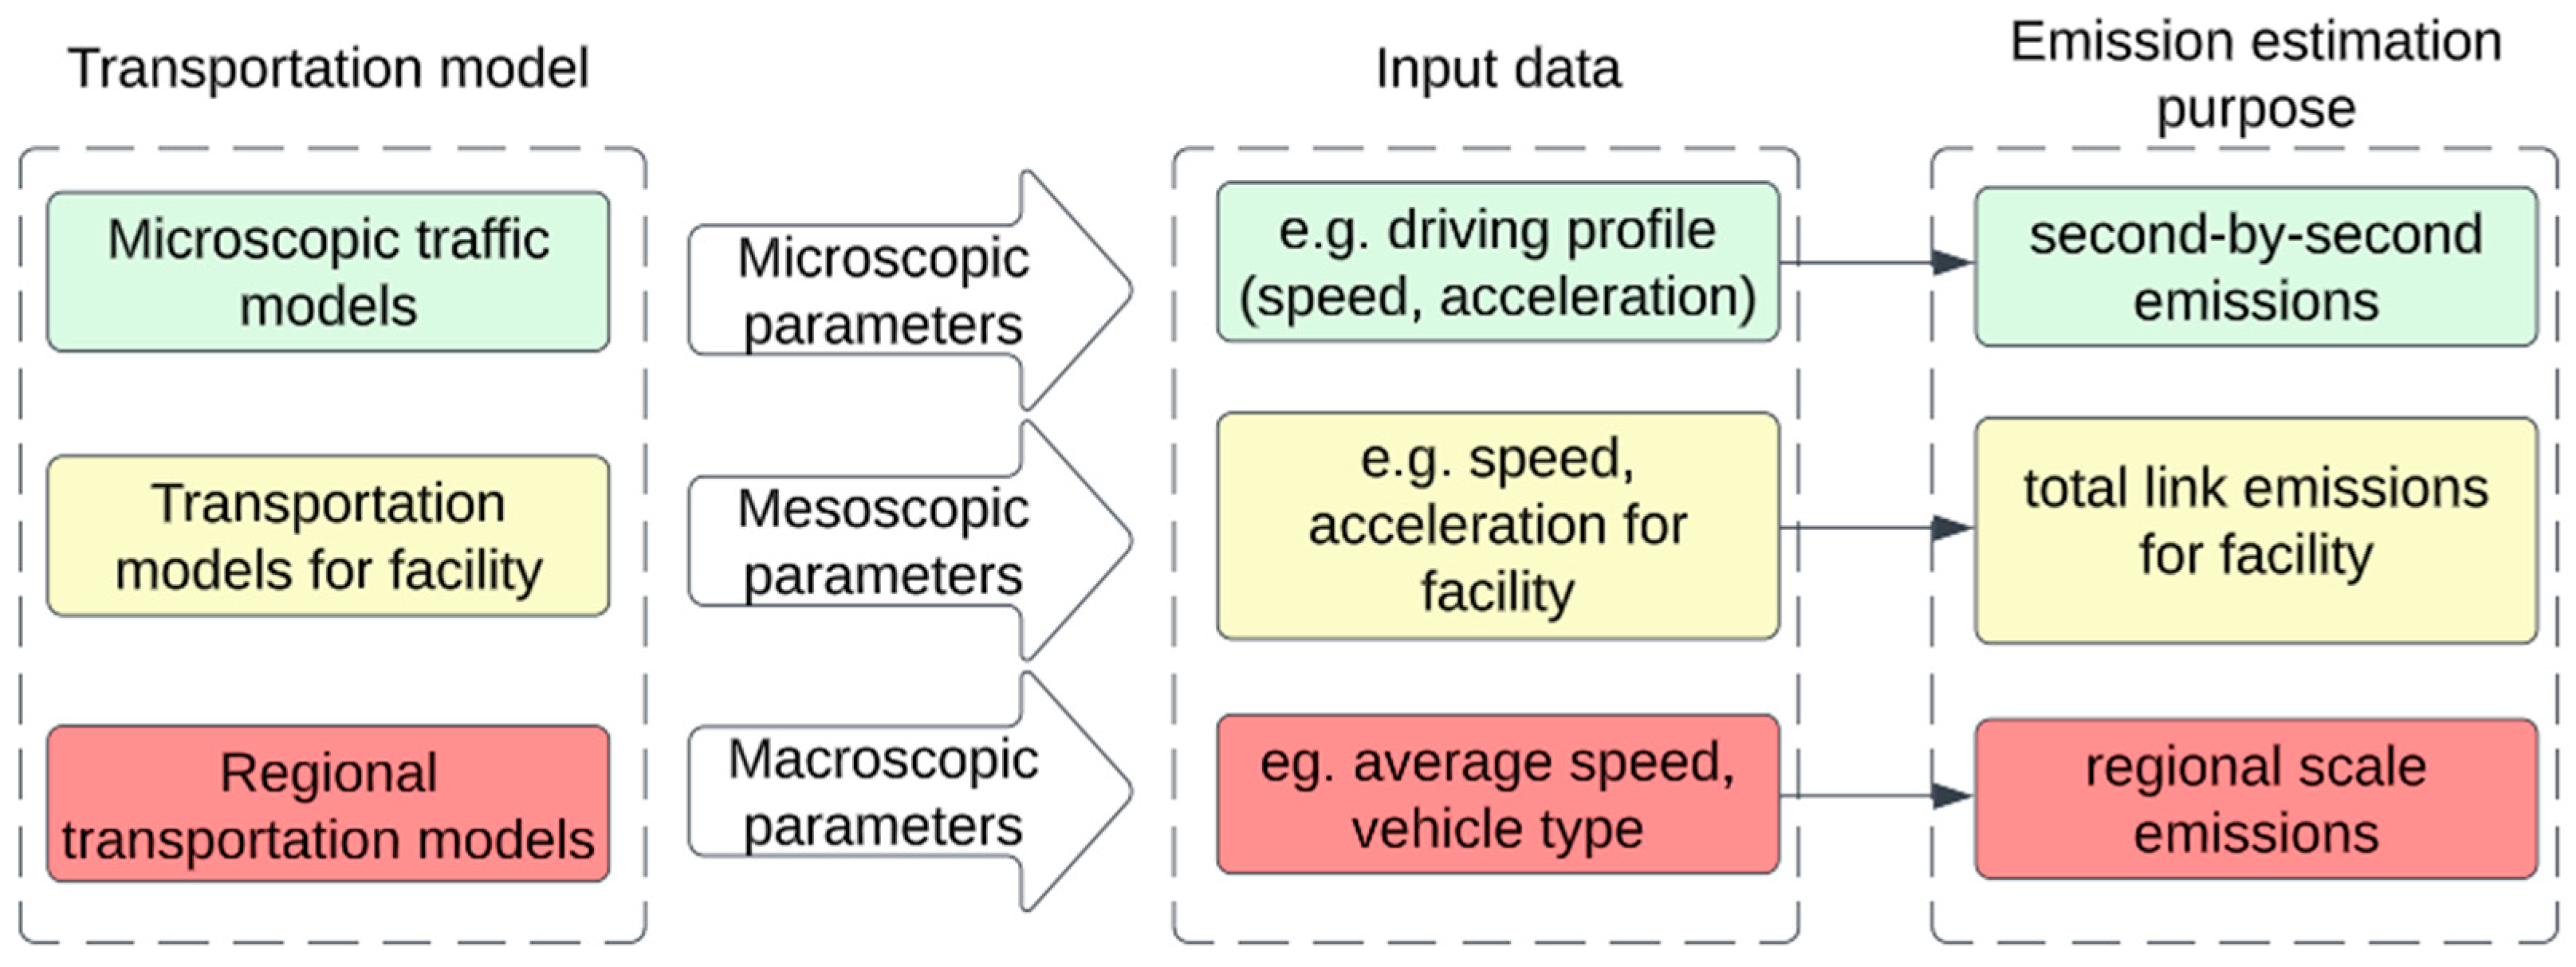
Figure 6.
Classification of the main groups of traffic simulators models and emission models with relation between them.
Figure 6.
Classification of the main groups of traffic simulators models and emission models with relation between them.
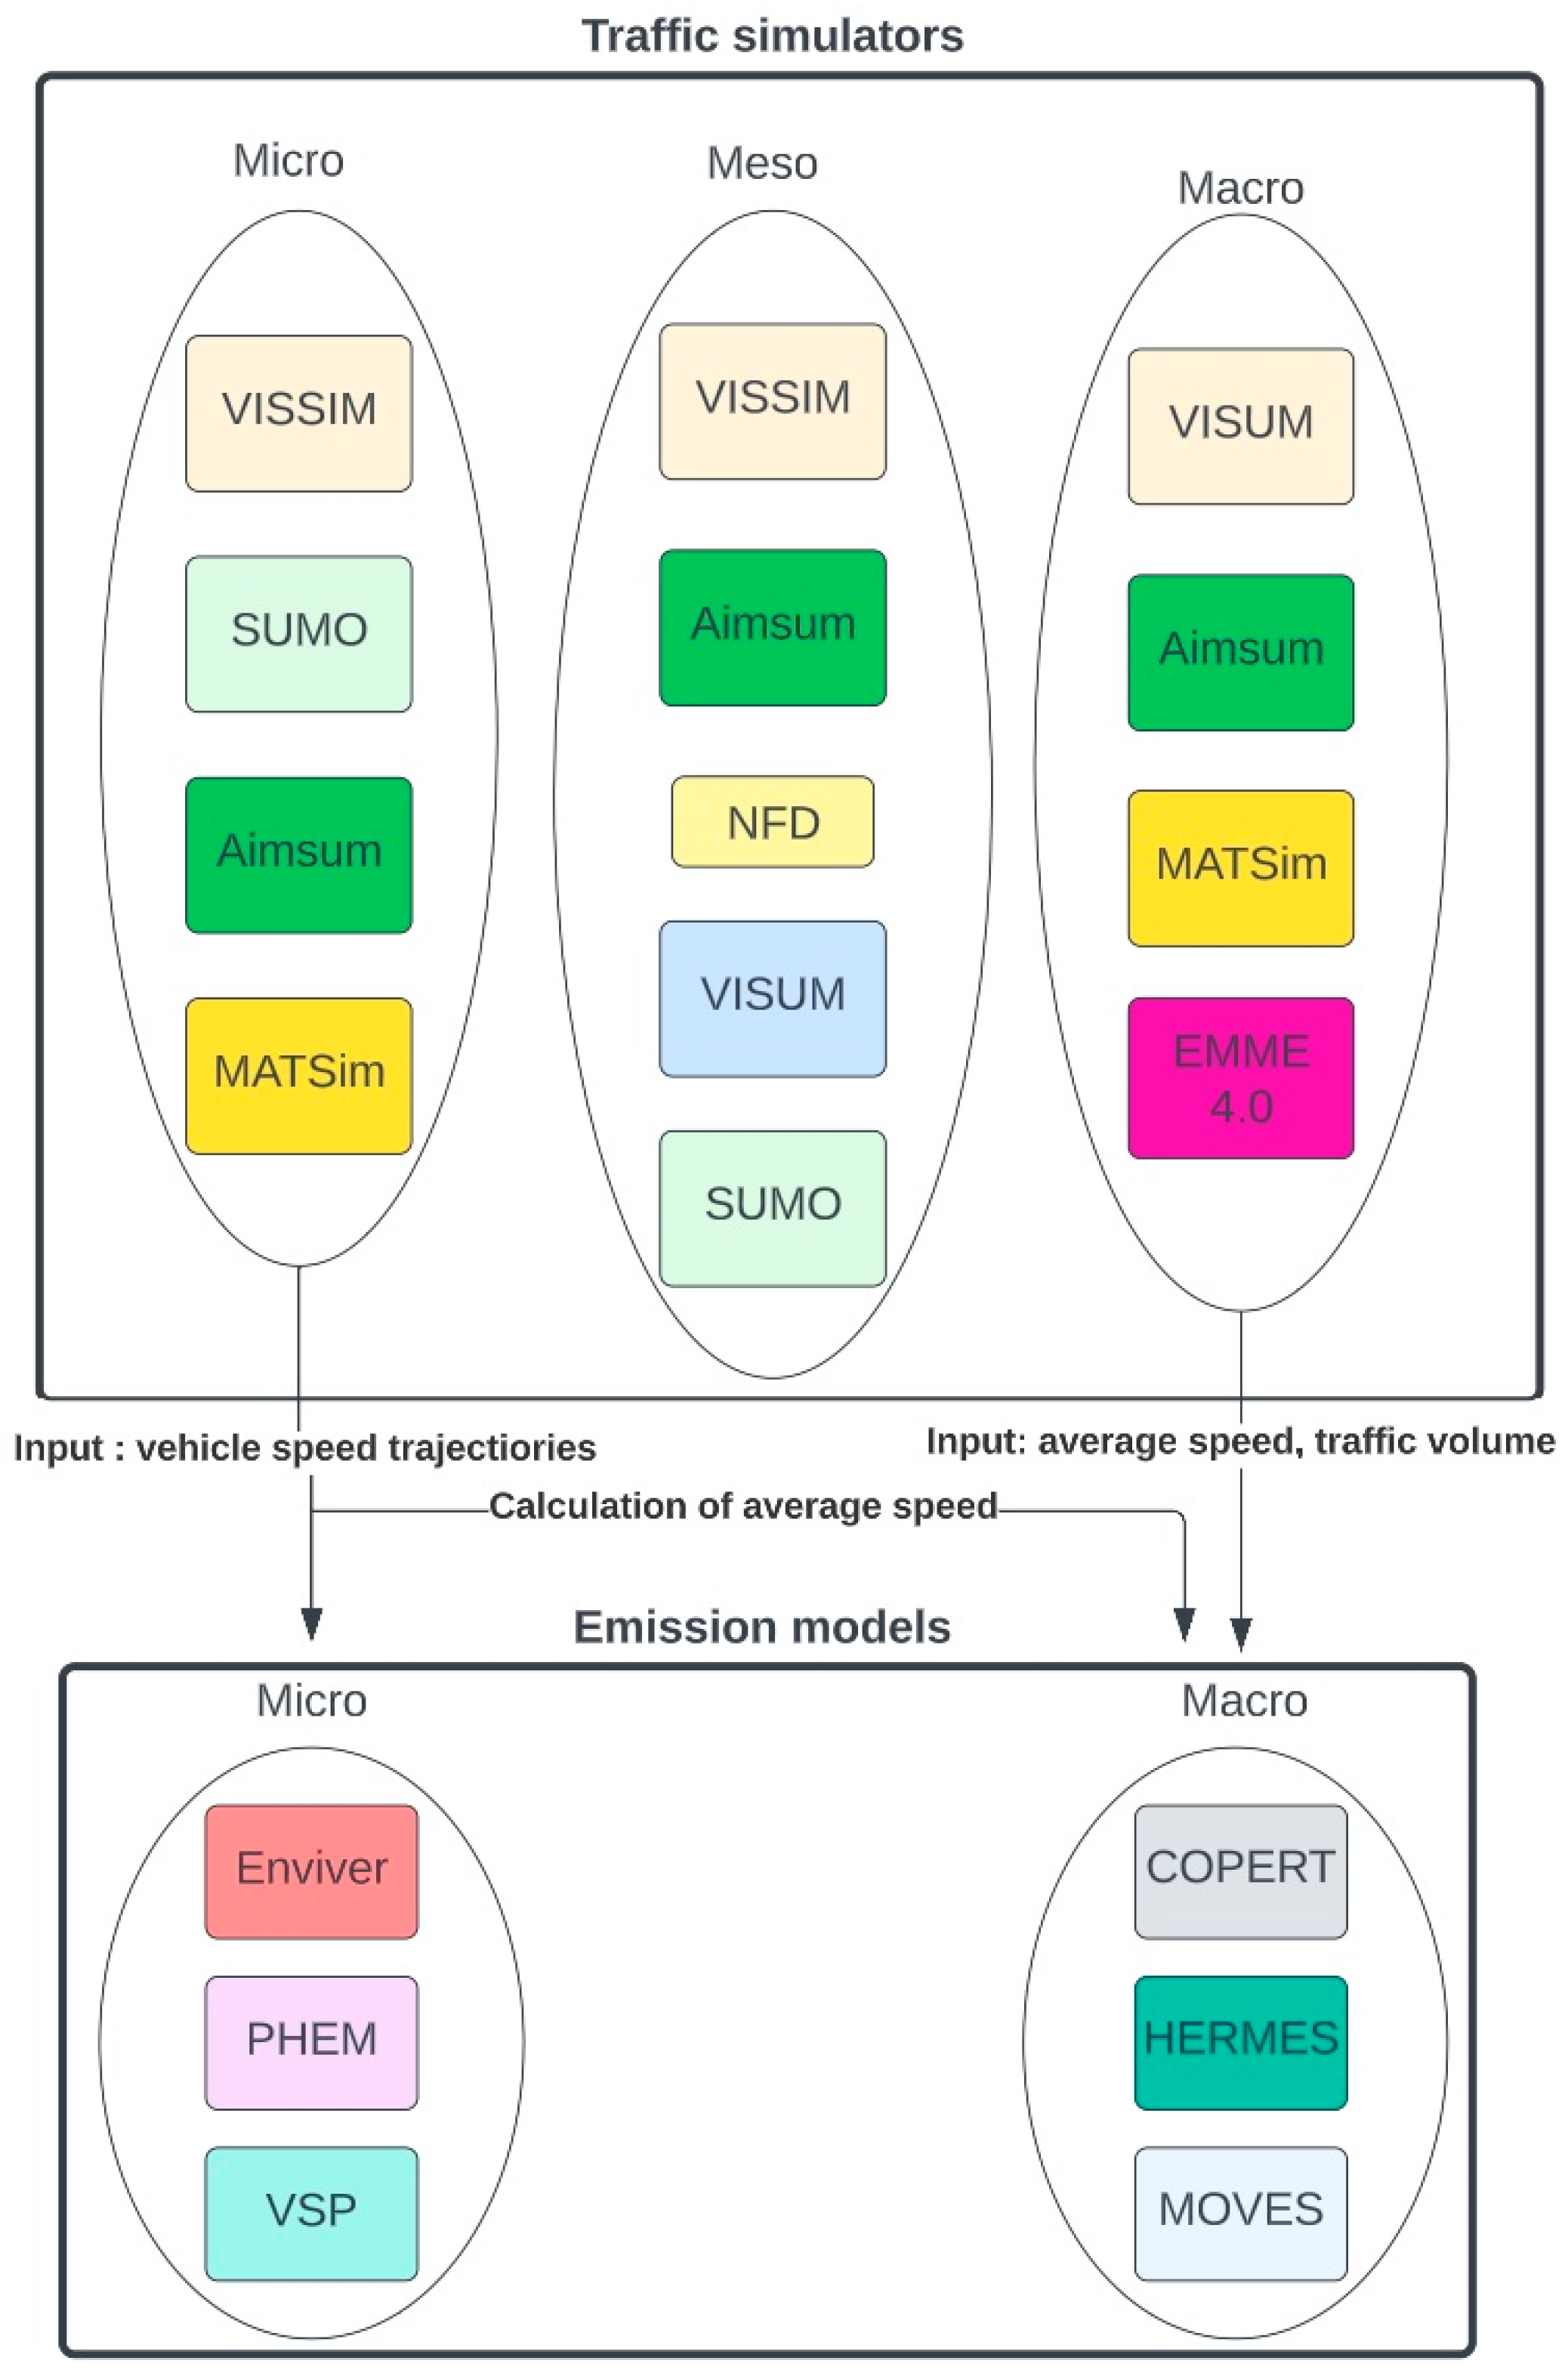

Table 1.
Selected emission models with their characteristics regarding input data, scale of detail, selected features, and information on availability of updates.
Table 1.
Selected emission models with their characteristics regarding input data, scale of detail, selected features, and information on availability of updates.
| Model | Skala | Input data | Features | Updates informations | Source |
|---|---|---|---|---|---|
| COPERT | Macro | Vehicle category, number of vehicles, weather conditions, load, average speed, distance traveled, etc. | The wide availability of vehicle types and emission components studied | Continuously updated, current version: 5.6 | [101,102] |
| MOVES | Macro | Vehicle category, number of vehicles, weather conditions, load, average speed, distance traveled, etc. | Ability to calculate emissions for a large number of exhaust components, including: HC, CO, CO2, NOX, CH4, N20, PM | Continuously updated, current version: MOVES3 | [103,104,105] |
| PHEM | Micro | Among other things, the speed profiles of the vehicles tested | Accuracy of emission estimation for the entire route, wide range of engine types and test vehicles, Time resolution 1Hz | Continuously updated | [106,107] |
| CMEM | Micro/macro | Among other things, the speed profiles of the vehicles tested | In addition to application at the micro scale, it is also possible to estimate emissions at the macro scale, making the model versatile | Currently without update support | [108] |
| Versit+/ Enviver | Micro | Speed and acceleration profiles of vehicles | Automatic generation of emission maps, full support for selected traffic simulation models, e.g. Vissim | Currently without update support | [109,110] |
| VT-Micro | micro | Speed and acceleration profiles of vehicles | The ability to calculate continuous emissions along the route and fuel consumption for the exhaust gases: CO2, NOx, CO and THC | Currently without update support | [111,112] |
| ESTM BOSH | micro | Speed and acceleration profiles of vehicles | The possibility of creating emission maps within the scope of the Vissim software, which allows very precise localisation of areas of increased concentrations of exhaust constituents. | Continuously updated | [113] |
| EMPA | micro | Speed and acceleration profiles of vehicles | Possibility to calculate emissions for LDVs only | Currently without update support | [114,115] |
| EMFAC | macro | e.g. average vehicle speed, type structure of vehicles, vehicle load, ambient conditions: temperature, humidity, etc. | Ability to calculate emissions for a number of indicators: THC, CO, NOx, PM, SOX and CO2 | Last update in 2021. | [116,117] |
| MODEM | micro | Speed and acceleration profiles of vehicles | Continuous emission estimation, no emission estimation possible for heavy duty vehicles | Currently without update support | [118,119] |
| HBEFA | macro | e.g. average vehicle speeds, type structure of vehicles | Estimation of emission factors for vehicles of different categories: PC, LDV, HGV, urban buses, motorbikes | Last update in 2022. | [120,121,122] |
Table 2.
Presentation of emission calculation options for selected vehicle exhaust components for selected emission models.
Table 2.
Presentation of emission calculation options for selected vehicle exhaust components for selected emission models.
| Pollutant | Emission model | ||||
|---|---|---|---|---|---|
| PHEM (micro) | COPERT5 (macro) | HBEFA (macro) | Versit+ (micro) | MODEM (micro) | |
| CO2 | No | Yes | Yes | Yes | Yes |
| CO | Yes | Yes | Yes | Yes | Yes |
| THC | Yes | Yes | Yes | Yes | Yes |
| PM | Yes | Yes | Yes | Yes | Yes |
| NOx | Yes | Yes | Yes | Yes | Yes |
| CH4 | No | Yes | Yes | No | No |
| Benzene | No | Yes | Yes | No | No |
| Toluene | No | No | Yes | No | No |
| Xylene | No | No | Yes | No | No |
| NO2 | No | Yes | Yes | No | No |
| N2O | No | Yes | Yes | No | No |
| 1,3-butadiene | No | Yes | No | No | No |
| SO2 | No | No | Yes | No | No |
| Fuel consumption | Yes | Yes | Yes | No | Yes |
Table 3.
Presentation of emission calculation options for selected vehicle categories for selected emission models.
Table 3.
Presentation of emission calculation options for selected vehicle categories for selected emission models.
| Vehicle category | Emission model | ||||
|---|---|---|---|---|---|
| PHEM (micro) | COPERT5 (macro) | HBEFA (macro) | Versit+ (micro) | MODEM (micro) | |
| Passenger cars | Yes | Yes | Yes | Yes | Yes |
| LGV | No | Yes | Yes | No | No |
| HGV | Yes | Yes | Yes | No | No |
| Urban bus | Yes | Yes | Yes | No | No |
| Coach | Yes | Yes | Yes | No | No |
| Motorcycles | No | Yes | Yes | No | No |
Table 4.
Examples of work using traffic simulations and emission models.
| Traffic simulator model (scale) | Emission model | Description | Source |
|---|---|---|---|
| Dynamic Traffic Assignment (meso) | Integrated miscroscopic estimation model (MOVES) | The study proposed an alternative approach for a mesoscopic traffic simulation model with an integrated microscopic emission model. The study used a postprocessing procedure to generate detailed vehicle trajectories. | [144] |
| VISSIM (micro) | MOVES2010a | Emission prediction with the use of VISSIM road model and emission model MOVES of vehicles on a limited-access motorway | [145] |
| VISUM/Aimsun Next (macro) | HERMESv3/PHEMLight | The study presents a macroscopic traffic emission model for Barcelona.The developed system is used to eg. quantify the hourly level of NOx and PM10 emission | [146] |
| Aimsun (micro) | Cruise/Copert | The studies demonstrate a new approach for the estimation of fuel consumption of vehicles with different levels of congestion in Turin city. | [147] |
| EMME 4.0 | COPERT-Chile | Traffic simulation model used for environmental impact modeling for South American city, Bogota. | [148] |
| VISSIM (micro) | COPERT | The work describes the computing of CO2 and NOx based on average speed as the input variable. A real-world study describing intercity corridors with many alternative routes are presented. | [149] |
| VISSIM (micro) | VSP | Two scenarios based on real-world data networks were analyzed in VISSIM in the context of CO,HC,NOx emissions. The used emission model was VSP calibrated using the collected field emission data. | [150] |
| VML (macro) | HERMESv3 | The work describes the changes in the air quality at street level for different traffic management strategies in Barcelona. | [151] |
| VISSIM (micro) | Enviver Pro | The work presents a case study for the city of The Hague during the morning peak in 2040. Several SAV market penetration scenarios were tested. Emission analysis concerns CO2, NOx and PM10. | [152] |
| VISSIM (micro) | Enviver Pro | The article addresses the use of different rights of way at four-arm intersections. The emission analysis are related to the comparison of NOx and PM10 for the assumed Vissim road models. | [153] |
| SUMO (micro) | GT-Suite | This work is the combination of traffic flow and vehicle simulations to investigate the vehicle performance. IN the simulation of SUMO, the authors used the real-world elevation profile and rolling resistance factor. | [154] |
| SUMO (micro) | PHEMlight | The work describes the adoption of smooth driving habits on emissions in large-scale urban networks. The dataset contains a total of 4156 urban trips from 100 drivers. | [155] |
| NFD (meso) | Integrated miscroscopic estimation model | The network-wide fundamental diagram (NFD) and microscopic emission models are estimated using mesoscopic traffic simulation tools at difference scales for various traffic compositions for 13 simulated scenarios. | [156] |
| MATSim (macro) | MOVES/R-Line | The simulation is performed in MATSim to simulate individual vehicle emissions. | [157] |
| VISUM (macro) | Integrated emission model | Estimation of CO2 and NOx emissions based on average speed as input variables for the scenarios with shared vehicle (SV), automated vehicle (AV), and electric vehicles (EV). | [158] |
| DTA (macro) | Integrated emission model | The work presents a macroscopic dynamic modeling framework in an urban city that has numerous central business districts to assess the emissions. The computation of emissions includes NOx, VOC, CO2, and PM in urban areas. | [159] |
| VISSIM (micro) | Enviver/RoundaboutEM | The work assumed the analysis of different roundabout scenarios and the impact of the traffic flow on them on the emissions of CO2, CO, and THC. | [142] |
Table 5.
Selected papers describing the essence of calibrating traffic simulation models and exhaust emission models.
Table 5.
Selected papers describing the essence of calibrating traffic simulation models and exhaust emission models.
| Traffic simulator model | Emission model | Calibration description | Source |
|---|---|---|---|
| Vissim | VERSIT+ | The paper describes the process of calibrating a microscopic model for an intersection in Rotterdam. The selected pairs of parameters for calibration that have the greatest influence on the calculation of emissions are: desired speed distribution, desired deceleration and acceleration functions, time headway, threshold for entering the state following, following variation, oscillation acceleration, acceleration to stand still. Failure to carry out this process would result in emission underestimates for CO2 of 9.3%, for NOx of 13%, and for PM10 of 0.3%. | [171] |
| Paramics | MOBILE6 | This paper proposes an intermediate component model that provides a better estimation of vehicle speeds on sections. The model was developed using multimodel linear regression and was then calibrated using a traffic miescrocopic simulation model. This calibration was mainly based on the vehicle speed parameter of the road sections under study. | [172] |
| Vissim | PHEM | The work involves combining traffic simulation models with emission models to assess the impact of traffic on environmental factors. Based on the actual results, a traffic model calibration was carried out for the acceleration and desired speed parameters. It was shown that not carrying out the calibration step results in an underestimation of fuel consumption by about 12%, NOx emissions by 19%, CO by 11%, HC by 29%, PM by 17%, PN by 16% and NO by 25%. | [173] |
| NGSIM | Instantaneous vehicle emission model TU Graz | The work assumes the use of 90 vehicle trajectories along with 9 collected in the NGSIM software database. The work uses two car-following models for which the trajectories were generated: Newell and Gipps. The models were calibrated using standard goodness-of-fit indicators. The focus of the study was on the analysis of fuel consumption, NOx, and PM emissions. | [174] |
| Vissim/NGSIM | MOVES | The calibration process is based on different compositions of the measure of effect (MOE) (calibration levels), which contain aggregated traffic volume data in order to identify those variables that affect the microscale emission estimates. First, five more detailed measurement calibration levels are defined, important calibration levels are identified, and finally reliable calibration levels are selected based on the available traffic data. The influence of vehicle type composition (light and heavy vehicles) on the estimated emissions is also assessed in a well-calibrated simulation. | [175] |
| Aimsum | VSP | The paper describes the calibration of a micro-scale emission model based on real data from the PEMS system. This calibration relates to the embedded emissions model in the Aimsun software. The road data refers to 35 vehicles. The recommendation of the work is to integrate the emission data from the Aimsun software with the MOVES emission models. | [176] |
| VISUM | COPERT SL/ R-LINE | The aim of the study was to analyse vehicle emissions as a result of reducing vehicle traffic and increasing pedestrian traffic in the city of Madrid. Modelling was done on a macro scale, while it was important to validate and calibrate the traffic volume obtained on the studied streets with that of the VISUM programme. This aspect had the greatest impact on the CO, NOx, and PM parameters studied. The model was checked with the GEH. | [177] |
| Vissim | Enviver/RoundaboutEM | In this study, microsimulation models of vehicle traffic were calibrated for the parameters: time headway, following variation, oscillation acceleration, acceleration from standstill, threshold for entering the state following, and time gap and minimum headway for yield sign. In addition to this, parameters such as speed and acceleration desired for the actual journey through the roundabout under study were calibrated. | [142] |
| Vissim | VSP/EMEP/EEA | The work deals with the evaluation of emissions from autonomous vehicles for their different traffic shares. In this work, the driving model behind the Wiedeman 99 leader was used. The parameters that were calibrated were acceleration at 80km/h, stand-still acceleration, oscillation, acceleration, following threshold, headway time, and standstill distance. For the lane changing model, the minimum headway and safety distance reduction factor were calibrated. With these assumptions, CO2, CO, NOx, and HC emissions were analysed in the paper. | [178] |
| Vissim | VERSIT+ | The paper describes the process of calibrating the car-following model to reflect the actual driver behaviour for eco-driving style. The parameters of the car-following model that were modified were: desired acceleration from standstill at 80km/h, oscillation during acceleration, influence of distance on speed oscillation, positive speed difference during the following process, start of deceleration process, distance difference, headway time, standstill distance. The emission parameters studied were CO2 and NOx. | [179] |
| Vissim | VSP | The work concerns a microscale simulation model with a signal controller, for which light duty vehicles were equipped with a cooperative vehicle infrastructure system. The following parameters were calibrated in Vissim: maximum look-ahead distance, average standstill distance, the number of observed, vehicle waiting time before, diffusion, additive part of safety distance, and desired speed. After the calibration process, emissions were measured for the parameters CO2, NOx, HC, and CO. | [180] |
Disclaimer/Publisher’s Note: The statements, opinions and data contained in all publications are solely those of the individual author(s) and contributor(s) and not of MDPI and/or the editor(s). MDPI and/or the editor(s) disclaim responsibility for any injury to people or property resulting from any ideas, methods, instructions or products referred to in the content. |
© 2023 by the authors. Licensee MDPI, Basel, Switzerland. This article is an open access article distributed under the terms and conditions of the Creative Commons Attribution (CC BY) license (http://creativecommons.org/licenses/by/4.0/).
Copyright: This open access article is published under a Creative Commons CC BY 4.0 license, which permit the free download, distribution, and reuse, provided that the author and preprint are cited in any reuse.


