Submitted:
07 April 2023
Posted:
10 April 2023
You are already at the latest version
Abstract
This study aimed to use remote sensing and GIS to detect changes in surface water and wetlands in the Kumasi Metropolis over a period of 20 years (2002-2022). Landsat images were processed using the QGIS software, and the Maximum Likelihood Algorithm was used to perform supervised classification of land use land cover, while raster calculator aided in detecting wetlands by calculation for NDWI, MNDWI, and AWEI. The results showed that the majority of the landscape in the Kumasi metropolis was made up of built-up areas (79.4%), followed by agricultural lands (13.3%) and wetlands (7.3%). Over the 20-year period, built-up areas had gained 20.7% of the total landscape, while agricultural lands and wetlands had lost 16.7% and 4.0%, respectively. All water index methods recorded an increase in non-water cover and a loss of water cover over the period, with surface water decreasing by 5% and non-water land cover increasing by 5%. The study concludes that there have been significant changes in wetlands and surface water land use and land cover within the Kumasi Metropolis over the past 20 years, and recommends the enforcement of legislation on surface water protection in the area to protect wetlands
Keywords:
NDWI 1
; MNDWI 2
; AWEI 3
; GIS 4
; RS 5
; QGIS 5
; GPS 6
; USGS 7
; LULC 8
; UTM 9
; KAMA.
1. Introduction
Surface water bodies and wetlands are essential components of the global ecosystem, providing a range of ecological services such as water purification, carbon sequestration, and wildlife habitats. However, due to rapid population growth, urbanization, and land-use changes, these ecosystems are under increasing threat, resulting in their depletion and degradation [1]. Wetlands make up approximately 6% of the world's land area and can be categorized based on factors such as their origin, location, hydro-period, chemical composition, and plant diversity [2]. These ecosystems are incredibly diverse and are comparable in terms of biodiversity to tropical rainforests and coral reefs [3]. Due to their importance, many countries have designated wetlands as protected areas within their waterway systems and have implemented regulations to manage their use. However, human activity can complicate the utilization patterns of wetlands, making interpretation of their use more complex (Sukhdev, et al. 2020).
Remote sensing and geographic information systems (GIS) are powerful tools that have been used to monitor and assess the changes in surface water bodies and wetlands [4,5,6]. Remote sensing is the science of acquiring data about the Earth's surface using sensors onboard satellites, aircraft, or drones [7,8]. The sensors detect and measure the electromagnetic radiation reflected or emitted from the Earth's surface, which is used to derive information about the land cover, land use, and changes in the environment [9,10]. GIS, on the other hand, is a computer-based system used to manage, analyze, and visualize spatial data [11,12].
The combination of remote sensing and GIS techniques has revolutionized the way surface water bodies and wetlands are monitored and managed. Remote sensing provides spatial and temporal data that can be analyzed and processed using GIS tools to derive valuable information about these ecosystems . For instance, remote sensing data can be used to identify changes in water bodies' extent, water quality, and vegetation cover in wetlands. The use of GIS tools can then be used to analyze these data and derive valuable insights into the causes and impacts of these changes.
GIS and remote sensing techniques have been used to develop various models and algorithms for the identification and mapping of surface water bodies and wetland changes. For instance, the Normalized Difference Water Index (NDWI) is a commonly used algorithm for identifying surface water bodies from remote sensing data [13]. Other algorithms have also been developed for identifying and mapping wetlands, such as the Modified Normalized Difference Water Index (MNDWI) [14], and the Automated Water Extraction Index (AWEI) [15].
Traditionally, the monitoring and mapping of surface water bodies and wetlands have been done using ground-based methods, which are time-consuming and expensive. However, with the advancements in remote sensing and GIS technologies, it is now possible to map and monitor these resources using satellite imagery and other remote sensing data. GIS and remote sensing provide a cost-effective and efficient way of monitoring changes in surface water bodies and wetlands, thereby allowing for timely interventions to be made to protect these valuable resources.
The Kumasi Metropolis in Ghana is a rapidly urbanizing city that has seen significant changes in its land use patterns over the past few decades. As such, it is essential to monitor and manage its surface water bodies and wetlands to ensure their sustainability and the provision of their ecosystem services. Despite the many benefits of using remote sensing and GIS technologies for monitoring surface water bodies and wetlands, their application in Ghana has been limited. There is lack of spatial data and information on surface water resources in Ghana, which hindered effective management of these resources. Furthermore, there is limited research on the use of remote sensing and GIS in detecting changes in surface water bodies and wetland depletion in the Kumasi metropolis, one of the largest cities in Ghana.
Therefore, this study aims to fill this research gap by using GIS and remote sensing to detect changes in surface water bodies and wetland depletion in the Kumasi Metropolis. The study utilized satellite imagery and other remote sensing data to map and monitor these resources, identifying any changes that may have occurred over time. The findings of this study will provide critical insights into the current state of surface water bodies and wetlands in the Kumasi Metropolis, which can inform policy decisions regarding their management and conservation.
2. Materials and Methods
2.1. Description of the Study Area
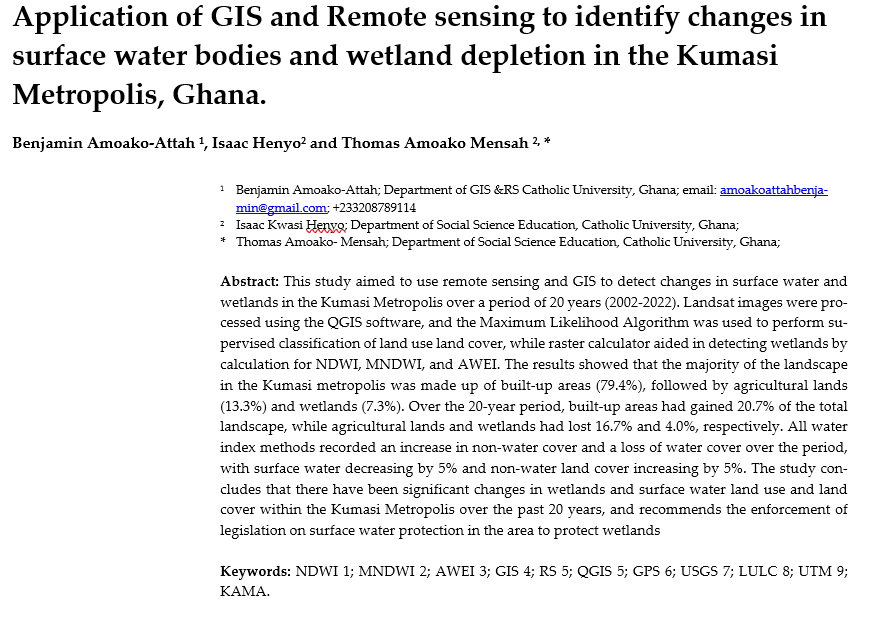
Kumasi Metropolitan Assembly, one of Ghana's Metropolitan, Municipal, and District Assemblies, is located in the Ashanti Region of Ghana (Figure 1). The metropolis is characterized by a sub-equatorial climate with a double maximum rainfall regime, as well as hills and valleys, and several rivers and streams, such as the Owabi, Subin, Wiwi, Sisai, Aboabo, and Nsuben. The 2021 population and housing census conducted by the Ghana Statistical Service (2021) reported a total population of 443,981 in the metropolitan area, with diverse employment opportunities available for residents. Kumasi is Ghana's second-largest city and a major economic centre, with industries such as commerce, manufacturing, agriculture, and services.
Kumasi's vibrant informal sector comprises small and medium-sized enterprises, including artisans, food vendors, and service providers. The city is renowned for its markets, including Kejetia Market, one of West Africa's largest markets, and Adum, the city's commercial hub. These markets attract traders from various parts of Ghana and neighbouring countries, contributing to the city's economic growth. The city is also home to several manufacturing companies, including those in the food processing, textile, and pharmaceutical industries.
The culture of Kumasi is rich and diverse, with a strong emphasis on traditional values and customs. The city is renowned for its colourful festivals and celebrations that reflect the region's history and cultural heritage. One of the most prominent festivals is the Akwasidae festival, which the Asante people celebrate every 42 days to honour their ancestors and seek blessings for the future. Overall, Kumasi's culture and economy are interwoven, with traditional values and customs playing a vital role in shaping the city's economic and social landscape.
2.2. Materials
The United States Geological Survey (USGS) Earth Explorer website (https://earthexplorer.usgs.gov/) provided the source for the satellite image data used for Land Use and Land Cover (LULC) classification. The Landsat 7 TM+ and Landsat 8 OLI/ TIRS imagery from 2002 to 2022 at ten-year intervals were utilized, with preference given to images with minimal or no cloud cover (all product was taken on the month of january of each year from path 194 and row 055). In addition, the selection of Landsat satellite image dates was influenced by the quality of the images. The Kumasi metropolis boundary shape files were obtained from the spatial and planning unit of the Kumasi Metropolitan Assembly (KMA), while hand-held GPS was used to acquire training samples. (&Figure 1).The QGIS computre software was used for the entire analysis of data.
2.3. Methods
2.3.1. Image Pre Processing and Classification
The raster data was projected into UTM zone 30N and pansharpened to 15m-by-15m resolution. Because the raster data was collected at level 2-1, radiometric correction was not necessary. A classification scheme was adopted in this study. The study area was classified into three different classes. A detailed description of these classes is shown in Table 1.
The sample points were super imposed on the raster data and ROI were created and used for the classification of the land use in the Kumasi metropolis in QGIS 3.22 software and applying the maximum likelihood algorithm. Moreover, the kappa statistics was applied in assessing the classification accuracy and all the relevant indicators recorded above 90%. However, to improve the accuracy of the changes in the surface water and wetland depletion, the water detection index which include NDWI, MNDWI, and AWEI were used to perform unsupervised classification of each of the images. The images were super imposed on the supervised classified images and pixel reclassification was taken to correct errors in each pixel into it respective land class. The images were then reclassified into areas where surface water can be found and areas they are not (Figure 2).
2.3.2. Change Detection Analysis
This formula subtracts the pixel values of the same location in Image 1 from Image 2 to obtain the change value for each pixel. The change values can then be classified into different categories, such as no change, positive change, and negative change, based on a threshold value. This analysis was carried out in the QGIS software to map the depletion trend of the surface water and wetlands in the Kumasi metropolis.
3. Results
3.1. Land Use in the Kumasi Metropolis, Ghana
The study conducted a supervised classification using Landsat satellite data from 2002, 2012, and 2020, covering a 20-year period. The resulting land-use land-cover map is visually represented in Figure 3, while the details of the different land classes are presented in Table 2. The land use in Kumasi Metro, Ghana, has undergone significant changes between 2002 and 2022. In 2002, the Built-Up environment occupied the largest portion of the total landscape at 58.7%, followed by Agricultural lands at 30.0%, and Wet lands at 11.3%. However, in 2012, the Built-Up land had increased to 75.6%, while Agricultural land and Wet lands decreased to 14.4% and 10.0%, respectively. By 2022, Built-Up land had further increased to 79.4%, while Agricultural land and Wet lands had reduced to 13.3% and 7.3%, respectively. This trend indicates a depletion of vegetation and wet lands within the Built-Up areas. In 2022, 75.6% of the total landscape had no vegetation or water
3.2. Detecting Surface water and wetlands
NDWI, MNDWI and AWEI methods were used to detect surface water extraction under Landsat satellite images. The indices for the periods, 2002, 2012 and 2022 are recorded in Table 3 and the spatial images are shown by Figure 4
Satellite images using NDWI, MNDWI, and AWEI all showed positive surface water extraction in 2002, with water cover ranging from 7.9% to 8.3%. However, over the 20-year period, there was a decrease in water cover and an increase in non-water cover for all methods. By 2022, water cover ranged from 2.9% to 3.7% while non-water cover ranged from 96.3% to 97.1%.
3.3. Changes in Surface water and Wetlands depletion in the Kumasi Metropolis, Ghana.
This section looks into the conversions in the land classes over the stipulated period. Statistical Table 4 shows the changes in land use in terms of hectors and percentages from 2002-2022 whiles Figure 5 gives a spatial distribution of the land use changes.
Between 2002 and 2012, there was an increase in Built-up & Agricultural Lands covering 90.4% of the landscape, while Wet Lands lost 5% of its area to Built-up & Agricultural Lands. Between 2012 and 2022, there was further increase in Built-up & Agricultural Lands covering 91.6% of the landscape, and Wet Lands lost 5.5% of its area to Built-up & Agricultural Lands. Overall, from 2002 to 2022, Built-up and Agricultural Lands have covered 28291.84 ha, nearly 95% of the total land cover. Wet Lands lost more area to Built-up and Agricultural Lands, totaling 715.18 ha, while Built-up and Agricultural Lands lost only 174.38 ha to Wet Lands. Wet Lands to Wet Lands coverage remained relatively stable at 685.10 ha or 2.3% of the land cover.
4. Discussion
Over the past 20 years in the Kumasi Metropolis, there have been changes in land use and cover. Most of the land has become built-up areas (79.4%), while agricultural land has decreased (13.3%) and wetlands have also decreased (7.3%).
Various water index methods were used to analyze water cover, and all showed a decrease in water cover and an increase in non-water cover over the 20-year period. Built-up and agricultural lands now cover almost all of the land (95%). Some wetlands have been lost to built-up and agricultural areas, while others remain unchanged. These changes are similar to what has been observed in other studies, which have also shown a decrease in water cover over time.
The findings of this study are consistent with other research that has been conducted in the Kumasi Metropolis and other regions as well. For instance, [16] found that there were significant land use and land cover changes in the Kumasi Metropolis over a 30-year period, with negative effects on food crop production. Similarly, [17] observed an increase in residential land use in Kumasi and decreasing trends in forestlands and agricultural while [18] discovered an overall increase in built-up areas in the region.
Regarding water cover, [19] used similar methods to analyze water cover and found that they resulted in the most accurate open surface water maps. [20] also used similar methods and discovered an increase in urban surface water bodies in the Manggala area in Indonesia. [21] found a decrease in water surface and an increase in degraded areas when applying water indices.
The findings of this study have significant implications for land use and water management in the Kumasi Metropolis and other regions facing similar challenges. The substantial increase in built-up areas and loss of agricultural and wetland areas over the 20-year period could have negative impacts on food production, biodiversity, and ecosystem services. Therefore, policymakers, urban planners, and land managers should take into account the potential impacts of land use changes on the environment and develop appropriate strategies to mitigate them.
The progressive loss of water cover observed in this study highlights the importance of water management and conservation efforts in the region. The use of water indices can aid in identifying changes in water cover, which can inform the development of appropriate water management and conservation strategies.
In summary, the findings of this study emphasize the need for sustainable land use and water management practices to address the negative impacts of land use changes on the environment and ensure the provision of critical ecosystem services. Policymakers and land managers must take a proactive approach to manage land and water resources to ensure their long-term sustainability and resilience in the face of future challenges.
5. Conclusions
In conclusion, this study highlights significant land use and land cover changes in the Kumasi Metropolis over a 20-year period, with built-up areas experiencing substantial growth and agricultural and wetland areas experiencing losses. These changes could have negative impacts on food production, biodiversity, and ecosystem services. Moreover, the study found a progressive loss of water cover in the region, highlighting the importance of water management and conservation efforts.
The findings of this study underscore the need for sustainable land use and water management practices to address the negative impacts of land use changes on the environment and ensure the provision of critical ecosystem services. Policymakers, urban planners, and land managers should take a proactive approach to manage land and water resources to ensure their long-term sustainability and resilience in the face of future challenges. The use of water indices can aid in identifying changes in water cover, which can inform the development of appropriate water management and conservation strategies.
Supplementary Materials
The following supporting information can be downloaded at the website of this paper posted on Preprints.org.
Author Contributions
Benjamin Amoako-Attah served as the geospatial analyst for this research work and was responsible for overseeing the data collection, analysis, interpretation and compilation of the manuscript. Isaac Henyo, was in charge of proof reading, editing and validation of study results. Thomas Amoako Mensah, the head of research at the Department of Geography Education, Catholic University , Ghana is the lead researcher for the entire project work. He coordinated all the activities regarding the entire research work.
Funding
This research received no external funding
Institutional Review Board Statement
Not applicable.
Informed Consent Statement
Any research article describing a study involving humans should contain this statement. Please add “Informed consent was obtained from all subjects involved in the study.” OR “Patient consent was waived due to REASON (please provide a detailed justification).” OR “Not applicable.” for studies not involving humans. You might also choose to exclude this statement if the study did not involve humans. Written informed consent for publication must be obtained from participating patients who can be identified (including by the patients themselves). Please state “Written informed consent has been obtained from the patient(s) to publish this paper” if applicable.
Data Availability Statement
Data of this work can be download from https://earthexplorer.usgs.gov/ for path 194 and row 055. The shape files for processing the satellite image can be downloaded at https://gadm.org/data.html.
Acknowledgments
Augustine Owusu-Addo, Faculty of Education, Catholic University of Ghanaaoaddo58@aol.com / aoaddo@cug.edu.gh.
Conflicts of Interest
The authors have no conflict that may influence the research outcome or any funding organization.
References
- A. I. Stefanakis, “The Role of Constructed Wetlands as Green Infrastructure for Sustainable Urban Water Management,” Sustainability, vol. 11, no. 24, Art. no. 24, Jan. 2019. [CrossRef]
- T. Xu et al., “Wetlands of International Importance: Status, Threats, and Future Protection,” International Journal of Environmental Research and Public Health, vol. 16, no. 10, Art. no. 10, Jan. 2019. [CrossRef]
- Martínez-Espinosa, S. Sauvage, A. Al Bitar, P. A. Green, C. J. Vörösmarty, and J. M. Sánchez-Pérez, “Denitrification in wetlands: A review towards a quantification at global scale,” Science of The Total Environment, vol. 754, p. 142398, Feb. 2021. [CrossRef]
- K. Chen, Q. Liu, Q. Jiang, X. Hou, and W. Gao, “Source apportionment of surface water pollution in North Anhui Plain, Eastern China, using APCS-MLR model combined with GIS approach and socioeconomic parameters,” Ecological Indicators, vol. 143, p. 109324, Oct. 2022. [CrossRef]
- E. S. Papastergiadou, A. Retalis, A. Apostolakis, and Th. Georgiadis, “Environmental Monitoring of Spatio-temporal Changes Using Remote Sensing and GIS in a Mediterranean Wetland of Northern Greece,” Water Resour Manage, vol. 22, no. 5, pp. 579–594, May 2008. [CrossRef]
- S. Bhattacharjee, M. T. Islam, M. E. Kabir, and M. M. Kabir, “Land-Use and Land-Cover Change Detection in a North-Eastern Wetland Ecosystem of Bangladesh Using Remote Sensing and GIS Techniques,” Earth Syst Environ, vol. 5, no. 2, pp. 319–340, Jun. 2021. [CrossRef]
- M. B. Dunbar, I. Caballero, A. Román, and G. Navarro, “Remote Sensing: Satellite and RPAS (Remotely Piloted Aircraft System),” in Marine Analytical Chemistry, J. Blasco and A. Tovar-Sánchez, Eds. Cham: Springer International Publishing, 2023, pp. 389–417. [CrossRef]
- S. E. Piovan, “Remote Sensing,” in The Geohistorical Approach: Methods and Applications, S. E. Piovan, Ed. Cham: Springer International Publishing, 2020, pp. 171–197. [CrossRef]
- T. Adão et al., “Hyperspectral Imaging: A Review on UAV-Based Sensors, Data Processing and Applications for Agriculture and Forestry,” Remote Sensing, vol. 9, no. 11, Art. no. 11, Nov. 2017. [CrossRef]
- Y. Huang, G. Feng, H. Tewolde, and M. W. Shankle, “Remote Sensing from Different Sources for Crop Growth Monitoring in the Area of the Lower Northern Mississippi,” Challenges, vol. 14, no. 1, Art. no. 1, Mar. 2023. [CrossRef]
- A. P. Kirilenko, “Geographic Information System (GIS): Making Sense of Geospatial Data,” in Applied Data Science in Tourism, R. Egger, Ed. Cham: Springer International Publishing, 2022, pp. 513–526. [CrossRef]
- H. Sritart and H. Miyazaki, “Correction to: Geographic Information System(GIS) and Data Visualization,” in Disaster Nursing, Primary Health Care and Communication in Uncertainty, S. Kanbara, S. Miyagawa, and H. Miyazaki, Eds. Cham: Springer International Publishing, 2022, pp. C1–C1. [CrossRef]
- Gao, “NDWI—A normalized difference water index for remote sensing of vegetation liquid water from space,” Remote Sensing of Environment, vol. 58, no. 3, pp. 257–266, Dec. 1996. [CrossRef]
- “Modification of normalised difference water index (NDWI) to enhance open water features in remotely sensed imagery: International Journal of Remote Sensing: Vol 27, No 14.” https://www.tandfonline.com/doi/abs/10.1080/01431160600589179 (accessed Mar. 27, 2023). [CrossRef]
- G. L. Feyisa, H. Meilby, R. Fensholt, and S. R. Proud, “Automated Water Extraction Index: A new technique for surface water mapping using Landsat imagery,” Remote Sensing of Environment, vol. 140, pp. 23–35, Jan. 2014. [CrossRef]
- K. Abass, S. K. Adanu, and S. Agyemang, “Peri-urbanisation and loss of arable land in Kumasi Metropolis in three decades: Evidence from remote sensing image analysis,” Land Use Policy, vol. 72, pp. 470–479, Mar. 2018. [CrossRef]
- B. F. Frimpong, A. Koranteng, T. Atta-Darkwa, O. F. Junior, and T. Zawiła-Niedźwiecki, “Land Cover Changes Utilising Landsat Satellite Imageries for the Kumasi Metropolis and Its Adjoining Municipalities in Ghana (1986–2022),” Sensors, vol. 23, no. 5, Art. no. 5, Jan. 2023. [CrossRef]
- G. Darko et al., “Urbanizing with or without nature: pollution effects of human activities on water quality of major rivers that drain the Kumasi Metropolis of Ghana,” Environ Monit Assess, vol. 194, no. 1, p. 38, Dec. 2021. [CrossRef]
- J. Worden and K. M. de Beurs, “Surface water detection in the Caucasus,” International Journal of Applied Earth Observation and Geoinformation, vol. 91, p. 102159, Sep. 2020. [CrossRef]
- “Detection of Changes in Surface Water Bodies Urban Area with NDWI and MNDWI Methods - Test Repository.” http://eprints.unm.ac.id/13894/ (accessed Mar. 27, 2023).
- “Detecting land surface water changes in the Upper Mzingwane sub-catchment using remotely sensed data | Journal of Water Supply: Research and Technology-Aqua | IWA Publishing.” https://iwaponline.com/aqua/article/71/10/1180/91332/Detecting-land-surface-water-changes-in-the-Upper (accessed Mar. 27, 2023).
Figure 1.
Study area: (a)shows the land use classes sample data super imposed in google earth with the study area boundary.
Figure 1.
Study area: (a)shows the land use classes sample data super imposed in google earth with the study area boundary.
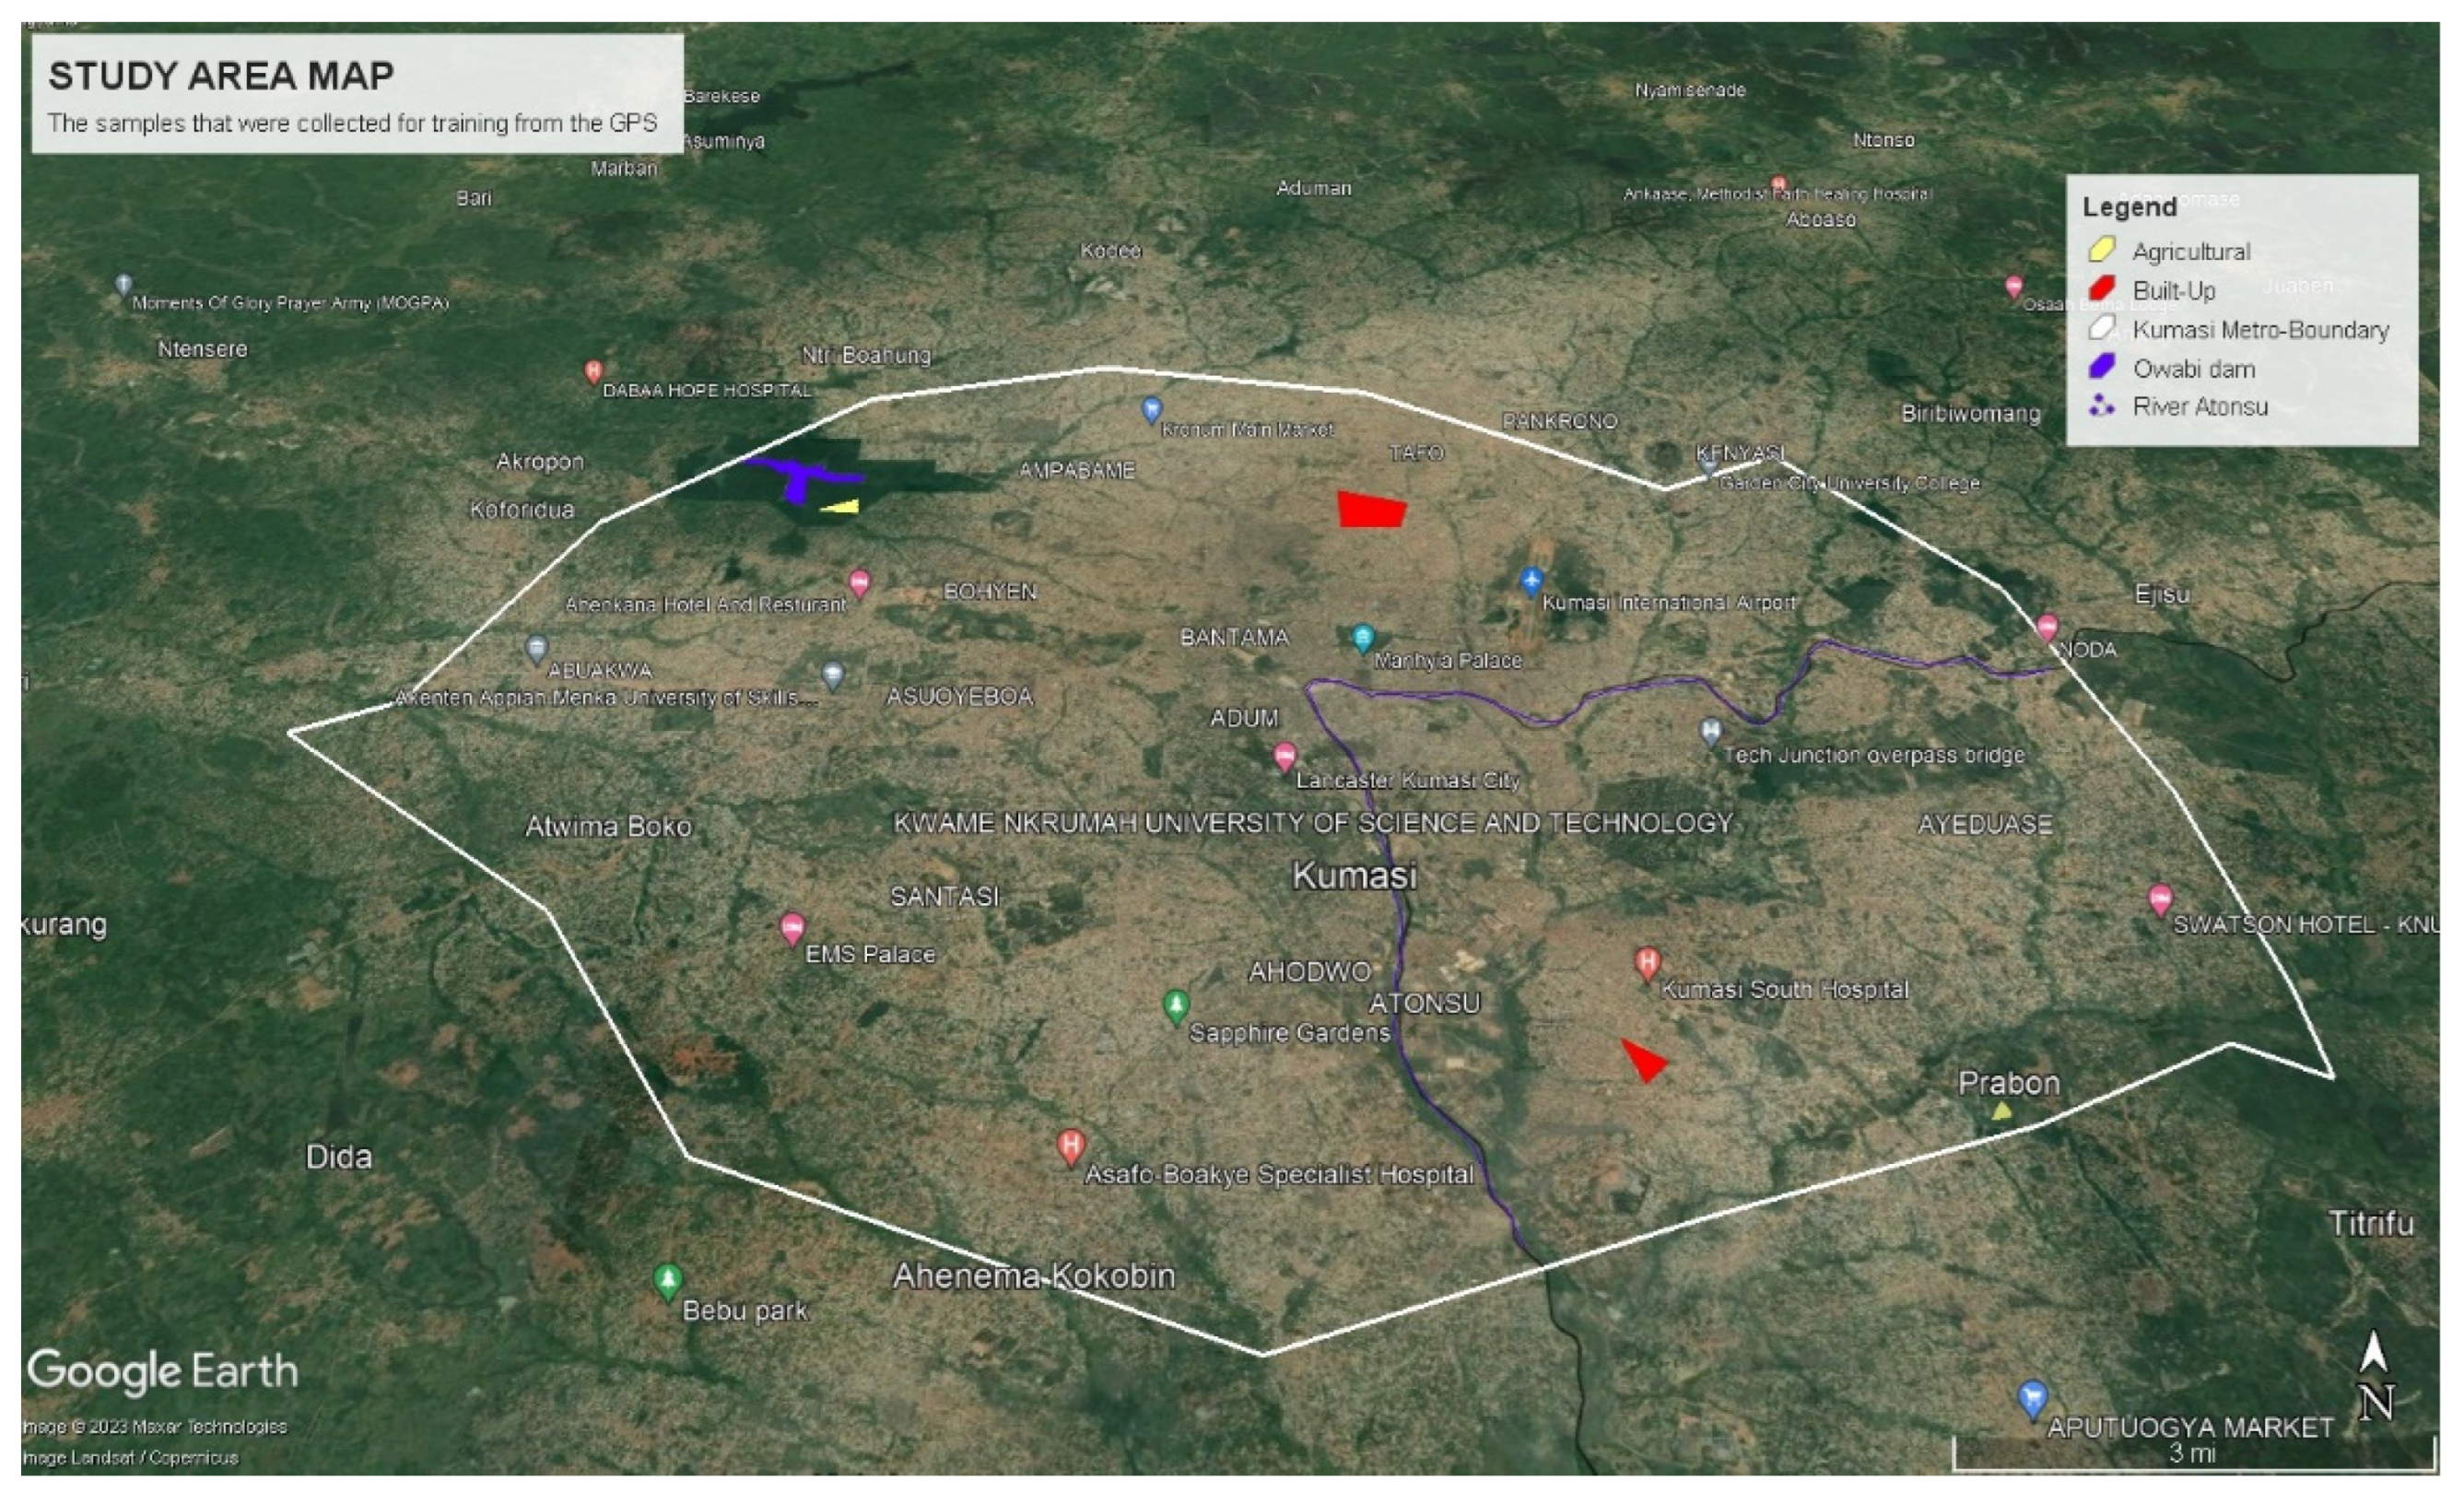
Figure 2.
Flow chart of the methodology: (a)shows summary of the methodology used in the study.
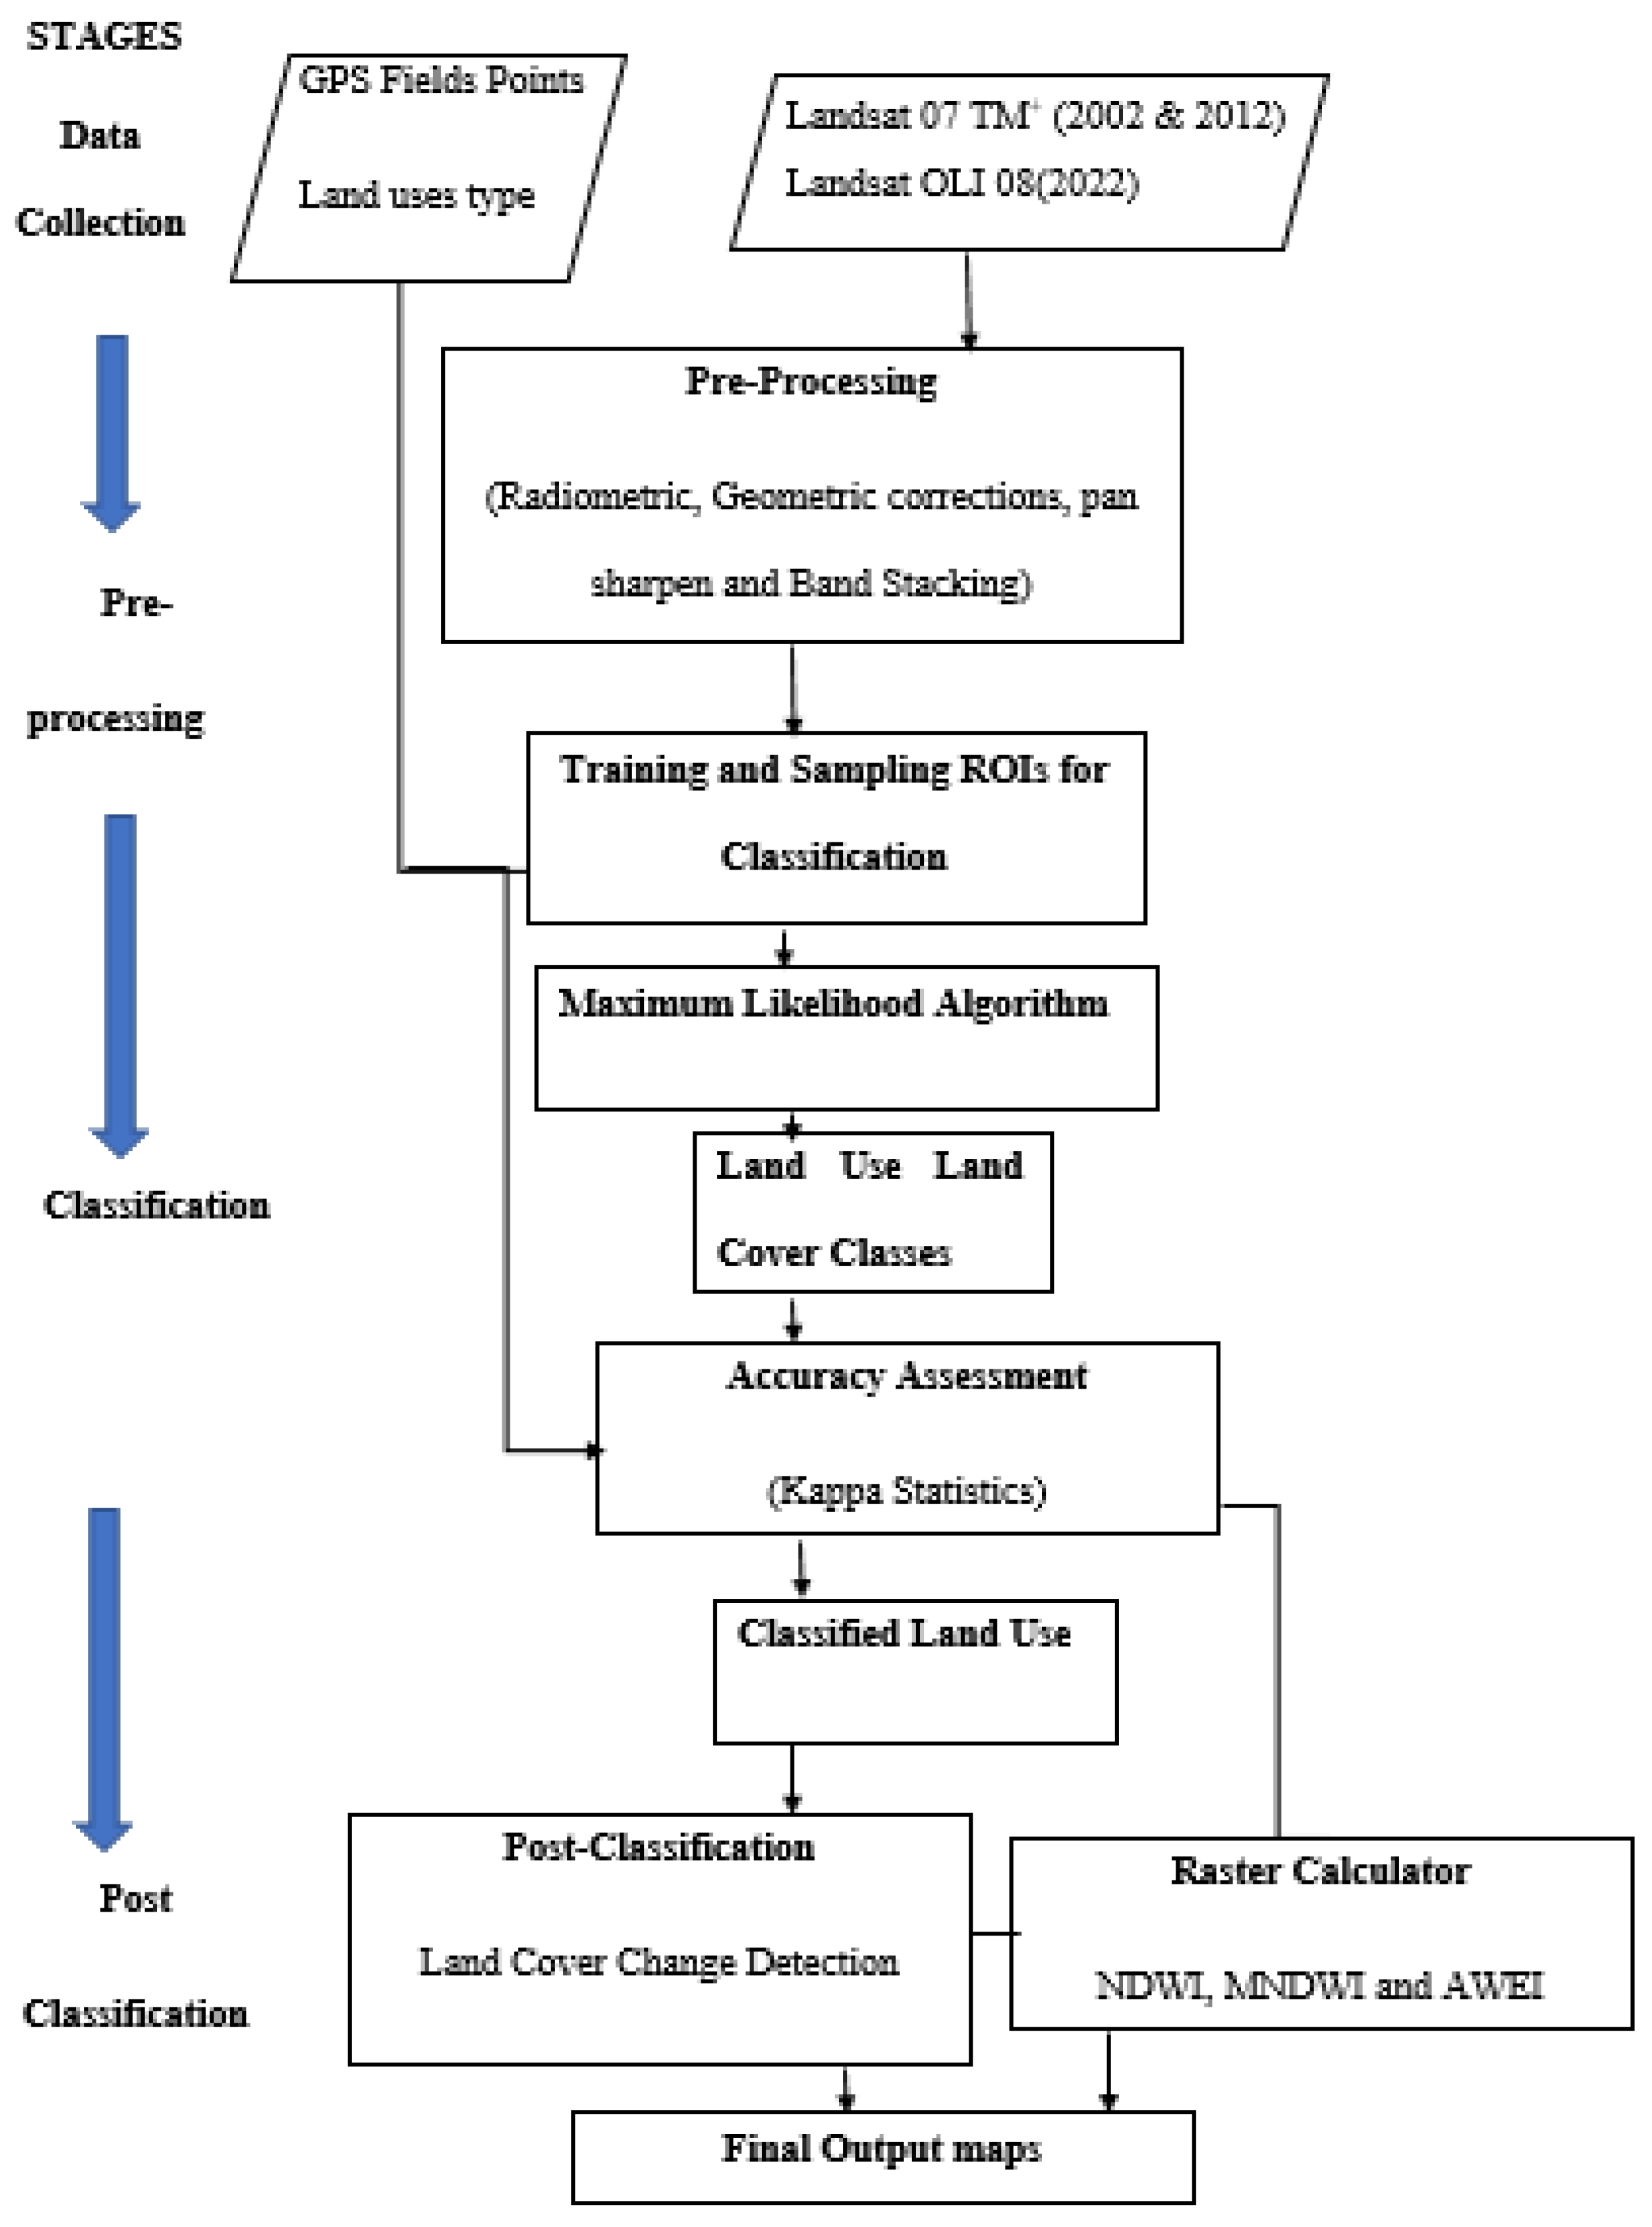
Figure 3.
Land Uses in the Kumasi Metropolis within 20 years: (a)shows land use in the year 2002; (b) shows land use in the year 20120; (c) shows land use in the year 2022.
Figure 3.
Land Uses in the Kumasi Metropolis within 20 years: (a)shows land use in the year 2002; (b) shows land use in the year 20120; (c) shows land use in the year 2022.
Figure 4.
Surface water land use in the Kumasi Metropolis within 20 years: (a)shows surface water detected in the year 2002 using NDWI; (b) shows surface water detected in the year 20120 using MNDWI; (c) shows surface water detected in the year 2022 using NDWI.; (d)shows surface water detected in the year 2002 using MNDWI; (e) shows surface water detected in the year 20120 using MNDWI; (f) shows surface water detected in the year 2022 using MNDWI (g)shows surface water detected in the year 2002 using AWEI; (h) shows surface water detected in the year 20120 using AWEI; (i) shows surface water detected in the year 2022 using AWEI.
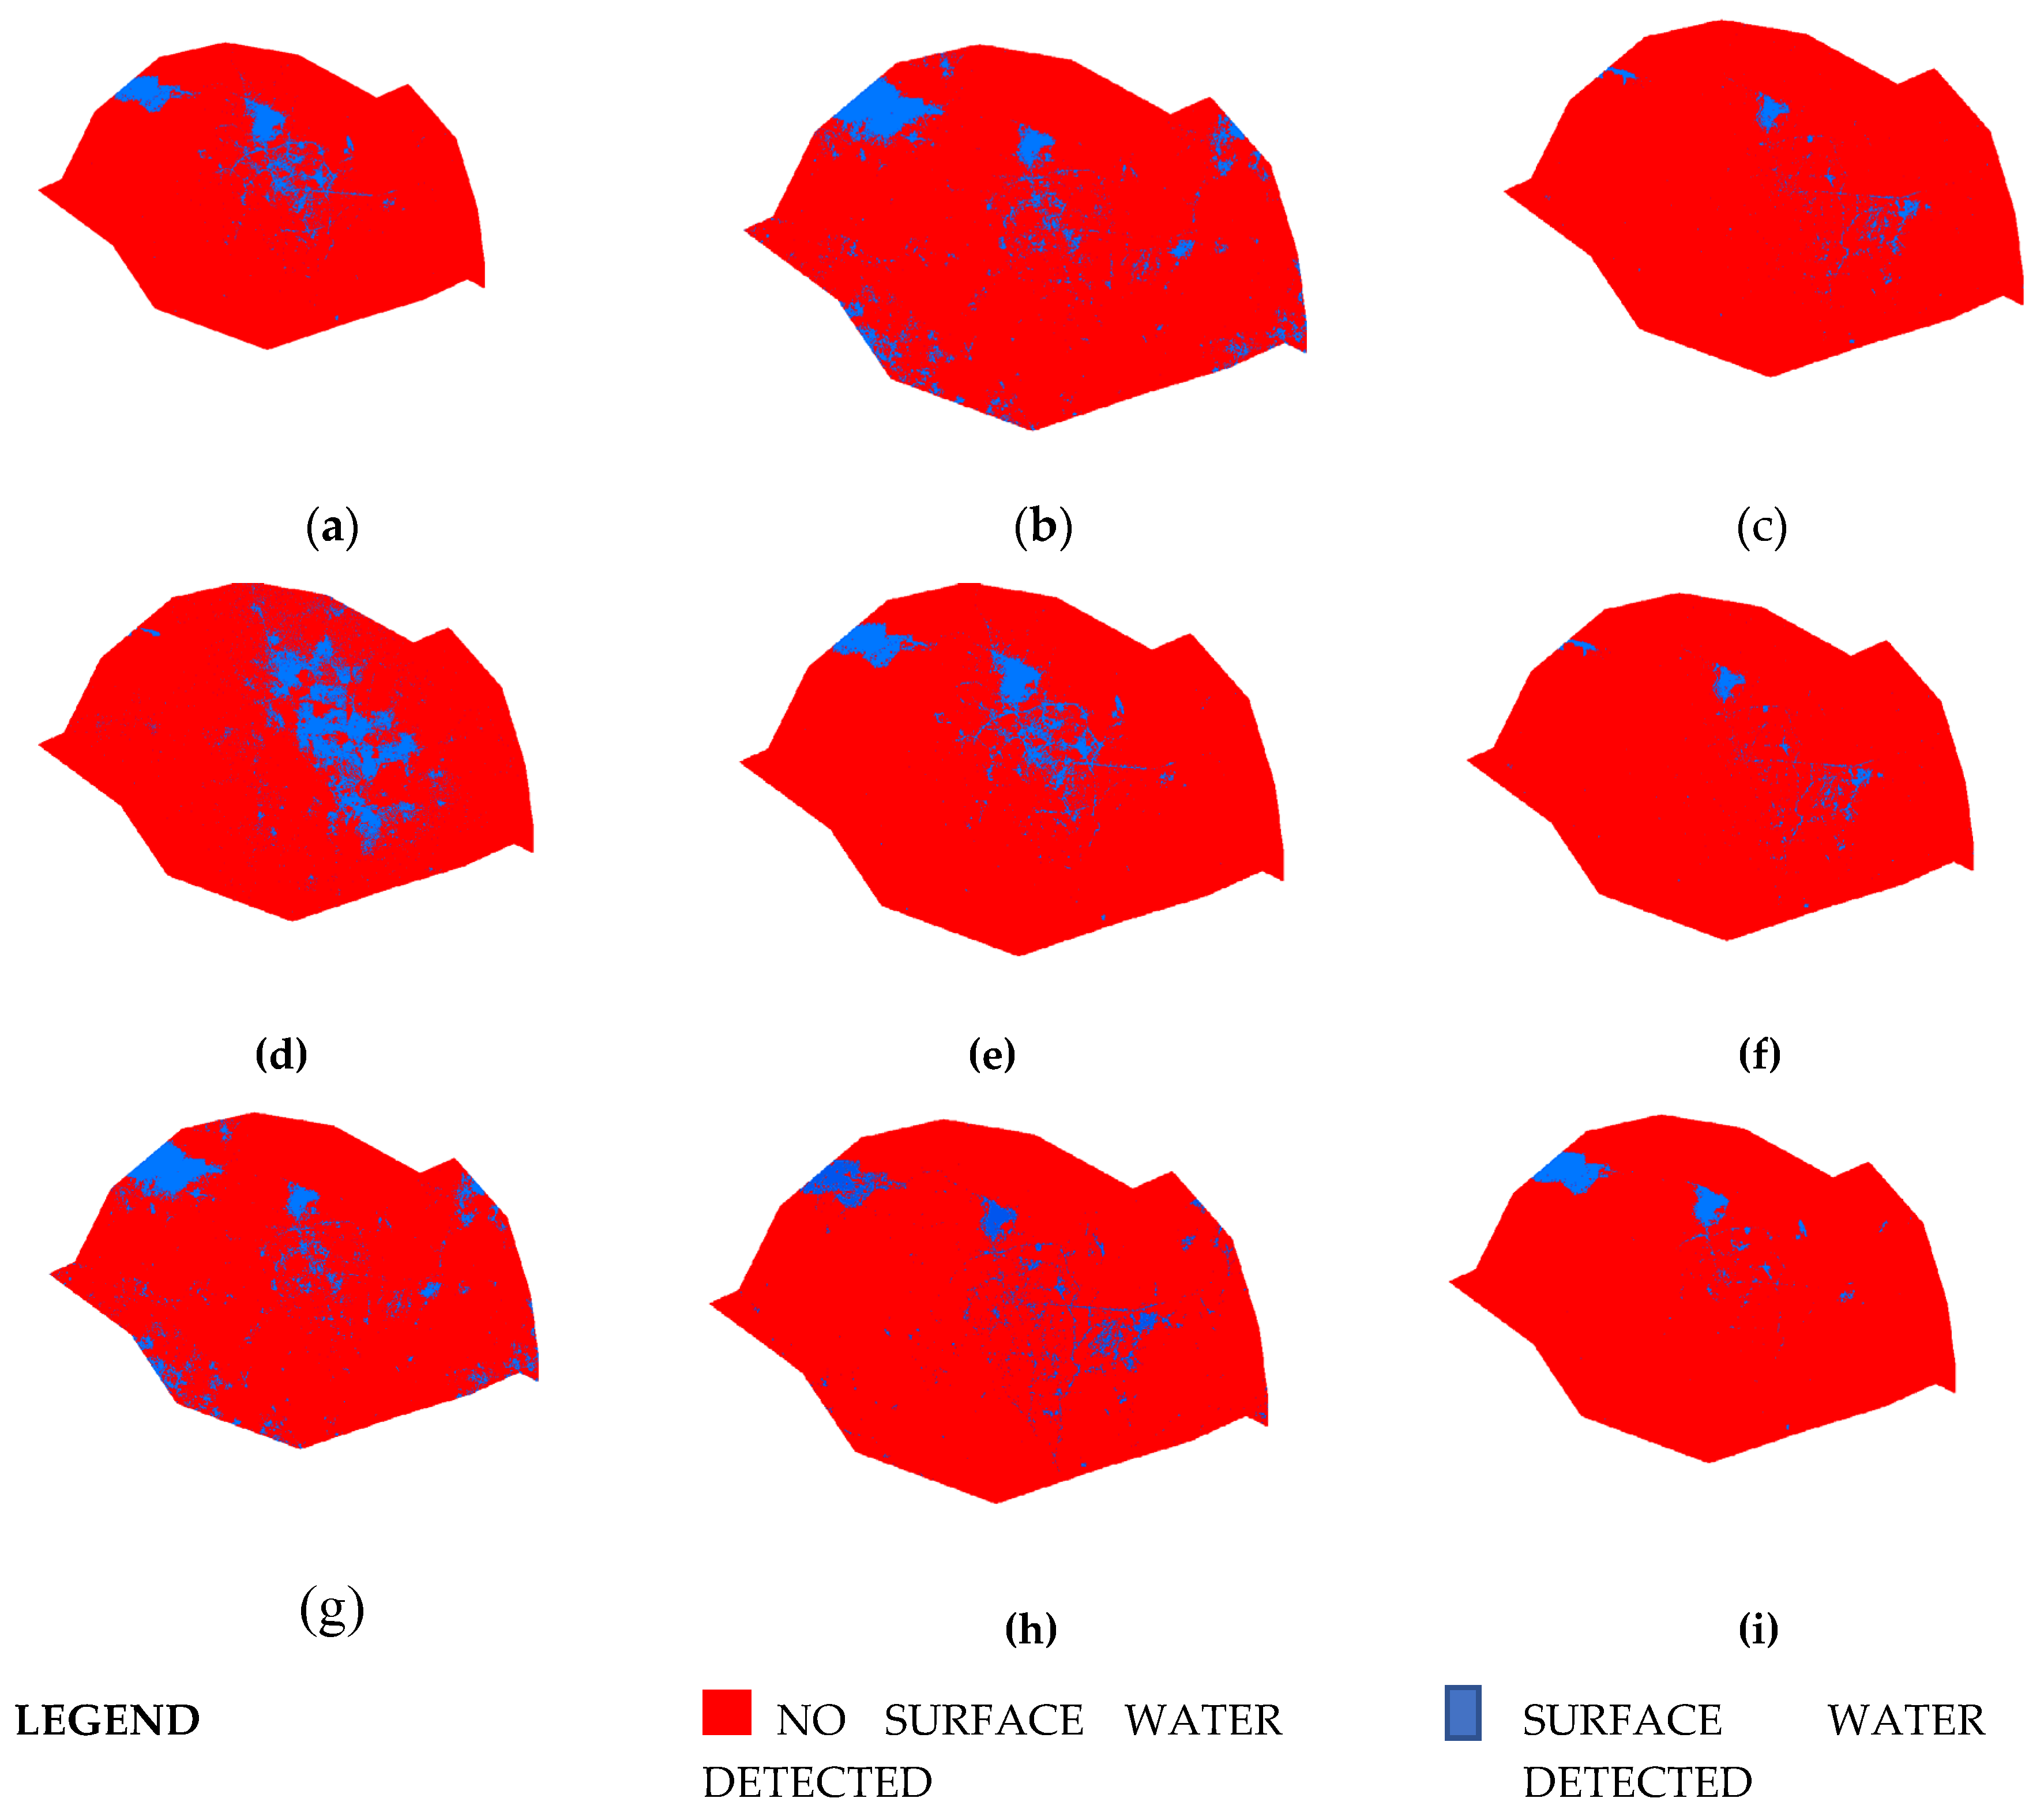
Figure 5.
Depletion of wet land and Surface water land use changes in the Kumasi Metropolis within 20 years: (a)shows changes in land use from the year 2002 -2012; (b) shows changes in land use from the year 2012-2022; (c) shows changes in land use from the year 2002-2022; (d)shows surface water changes in the year 2002 -2012; (e) show surface water changes in the year 2012-2022; (f) shows surface water changes in the year 2002-2022.
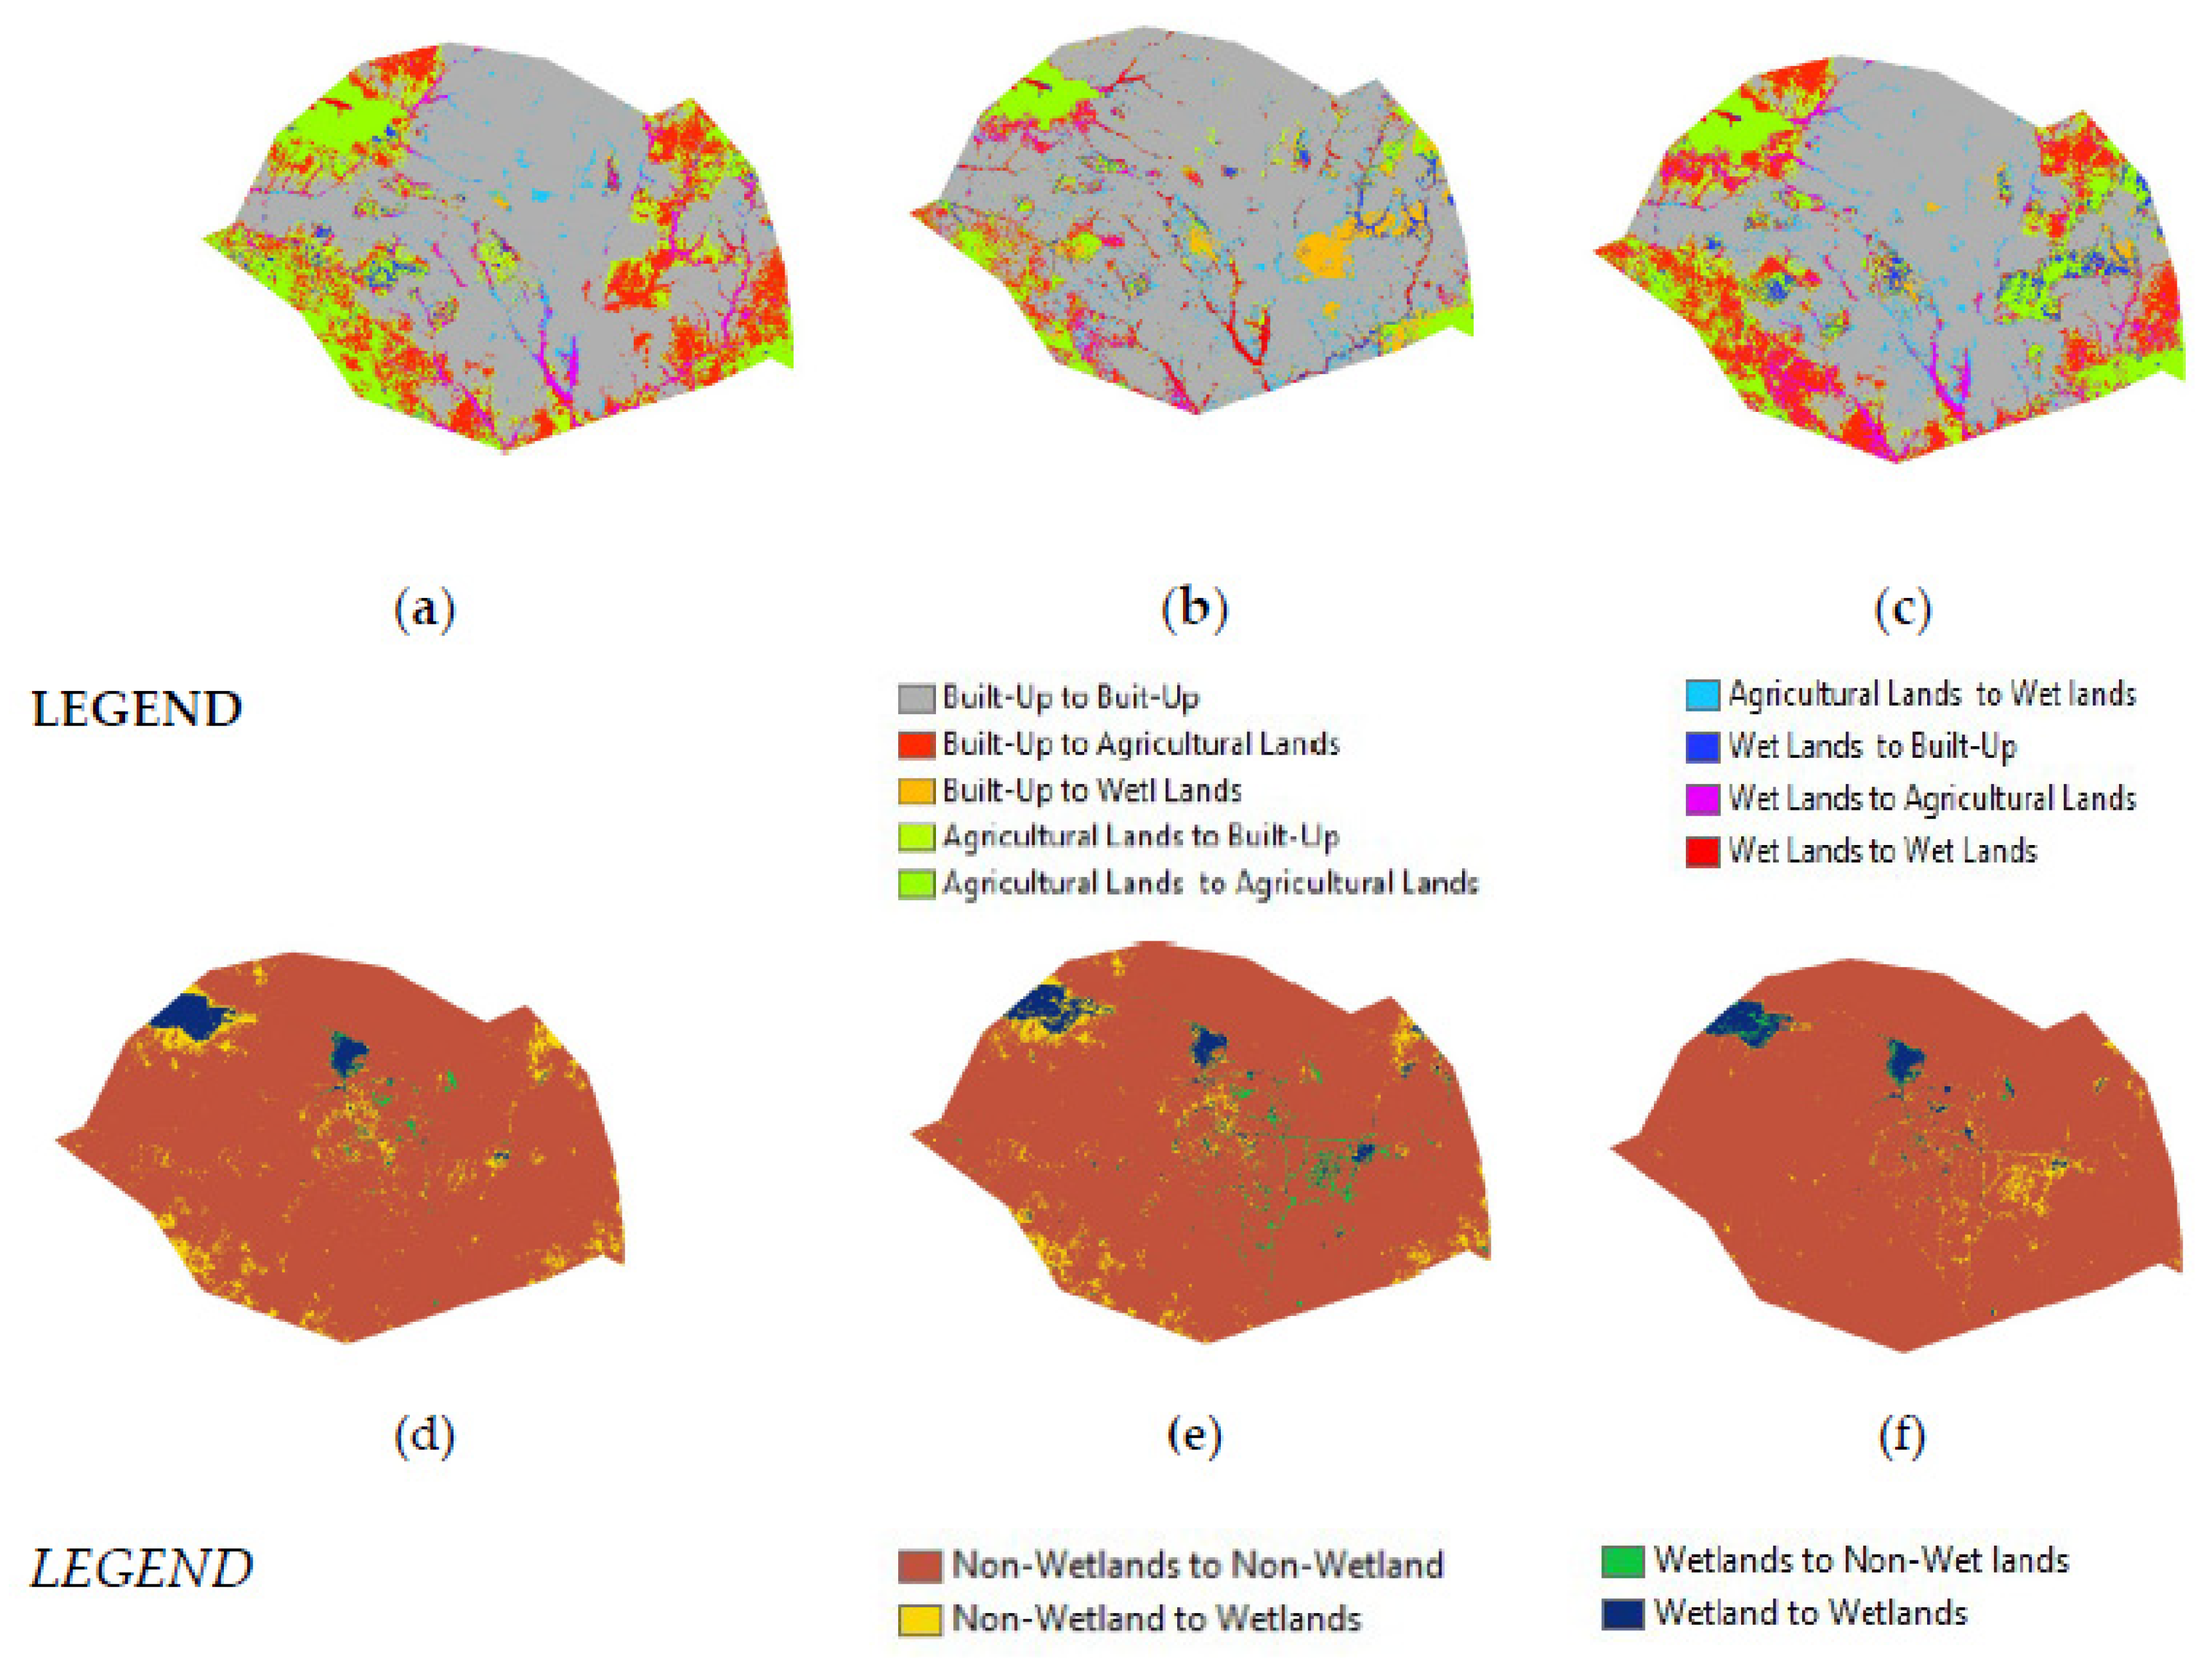

Table 1.
Details of land use classes.
| Land Use Class | Detail Description |
|---|---|
| Built-Up | A developed or urbanized area, typically consisting of buildings, roads, and other infrastructure. |
| Agricultural Lands | Areas of land that are used for growing crops, raising livestock, or other agricultural purposes. These lands may include fields, pastures, orchards, vineyards, or other areas used for farming |
| Wet Lands | Areas of land where water is the primary factor controlling the environment and the associated plant and animal life. These areas can be characterized by wet or waterlogged soil, and can occur in a variety of landscapes such as coastal areas, floodplains, and river basins. |
Table 2.
Land Use in the Kumasi Metropolis, Ghana.
| Land Use Class | Year | |||||
|---|---|---|---|---|---|---|
| 2002 | 2012 | 2020 | ||||
| ha | % | ha | % | ha | % | |
| Built-Up | 17520.79 | 58.7 | 22545.91 | 75.6 | 23702.89 | 79.4 |
| Agricultural Lands | 8951.75 | 30.0 | 4306.13 | 14.4 | 3969.32 | 13.3 |
| Wet Lands | 3367.70 | 11.3 | 2988.19 | 10.0 | 2168.03 | 7.3 |
| Total | 29,829.25 | 100.0 | 29,829.25 | 100.0 | 29,829.25 | 100 |
Table 3.
NDWI, MNDWI and AWEI methods (2002, 2012 and 2022).
| Indices | Surface Water Extraction | Land Cover | |||
|---|---|---|---|---|---|
| Non-Water | Water | ||||
| ha | % | ha | % | ||
| LANDSAT 07 SATELLITE IMAGE (2002) | |||||
| Normalized Difference Water Index (NDWI) | Positive | 27385.71 | 91.7 | 2480.78 | 8.3 |
| Modified Normalized Difference Water Index (MNDWI) | Positive | 27322.09 | 91.8 | 2444.10 | 8.2 |
| Automated Water Extraction Index (AWEI) | Positive | 27509.4675 | 92.1 | 2357.03 | 7.9 |
| LANDSAT 08 SATELLITE IMAGE (2012) | |||||
| Normalized Difference Water Index (NDWI) | Positive | 28843.29 | 96.6 | 1023.21 | 3.4 |
| Modified Normalized Difference Water Index (MNDWI) | Positive | 28232.76 | 95.9 | 1127.350 | 4.1 |
| Automated Water Extraction Index (AWEI) | Positive | 28466.21 | 95.3 | 1400.287 | 4.7 |
| LANDSAT 08 SATELLITE IMAGE (2022) | |||||
| Normalized Difference Water Index (NDWI) | Positive | 28843.29 | 96.6 | 1003.21 | 3.4 |
| Modified Normalized Difference Water Index (MNDWI) | Positive | 28286.13 | 96.3 | 1086.36 | 3.7 |
| Automated Water Extraction Index (AWEI) | Positive | 29007.02 | 97.1 | 859.47 | 2.9 |
Table 4.
Wet land and Surface water land use changes in the Kumasi Metropolis.
| Year | Classes | Changes | |
| ha | % | ||
| 2002 to 2012 |
Built-up to Built-up | 11,232.4903 | 62.9 |
| Built-up to Agricultural lands | 101.53 | 0.5 | |
| Built-up to Wetlands | 159.4849 | 0.9 | |
| Agricultural lands to Built-up | 2391.9588 | 13.4 | |
| Agricultural lands to Agricultural lands | 1487.4914 | 8.3 | |
| Agricultural lands to wetlands | 855.1962 | 4.8 | |
| Wetlands to Built-up | 428.5538 | 2.4 | |
| wetlands to Agricultural lands | 910.5167 | 5.1 | |
| Wetlands to wetlands | 297.8536 | 1.7 | |
| 2012 to 2022 |
Built-up to Built-up | 12,620.3016 | 73.7 |
| Built-up to Agricultural lands | 121.58 | 0.7 | |
| Built-up to Wetlands | 78.4157 | 0.4 | |
| Agricultural lands to Built-up | 1593.4098 | 8.9 | |
| Agricultural lands to Agricultural lands | 1747.7675 | 9.8 | |
| Agricultural lands to wetlands | 452.2787 | 2.5 | |
| Wetlands to Built-up | 293.7158 | 1.6 | |
| wetlands to Agricultural lands | 778.8944 | 4.4 | |
| Wetlands to wetlands | 178.7121 | 1.0 | |
| 2002 to 2022 |
Built-up to Built-up | 13255.4031 | 73.8 |
| Built-up to Agricultural lands | 69.39 | 0.8 | |
| Built-up to Wetlands | 827.311 | 1.6 | |
| Agricultural lands to Built-up | 1046.6815 | 5.9 | |
| Agricultural lands to Agricultural lands | 978.8577 | 5.5 | |
| Agricultural lands to wetlands | 401.1859 | 2.2 | |
| Wetlands to Built-up | 739.3380 | 4.1 | |
| wetlands to Agricultural lands | 277.5469 | 1.6 | |
| Wetlands to wetlands | 269.3613 | 1.5 | |
| Total | 29,829.25 | 100.0 | |
Disclaimer/Publisher’s Note: The statements, opinions and data contained in all publications are solely those of the individual author(s) and contributor(s) and not of MDPI and/or the editor(s). MDPI and/or the editor(s) disclaim responsibility for any injury to people or property resulting from any ideas, methods, instructions or products referred to in the content. |
© 2023 by the authors. Licensee MDPI, Basel, Switzerland. This article is an open access article distributed under the terms and conditions of the Creative Commons Attribution (CC BY) license (http://creativecommons.org/licenses/by/4.0/).
Copyright: This open access article is published under a Creative Commons CC BY 4.0 license, which permit the free download, distribution, and reuse, provided that the author and preprint are cited in any reuse.


