
Submitted:
01 April 2023
Posted:
07 April 2023
You are already at the latest version
Abstract
Background. To prospectively evaluate the reliability of a portable optical scanner compared to the water displacement technique for volumetric measurements of the foot and ankle, and to compare the acquisition time associated with these two methods. Methods. Foot volume was measured in 29 healthy volunteers (58 feet, 24 female/5 male) by a 3D scanner (UPOD-S 3D Laser Full-Foot Scanner ®) and by water-displacement volumetry. Measurements were performed on both feet, up to a height of 10 cm above the ground. The acquisition time for each method was evaluated. Kolmogorov-Smirnov test, Lin's Concordance Correlation Coefficient, and a Student’s t-test were performed. Results: Mean foot volume was 869.7+/-165.1cm3 (3D scanner) versus 867.9+/-155.4cm3 (water-displacement volumetry) (p <10-5). Concordance of measurements was 0.93, indicative of a high correlation between the two techniques. Volumes were 47.8 cm3 lower when using the 3D scanner versus water volumetry. After statistically correcting this underestimation, the concordance was improved (0.98, residual bias = -0.03 +/- 35.1 cm3). Mean examination time was 4.2 +/-1.7 min (3D optical scanner) versus 11.1 +/-2.9 min (water volumeter) (p<10-4). Conclusion: Ankle/foot volumetric measurements performed using this portable 3D scanner are reliable and fast, and can be used in clinical practice and research.
Keywords:
optical scanner
; 3D imaging
; foot volume
; volumetric measurements
; water volumeter
1. Introduction
Edema is a swelling of soft tissues due to an abnormal build-up of interstitial fluid. It is caused by increased movement of fluids from the intravascular space towards the interstitial space, or decreased movement of water from the interstitial tissue to the capillaries or lymphatic vessels. At the level of the ankle and the foot, the edema severity is compounded due to orthostatic pressure, making this joint segment a predominant location, which generates significant symptomatology (pain, tension, joint stiffness), difficulty in putting on one’s shoes (a source of loss of locomotor function) and significant psychosocial impact [1,2].
The circulatory system, lymphatic system, and the kidneys are the main body systems that assist in preserving the proper fluid balance in the body. Any disruption of the homeostasis of these systems can lead to fluid retention. Peripheral edema, which results from the buildup of fluid in tissue, affects the legs and feet. In the case of heart failure decompensation, for instance, the clinically significant size of volume change for edema detection is 13.1% [3]. Therefore, the recognition of more subtle volume variations is useful in clinical practice. Moreover, previous evidence demonstrated that a normal patient’s uninjured foot and ankle can reliably be used as a control limb at any time of day, whether the subject is ambulating or not. Moholkar et al [4] investigated the diurnal variations in volumes of feet and ankles including both ambulant and bed bound normal subjects, by means of a commercially available volumeter. They came to the conclusion that a normal patient’s uninjured foot and ankle could be used as a control limb at any time of day, whether the subject was ambulating or not. It is possible to accurately compare the volume of the affected side to the volume of the injured foot. Volumetric measurements are recommended in both bilateral and one-sided traumatic foot and ankle swellings.
Foot and ankle volume measurements have many applications. The most obvious are in the medical field. The use of a device to assess the volume of the foot and ankle would be useful in assessing and monitoring several pathologies. For instance, in the case of cardiac disease, cardiac decompensation could be assessed and managed by tracking foot and ankle edema and the physician could track improvement or decompensation by gauging the edema. Lymphatic issues can also be monitored using this same method [5,6,7]. It would also be useful to monitor edema after surgery on the lower limbs. Most of the time, after surgical treatment, the edema gradually regresses until it disappears completely. Monitoring the edema would allow the physician to know the patient’s stage of improvement by following them regularly in the clinic. Similarly, volume monitoring would allow comparison of different rehabilitation methods and techniques such as drainage massage, compression stocks or bandages after surgery [8]. On the other hand, if there is a progressive worsening of the volume after surgery, the physician must be alert to potential complications such as postoperative infection, even though the incidence of postoperative infection has decreased in recent decades thanks to new protocols and technological applications [9].
The manufacture of shoes or insoles could also benefit from this type of technology. Knowing the exact volume, the difference in volume between the genders, the variation in volume over the course of a day or sports activities would be beneficial for the manufacture of shoes [10,11,12,13]. Once again, the medical field could improve the management of footwear for different foot morphotypes or conditions such as Cavo varus feet, progressive collapsing foot deformity or hallux valgus [14,15,16,17]. Sports footwear enhancement can also benefit from foot and ankle volume measurements with two goals: to decrease the incidence of injury and to improve sports performance [18,19].
Having reliable methods to assess foot and ankle edema seems essential. In the literature, several methods for measuring lower limb oedema have been described:
- Measuring foot and ankle volume by water displacement or water volumetry remains the reference method [20,21,22]. Some authors use inverse water volumetry [23], which consists in placing a dry foot in a volumeter that has been filled up to a predetermined level. Foot volume is determined either by assessing the volume of water that overflows from the foot volumeter, or by the volume of water that needs to be added after retracting the foot from the volumeter to return to initial water levels (“inverse” method). The advantages of water volumetry are practicability and reproducibility [22]. However, in daily clinical practice, managing water volumes, maintaining water hygiene, and time taken may represent significant issues. Moreover, immersing a limb presenting with any kind of skin lesion in water is not advised.
- In daily clinical practice, perimetric (non-volumetric) measurements constitute the most frequently adopted method, although reproducibility and inter-rater reliability are low [24]. To improve reproducibility, several studies have shown the interest of figure-of-eight methods [25], or the added value of professional experience in raters [26]. Using tape measure methods, some studies have attempted to calculate the volume of a limb based on mathematical methods, without, however, paying attention to distal volumes (fingers or toes) [26], and with 8 to 12% error margins when compared to the reference method [27]. For foot/ankle measurements, some surveys have proposed mathematical formulas to determine volume from perimetric measurements performed on particular cutaneous points of reference [28].
- Several 3D scan measurement methods have been described in previous surveys. Most of them were used for knee joint measurements. Of note, knee joint 3D morphology is less problematic to assess than that of the foot and toes [29,30]. Indeed, the foot as well as the hand, because of the difficulties to define precisely the volumes of the fingers and toes, are more difficult to assess [31]. These techniques are associated with high reproducibility. However, they have often been assessed with reference to tape measure methods [32], much more rarely to the reference method (water volumetry) [27]. Tape measures are non-weight-bearing measurements. Measuring foot and ankle volume, without the application of weight, and only on limb segments, excluding the foot and toes, is potentially biased [33].
In both clinical and research contexts, it is critical to have a reliable and simple method for determining foot volume when it comes to evaluate peripheral edema or certain types of foot and ankle injuries [34] . While “pitting” in clinical settings and the use of a water volumetry or tape measurements (either ankle circumference or figure of eight) in research settings are considered the gold standard procedures, these techniques are prone to human error of measurements.
Thus, our primary objective was to assess the reliability of a 3D portable scanner for obtaining volumetric measurements of the foot and ankle, in comparison with water volumetry, considered as the reference method. A secondary objective was to compare time taken in both methods.
Our hypothesis was that this 3D portable scanner is reliable and allowed quick volumetric measurements of the foot and ankle.
2. Materials and Methods
This prospective, non-interventional study was conducted on 29 healthy volunteer subjects (58 feet assessed overall). Oral consent was obtained before participation ; and approval for this study has been obtained beforehand from the institutional review board of CPP GHT Grand Paris Nord Est on September 29,2021 (approvals # Si-RIPH2G: 21.01741.000023 and NRCB 2021-A01802.39).Subjects who declined to participate in the study, or presented with dermatological disease, or who were unable to stand on both feet were not included. Overall, 24 female and 5 male subjects were included (mean age 35.6 +/- 9.5 years, range 9-55). Self-declared shoe size was 38.17 +/-3,23 (range 30-45). Demographic characteristics are shown in Table 1. Each foot was measured both by portable optical scanner and by water volumetry.
A non-irrradiating, portable (13Kg, 27x52x22 cm.) 3D scanner was used (UPOD-S 3D Laser Full-Foot Scanner ®, East Lake, Wuhan City, Hubei Province, China 430075). It allowed to obtain 3D models of foot/ankle up to a maximum height of 11.5 cm from plantar support. The scanner was used with its dedicated software (UPOD-3D Foot full scan, East Lake, Wuhan City, Hubei Province, China 430075), allowing to obtain 3D models of the foot (linear precision 1 mm.) and to automatically export a series of specific foot/ankle measurements (perimeters, distances, angles). Subjects were positioned standing on both feet (one foot in the scanner, the other one on a footrest at the same height). Each foot was scanned in less than 4 seconds. (Figure 1). The measurement method used as a reference was water displacement with a volumeter, (overflow technique) [35]. (Figure 2).
Each foot of each subject was first immersed in the volumeter to determine its volume. After the volume of each foot had been determined by the overflow method, the volume of each foot was then determined by the 3D optical scan followed by computerized processing of measurements. We elected to limit measurement height to 10 cm above plantar support, to focus on the foot and ankle volume only, excluding the distal leg, to minimize possible bias associated with angular positioning of the ankle in the scanner. All measurements were carried out by the same rater. Mean time of acquisition for each foot was obtained by an independent rater, including removal of shoes, drying of the feet, and return to initial “shoes on” status.
Statistical analyses were performed by an independent statistician. Concordance between the two methods was validated using the Bland-Altman method, and by Lin’s (CCC), after conducting a Kolmogorov-Smirnov test to ensure that differences between the two methods were normal. As for acquisition times for each foot, durations of clinical tests were studied by assessing the differences between mean spent times (paired quantitative data measured in the same individuals), using Student’s t-test (threshold 5%), after verifying our hypothesis of normalcy using the Kolmogorov-Smirnov test.
3. Results
3.1.
- Mean foot volume when measured by 3D scanner was 869.7+/-165.1cm3, versus 867.9+/-155.4cm3 when using water-displacement volumetry (p <10-5). Concordance of gross measurements, measured by Lin’s CCC was 0.93, indicative of an excellent correlation between the two techniques. No deviation from normalcy was shown for the difference in measurement between water volume and scanner volume (p=0.2), which allowed the application of the Bland and Altman method (Table 2).
- Measurement discrepancy was 47.8 cm3, showing underestimation when using 3D scanner versus water volumetry. After correcting results yielded by the 3D scanner method for this value (“corrected 3D scanner measurement”), an excellent concordance was demonstrated between the two techniques (LIN’s CCC= 0.98, residual bias = -0.027 cm3 +/- 35.10 cm3), as shown in Table 3.
- Mean examination time was 4.2 +/-1,7 min when using the 3D optical scanner versus 11.1 +/-2,9 min when using the water volumeter. This was a statistically significant difference (p<10-4), as shown in Table 4.
3.2.
Figure 3.
Bland-Altman representation.
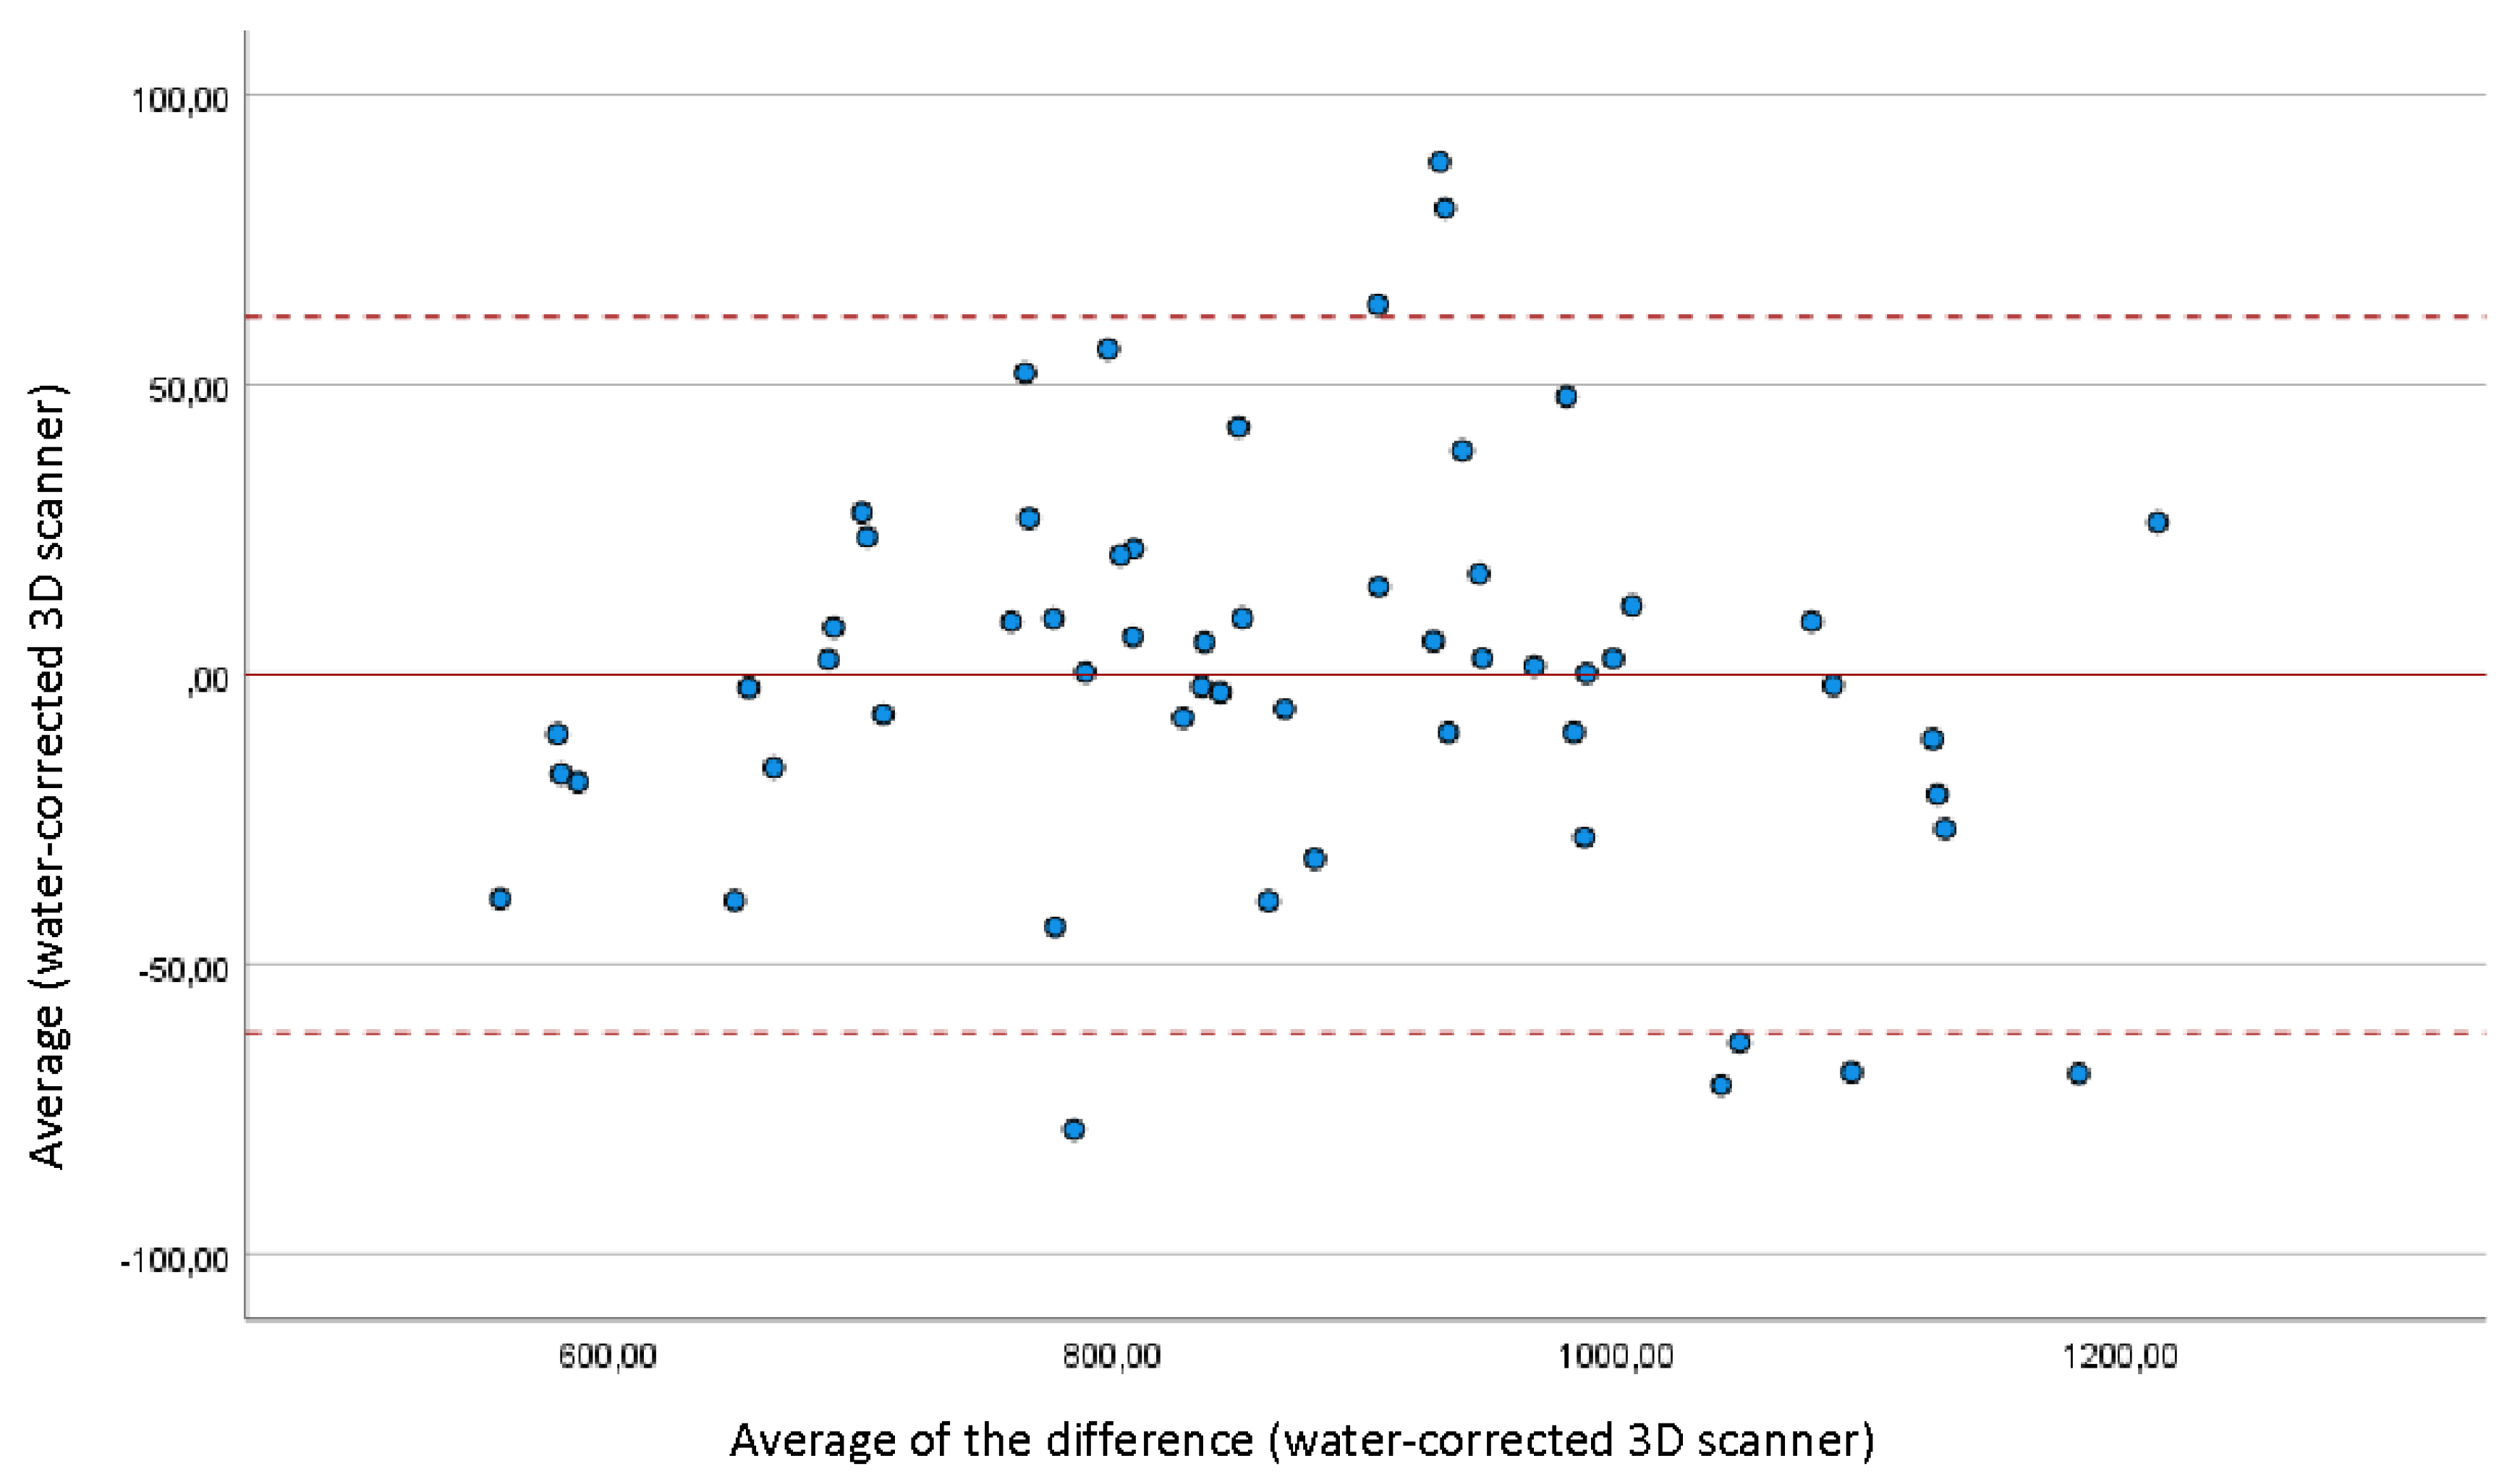
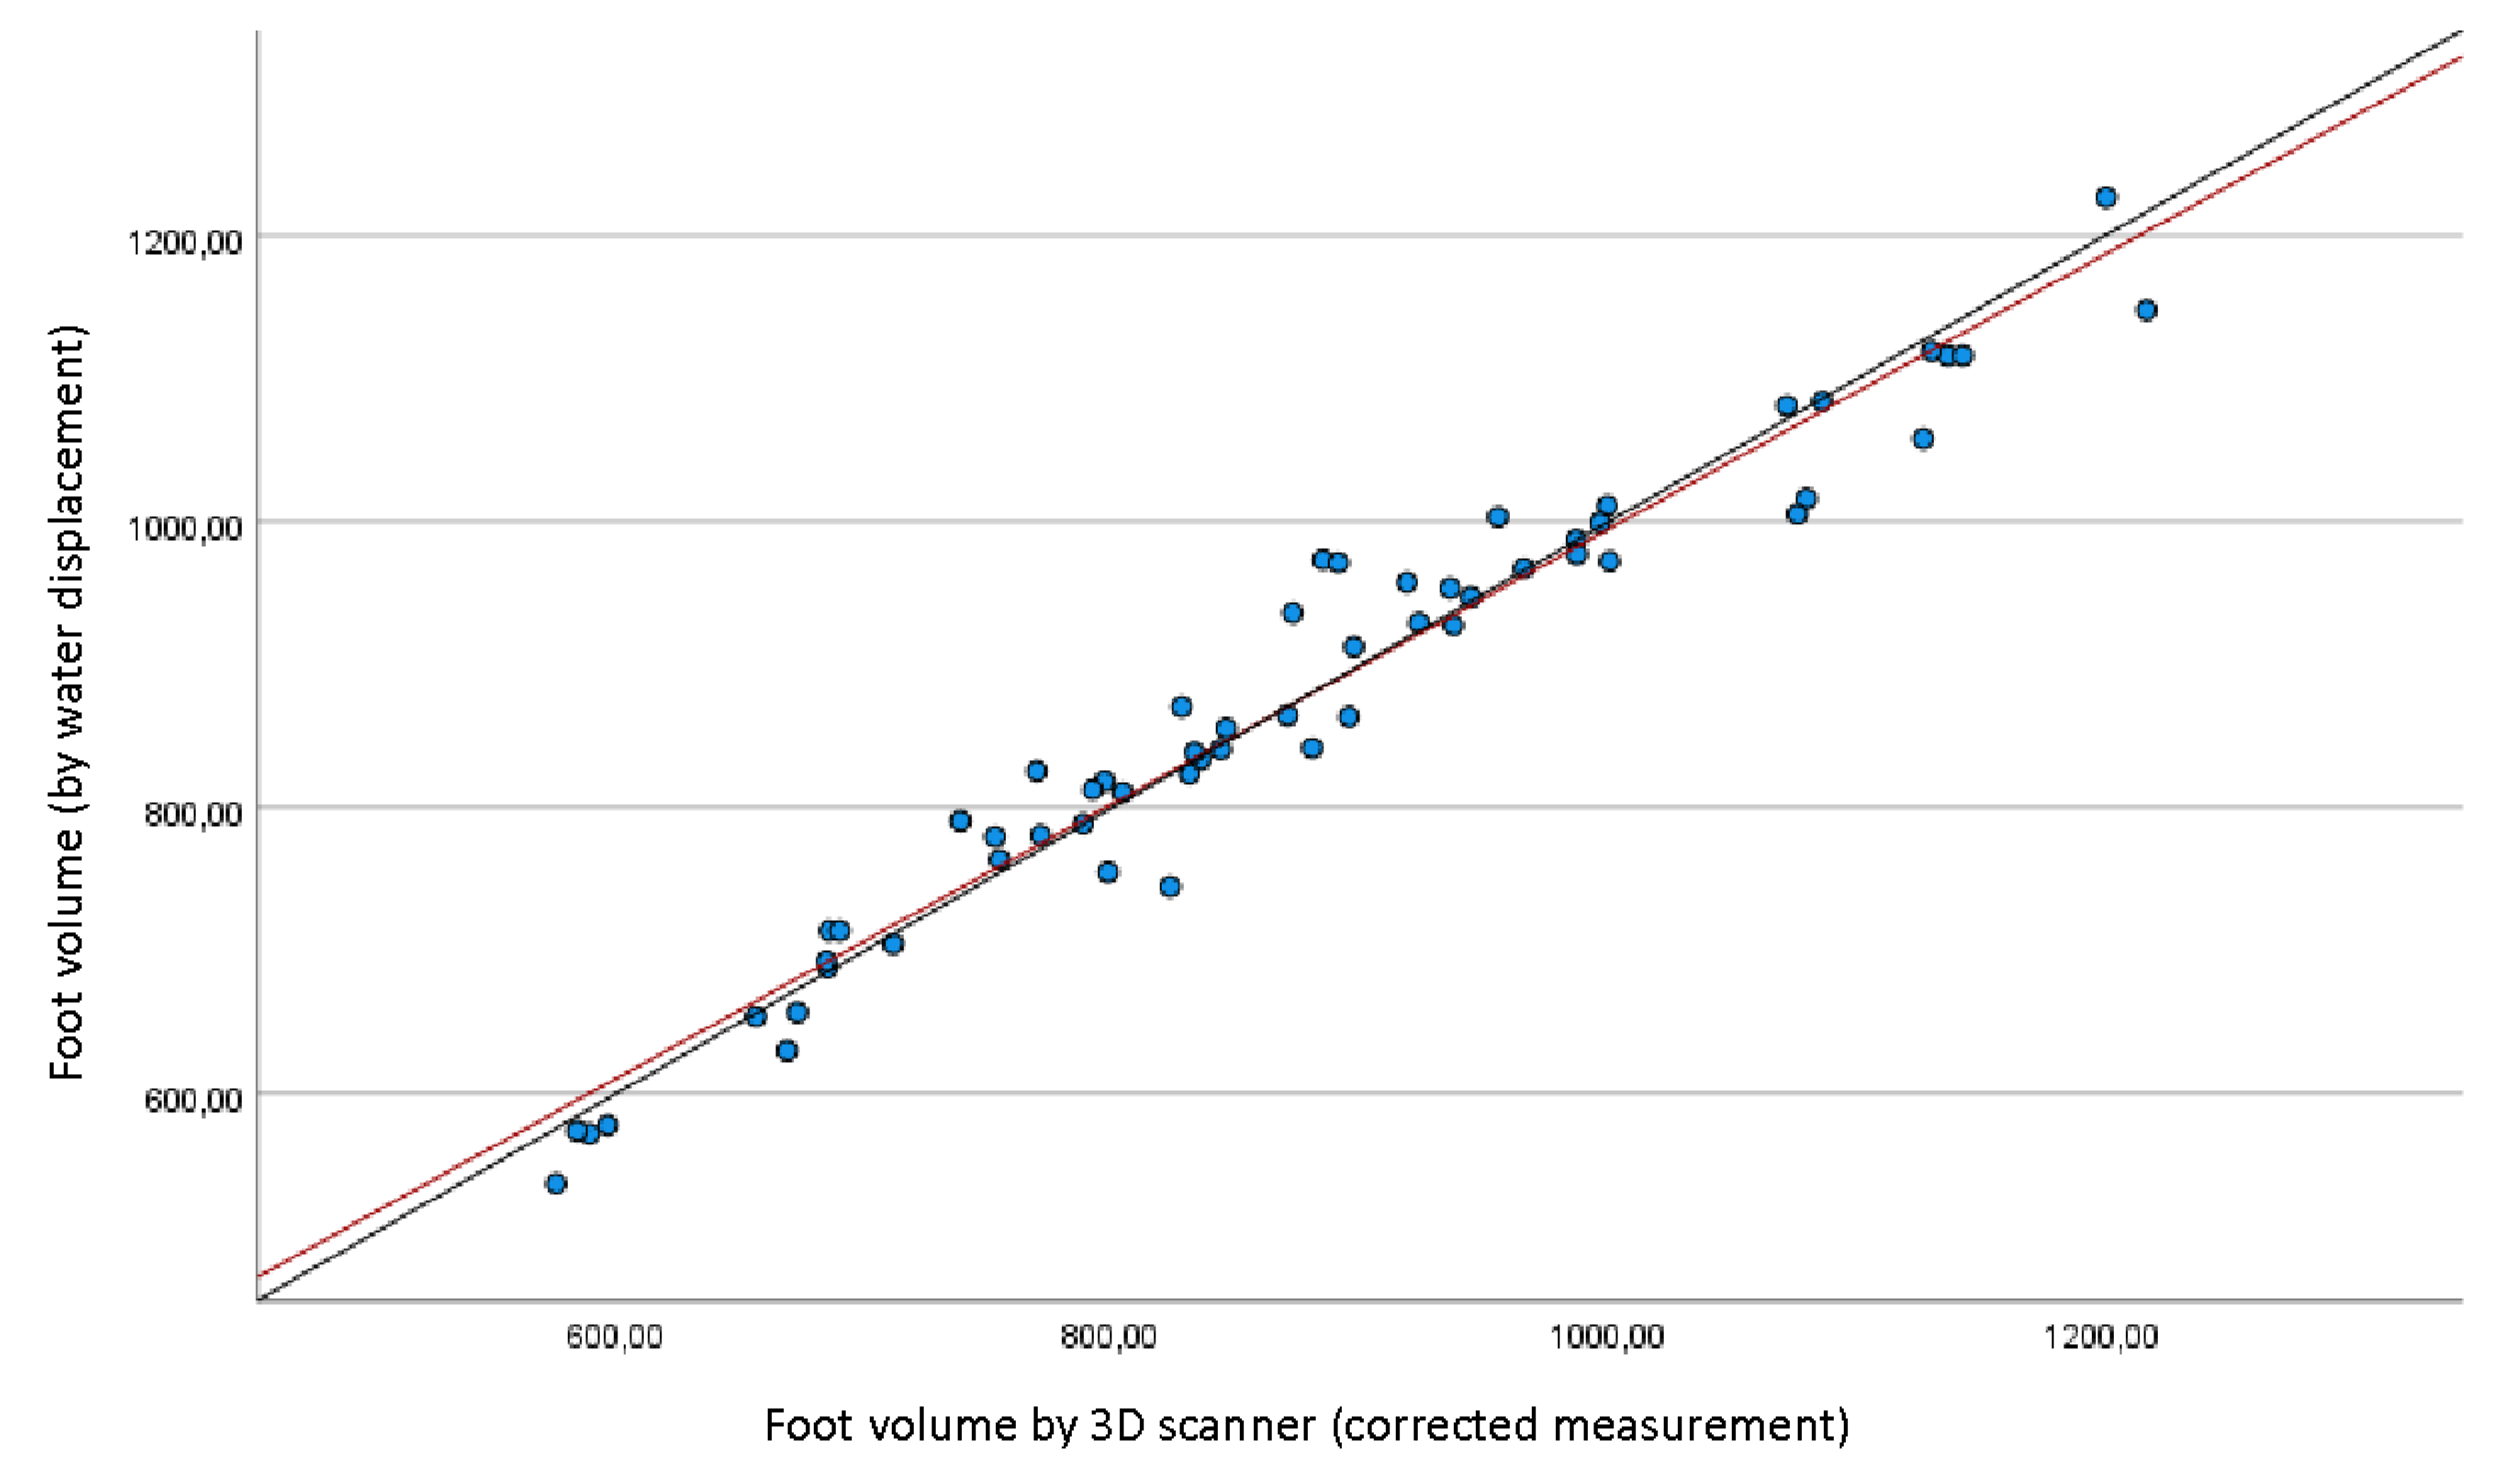
Figure 4.
Volume correlation diagram between the water displacement and the 3D corrected scanner measurements. Red line representing the linear regression curve and black line representing the egality line of the two techniques.
Figure 4.
Volume correlation diagram between the water displacement and the 3D corrected scanner measurements. Red line representing the linear regression curve and black line representing the egality line of the two techniques.
4. Discussion
Our study confirmed that our 3D optical scanner achieved excellent correlation with the reference method (0.92 in gross measurements, 0.98 after correcting for an underestimation bias when using the scanner method). Further, this technique allows to significantly reduce the time spent for examination when using water volumetry. Therefore, our hypothesis was confirmed. To the best of our knowledge, this is the first study that reports high correlation rates between a laser-based measuring technique and the reference method.
Several multidimensional morphological parameters, including foot length, width, circumference, and navicular height, characterize the volume and structure of the human foot. Foot and ankle volume are subjected to changes secondary to aerobic activities, lower-extremity trauma, or pathologic conditions [2,4]. The change following a surgical treatment is also important to consider [34], especially since the technique of the water basin, because of the wounds, is not suitable. The use of 3D optical scanners to track foot and ankle volume following surgery would also be an improvement. For example, it would be possible to detect septic complications following surgeries through such monitoring, although many advances in this area have reduced the incidence of postoperative infections [9].
In the clinical setting, volume measurements of the foot and ankle are performed to assess the severity of peripheral edema and the outcomes of medical therapies. In order to measure foot and ankle volumes, both 3D optical scanners and water displacement procedures are highly reliable. Water displacement or water volumetry are considered the gold standard. To date, several measurement methods and geometric algorithms have been investigated, including the prism approximation, the figure-of-eight tape measurement, and size measurement with the Brannock device [3,6,25,26]. These methods have been implemented as an useful alternative to water displacement measurements, but are subjected to the impact of human factors on measurement errors. According to our results, 3D optical scanners could be considered the new gold standard.
Given that several diseases related to changes in foot volume are chronic disorders that may benefit from long-term surveillance such as chronic venous leg ulcers [7], the prospects of applying this technology in clinical practice are attractive. This technology should also be applied in clinical trials to obtain reliable, non-invasive and objective measurement of foot and ankle volume.
In the literature, surveys assessing limb measurement with the use of a 3D technique are relatively recent, and have often been spurred by commercial entities interested in updating anthropometric data on the general population, notably in relation with clothing or footwear [36,37,38]. In the field of scanners, laser technologies remain the gold standard (even though more affordable optical of infrared scanners have been used at times) [39]. These innovative methods allow to avoid any contact with the limb under study, thereby avoiding skin-related contraindications, and handling of water.
Several full-limb scanning series have reported positive results (most of them have been concerned with the knee) [29,30]. Series that specifically address distal features in lower limbs have been scarce, because such studies need to cover multiple, contiguous segments and low volumes (toes):
- The Volumeter® (Bosl Medizintechnik, Aachen, Germany), only allows infra-red, off-load optical measurement from the malleoli and on the most proximal 36cm [40]. Correlation with the reference method is excellent (0,96 to 0,99) but perimetric measurements need to be performed.
- The Artec Eva® optical scanner described in Hofmann et al. [41] can only be used in off-load situations. So far, its measurements have only been validated in comparison with figure-of-eight methods.
- The Perometer® has been used in several studies with excellent reproducibility. However, it is an infrared device (not a laser one), and has often been compared with tape measure methods, [32], much more rarely with the reference method. Only Tierney et al. compared it with the reference method, obtaining a correlation of 97% [27]. However, this study focused on the leg segment, excluding ankle and foot, in which, due to the presence of the toes and a very variable topographic anatomy, volumetric measurements are known to be difficult.
- Our 3D laser scanner and its associated technology is not novel. However, when cited in previous surveys, it was used to measure length, width and circumference of the foot, but never for volumetric measurements [42,43]. It has been used in large-scale measurement series, notably for anthropometric measurements of the foot, or as an alternate method to molding or ink/manual impression taking for manufacturing orthopedic footwear or plantar orthotics [44,45].
Few studies have investigated the time needed for acquisition in the different techniques available for measuring the foot and ankle volume. De Vrieze et al [46] reported that 30 minutes per patient were needed in five upper-limb edema measurement techniques (notably a mean duration of 4 minutes when using water measurements, significantly higher than the time required in our scanning technique). Devoogdt et al [35] found a mean time of more than three minutes per foot when using the water volumeter (a figure significantly higher than in perimetric measurements). In our study, we found a relatively similar overall duration of more than 10 minutes (for both feet) when using water volumetry, which reflects the low practicability of this technique. Conversely, the time needed for conducting a scanner-based examination (including removal of shoes, subsequent return to “shoes-on” situation and computer processing of data), was around two minutes [35,46], making it an ideal technique in clinical practice.
Our sample of 29 subjects (58 feet/ankles) is broader than most samples studied in previous surveys (30 subjects in Labs and al [40], 20 limbs for the validation of the Perometer® [10]; Tierney et al [27] reported on 20 leg segments). Furthermore, the validation of our scanner was carried out within a population in which very varied volumes were observed, ranging from 537.3 cm3 to 1217.3 cm3, thus encompassing feet ranging from sizes 30 to 45.
This 3D optical scanner achieved excellent correlation with the reference method, 0.92 in gross measurements, 0.98 after correcting for an underestimation bias when using the scanner method. A measurement bias was observed in our study. However, it was lower than that observed in Tierney et al [27] (7% for Tierney et al. vs around 5% according to our method). Measurement discrepancy was 47.8 cm3, showing underestimation when using 3D scanner versus water volumetry. After correcting results yielded by the 3D scanner method for this value (“corrected 3D scanner measurement”), an excellent concordance was demonstrated between the two techniques (LIN’s CCC= 0.98, residual bias = -0.027 cm3 +/- 35.10 cm3), as shown in Table 3. Concordance between the two methods was validated using the Bland-Altman plot, to demonstrate trends and systematic errors, and intra-class correlation coefficient to establish the precision of the measurements. Lin’s method (CCC), after conducting a Kolmogorov-Smirnov test, ensured that differences between the two methods were normal. This discrepancy between the measurements of the two methods, is thought to be secondary to the phenomenon called siphonage. The unbalanced forces caused by the difference in height between the inlet and outlet, under atmospheric pressure, creates the “siphoning”: the physical phenomenon of the fluid moving from a lower to a higher and then to a lower level [47,48]. This issue is of particular relevance in the context of an increasing shortage of water resources, metering and measurement of water in engineering channel communications, but has not been studied in the water volumetry for the evaluation of foot and ankle volumes. According to the laws of hydraulics, the movement of water to determine the flow rate in pressure flows is sufficient to measure the speed of the water. The cross-sectional area is usually known and limited by the walls of the conduit. The flow rate is determined by multiplying the fluid flow rate by the living cross-sectional area of the flow. Thus, the optimal siphon pipe should have a minimum value of hydraulic resistance and a maximum water giving capacity [48] . The 3D optical scanner obviates the issue of determining the actual amount of flow rate and of water distribution by the siphon pipe. To date, no previous study highlighted this particular measurement problem of the water volumetry for the evaluation of foot and ankle volumes.
In the medical field, the use of a 3D optical scanner would allow the monitoring of many pathologies quickly and without the drawbacks of the water displacement volumetry method. For example, monitoring a lymphatic drainage problem or a cardiac decompensation by measuring edema with the water displacement volumetry technique can be dangerous for patients since most of them are exposed to skin complications such as arterial or venous ulcers [34]. Postoperative edema is also one of the most difficult to assess. Immersing the foot in a volume of water is absolutely not appropriate in this condition with a high risk of infectious complications [9]. In all these medical applications, the assessment of the foot and ankle volume with a 3D optical scanner would be perfectly appropriate.
The high speed of the 3D optical scanner and its respect for hygiene would also allow a large number of subjects to be scanned in order to create corridors of normality to improve the manufacture of shoes. Knowing these normality corridors would help building standard shoes model that would suit most of the population. On the other hand, if a specific construct is needed for a foot and ankle deformity such as flatfoot, recently renamed progressive collapsed foot deformity, this would also be possible [14]
Also, in the field of sports, the analysis of the feet morphotypes of the athletes using this device could make it possible to improve the performances of the shoes while avoiding the most common injuries. Some of them are due to an inappropriate distribution of the volume of the shoes or a bad adaptation to the feet variations during exercise [49,50,51].
Our study was not without limitations. First, volumetric measurements were performed in a healthy population. It is thus likely that the reproducibility of optical measurements may be affected in patients unable to stand on both feet (causing asymmetric plantar compression) or presenting overlapping toes in the context of forefoot deformity. Further study is needed on these aspects. Moreover, we did not perform a priori power calculations, which could limit the interpretability of our results. However, as mentioned above, our study included a significant number of feet compared to previously published studies on the same topic. It is important to note that our device measures changes in volume in all soft tissues (muscle and fat) and not just the variations of the peripheral edema in the foot and ankle. Finally, this type of portable scanner remains expensive (7000 to 8000 euros) and is currently not widespread in clinical practice, thereby limiting the reproducibility of this study. The investment and operating costs of any new technology should be considered in parallel with improved usability and measurement accuracy. This current technology appears to present a path towards a substantial improvement compared to other instrumental methods of measuring foot and ankle volume. In the future, porTable 3D optical scanners could be used both in clinical settings and in patients’ homes.
5. Conclusions
Our porTable 3D laser scanner showed an excellent correlation with the reference method, and significantly reduced examination time. Its portable use, its speed and the absence of contraindications linked to immersion in water make it an ideal clinical or research tool for measuring and monitoring foot and ankle edema.
Author Contributions
All authors have read and agreed to the published version of the manuscript. Conceptualization, methodology, validation, and software, Julien Beldame and Matthieu Lalevée; formal analysis, Julien Beldame; investigation, Marie-Aude Munoz , Marion Masse, and Riccardo Sacco; data curation, writing—original draft preparation, Julien Beldame and Matthieu Lalevée; writing—review and editing, Riccardo Sacco, Marie-Aude Munoz, Marion Masse, Matthieu Lalevée. .
Funding
This research received no external funding.
Institutional Review Board Statement
Approval for this study has been obtained beforehand from the institutional review board of CPP GHT Grand Paris Nord Est on September 29,2021 (approvals # Si-RIPH2G: 21.01741.000023 and NRCB 2021-A01802.39).
Informed Consent Statement
Informed consent was obtained from all subjects involved in the study.
Data Availability Statement
Research data is not publicly archived and is available on request at the corresponding author.
Conflicts of Interest
The authors declare no conflict of interest.
References
- Stolldorf DP, Dietrich MS, Ridner SH. Symptom Frequency, Intensity, and Distress in Patients with Lower Limb Lymphedema. Lymphat Res Biol. 2016;14: 78–87. [CrossRef]
- Ridner, SH. The psycho-social impact of lymphedema. Lymphat Res Biol. 2009;7: 109–112. [CrossRef]
- Brijker F, Heijdra YF, Van Den Elshout FJ, Bosch FH, Folgering HT. Volumetric measurements of peripheral oedema in clinical conditions. Clin Physiol. 2000;20(1):56-61. [CrossRef]
- Moholkar K, Fenelon G. Diurnal variations in volume of the foot and ankle. J Foot Ankle Surg. 2001;40(5):302-304. [CrossRef]
- Nouraei H, Nouraei H, Rabkin SW. Comparison of Unsupervised Machine Learning Approaches for Cluster Analysis to Define Subgroups of Heart Failure with Preserved Ejection Fraction with Different Outcomes. Bioengineering. 2022; 9(4):175. [CrossRef]
- Mastick J, Smoot BJ, Paul SM, et al. Assessment of Arm Volume Using a Tape Measure Versus a 3D Optical Scanner in Survivors with Breast Cancer-Related Lymphedema. Lymphat Res Biol. 2022;20(1):39-47. [CrossRef]
- Kyriakidis, C.; Lali, F.; Greco, K.V.; García-Gareta, E. Chronic Leg Ulcers: Are Tissue Engineering and Biomaterials Science the Solution? Bioengineering 2021, 8, 62. [Google Scholar] [CrossRef] [PubMed]
- MacEwan, M.; Jeng, L.; Kovács, T.; Sallade, E. Clinical Application of Bioresorbable, Synthetic, Electrospun Matrix in Wound Healing. Bioengineering 2023, 10, 9. [Google Scholar] [CrossRef] [PubMed]
- Perrault, D.P.; Sharma, A.; Kim, J.F.; Gurtner, G.C.; Wan, D.C. Surgical Applications of Materials Engineered with Antimicrobial Properties. Bioengineering 2022, 9, 138. [Google Scholar] [CrossRef] [PubMed]
- Silva R, Veloso A, Alves N, Fernandes C, Morouço P. A Review of Additive Manufacturing Studies for Producing Customized Ankle-Foot Orthoses. Bioengineering (Basel). 2022;9(6):249. [CrossRef]
- Yu H-B, Li J, Zhang R, Hao W-Y, Lin J-Z, Tai W-H. Effects of Jump-Rope-Specific Footwear Selection on Lower Extremity Biomechanics. Bioengineering. 2022; 9(4):135. [CrossRef]
- Zhang, R.; Zhao, L.; Kong, Q.; Yu, G.; Yu, H.; Li, J.; Tai, W.-H. The Bionic High-Cushioning Midsole of Shoes Inspired by Functional Characteristics of Ostrich Foot. Bioengineering 2023, 10, 1. [Google Scholar] [CrossRef] [PubMed]
- Silva, R.; Veloso, A.; Alves, N.; Fernandes, C.; Morouço, P. Amerinatanzi, A. ; Zamanian, H.; Shayesteh Moghaddam, N.; Jahadakbar, A.; Elahinia, M. Application of the Superelastic NiTi Spring in Ankle Foot Orthosis (AFO) to Create Normal Ankle Joint Behavior. Bioengineering 2017, 4, 95. [Google Scholar] [CrossRef]
- Hsu, C.-Y.; Wang, C.-S.; Lin, K.-W.; Chien, M.-J.; Wei, S.-H.; Chen, C.-S. Biomechanical Analysis of the FlatFoot with Different 3D-Printed Insoles on the Lower Extremities. Bioengineering 2022, 9, 563. [Google Scholar] [CrossRef] [PubMed]
- Lalevée M, Barbachan Mansur NS, Lee HY, Ehret A, Tazegul T, d e Carvalho KAM, Bluman E, de Cesar Netto C. A comparison between the Bluman et al. and the progressive collapsing foot deformity classifications for flatfeet assessment. Arch Orthop Trauma Surg. 2023 Mar;143(3):1331-1339.
- Lalevée M, Barbachan Mansur NS, Rojas EO, Lee HY, Ahrenholz SJ, Dibbern KN, Lintz F, de Cesar Netto C. Prevalence and pattern of lateral impingements in the progressive collapsing foot deformity. Arch Orthop Trauma Surg. 2023 Jan;143(1):161-168.
- Lalevée M, Dibbern K, Barbachan Mansur NS, et al. Impact of First Metatarsal Hyperpronation on First Ray Alignment: A Study in Cadavers. Clin Orthop Relat Res. 2022;480(10):2029-2040. [CrossRef]
- Peng, H.-T.; Liu, L.-W.; Chen, C.-J.; Chen, Z.-R. The Soft Prefabricated Orthopedic Insole Decreases Plantar Pressure during Uphill Walking with Heavy Load Carriage. Bioengineering 2023, 10, 353. [Google Scholar] [CrossRef] [PubMed]
- Song, Y.; Cen, X.; Zhang, Y.; Bíró, I.; Ji, Y.; Gu, Y. Development and Validation of a Subject-Specific Coupled Model for Foot and Sports Shoe Complex: A Pilot Computational Study. Bioengineering 2022, 9, 553. [Google Scholar] [CrossRef] [PubMed]
- Henschke N, Boland RA, Adams RD. Responsiveness of two methods for measuring foot and ankle volume. Foot Ankle Int. 2006;27: 826–832. [CrossRef]
- Brijker F, Heijdra YF, Van Den Elshout FJ, Bosch FH, Folgering HT. Volumetric measurements of peripheral oedema in clinical conditions. Clin Physiol Oxf Engl. 2000;20: 56–61. [CrossRef]
- Brodovicz KG, McNaughton K, Uemura N, Meininger G, Girman CJ, Yale SH. Reliability and feasibility of methods to quantitatively assess peripheral edema. Clin Med Res. 2009;7: 21–31. [CrossRef]
- Damstra RJ, Glazenburg EJ, Hop WCJ. Validation of the inverse water volumetry method: A new gold standard for arm volume measurements. Breast Cancer Res Treat. 2006;99: 267–273. [CrossRef]
- Deltombe T, Jamart J, Recloux S, Legrand C, Vandenbroeck N, Theys S, et al. Reliability and limits of agreement of circumferential, water displacement, and optoelectronic volumetry in the measurement of upper limb lymphedema. Lymphology. 2007;40: 26–34.
- Esterson, PS. Measurement of ankle joint swelling using a figure of 8*. J Orthop Sports Phys Ther. 1979;1: 51–52. [CrossRef]
- Sharkey AR, King SW, Kuo RY, Bickerton SB, Ramsden AJ, Furniss D. Measuring Limb Volume: Accuracy and Reliability of Tape Measurement Versus Perometer Measurement. Lymphat Res Biol. 2018;16: 182–186. [CrossRef]
- Tierney S, Aslam M, Rennie K, Grace P. Infrared optoelectronic volumetry, the ideal way to measure limb volume. Eur J Vasc Endovasc Surg Off J Eur Soc Vasc Surg. 1996;12: 412–417. [CrossRef]
- Mayrovitz HN, Sims N, Litwin B, Pfister S. Foot volume estimates based on a geometric algorithm in comparison to water displacement. Lymphology. 2005;38: 20–27.
- Pichonnaz C, Bassin J-P, Lécureux E, Currat D, Jolles BM. Bioimpedance spectroscopy for swelling evaluation following total knee arthroplasty: a validation study. BMC Musculoskelet Disord. 2015;16: 100. [CrossRef]
- Man IOW, Markland KL, Morrissey MC. The validity and reliability of the Perometer in evaluating human knee volume. Clin Physiol Funct Imaging. 2004;24: 352–358. [CrossRef]
- Esposito, D.; Savino, S.; Andreozzi, E.; Cosenza, C.; Niola, V.; Bifulco, P. The “Federica” Hand. Bioengineering 2021, 8, 128. [Google Scholar] [CrossRef] [PubMed]
- Stanton AW, Northfield JW, Holroyd B, Mortimer PS, Levick JR. Validation of an optoelectronic limb volumeter (Perometer). Lymphology. 1997;30: 77–97.
- Gao, L.; Lu, Z.; Liang, M.; Baker, J.S.; Gu, Y. Influence of Different Load Conditions on Lower Extremity Biomechanics during the Lunge Squat in Novice Men. Bioengineering 2022, 9, 272. [Google Scholar] [CrossRef] [PubMed]
- Sung, C.J.; Gupta, K.; Wang, J.; Wong, A.K. Lymphatic Tissue Bioengineering for the Treatment of Postsurgical Lymphedema. Bioengineering 2022, 9, 162. [Google Scholar] [CrossRef] [PubMed]
- Devoogdt N, Cavaggion C, Van der Gucht E, Dams L, De Groef A, Meeus M, et al. Reliability, Validity, and Feasibility of Water Displacement Method, Figure-of-Eight Method, and Circumference Measurements in Determination of Ankle and Foot Edema. Lymphat Res Biol. 2019;17: 531–536. [CrossRef]
- Istook, C. 3D scanning systems with application to the apparel industry. J Fash Market Manage. 2000: 120–132.
- Zhao J, Xiong S, Bu Y, Goonetilleke R. Computerized girth determination for custom footwear manufacture. Comput Ind Eng. 2008: 359–373.
- Cheng F-T, Perng D-B. A systematic approach for developing a foot size information system for shoe last design. Int J Ind Ergon. 2000;25: 171–185. [CrossRef]
- Rogati G, Leardini A, Ortolani M, Caravaggi P. Validation of a novel Kinect-based device for 3D scanning of the foot plantar surface in weight-bearing. J Foot Ankle Res. 2019;12: 46. [CrossRef]
- Labs KH, Tschoepl M, Gamba G, Aschwanden M, Jaeger KA. The reliability of leg circumference assessment: a comparison of spring tape measurements and optoelectronic volumetry. Vasc Med Lond Engl. 2000;5: 69–74. [CrossRef]
- Hofmann B, Konopka K, Fischer D-C, Kundt G, Martin H, Mittlmeier T. 3D optical scanning as an objective and reliable tool for volumetry of the foot and ankle region. Foot Ankle Surg Off J Eur Soc Foot Ankle Surg. 2022;28: 200–204. [CrossRef]
- Telfer S, Woodburn J. The use of 3D surface scanning for the measurement and assessment of the human foot. J Foot Ankle Res. 2010;3: 19. [CrossRef]
- Laštovička O, Cuberek R, Janura M, Klein T. Evaluation of the Usability of the Tiger Full-Foot Three-Dimensional Scanner for the Measurements of Basic Foot Dimensions in Clinical Practice. J Am Podiatr Med Assoc. 2022;112: 20–019. [CrossRef]
- Jurca A, Žabkar J, Džeroski S. Analysis of 1.2 million foot scans from North America, Europe and Asia. Sci Rep. 2019;9: 19155. [CrossRef]
- Razeghi M, Batt ME. Foot type classification: a critical review of current methods. Gait Posture. 2002;15: 282–291. [CrossRef]
- De Vrieze T, Gebruers N, Tjalma WA, Nevelsteen I, Thomis S, De Groef A, et al. What is the best method to determine excessive arm volume in patients with breast cancer-related lymphoedema in clinical practice? Reliability, time efficiency and clinical feasibility of five different methods. Clin Rehabil. 2019;33: 1221–1232. [CrossRef]
- Zhang Y, Shang Y, Sun H. Improved Calculation Method for Siphon Drainage with Extended Horizontal Sections. Applied Sciences. 2022; 12(19):9660. [CrossRef]
- D Abduraimova and M Ismoilova 2020 IOP Conf. Ser.: Earth Environ. Sci. 614 012122. [CrossRef]
- Sebbagh, P.; Hirt-Burri, N.; Scaletta, C.; Abdel-Sayed, P.; Raffoul, W.; Gremeaux, V.; Laurent, A.; Applegate, L.A.; Gremion, G. Process Optimization and Efficacy Assessment of Standardized PRP for Tendinopathies in Sports Medicine: Retrospective Study of Clinical Files and GMP Manufacturing Records in a Swiss University Hospital. Bioengineering 2023, 10, 409. [Google Scholar] [CrossRef] [PubMed]
- Biscarini, A. Dynamics of Two-Link Musculoskeletal Chains during Fast Movements: Endpoint Force, Axial, and Shear Joint Reaction Forces. Bioengineering 2023, 10, 240. [Google Scholar] [CrossRef] [PubMed]
- Kang, M.; Zhang, T.; Yu, R.; Ganderton, C.; Adams, R.; Han, J. Effect of Different Landing Heights and Loads on Ankle Inversion Proprioception during Landing in Individuals with and without Chronic Ankle Instability. Bioengineering 2022, 9, 743. [Google Scholar] [CrossRef] [PubMed]
Figure 1.
Subjects were scanned in a standing position (one foot in the scanner, the other one on a footrest at the same height).
Figure 1.
Subjects were scanned in a standing position (one foot in the scanner, the other one on a footrest at the same height).
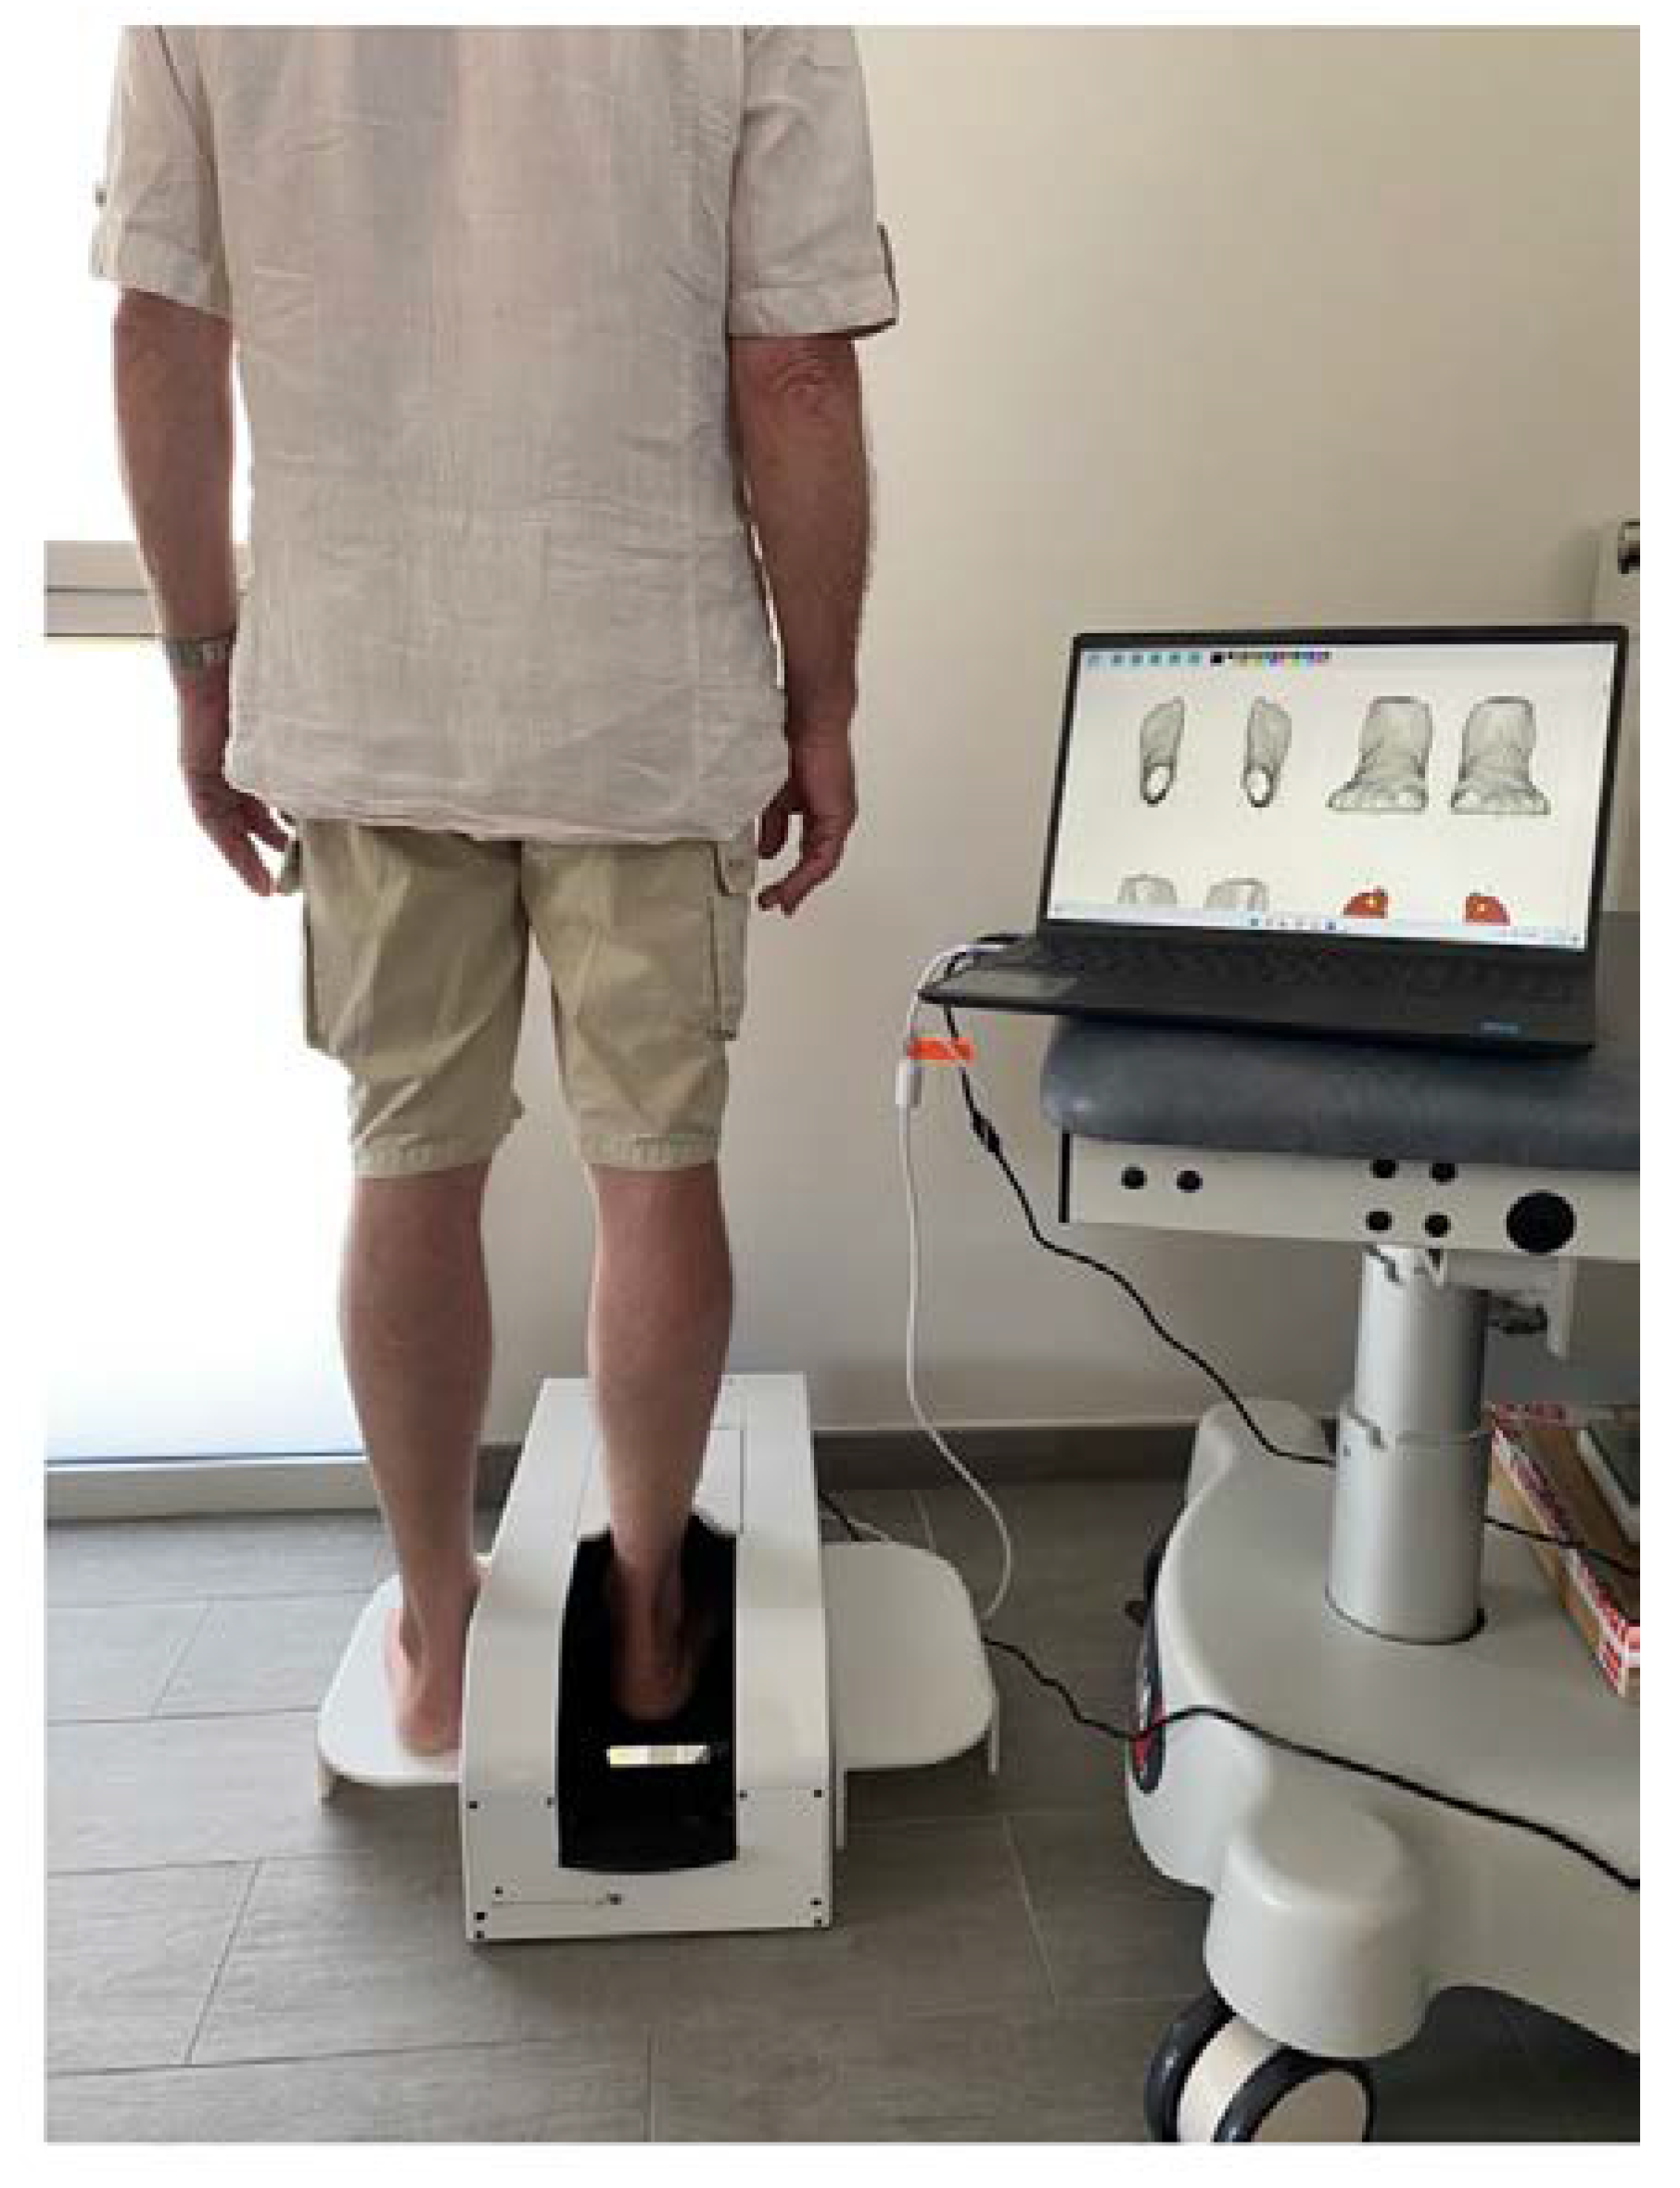
Figure 2.
A volumeter was set up, with a tap allowing overflow. After filling above the level of the tap, the latter was opened to obtain the reference level (after a few minutes in order to obtain flat, stable water). The foot of the subjects was slowly immersed until both feet stood firmly on the ground, causing the displacement of a volume of liquid outside the volumeter through the tap. The liquid corresponding to the volume of the submerged foot was then collected and weighed.
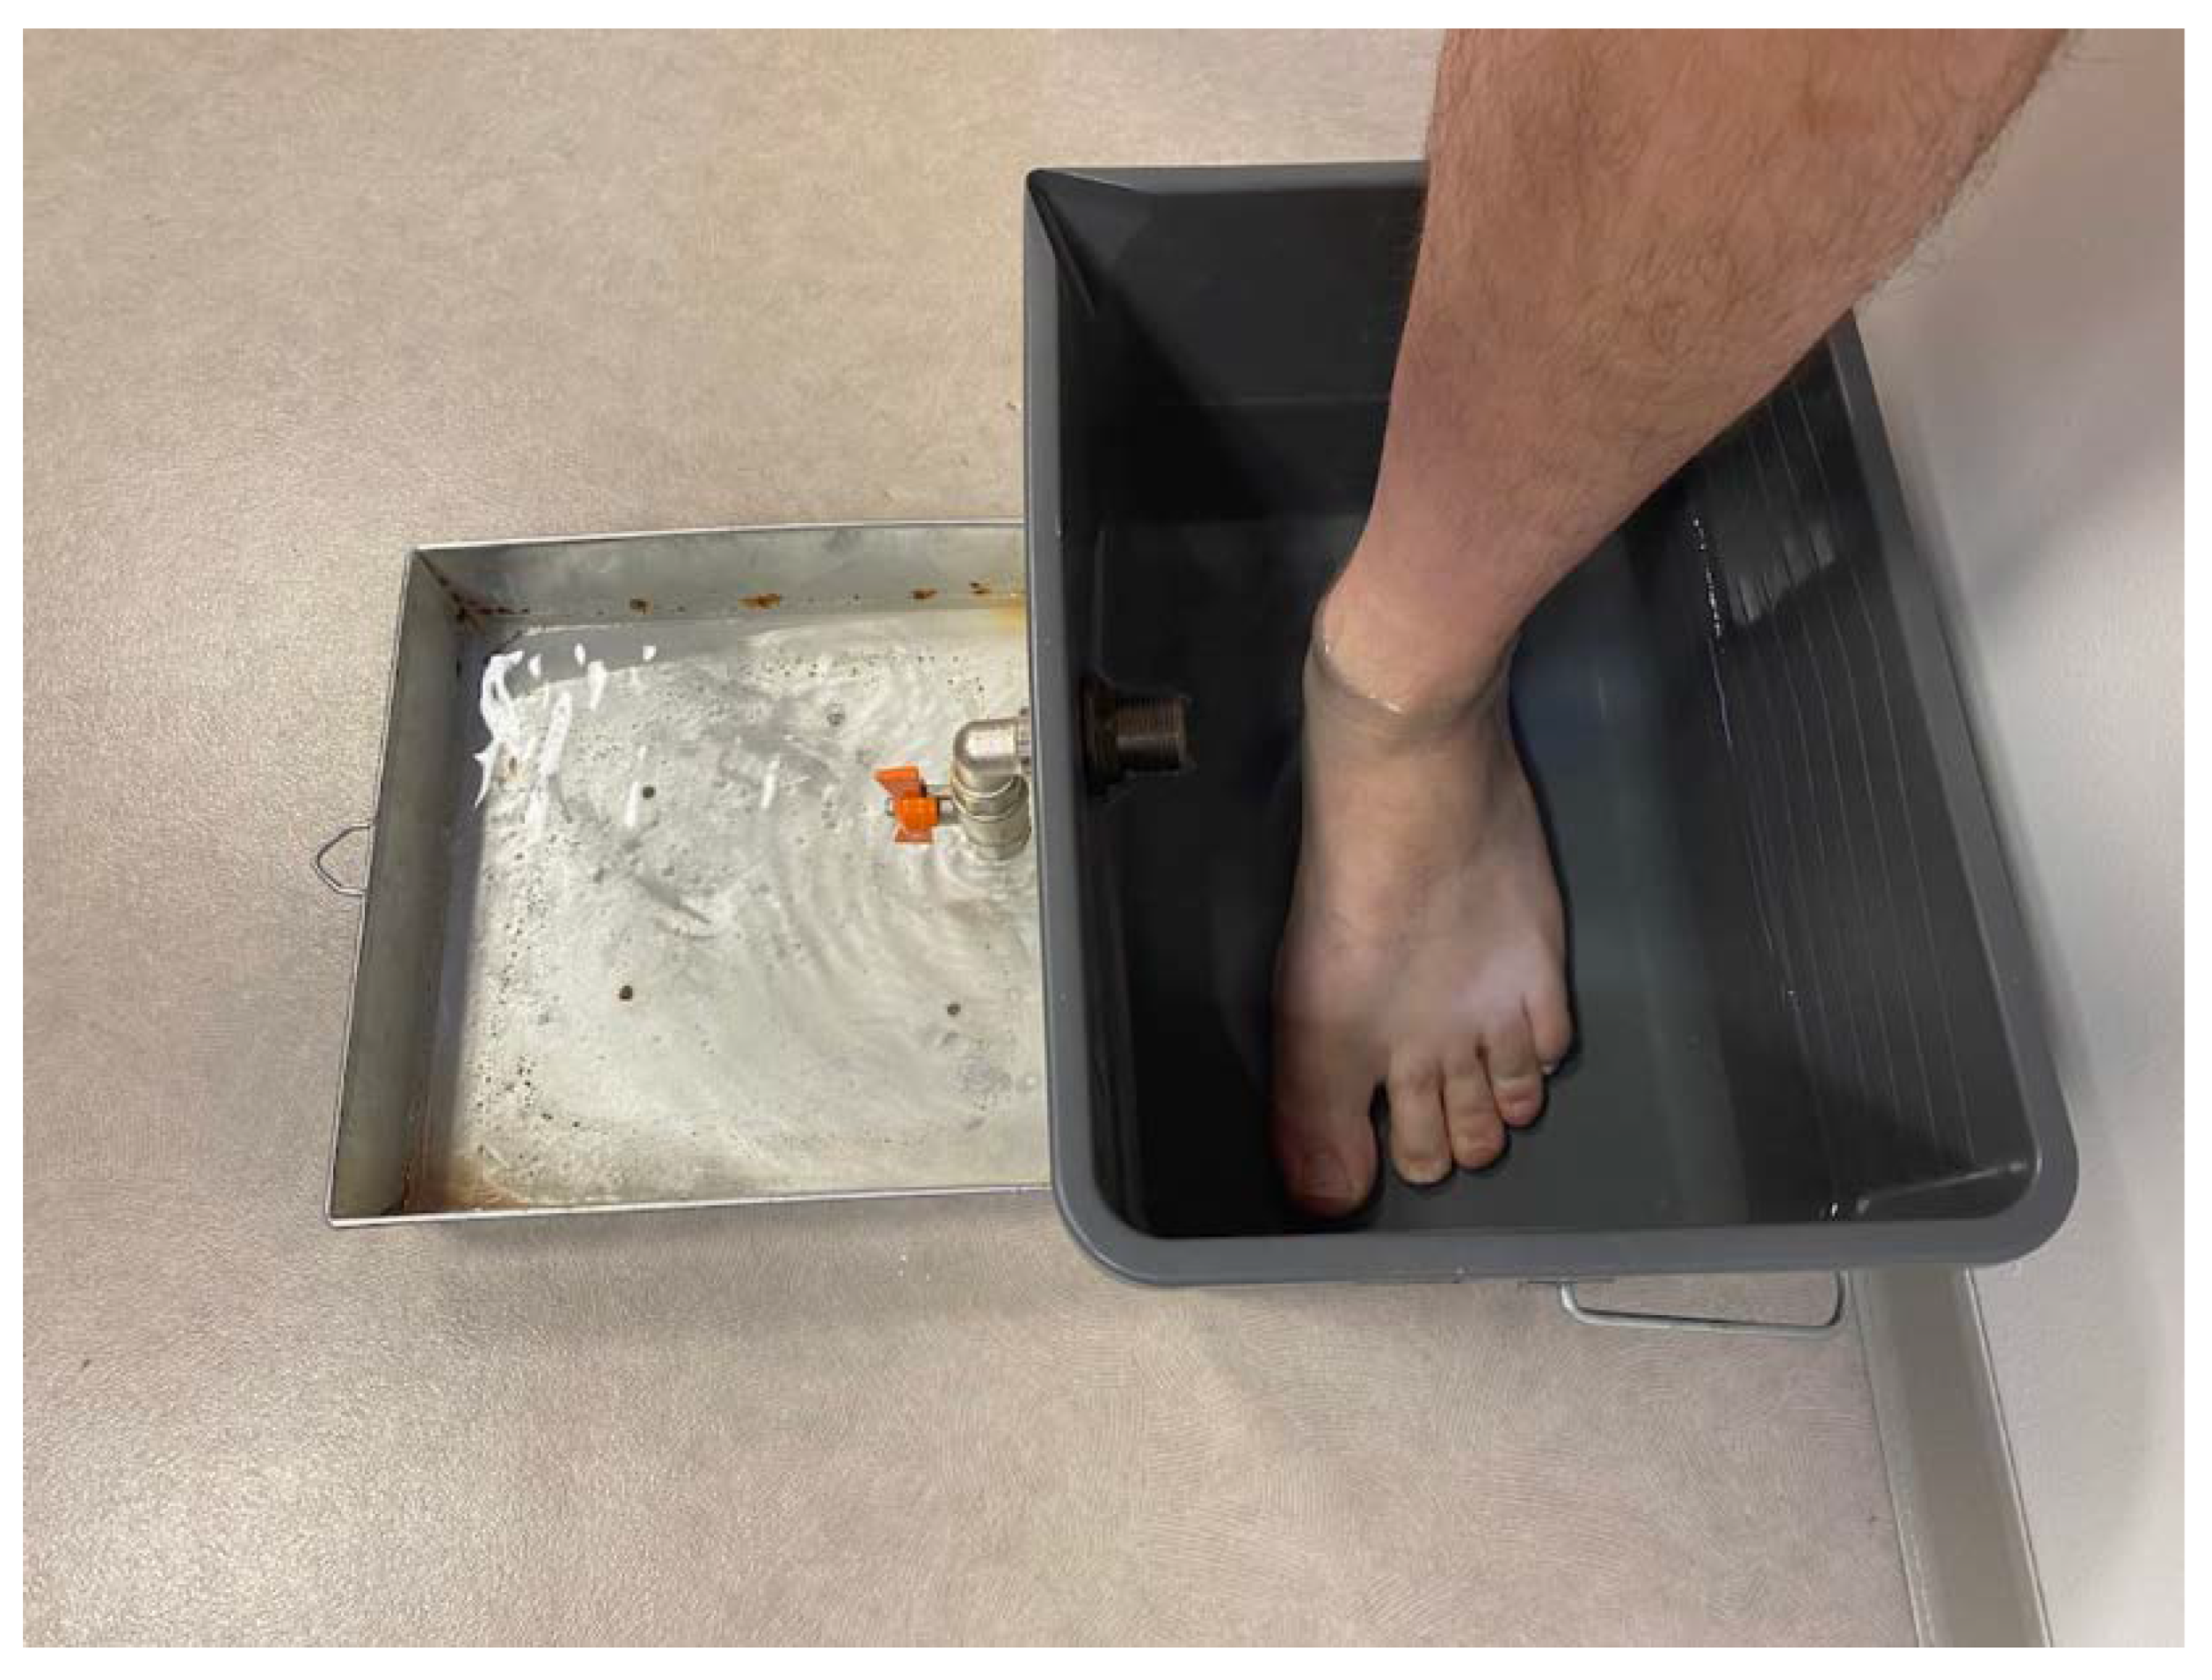

Table 1.
Demographic characteristics of the population.
| Population | n= 29 |
| Gender (Male/female) | 5/24 |
| Age (years) average +/- standard deviation Minimum age (years) Maximum age (years) |
35.6 +/- 9.5 9 55 |
| Shoe size Européenne size Average +/- standard deviation Minimum Maximum |
38.2 +/- 3.2 30 45 |
Table 2.
Volume measurement according to methods.
| Volume (Cm3) | 3D scanner | Water displacement | p |
|---|---|---|---|
| Average +/- Standard Deviation | 869.7 +/- 165,1 | 867.89 +/- 155.4 | <10-5 |
| Minimum | 575.9 | 537.3 | |
| Maximum | 1217.3 | 1148.5 | |
| Measurement time (min) | 4.2 +/- 1.7 | 11.1 +/- 2.9 | <10-4 |
Disclaimer/Publisher’s Note: The statements, opinions and data contained in all publications are solely those of the individual author(s) and contributor(s) and not of MDPI and/or the editor(s). MDPI and/or the editor(s) disclaim responsibility for any injury to people or property resulting from any ideas, methods, instructions or products referred to in the content. |
© 2023 by the authors. Licensee MDPI, Basel, Switzerland. This article is an open access article distributed under the terms and conditions of the Creative Commons Attribution (CC BY) license (http://creativecommons.org/licenses/by/4.0/).
Copyright: This open access article is published under a Creative Commons CC BY 4.0 license, which permit the free download, distribution, and reuse, provided that the author and preprint are cited in any reuse.


