1. Introduction
Due to rapid development of mine operations, mining technology has become a process that adapts to changes in ore body, rock conditions and operational requirements. Currently, large-scale blasting is a challenging topic in open pit operations. This is because of existences of unpredictable geological structures including joints, fissures, faults and muddy-interbedding planes in rock mass. Hence, it is critical to improve the blasting technology to satisfy the operational environments.
As joint structures are naturally formed with high randomness, it is difficult to study an universally applicable joint structure. In the past, studies only focused on joint behaviour under static loads. In this paper, a dynamic analysis of joint behaviour under blasting was carried out.
The attenuation index of shock and stress waves in this study was determined by determining degree of rock mass damage in conjunction with stress and displacement field in fracture mechanics type I and II cracks. By analysing change of vibration velocity of incident and transmitted particles at joint interface and propagation.
velocity of the detonation wave can be calculated. This can in turn simplify the analysis of incident particle vibration velocity at interface of joints from the detonation wave attenuation to the stress wave. After the fracture stress wave changes, the particle stress change around the fracture is deduced and the stress state of the surrounding rock during the blasting and mining process of the fractured rock mass can be determined. This result can provide technical basis for large-scale open pit blasting.
2. Current Status of Blasting on Fractured Rock Mass
During open pit blasting, rock joints are usually the primary locations prone to blasting damage as they are the weakest points. At joint locations, a series of complex transmission and reflection waves could be generated along transformation of blasting shocking wave to stress wave. Subsequently, stress waves induce nonlinear dynamic responses of engineering bodies. Bao et al. [
1] used time domain analysis and classical joint nonlinear normal deformation constitutive model (BB model) to calculate and analyse force along joint ends and deduced the formula of stress change under change of stress wave. Song et al. [
2] analysed elastic longitudinal wave propagation in non-linear rock joints based on the time domain analysis proposed from wavefront momentum conservation theory and displacement discontinuity method. Subsequently, the researchers found the non-linear deformation properties of joint have a great influence on transmitted and reflected waves. Zhao [
3] established a one-dimensional analysis model of jointed rock mass and carried out a parametric analysis. Thereby, Zhao [
3] used continuous and discontinuous element methods to explore the influence of joint parameters on blasting and obtained a negative correlation between extent of joints in blasting area and blasting effect. Hence, it was found that the influence of joint parameters on blasting effect is also a crucial aspect in rock dynamics.
As research on blasting effect of highwall benches is also a multi-factor and complex system engineering topic, there are less related studies on reasonable use of delayed initiation to achieve optimized shock wave collision in mine blasting. Gao et al. [
4] evaluated the spatial distribution of blast energy and blasting effect at the initiation position based on blast energy transmission and blast stress field distribution combined with simulation and experiments. Leng et al. [
5] used degree of tensile and compressional shear damage to calculate the crushing range and combined with the step blasting field test to compare the blasting block size distribution under different blasting methods. The researchers then determined an optimised design for number and position of blasting initiation points to significantly improve blasting efficiency. Thereby, setting of delayed blasting in the hole is critical for efficient mining, slope stability and capacity utilization improvement in open pit mines.
Most of the previous differential time calculation methods are based on semi-empirical formulas obtained from row initiation and most of them focused on reducing the blasting vibration. Wu and Gong [
6] used single-hole blasting curve as the waveform source and conducted regression analysis based on Fourier series. Subsequently, they used the multi-level loop nested logic language to write a MATLAB program and obtained all possible synthesis of 8-stage differential blasting. The vibration curve was consistent with the maximum calculated synthetic vibration velocity of 0.26 cm/s under the field design. With the continuous development of digital mining, the large-scale application of air spacers and digital electronic detonators have made deep hole blasting technology more flexible and diverse [
7] . Although there are still lack of detailed research around joints and extensions.
Based on above research results, there are only limited studies on the dynamic characteristics of particles around the rock mass joints under blasting [
8] . Therefore, this paper used the delayed blasting on highwall bench of Baiyunebo open-pit mine as the field study and investigated the dynamic response of jointed and fissured rock mass under blasting load; so as to meet the blasting requirements of modern large open-pit mine as well as improve the utilisation rate of blast energy.
3. Change of Stress Field in Fractured Rock due to Blasting
3.1. Attenuation of Stress Wave in Fractured Rock Mass
In vicinity of blasting source, the shock wave in the radial direction attenuates with the increase of the distance from the blast hole until the attenuation becomes a stress wave [
9] . Based on the definition of damaged rock mass [
10] , the shock wave pressure [
11] and decay exponents of stress waves [
12] are:
where
α1 is the attenuation index of shock wave pressure;
α2 is the attenuation index of stress wave; b(
D) is the lateral stress coefficient of damaged rock mass;
Cd is the crack density caused by damage;
μα is the dynamic Poisson’s ratio,
μα =0.8
μc, whereas
μc is the static Poisson’s ratio of rock.
After the explosive is detonated [
13] , it is assumed that the impact pressure changes exponentially. By combining with the stress boundary conditions, this study analysed the particle at a position far from the explosion source to investigate the attenuation relationship between the vibration velocity with distance and stress wave arrival time. By substituting α=α
2, the change of stress [
14] can be represented by the shock pressure attenuation formula. Based on the relationship stress and wave velocity [
15,
16,
17] , the change of vibration velocity of the incident and transmitted particles at the joint interface can be expressed as:
where
Cp and
Cs are propagation velocities of P-wave and S-wave respectively; which are assumed as 4 803 m/s and 1 961 m/s. ts and tp are propagation times of P-wave and S-wave respectively; C is the detonation velocity, which is between 2 000~4 000 m/s;
μ is the Poisson’s ratio, which is taken as 0.3;
G is the shear modulus of the rock, which is taken as 30 GPa;
P(t) is the impact pressure;
ρ0 is the density of the explosive, which is assumed as 1.63 g/cm3;
α is attenuation index, equals 4000;
t is the control load input termination time (0.05s).
According to change of vibration velocity of transmission particle [
18,
19], joints in the rock mass are to subject to the superposition of in-situ stress. This superposition of joint interface stress can be expressed as
where
σ(
i) and
τ(
i) represent the normal and shear stresses along the joint interface;
zp and
zs are wave impedances of P and S waves, which are
zp = 15449500,
zs = 6307800.
vIP and
vTs are particle vibration velocities of incident P wave and transmitted S wave respectively;
α is the incident angle, reflection angle and transmission angle of the P wave.
β is the reflection angle of reflected S wave and transmission angle of transmitted S wave.
σd is stress at the end of the joint under in-situ stress and
τd is the shear stress at end of the joint under in-situ stress. In this study,
σ1 and
τ1 are approximately equivalent to the in-situ stress values at midpoint of the joint.
3.2. Constitutive Model of Fractured Rock Mass Blasting
By combining the classical joint nonlinear normal deformation constitutive model (BB) and the cylindrical cavity Heelan solution [
20,
21], the delayed blasting model in the hole of fractured rock mass was constructed [
22,
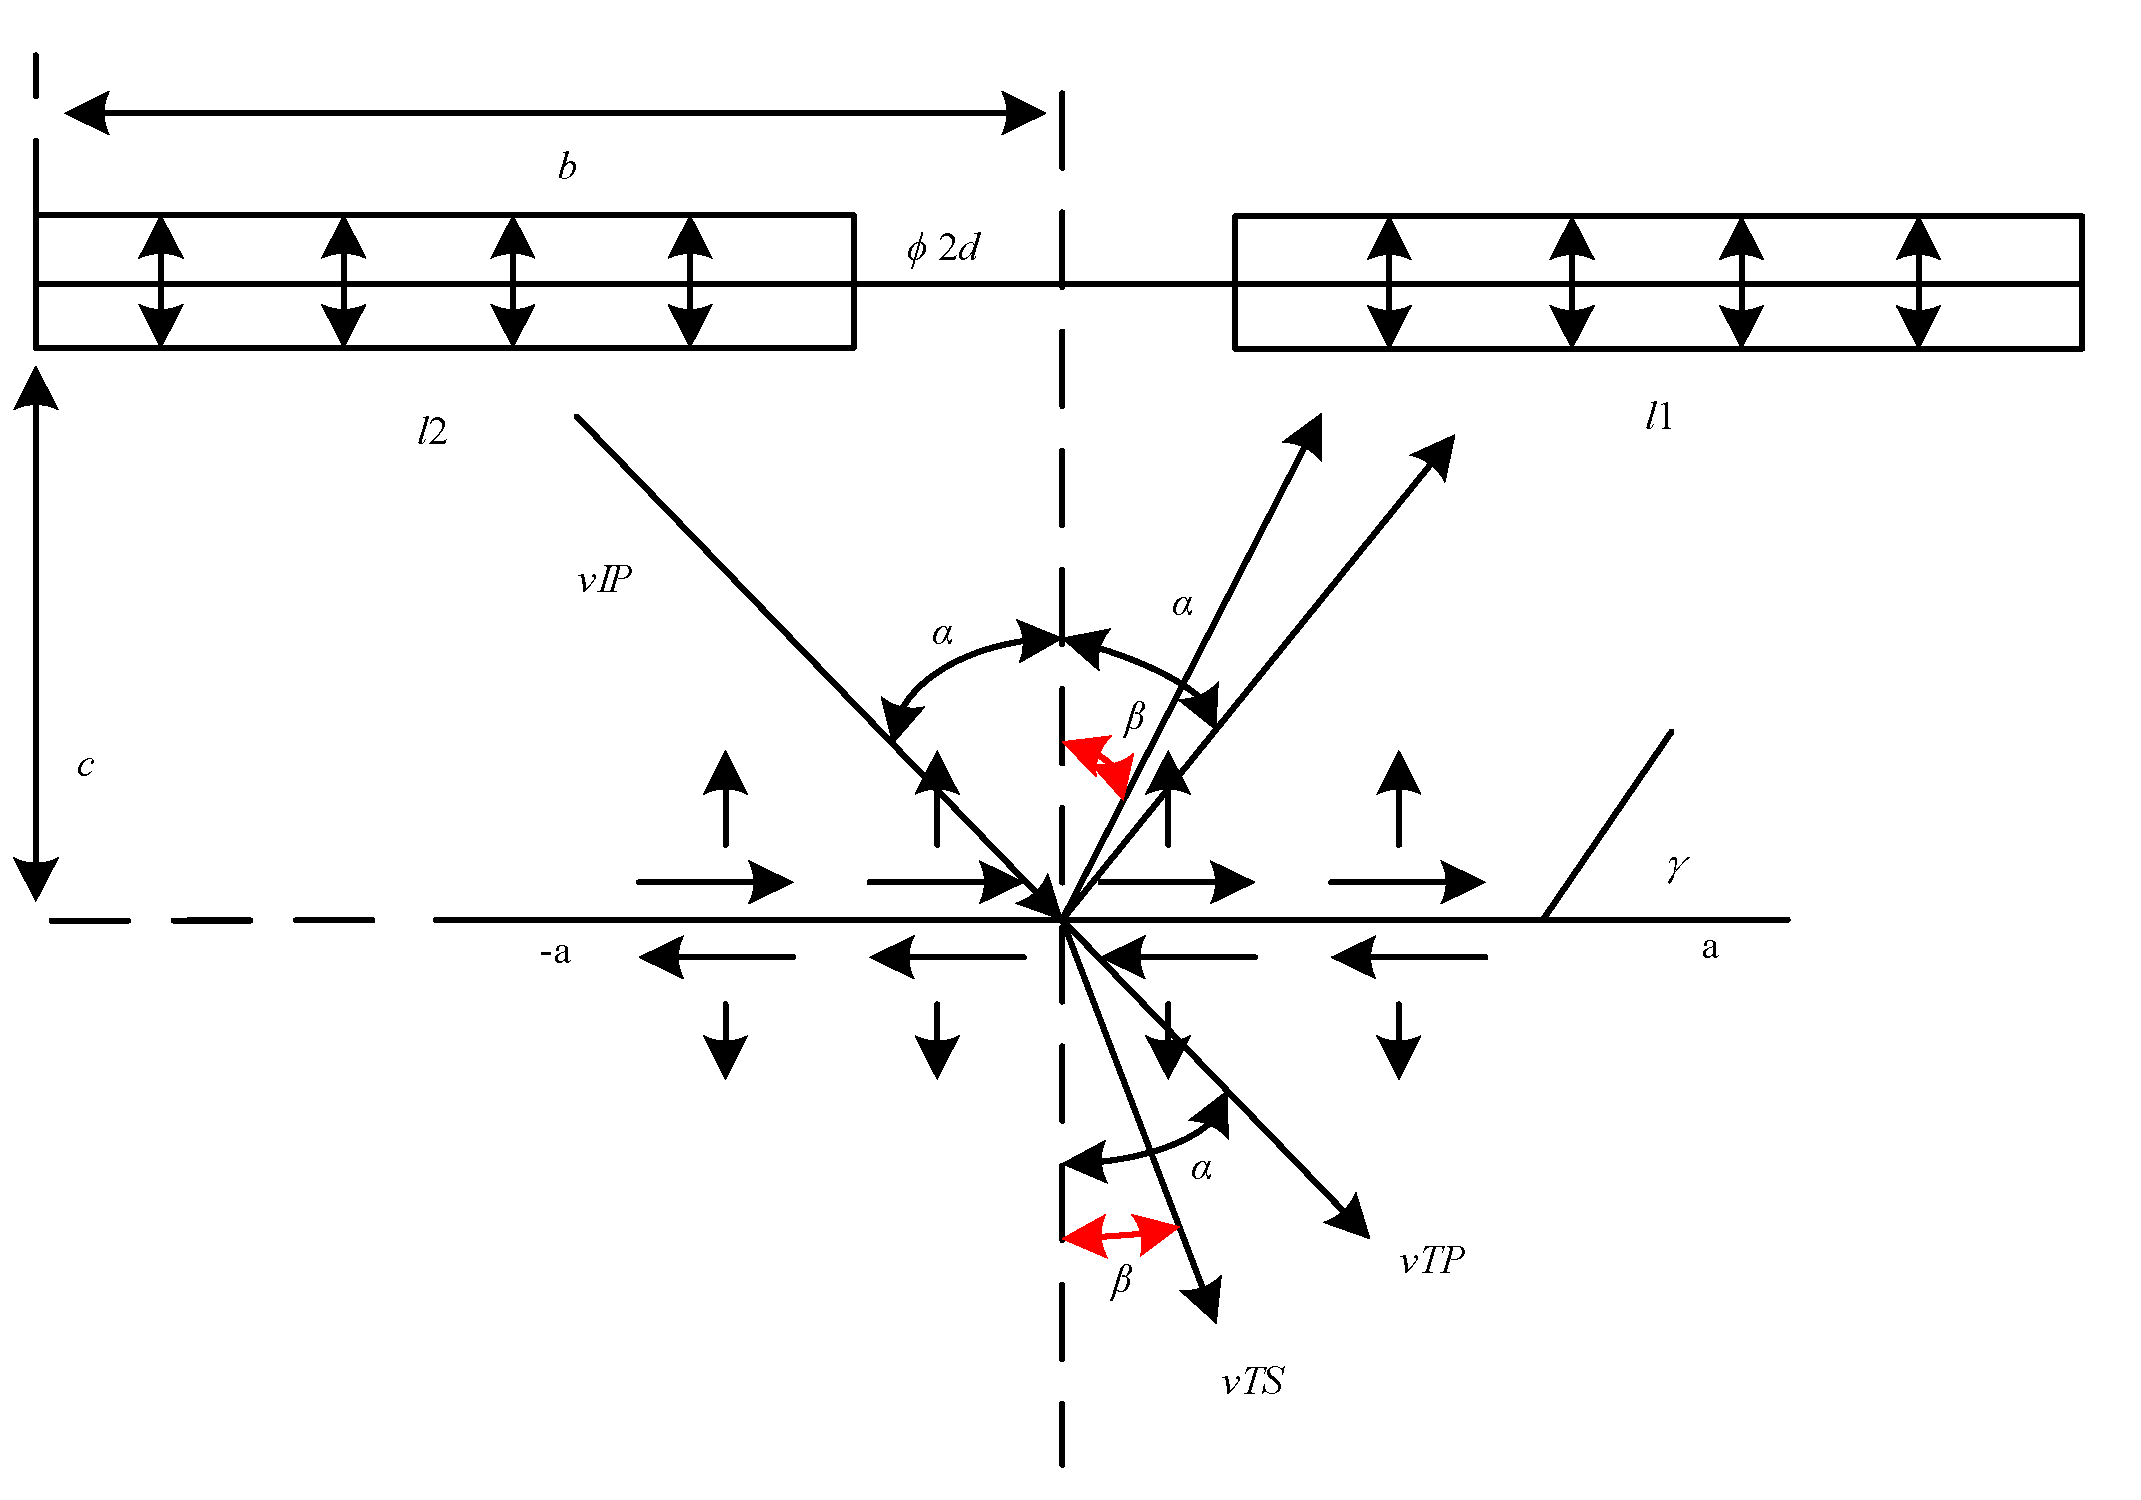
23]. The stress change of the red particles on both sides of the joint interface was analyzed; where
γ is the polar angle,
a is length of the joint,
l is the length of the explosive column, c is the horizontal distance between the blast hole and the joint, and
b is the distance between the lower explosive column and the middle of blasting hole and d is radius of the explosives.
Figure 1.
Delay blasting hole model within fractured rock mass.
Figure 1.
Delay blasting hole model within fractured rock mass.
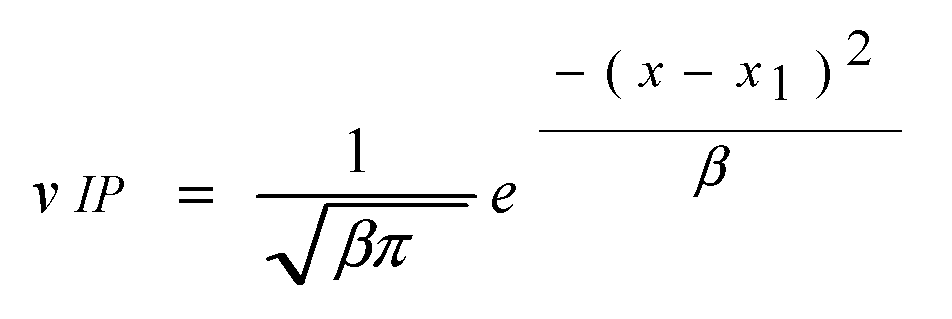
where
x1 represents the axis of symmetry and
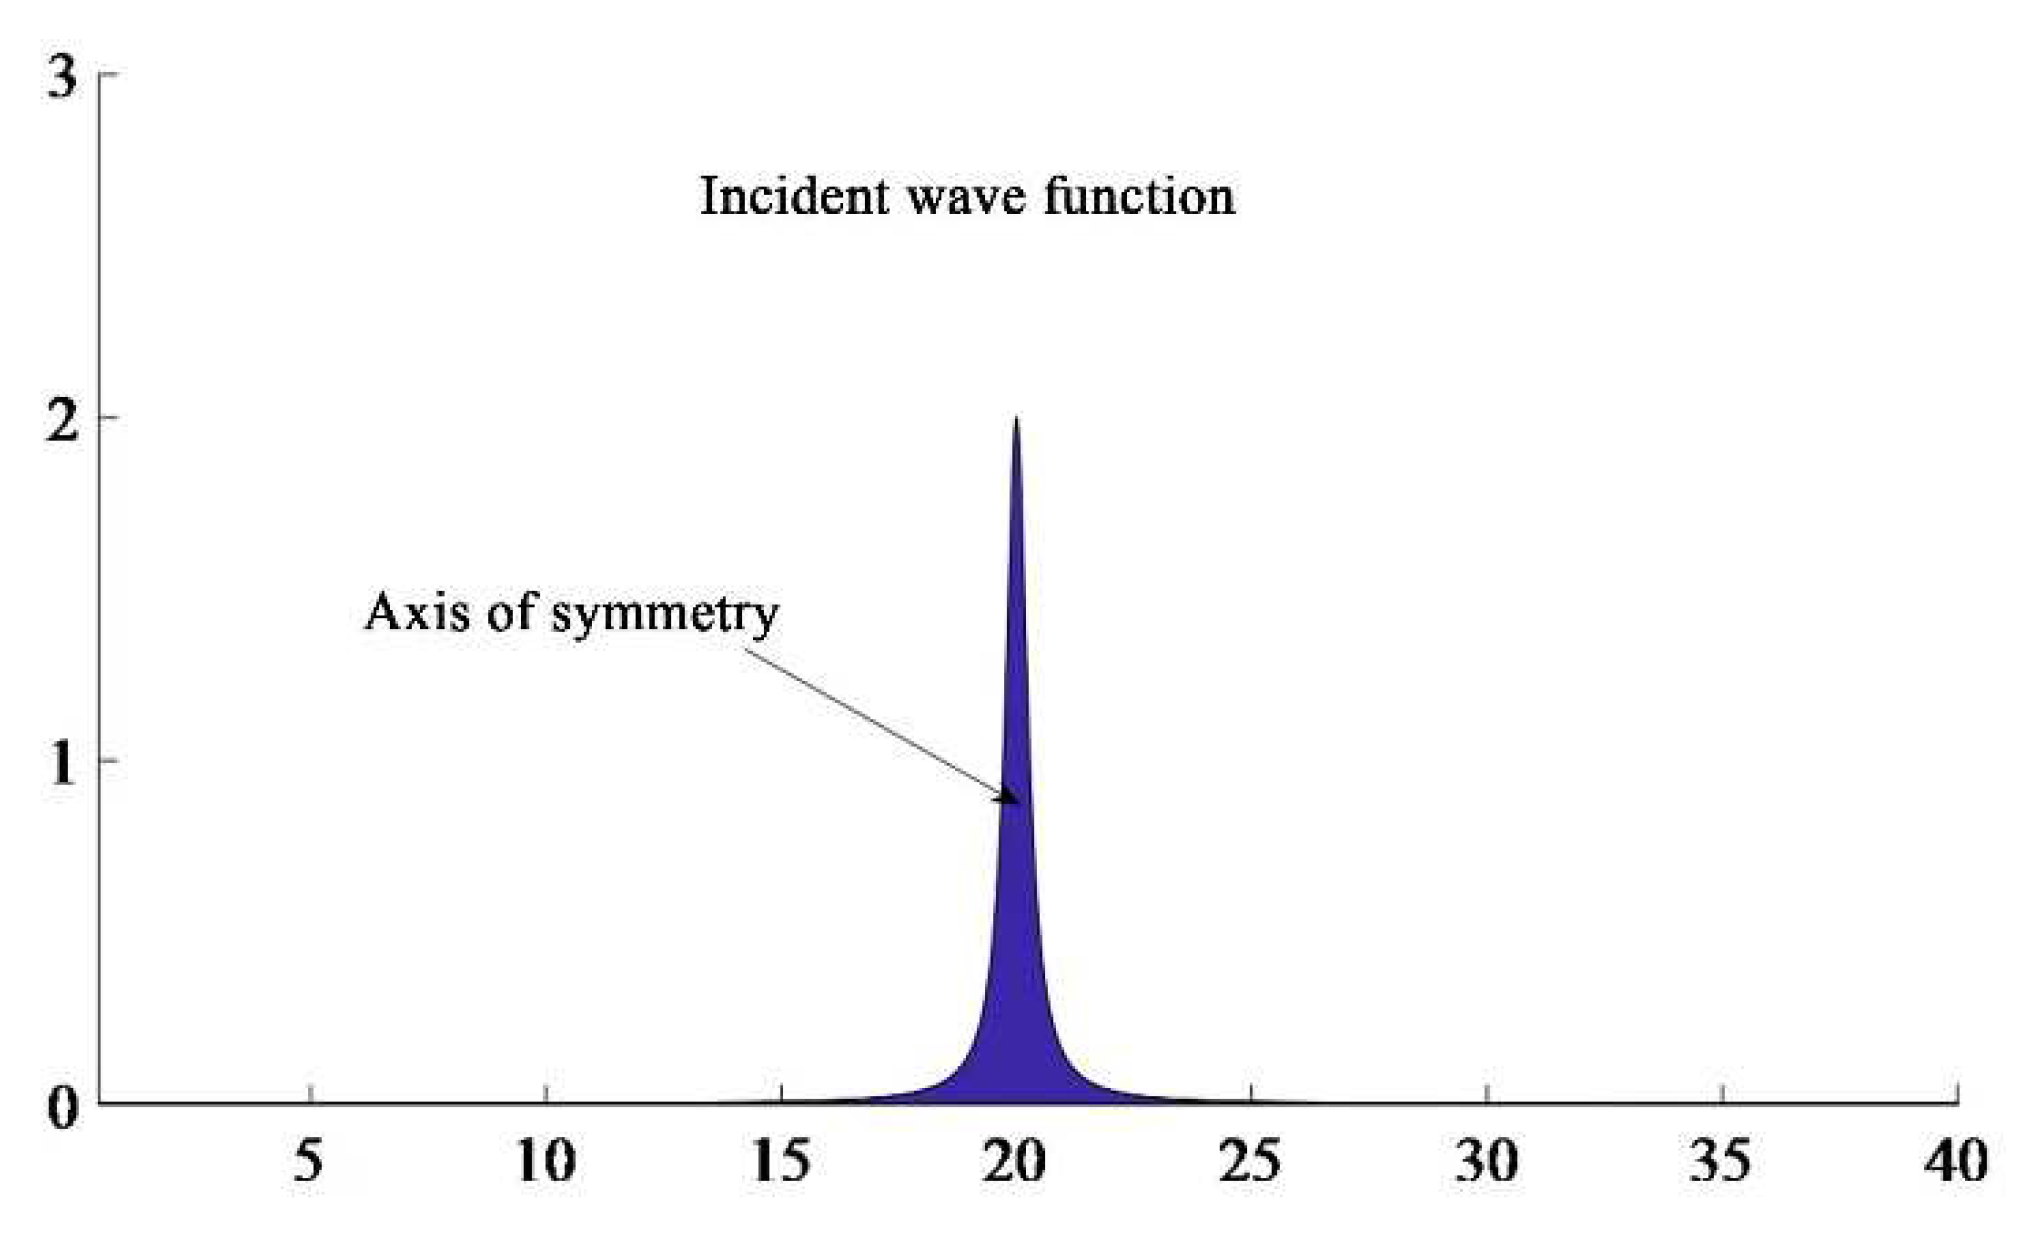
β is any number of adjustment function. To simplify the change of vibration velocity of incident particle at the joint interface, the change form was simplified as:
Figure 2.
Vibration velocity function of incident particle.
Figure 2.
Vibration velocity function of incident particle.
Therefore, the time t=0~4000 ms of incident wave function was defined. To ensure the accuracy of
numerical calculation, a total of 2 000 time were are selected, in which the peak time b=2000 ms and the corresponding peak value G(t-2)max=0.2m/ s.
After the initial directional crack was formed, the crack continued to expand under the explosive gas. Based on the theory of fracture mechanics, the stress intensity factors of I and II inside the crack under quasi-static pressure are:
By substituting σ and τ into Equation 11, the stress intensity factor can be expressed in term of distance and time after detonation. By bringing the results into Equations 12 and 13, the crack tip stress and displacement can be calculated as:
where
Ea is the dynamic elastic modulus of rock, which is taken as 10 GPa.
σx, σy and
τxy are the stress components at the joint ends, respectively.
u and
v are the displacement components at the joint ends; and
r and
θ are the polar diameter and polar angle from joint ends. This paper studied the plane strain problem, where
k=3-4
μ.
Since the integral did not have an explicit solution for the result of stress and displacement of the particle around the crack, Matlab numerical integration was used to obtain the numerical solution of the vibration velocity. Its associated variation was able to be represented by an image [
24].
From
Figure 3, the incident P wave was positively incident on the joint and the peak value of particle vibration velocity was 0.33m/s; whereas the peak time was 3.0s. The propagation direction of the P wave reflected at the joint interface was the same as the vibration direction of particle at first (forward reflection) After a period of time, the propagation direction was opposite to the vibration direction of the particle (reverse reflection). This time was obtained to be 3.205s. The S-wave reflected by the joint interface was first reflected backward and then forward reflected; and the peak vibration velocity of the particle was 0.027 m/s.
4. Analysis of stress and displacement distribution around Joints
By substituting the transmission wave function of the joint interface in
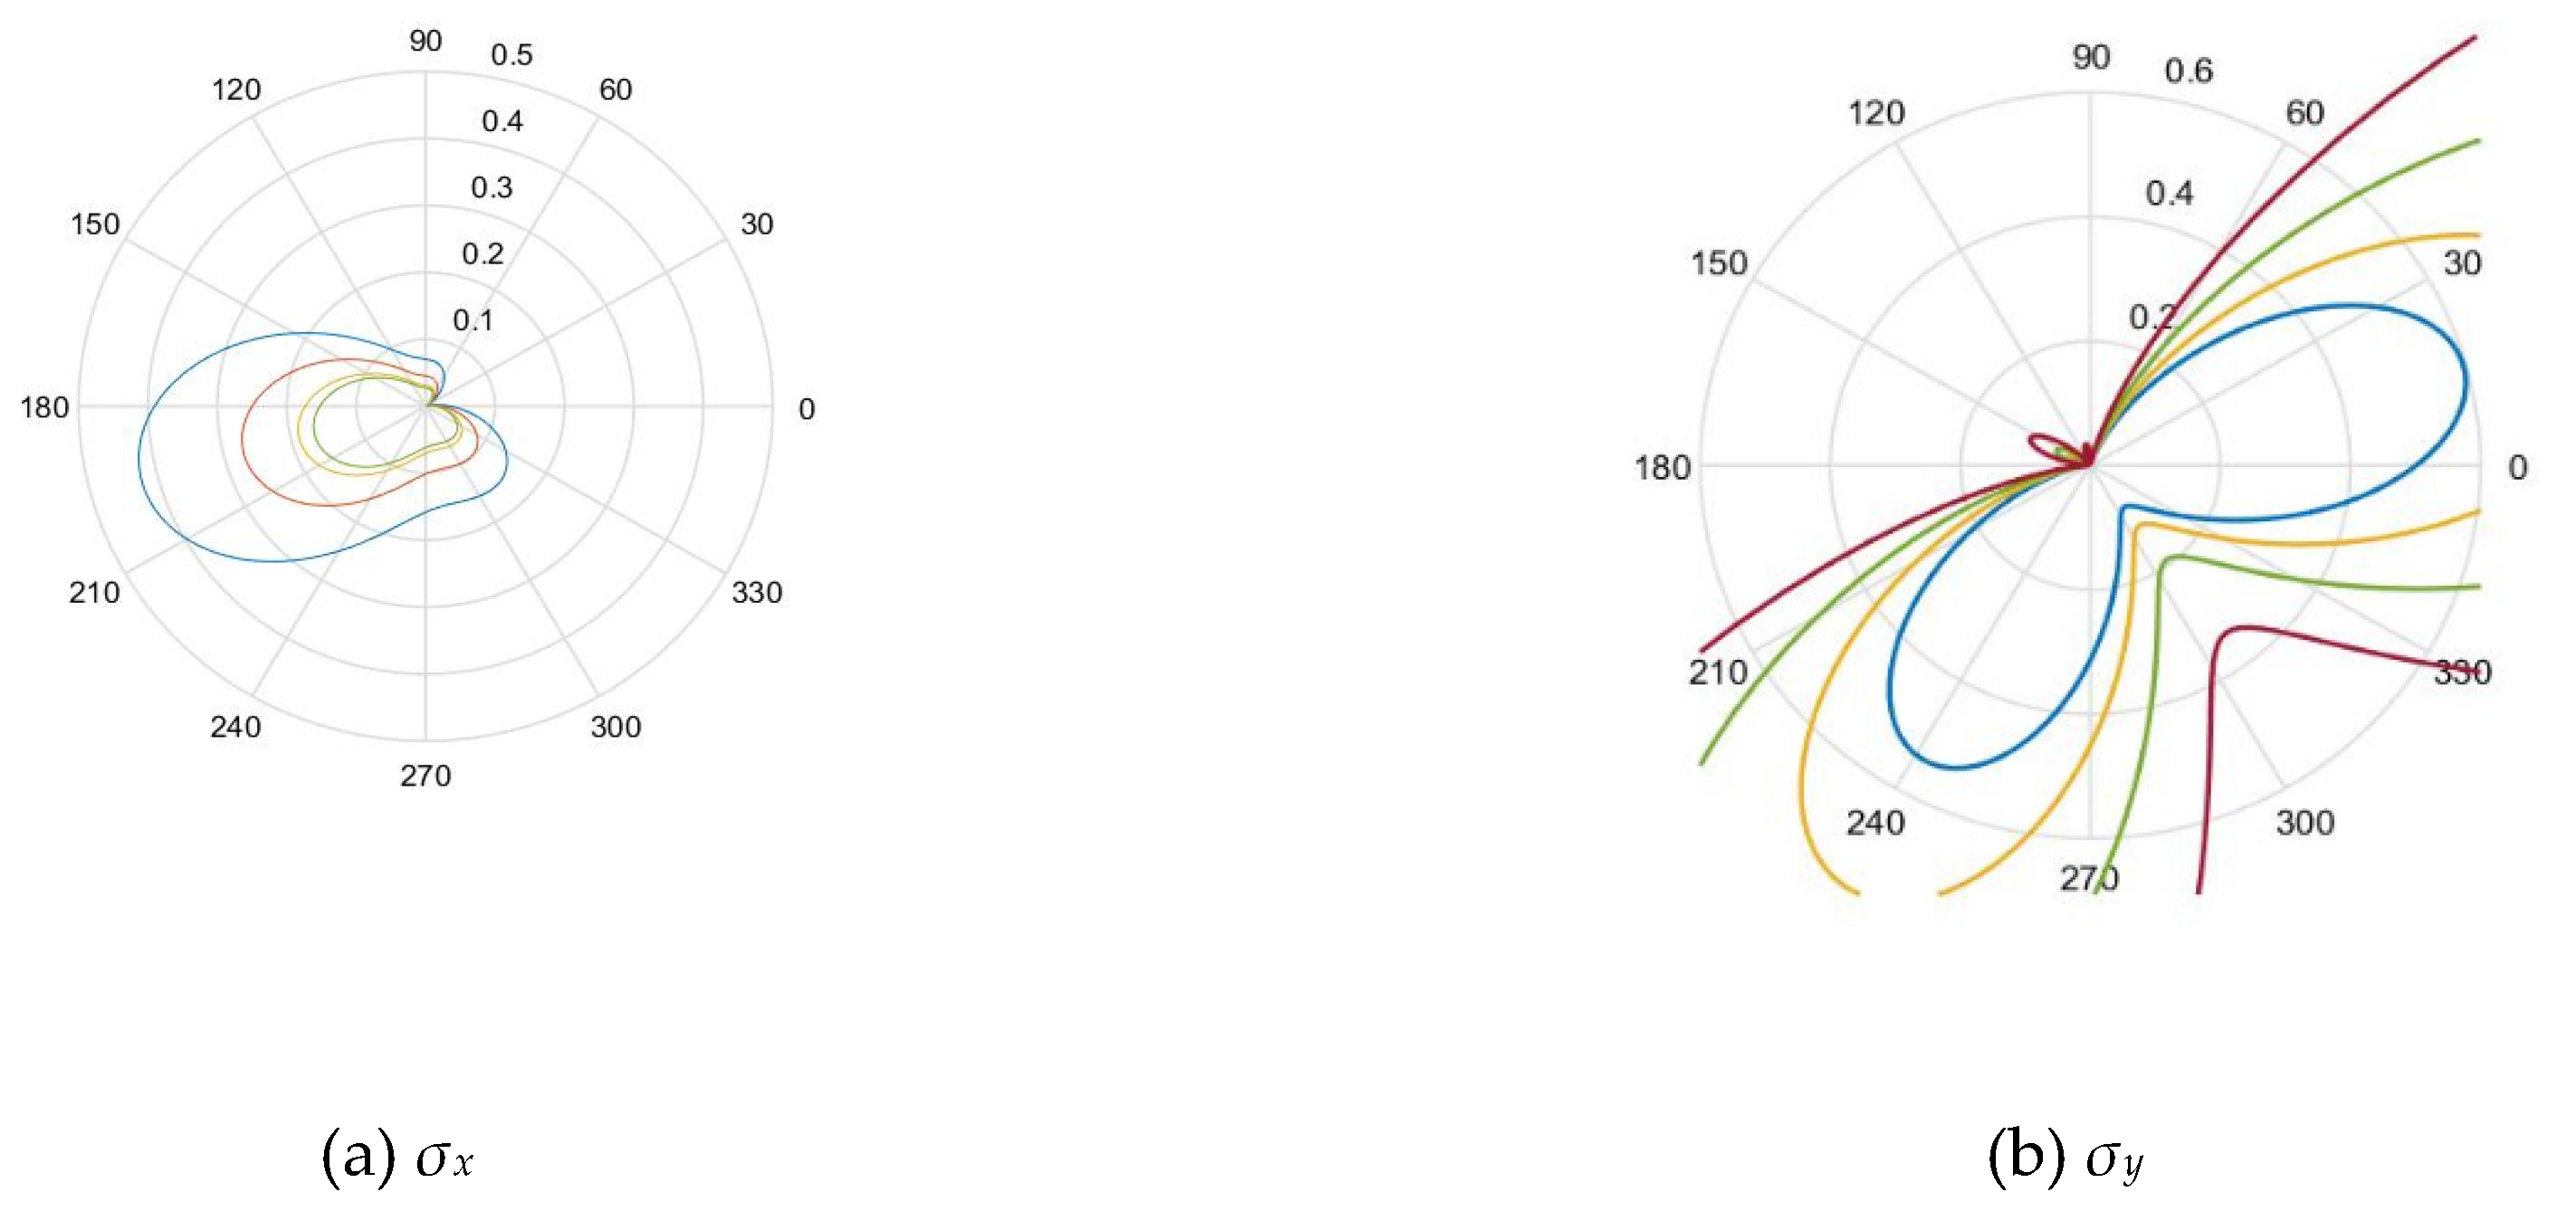
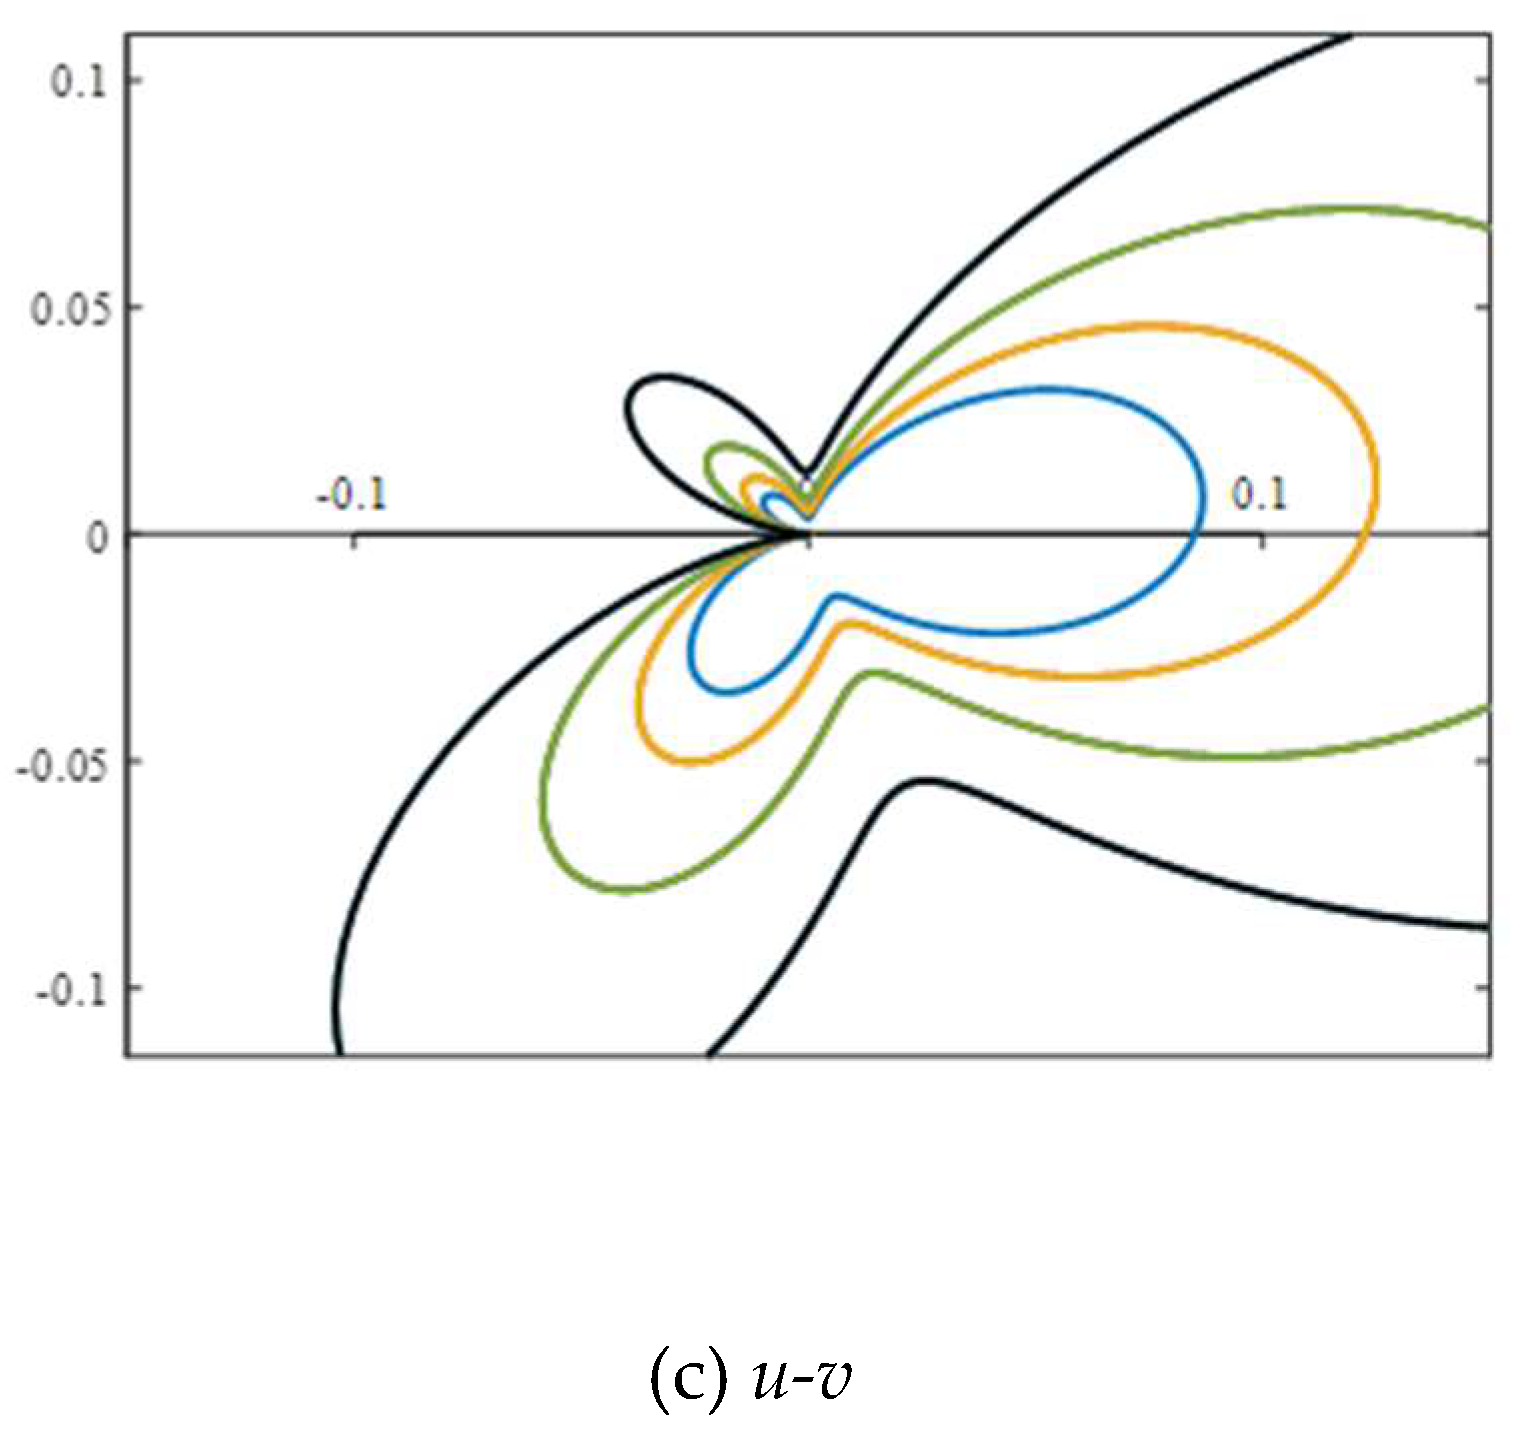
Figure 2 into Equation 12 and Equation 13 and combining with the delayed blasting model, the contour plots of stresses and deformation were calculated in
Figure 3.
It can be seen from
Figure 3(a) that at the joint end
σx was positive in the direction of 0~330° and subjected to tensile stress; whereas it was negative in the direction between 330~360° under compressive stress.
σx was not symmetrical along the joint interface and
σx stress gradient increased rapidly in the direction of 300°~330°, forming a stress concentration area.
Figure 4(b) shows that the joint end
σy was positive in the direction of 0~180° under tensile stress. On the other hand, it was negative in the direction of 180~360° and subjected to compressive stress. Although the stress was symmetrically distributed along the joint interface, it can be clearly found from the figure that the
σy stress field is not distributed symmetrically. Comparing
Figure 3(a) and (b), although there were normal stress components in
σx and
σy,
σx had a larger stress range. It can be seen from
Figure 3(c) that the lateral displacement of the joint end was affected by the stress components in both directions. Although an intuitive understanding of the stress field distribution at the joint end can be obtained from the stress contour diagram, the asymmetry and continuous changes in the whole process still cannot be analysed from contour plot. By then, the numerical simulation method was used to analyse the stress change of wave acting on the mass point on the left side of the joint. Based on the following three figures, it was seen that the stress field of the joint particle was asymmetric.
Based on
Figure 3(a), the stress on the left side of the joint was tensile stress. According to the gradient change of stress value with the distance from the joint, the stress distribution in the contours was denser, indicating it is manifested as tensile stress. The failure was more likely to appear in this area.
Figure 3(b) shows the contour plot of longitudinal stress along the joint. It can be seen from the figure that the compressive stress distribution area and value were very small; and the rock material were not damaged at this time. Thereby, the stress concentration appeared in the lower right position. However, the vibration velocity of the particles on both sides of the joint interface changed from time to time; and the maximum force position also changed accordingly.
To verify the propagation of detonation wave incident on jointed rock mass and discuss the distribution of stress field of jointed rock mass under the blasting, a finite element model was used. To assess the effect of blast shock wave on stress field around the joint, the peak strain value was used as the only parameter (positive values represent tensile stress and negative values represent compressive stress) in the numerical simulation[
25,
26]. By setting parameters such as time step, the influence of joint on stress field around incident joint subject to explosion stress wave could be analysed.
5. Analysis of Blasting Simulation
Based on field conditions, it was assumed that the pore spacing and lithology, the fluid-structure coupling of the explosive and the Lagrange algorithm was used for ore rock and the blockage simulation. The rock constitutive model adopted the bilinear kinematic hardening model (Plastic Kinematic) [
27,
28,
29] and the specific expression was as follows:
where
σ0 is the initial yield strength;
C and
P are constants related to material properties and
C=35,
P=3;
is the strain rate;
β is an adjustable parameter,
β=1;
EP is the plastic hardening modulus, 23.7 MPa;
is the plastic strain rate and
is the equivalent plastic strain.
The same material model was used for the stemming and hosting rock[
30], in which the specific parameter settings are shown in
Table 1 and
Table 2.
The intervals were filled by air, at an air density of 1.29 g/L. On the other hand, other parameters are defaulted and the state equation was expressed as:
when μ<0, C2μ2 and C6μ3 were 0; C0=C1=C2=C3=C6=0, C4=C5=γ-1, γ is the ratio of two pressures and volume specific heat.
The JWL equation was used to describe emulsion explosives state, which was expressed as:
whereas
P is the required pressure value;
E is the internal energy of the detonation product per unit volume;
V is the volume of the detonation product;
A,
B,
R1,
R2 and
w are empirical parameters, and the explosives were selected according to the site conditions. The parameters are detailed in
Table 3.
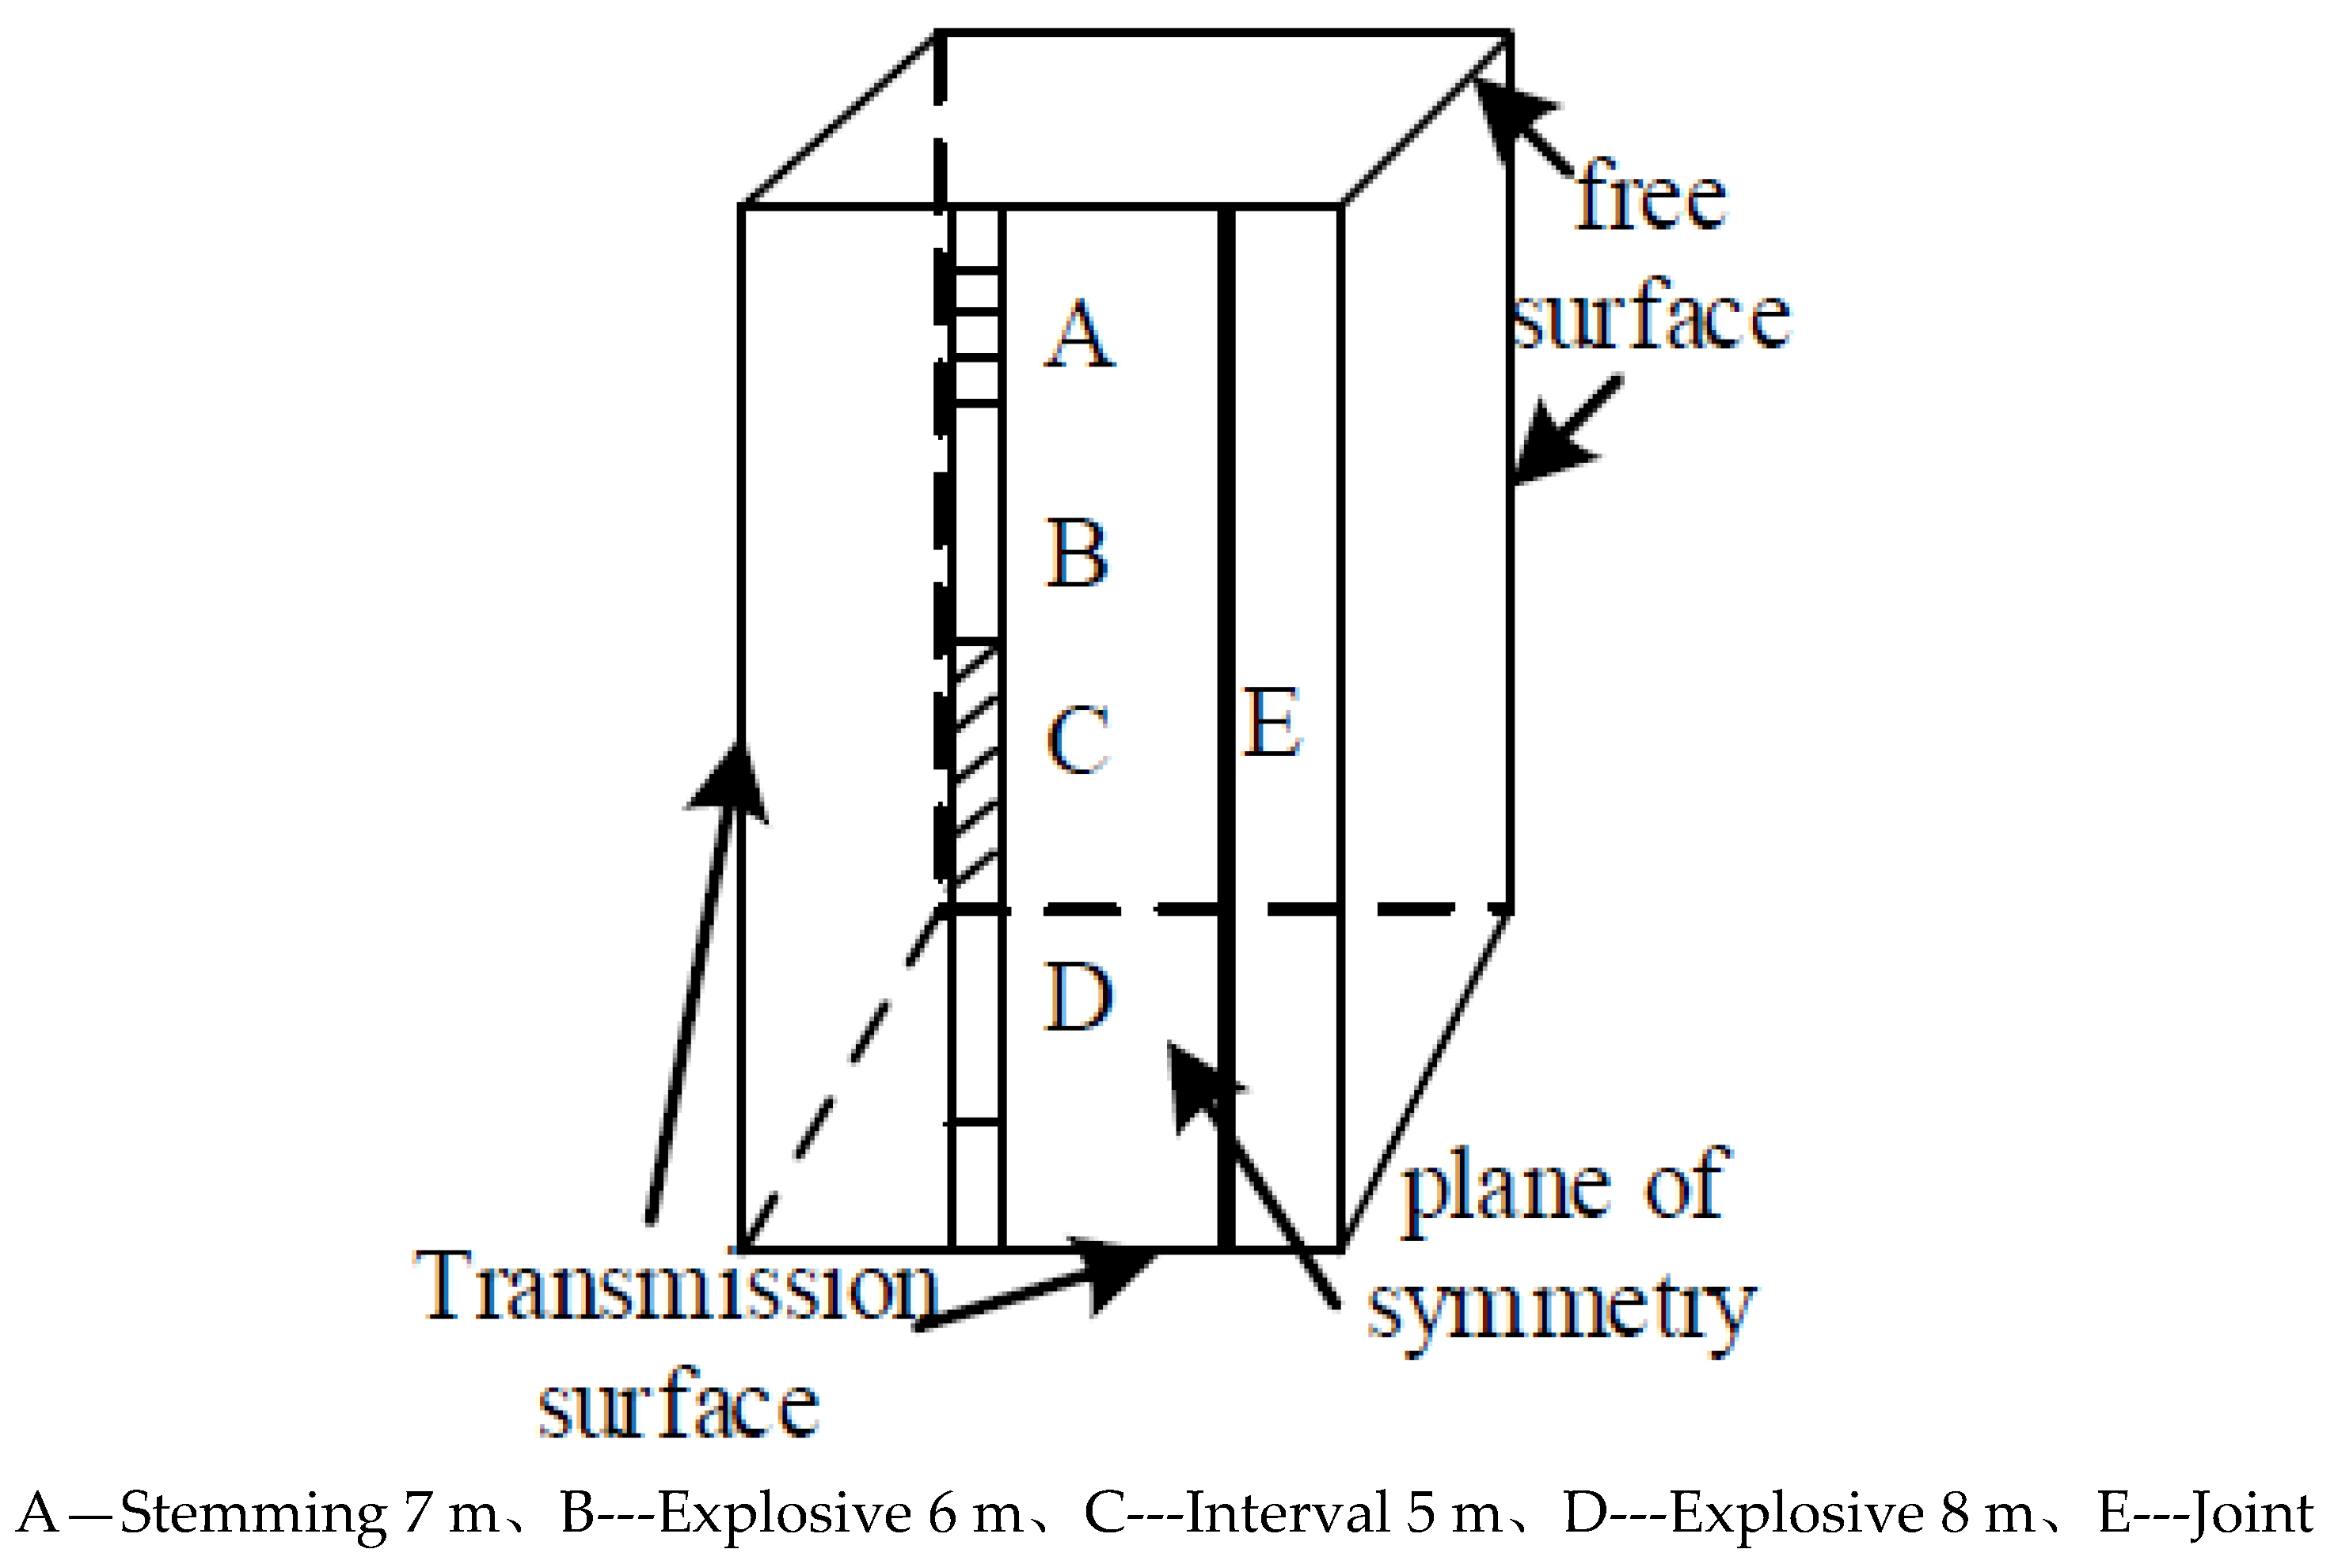
When defining the boundary conditions, it was consistent with the joint delayed blasting model. Nunmerical simulation software was used to obtain the dynamic distribution of effective stress within surrounding rock mass after the explosion. After obtaining the effective stress time history curve of the key element and comparing it with the tensile strength of the surrounding rock, rock mass fracture would occur if the effective stress was greater than the tensile strength; otherwise, it would not occur. The material parameters were restored and set with reference to the physical and mechanical parameters in the field; and boundary load constraints were imposed. By calibrating against the field conditions, a reasonable time step, CPU speed and storage space were obtained. By then, the symmetry axis was used as a constraint and transmission boundaries and reflection boundaries were imposed.
Figure 4 shows a typical setup.
Upon completion of calibration, changes in the Mises stress nephogram of highwall bench blasting at different times were obtained. In
Figure 5, the charge column at the lower part of the blast hole detonated first and the detonation wave propagated from the bottom to the top of the hole. When
t=1 197us, the shock wave generated by the explosive induced fracture in surrounding rock and stress wave of charge column began to propagate to the hole. In comparison, the stress wave that propagated to the bottom of the hole was pear-like and propagated downward. When
t=1 498 us, blasting spread radially from the hole centre like water ripples. At the same time, the value gradually decreased. Stress in the crushing area around the blasthole was relatively concentrated and the wave propagating to crack area could pass through the depth of color in the figure. The change was then analysed and the color of the outer layer was weakened to a certain extent from the blast hole. With propagation of detonation wave in the hole, the detonation wave attenuated into a stress wave and rock mass hindered the propagation of the shock wave. This was similar to the propagation of ocean waves to the position of the free surface layer by layer. The intensity of the shock wave was lower than the damage strength of the rock and the sub-layer shock wave supplemented the shock wave energy that was not enough to break the rock. This further pushed the explosive gas into the crack, forming a gas wedge effect; which further deepened and expanded the crack. This is shown in
Figure 5. Based on the degree of color change with the attenuation of the detonation wave energy, the stress exhibited a decreasing trend in this process.
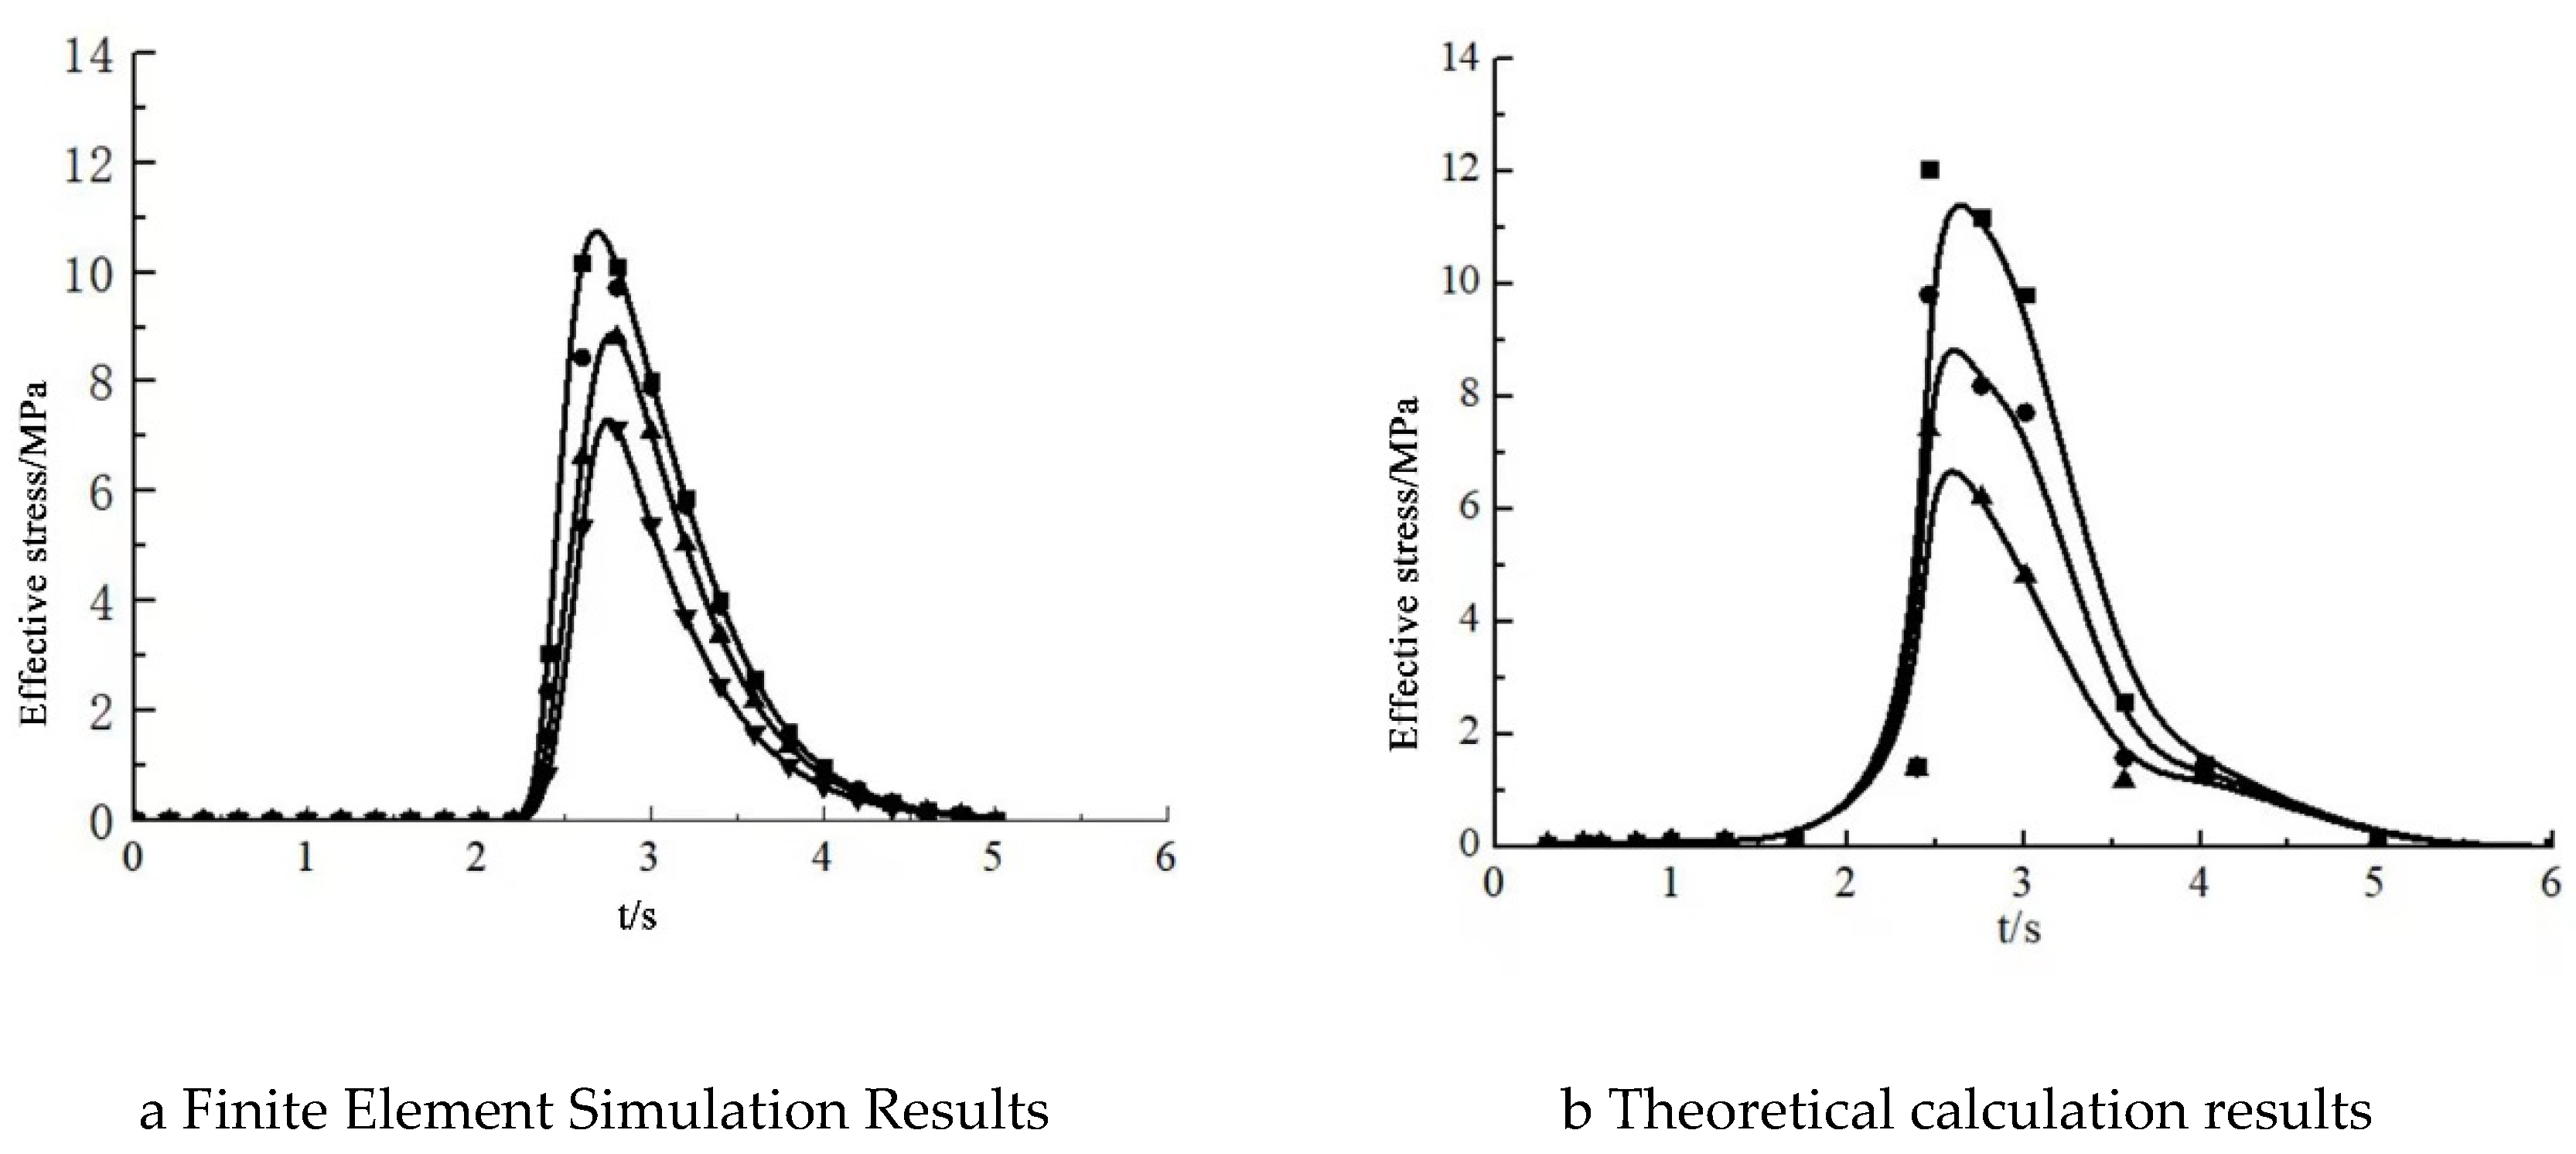
The detonation differential time of the upper and lower charges in the hole was taken as 3ms~5ms. After the detonation was initiated between 3ms to 5ms, change of the peak effective stress values, the strength and duration of the stress around each inspection point in the air charge column were analysed. It can be seen from
Figure 6 that it only took 2.5ms from the start of detonation to the peak effective stress. Subsequently, the energy of shock wave acting on the rock mass decreased sharply with the increase of distance from the blasthole along with loss of energy. The rock mass in the fissure area penetrated the fissure under detonation wave and the symbiotic gas. By then, the instantaneous peak effective stress value decreased to 0 at 5 ms and coincided parallel to the horizontal direction. The distribution of the peak effective stress was compared and analyzed from the two figures. It was observed that the peak value first increased to 10-12 MPa and then showed a downward trend. The finite element simulation results and the mathematical analysis theoretical results both showed the same variation.
6. Conclusion
Under the condition of 24m highwall bench and large-diameter vertical drilling at Barun mine, the distribution of blasting induced stress under delayed detonating explosive within fractured rock mass was analyzed. The following conclusions were obtained:
(1) By constructing a non-linear joint blasting model and introducing the detonation wave propagation velocity simplification into the vibration velocity of the incident particle at the joint interface, the incident P-wave incident joint was obtained. The peak value was at 3.0s with a peak vibration velocity of 0.33m/s; S-wave reflected from the joint interface was first reflected backward and then forward. The peak vibration velocity of the particle was 0.027 m/s.
(2) By combining with the relevant theories of stress and displacement field at the crack end of type I and II cracks, it was obtained that joint presented asymmetric characteristics around the stress field. The end σx was positive in the direction of 0~330° subject to tensile stress; whereas σy was positive in the direction of 0~180° under tensile stress; the longitudinal stress σy of the joint was low around the compressive stress distribution area. At this point, rock material would not fail and the stress concentration appeared in the lower right position. The lateral displacement of the joint ends was significantly affected by the stress components in both directions.
(3) Based on analysis results of ANSYS, it was found that the intensity of the shock wave after detonation was greater than the strength of rock. By then, the sub-layer shock wave supplemented the energy of the shock wave that was not enough to break the rock and induced further cracking. Based on analysis results on the attenuation of detonation wave energy, the stress exhibited a decreasing trend in the process. By constructing a variation diagram of the peak effective stress, it was found that the peak value first increased to 10-12 MPa and then showed a downward trend.
The main contents of this research are as follows:
Firstly, construction of a simulation model for jointed rock mass model under blasting. This is achieved by combining nonlinear joint model, hyperbolic joint constitutive model (BB model) of normal nonlinear deformation and tangential linear deformation. Subsequently, the function of P-wave joint incident propagation was deduced. By selecting δ as the factor of stress wave function, the relationships between reflecting and incident wave points, the peak value of vibration velocity and time were investigated. MATLAB was used to analyse change of stress and displacement of particles around the joints.
Based on existing technological conditions, the influence of stress distribution of rock mass under delayed blasting of the jointed rock mass was studied. The analysis results show that the peak stress first reached to 10-12 MPa followed by a decreasing trend. The particle changes of two analysis methods had the same trends, which were subsequently verified by the results of finite element simulation and mathematical analysis.
References
- Bao Shijie. Study on the change law of stress and displacement at the end of finite-length joints with oblique incidence of stress waves [D]. Liaoning University of Engineering and Technology 2017.
- 2. Song Lin, Yan Yuzhan, Han Baxiao, et al. Theoretical study on the propagation characteristics of longitudinal waves in nonlinear deformation joints. Chin. J. Appl. Mech. 2012, 133-140+236.
- Zhao Anping, Feng Chun, et al. Research on the influence of joint properties on stress wave propagation and blasting effect. Chin. J. Rock Mech. Eng. 2018, 37, 027–2037. [Google Scholar]
- Gao Qidong, Lu Wenbo, Leng Zhendong, et al. Research on the regulation of blasting energy transmission in the blasting position in the hole in rock blasting. Chin. J. Geotech. Eng. 2020, 42, 2050–2059. [Google Scholar]
- Leng Zhendong, Fan Yong, Lu Wenbo, et al. Analysis of explosion energy transmission and rock breaking effect under the condition of double-point blasting in the hole. Chin. J. Rock Mech. Eng. 2019, 38, 1–13. [Google Scholar]
- Wu Haojun, Gong Min. Calculation and application of hole-by-hole blasting vibration synthesis based on the actual delay range of the detonator. Blasting Vib. 2019, 39, 025202–1. [Google Scholar]
- Beckel E, Oyler K, Mehta N, et al. Primary explosive processing in the resonant acoustic mixer[J].Propellants Explos. Pyrotech. 2021, 46, 697–704.
- Babanouri N, Abdolahpour M, Dehghani H. Modeling blast-induced fragmentation of jointed rock mass using voronoi discrete-element method. Int. J. Geomech. 2020, 20, 1–10. [Google Scholar]
- Han D Y, Yang H. Effects of tensile stresses on wave propagation across stylolitic rock joints. Int. J. Rock Mech. Min. Sci. 2021, 139, 1–11. [Google Scholar]
- Chai S B, Wang H, Yu L Y, et al. Experimental study on static and dynamic compression mechanical properties of filled rock joints. Lat. Am. J. Solids Struct. 2020, 17, 1–15. [Google Scholar]
- Lak M, Marji M F, Bafghi A R Y, et al. Discrete element modeling of explosion-induced fracture extension in jointed rock masses. J. Min. Environ. 2019, 10, 125–138. [Google Scholar]
- Dong Q, Li X P, Huang J H. Model test study on cylindrical blasting stress wave propagation across jointed rock mass with different initial stresses. Adv. Civ. Eng. 2020, 8, 1–13. [Google Scholar]
- Dunlop, E.C. , Salmachi, A., McCabe, P.J. Investigation of increasing hydraulic fracture conductivity within producing ultra-deep coal seams using time-lapse rate transient analysis: A long-term pilot experiment in the Cooper Basin, Australia. Int. J. Coal Geol. 2020, 220. [Google Scholar] [CrossRef]
- Huang, L. , Liu, J., Zhang, F., Dontsov, E., Damjanac, B. Exploring the influence of rock inherent heterogeneity and grain size on hydraulic fracturing using discrete element modeling. Int. J. Solids Struct. 2019, 176–177. [Google Scholar]
- Wang, X. , Cai, M. A comprehensive parametric study of grain-based models for rock failure process simulation. Int. J. Rock Mech. Min. Sci. 2019, 115, 60–76. [Google Scholar] [CrossRef]
- Chen Jianhang; Liu Peng; Zhao Hongbao; Zhang Cun and Zhang Junwen. Analytical studying the axial performance of fully encapsulated rock bolts. Eng. Fail. Anal. 2021, 128, 105. [Google Scholar]
- Chen Jianhang; Zhao Hongbao; He Fulian; Zhang Junwen and Tao Kangming. Studying the performance of fully encapsulated rock bolts with modified structural elements. Int. J. Coal Sci. Technol. 2021, 8, 64–76. [Google Scholar] [CrossRef]
- Chen Jianhang; Zhao Yiqiang; Zhao Hongbao; Zhang Junwen; Zhang Cun; Li Danqi. Analytic study on the force transfer of full encapsulating rockbolts subjected to tensile force. Int. J. Appl. Mech. 2021, 13. [Google Scholar]
- 19. He Qingyuan; Lei Zhu;Li Yingchun. Simulating Hydraulic Fracture Re-orientation from Oriented Perforations in Heterogeneous Rocks with An Improved Discrete Element Method. Rock Mech. Rock Eng. 2021.
- Cai Runze; Li Yanzhao; Zhang Chunxiao. Damage assessment of prefabricated prestressed channel slab under plane charge blast. J. Eng. Struct. 2021, 246. [Google Scholar]
- Wu, S., Li. J., Guo, J., Shi. G., Gu, Q., and Lu. C. Stress corrosion cracking fracture mechanism of cold-drawn high-carbon cable bolts. Mater. Sci. Eng. A 2020, 769, 1–10. [Google Scholar] [CrossRef]
- Wu, S. , Ramandi, H. L., Hagan, P. C., Crosky, A. and Saydam, S. Mineralogically influenced stress corrosion cracking of rockbolts and cable bolts in underground mines. Int. J. Rock Mech. Min. Sci. 2019, 119, 109–116. [Google Scholar] [CrossRef]
- Wu, S. , Zhang, X., Li, J., and Wang, Z. Investigation for influences of seepage on mechanical properties of rocks using acoustic emission technique. Geofluids 2020, 1155, 10–19. [Google Scholar]
- Henry, written by Xiong Jianguo. Explosive dynamics and its applications. Beijing: Science Press, 1981.
- Gao Qidong, Lu Wenbo, Leng Zhendong. Research on the control effect of the initiation position in the hole on the energy transmission of the explosion in rock blasting. Chin. J. Rock Eng. 2020, 42, 2050–2059. [Google Scholar]
- Peng fei Zhang, Runcai Bai. A Study of Millisecond Blasting on High Bench at Barun Iron Ore Operation. Geofluids 2021, 13, 1–13. [Google Scholar]
- Han Z Y, Li D Y, Zhou T, et al. Experimental study of stress wave propagation and energy characteristics across rock specimens containing cemented mortar joint with various thickness. Int. J. Rock Mech. Min. Sci. 2020, 131, 1–11. [Google Scholar]
- Shu P Y, Lin C Y, Li H H, et al. Dynamic response of rock containing regular sawteeth joints under various loading rates and angles of application. Appl. Sci. 2020, 10, 1–20. [Google Scholar] [CrossRef]
- Hu Y G, Yang Z W, Huang S L, et al. A new safety control method of blasting excavation in high rock slope with joints. Rock Mech. Rock Eng. 2020, 53, 3015–3029. [Google Scholar] [CrossRef]
- Zhu J B, Li Y S, Peng Q, et al. Stress wave propagation across jointed rock mass under dynamic extension and its effect on dynamic response and supporting of underground opening. Tunn. Undergr. Space Technol. Inc. Trenchless Technol. Res. 2021, 108, 1–21. [Google Scholar]
|
Disclaimer/Publisher’s Note: The statements, opinions and data contained in all publications are solely those of the individual author(s) and contributor(s) and not of MDPI and/or the editor(s). MDPI and/or the editor(s) disclaim responsibility for any injury to people or property resulting from any ideas, methods, instructions or products referred to in the content. |
© 2023 by the authors. Licensee MDPI, Basel, Switzerland. This article is an open access article distributed under the terms and conditions of the Creative Commons Attribution (CC BY) license (http://creativecommons.org/licenses/by/4.0/).
