
Submitted:
14 March 2023
Posted:
15 March 2023
You are already at the latest version
Abstract
Exopolysaccharides-EPS are long-chain biopolymer with branched, recurring unit of sugars and non-carbohydrate constituents connected to exterior of cells. Rhizobial, a legume nodulating organism is capable of producing EPS. This study investigated the characteristics’ of some Rhizobium EPS and their effects in shelf life extension of some Musa spp. Rhizobial-EPS was produced using yeast extract mineral medium purified by standard methods. The EPS was characterized to determine functional group, thermal stability, chemical compounds and the monosaccharide component using Fourier Transform Infra-red, Spectroscopy, thermogravimetric Analysis (TGA), Gas Chromatography–Mass Spectrometry and HPLC and their bio-preservative property on post-harvest quality of plantain and different banana was done. The Rhizobial-EPS functional groups were hydroxyl, carboxyl, amine, methyl and ethers associated with polysaccharides. Pentadecanoic acid, octadecanoic acid, oleic acid and heptacosanoic acid, and varied concentration of monosaccharides were detected in the exopolysaccharides. The TGA of the EPS shows a constant loss in weight with two quasi-sharp alterations and almost steady plateau. The EPS coated samples had the lowest weight loss across the samples and as such edible coating was effective in delaying weight loss. The weight loss of Musa paradisiaca (plantain) coated with (EPSA obtained from USDA 110), (EPSB USDA 532C) and (EPSC S2) at the first day were 314 and 314.5g. The initial weight loss of coated and uncoated Musa sp. (Apple Banana), Musa acuminata (Lady Finger), and Musa balbisiana (Cooking Banana), ranged from 72 – 72.7g, 96 – 97g and 95 – 98g respectively. The total sugar of EPS Coated Musa sp. ranges from 0.381 – 0.528mg/L, 0.392 – 0.576 mg/L and 0.41 – 0.598 mg/L at days 1, 2 and 3 respectively. The highest Titratable acidity and pH was observed in EPS coated sample. The results obtained from this study proves that EPS solution is a valuable product for fruit preservation and viable for commercial applications.
Keywords:
Exopolysaccharides
; Rhizobial
; Musa paradisiaca
; Musa balbisiana Musa acuminata
; EPS-producing Rhizobia
1. INTRODUCTION
Microorganisms that produced Exopolysaccharides (EPS) can be isolated from variety of natural sources, including soil, water and biofilm, in both aquatic and terrestrial habitats. The most common commercially accessible EPSs consist of xanthan, gellen, alginate, cellulose and hyaluronic acid [1]. EPS are type of long-chain biopolymer made up of branched, recurring unit of sugars, as well as non-carbohydrate constituents that can be found connected to the exterior of cells or released into the environment [2]. EPS are slimy substances that may be defined in two forms based on their location either bounded to cell surface as cell-bound or secreted into surrounding media as released EPS [3]. The EPS potential to raise solution viscosity or cause gels development makes increases its usage in industrial product formulations in recent years [4].
Rhizobial are soil microorganisms with an extensive array of taxonomic, metabolic, and genetic diversity [5]. Nitrogen deficiency in rhizosphere results in legumes-bacteria partnership, which allows atmospheric di-nitrogen to be fixed. This association between the soil bacteria and legumes is based on a complicated molecular process that starts with the host plant roots secreting flavonoids that helps activate the Rhizobium regulatory gene products [6]. Rhizobial is the name given to this group of soil bacteria and majority of the bacteria found in legume symbionts belong to the proteobacteria class that include Mesorhizobium, Bradyrhizobium, Azorhizobium and Sinorhizobium [7]. Rhizobial can produce Lipopolysaccharides (LPS), exopolysaccharides and Cyclic Glucans (CG) among other surface polysaccharides, which are crucial for bacteria’s activity in free-living and symbiotic environments [8]. Until now, the only form of rhizobia EPS that is commercially available is Succinoglycan that is also called EPS1 that is isolated from Sinorhizobium meliloti [2].
2. METHODOLOGY
- Production, Extraction and Purification of EPS
EPS from selected Rhizobia was done using Yeast Extract Mineral Medium (YEMM) containing: 2% Sucrose, 2% Nitrogen, (glycine), 0.1% and Vitamin (biotin) 1µg/mL. The culture was incubated in a shaker for 144 hours and the enzymes that could degrade polymers were disabled by boiling using hot water bath [9] and left to chill to room temperature. 250 µg of 80% (w/v) trichloroactic acid was mixed with the samples stored at 4oC so as to precipitate protein. Supernatant retrieved and precipitation of EPS was done by adding 2 volume of 100% of cold ethanol and stored overnight at 4oC [10]. The precipitate retrieved at 10000g for 15 minutes was re-suspended in water. A dialysis tube was used to purify the unpurified EPS for 48 hours by changing the distilled water four times. All the analysis was duplicated while the uninoculated medium served as control.
- Determination of functional group of EPS produced by the Rhizobia: The functional group in the EPS was determined using Fourier Transform Infra-red (FT-IR) Spectroscopy.
- Determination of thermal stability of the EPS: The thermal stability of the EPS was determined using thermogravimetric Analysis (TGA). The TGA was done on 27.1 mg of the EPS using a PerkinElmer Diamond TGA instrument. The TGA on the x-axis signal is plotted against the reference EPS temperature, which is changed to percentage weight change on y-axis. EPS was positioned in a platinum crucible and heated at a linear rate of 20°C/min under nitrogen over a temperature range of 10°C to 980°C, with weight loss calculated.
- Determination of chemical composition of the EPS: The chemical compounds present in the EPS were determined using GC-MS analysis.
- Edible Coating Formulation: Ten grams of EPS dissolved in 100ml sterile distilled water to compose an EPS solution (1 percent, w/v).
- Coating Applications: Plantains and bananas were divided into two groups at random. The EPS treatment was given to one group, while the untreated control group was given to the other. Fruits were coated by immersing them twice in the film-forming solution (EPS) for 10 minutes each time. Fruits were left to naturally dry for 1 hour at 25°C before being stored for further research.
- Physical Parameters of Musa sp.
- Weight Loss: The selected plantains and bananas for each preparation were weighed at the start, right after covering and air-drying, and then every sampling day throughout storage. Weight loss was measured in terms of overall weight loss and daily weight loss. Weight loss = (Initial weight-Final weight)
- Chemical Parameters of Musa sp.
- pH: After checking for the weight loss, 10 g of grinded plantain and banana was suspended in 100 mL of water after being chopped into pieces and homogenized and filtered. The pH was measured with pH meter.
- Titratable Acidity (TA): The plantain and banana samples were cut and homogenized then 10 g of crushed plantain and banana were suspended in 100 mL distilled water and filtered. 0.1 N NaOH was used to titrate the acidity of the samples. The titratable acidity of the banana was measured in grams of citric acid per 100 grams of weight.
- Extraction and Evaluation of Total Sugar/ reducing sugar from Plantain and Banana mash
- The method of Kumar et al. [12] was employed for extraction and evaluation of total sugar / reducing sugar from plantain and banana mash.
3.0. RESULTS
The effect of EPS coating on weight loss of Musa paradisiaca (Plantain) Musa sp. (Apple Banana), Musa acuminata (Lady Finger) and Musa balbisiana (Cooking Banana) is shown in Figure 1a - d. The weight loss of Musa paradisiaca (plantain) coated with EPSA, EPSB and EPSC is shown in Figure 1a. The initial weight of coated and uncoated Musa paradisiaca (plantain) at the first day were 314 and 314.5g. At day 2 – 10 of storage the weight loss of EPSACMP, EPSBCMP and EPSCCMP ranged from 21.8 – 76.4g, 21.8 – 104.1g and 34.7 – 141.9g. For uncoated sample the weight loss ranged from 74.9 – 139.4g at day 2 – 10 of storage. There was a major difference (P ≥ 0.05) in the weight loss of coated and uncoated Musa paradisiaca during storage (Figure 1a). For Musa sp. (Apple Banana), the initial weight loss of coated and uncoated Musa sp. ranged from 72 – 72.7g. For Musa sp. (Apple Banana), at day 2 -10 of storage, the weight loss of EPSACMS, EPSBCMS, EPSCCMS and UCMS ranged from 18 -63g, 1.9 – 26.8g, 2.1 – 28.6g 2.6 – 32.5 and 18 – 63.5g respectively. Significant difference was noticed in weight loss of coated and uncoated Musa sp. The maximum loss in weight was recorded in UCMS while the least was recorded in EPSACMS samples as shown in Figure 1b.
For Musa acuminata (Lady Finger), the initial weight of Musa acuminata ranged from 96 – 97g. At day 2 – 10 of storage, the weight loss of EPSACMS, EPSBCMS, EPSCCMS and UCMS ranged from 7.1 – 30.8g, 9.5 – 33.5g, 9.5 – 44.2g and 16.2 - 68.5g respectively. A significant difference (P ≥ 0.05) was noticed in the weight loss of coated and uncoated Musa sp. The highest weight loss was recorded in UCMS while the least was recorded in EPSACMS samples as shown in Figure 1c. For Musa balbisiana (Cooking Banana), the initial weight ranged from 95 – 98g. At day 2 – 10 of storage, the weight loss of EPSACMS, EPSBCMS, EPSCCMS and UCMS ranged from 10.5 – 32.9g, 10.8 – 35.5g, 12.1 – 40g and 13.7 – 64.3g shown in Figure 1d. UCMS had the highest weight loss (32.9 g) while the least weight loss (10.5 g) was observed in EPSACMS sample. However, there was a gradual weight loss in all the samples but the EPS coated samples had the lowest weight loss and as such edible coating was effective in delaying weight loss.
Figure 1.
a-d. Effect of Rhizobia EPS coating on weight loss of (a) Musa paradisiaca (Plantain) (b) Musa sp (Apple Banana) (c) Musa acuminata (Lady Finger) (d) Musa balbisiana (Cooking Banana) during storage.
Figure 1.
a-d. Effect of Rhizobia EPS coating on weight loss of (a) Musa paradisiaca (Plantain) (b) Musa sp (Apple Banana) (c) Musa acuminata (Lady Finger) (d) Musa balbisiana (Cooking Banana) during storage.
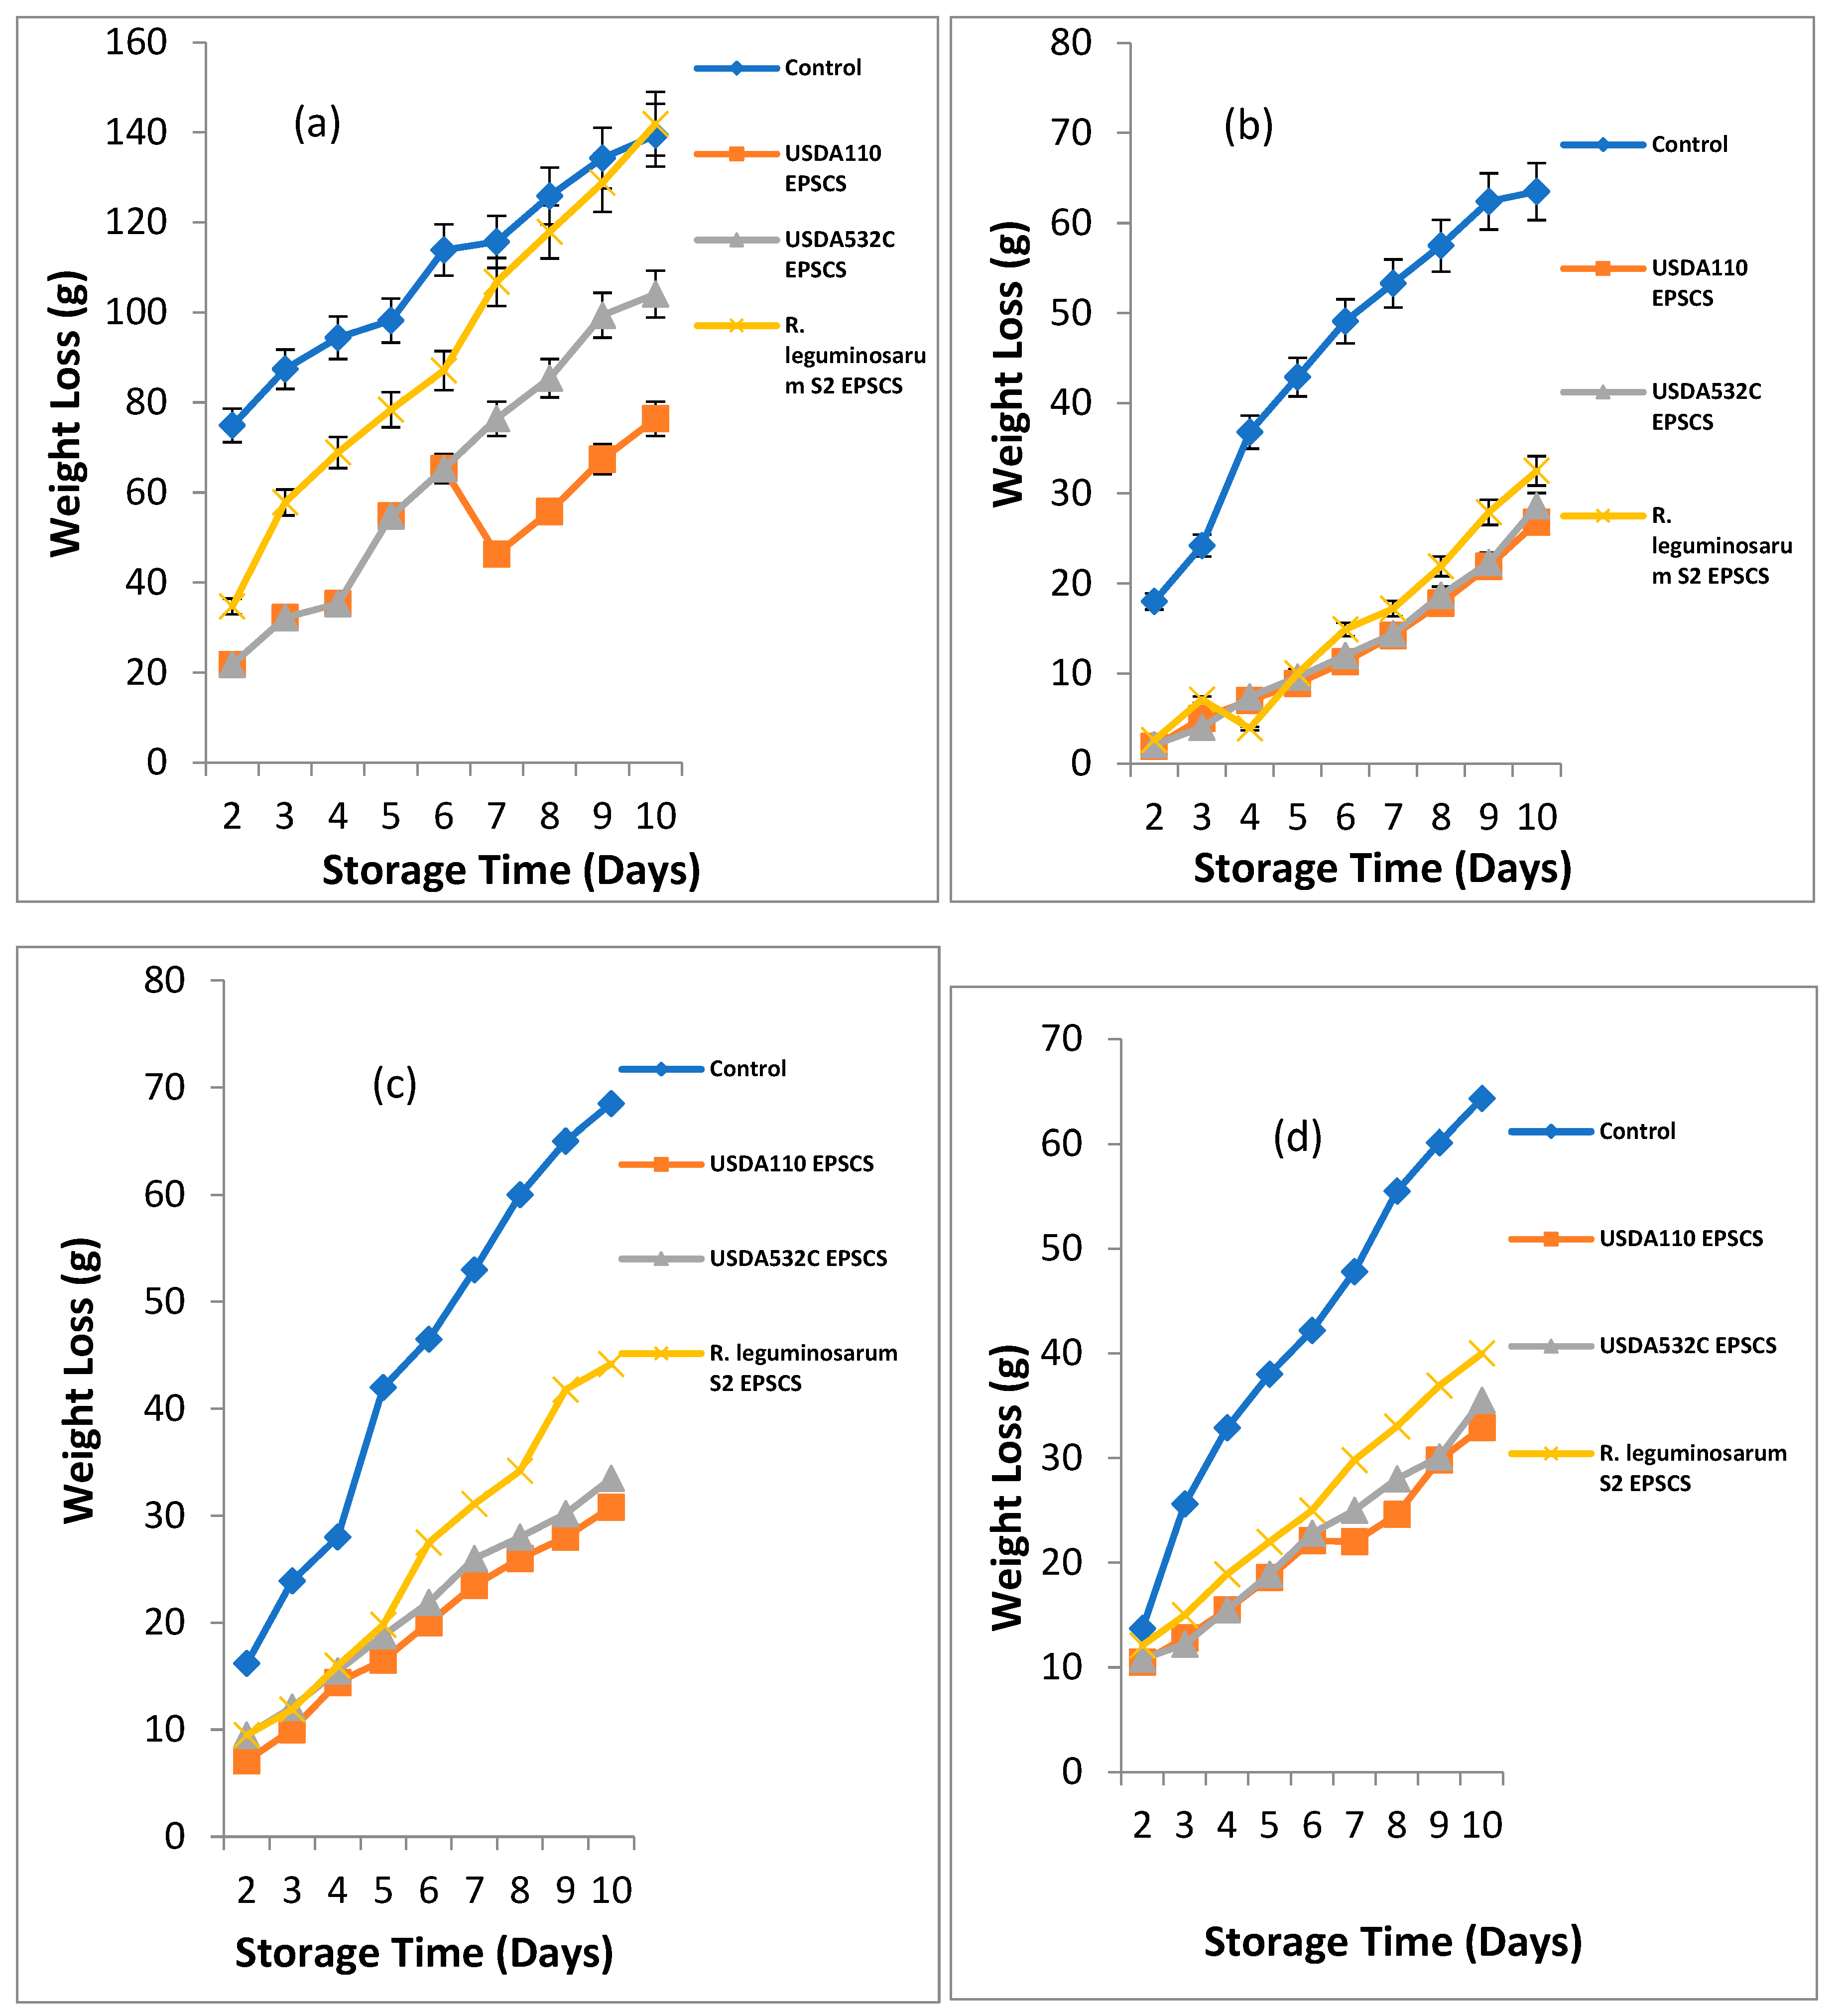
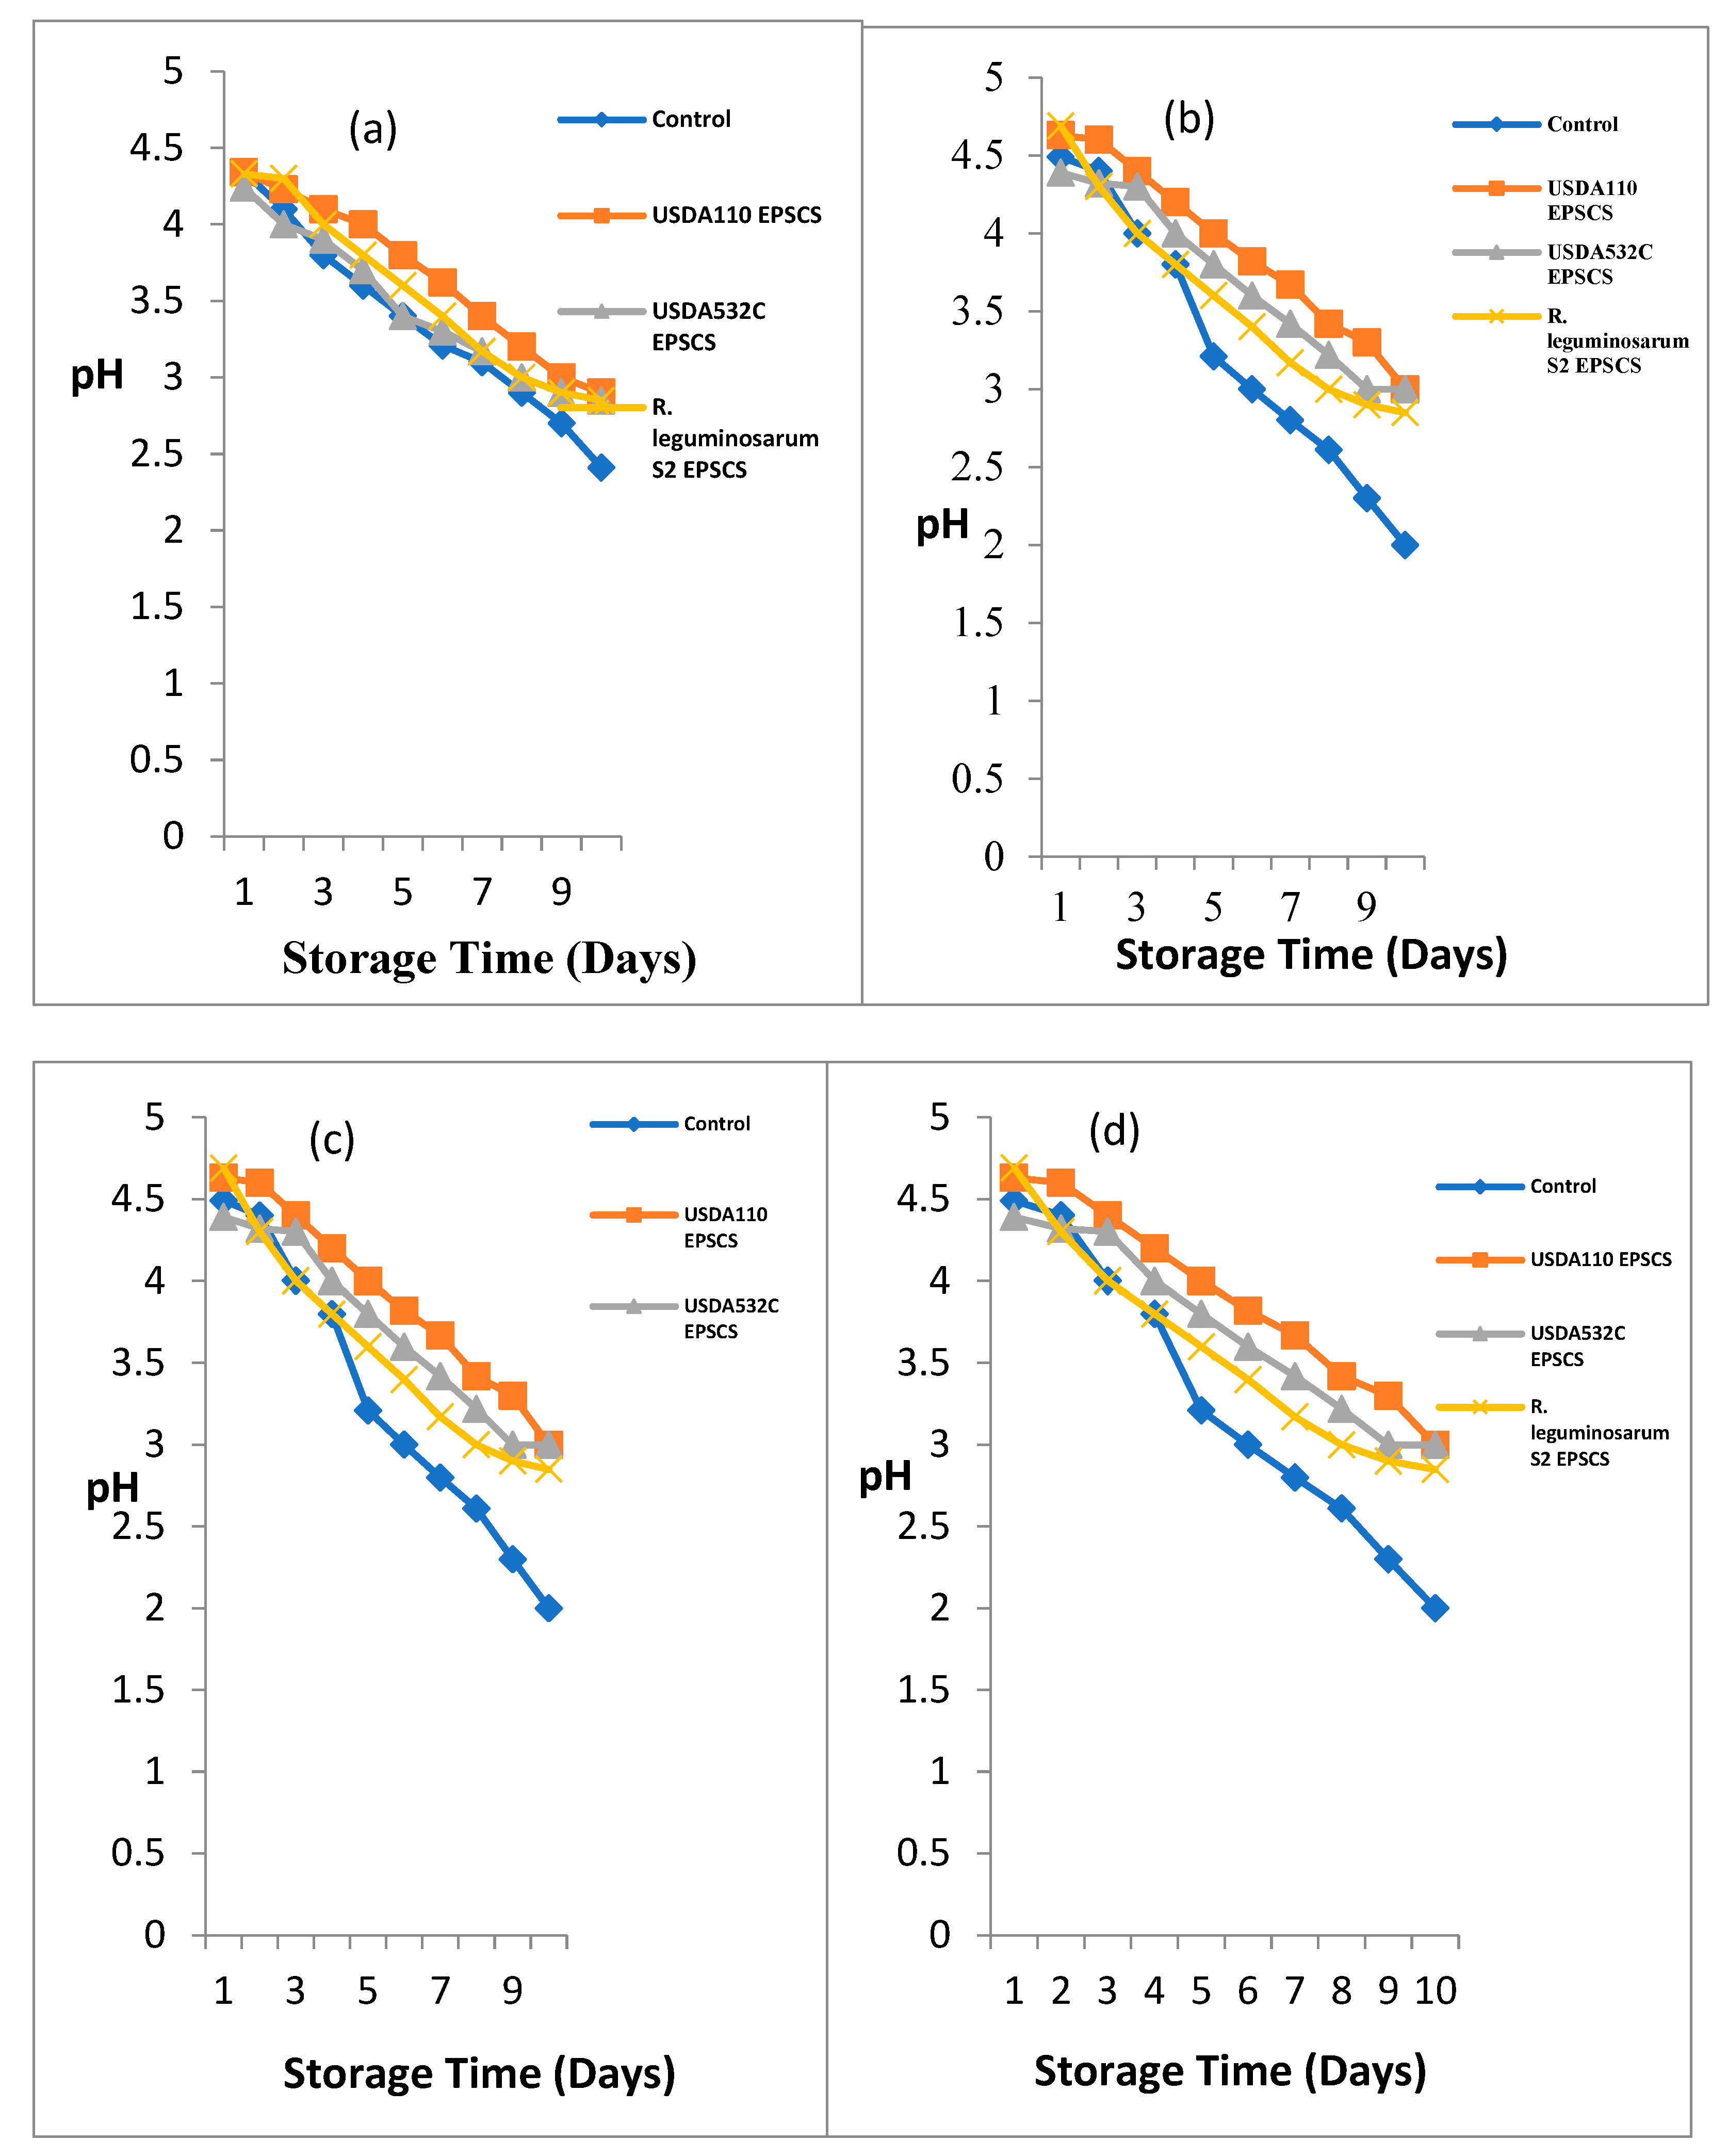
Figure 2a – d shows the outcome of EPS covering on pH of Musa paradisiaca (Plantain), Musa sp. (Apple Banana), Musa acuminata (Lady Finger) and Musa balbisiana (Cooking Banana).
Effect of Rhizobia EPS coating on pH of Musa paradisiaca (Plantain) during storage is illustrated in Figure 2a. A major difference (P≤0.05) on the outcome of Rhizobia EPS on the post-harvest value of Musa paradisiaca (Plantain) during storage was noticed. At day 1, the pH ranged from 4.24 – 4.34 the maximum pH was recorded UNCMP and EPSACMP while the least pH was seen in EPSBCMP. At day 2 of storage, the pH ranged from 4.0 – 4.3. The maximum pH was noticed in EPSCCMP while the smallest pH was obtained from EPSBCMP. At day 3, 4, 5, 6, 7, 8, 9 and 10, the pH ranged from 3.8 – 4.1, 3.6 – 4, 3.4 – 3.8, 3.21 – 3.62, 3.1 – 3.62, 3.1 – 3.4, 2.9 – 3.2, 2.7 – 3 and 2.41 – 2.9 respectively. The highest pH was obtained from EPS coated samples while the least pH was obtained in the UNCMP samples.
For Musa sp. (Apple Banana), the pH during storage is illustrated in Figure 2b. A major difference (P≤0.05) on the effect of Rhizobial EPS on the pH of Musa sp. (Apple Banana) during storage. At day 1, the pH ranged from 4.39 – 4.69 the highest pH was recorded in EPSCCMS while the least was recorded in EPSBCMS. At day 2, 3, 4, 5, 6, 7, 8, 9 and 10 the pH ranged from 4.2 – 4.6, 4 – 4.4, 3.8 – 4.2, 3.21 – 4, 3 – 3.82, 2.8 – 3.67, 2.61 – 3.42, 2.3 – 3.3and 2 – 3. The highest pH was obtained from EPSACMS while the least was obtained in the UNCMS samples. For Musa acuminata (Lady Finger), the initial pH of Musa acuminata ranged from 4.08 – 4.58. At day 2, the pH ranged from 4.0 – 4.3 for coated and uncoated samples. EPSCCMA had the highest pH while the least pH was recorded in UNCM and EPSACMA. The pH ranged from 3.7 – 4.13, 3.5 – 4.02, 3.2 – 4, 3.12 – 3.8, 2.9 – 3.6, 2.6 – 3.4, 2.2 – 3.2 and 2.0 – 3.0 at day 3, 4, 5, 6, 7, 8, 9 and 10 of storage. EPSACMA had the highest pH while the UNCMA had the least pH as shown in Figure 2c.
For Musa balbisiana (Cooking Banana), the pH during storage is shown in Figure 2d. The pH ranged from 4.24 – 4.54 on the 1st day. The highest pH was recorded in uncoated banana sample while the least pH was recorded in EPSBCMB. At day 2, the pH ranged from 4.0 – 4.35. EPSACMB had the highest pH follow in order by EPSBCMB while the least was recorded in UNCMB sample. The pH ranged from 3.8 – 4.3 at day 3 of storage. The highest pH was recorded EPSACMB while the least was obtained in UNCMB. The pH ranged from 3.6 – 4 at day 4 of storage. The highest pH was obtained in EPSACMB followed in order by EPSBCMB while the least was obtained in UNCMB. At day 5 of storage, pH ranged from 3.4 – 3.8. The highest pH was obtained in EPSACMB and EPSBCMB followed in order by EPSCCMB while the least pH was obtained from the UNCMB. At day 6 of storage, pH ranged from 3.21 – 3.62. The highest pH was obtained in EPSACMB while the least pH was obtained from UNCMB. The pH ranged from 3 – 3.54 and 2.9 – 3.31 at day 7 and 8. The highest pH was obtained in EPSBCMB while the least pH was obtained in UNCMB. At day 9 and10 of storage, pH ranged from 2.7 – 3.1 and 2.4 – 3.0. The highest pH was obtained in EPSACMB while the least pH was obtained from the UNCMB.
Comparatively, the highest pH was observed in EPS coated samples while the least pH was recorded in the uncoated samples.
Figure 2.
a-d. Biopreservative Effect of Rhizobial EPS coating on pH of (a) Musa paradisiaca (Plantain) (b) Musa sp (Apple Banana) (c) Musa acuminata (Lady Finger) (d) Musa balbisiana (Cooking Banana) during storage.
Figure 2.
a-d. Biopreservative Effect of Rhizobial EPS coating on pH of (a) Musa paradisiaca (Plantain) (b) Musa sp (Apple Banana) (c) Musa acuminata (Lady Finger) (d) Musa balbisiana (Cooking Banana) during storage.
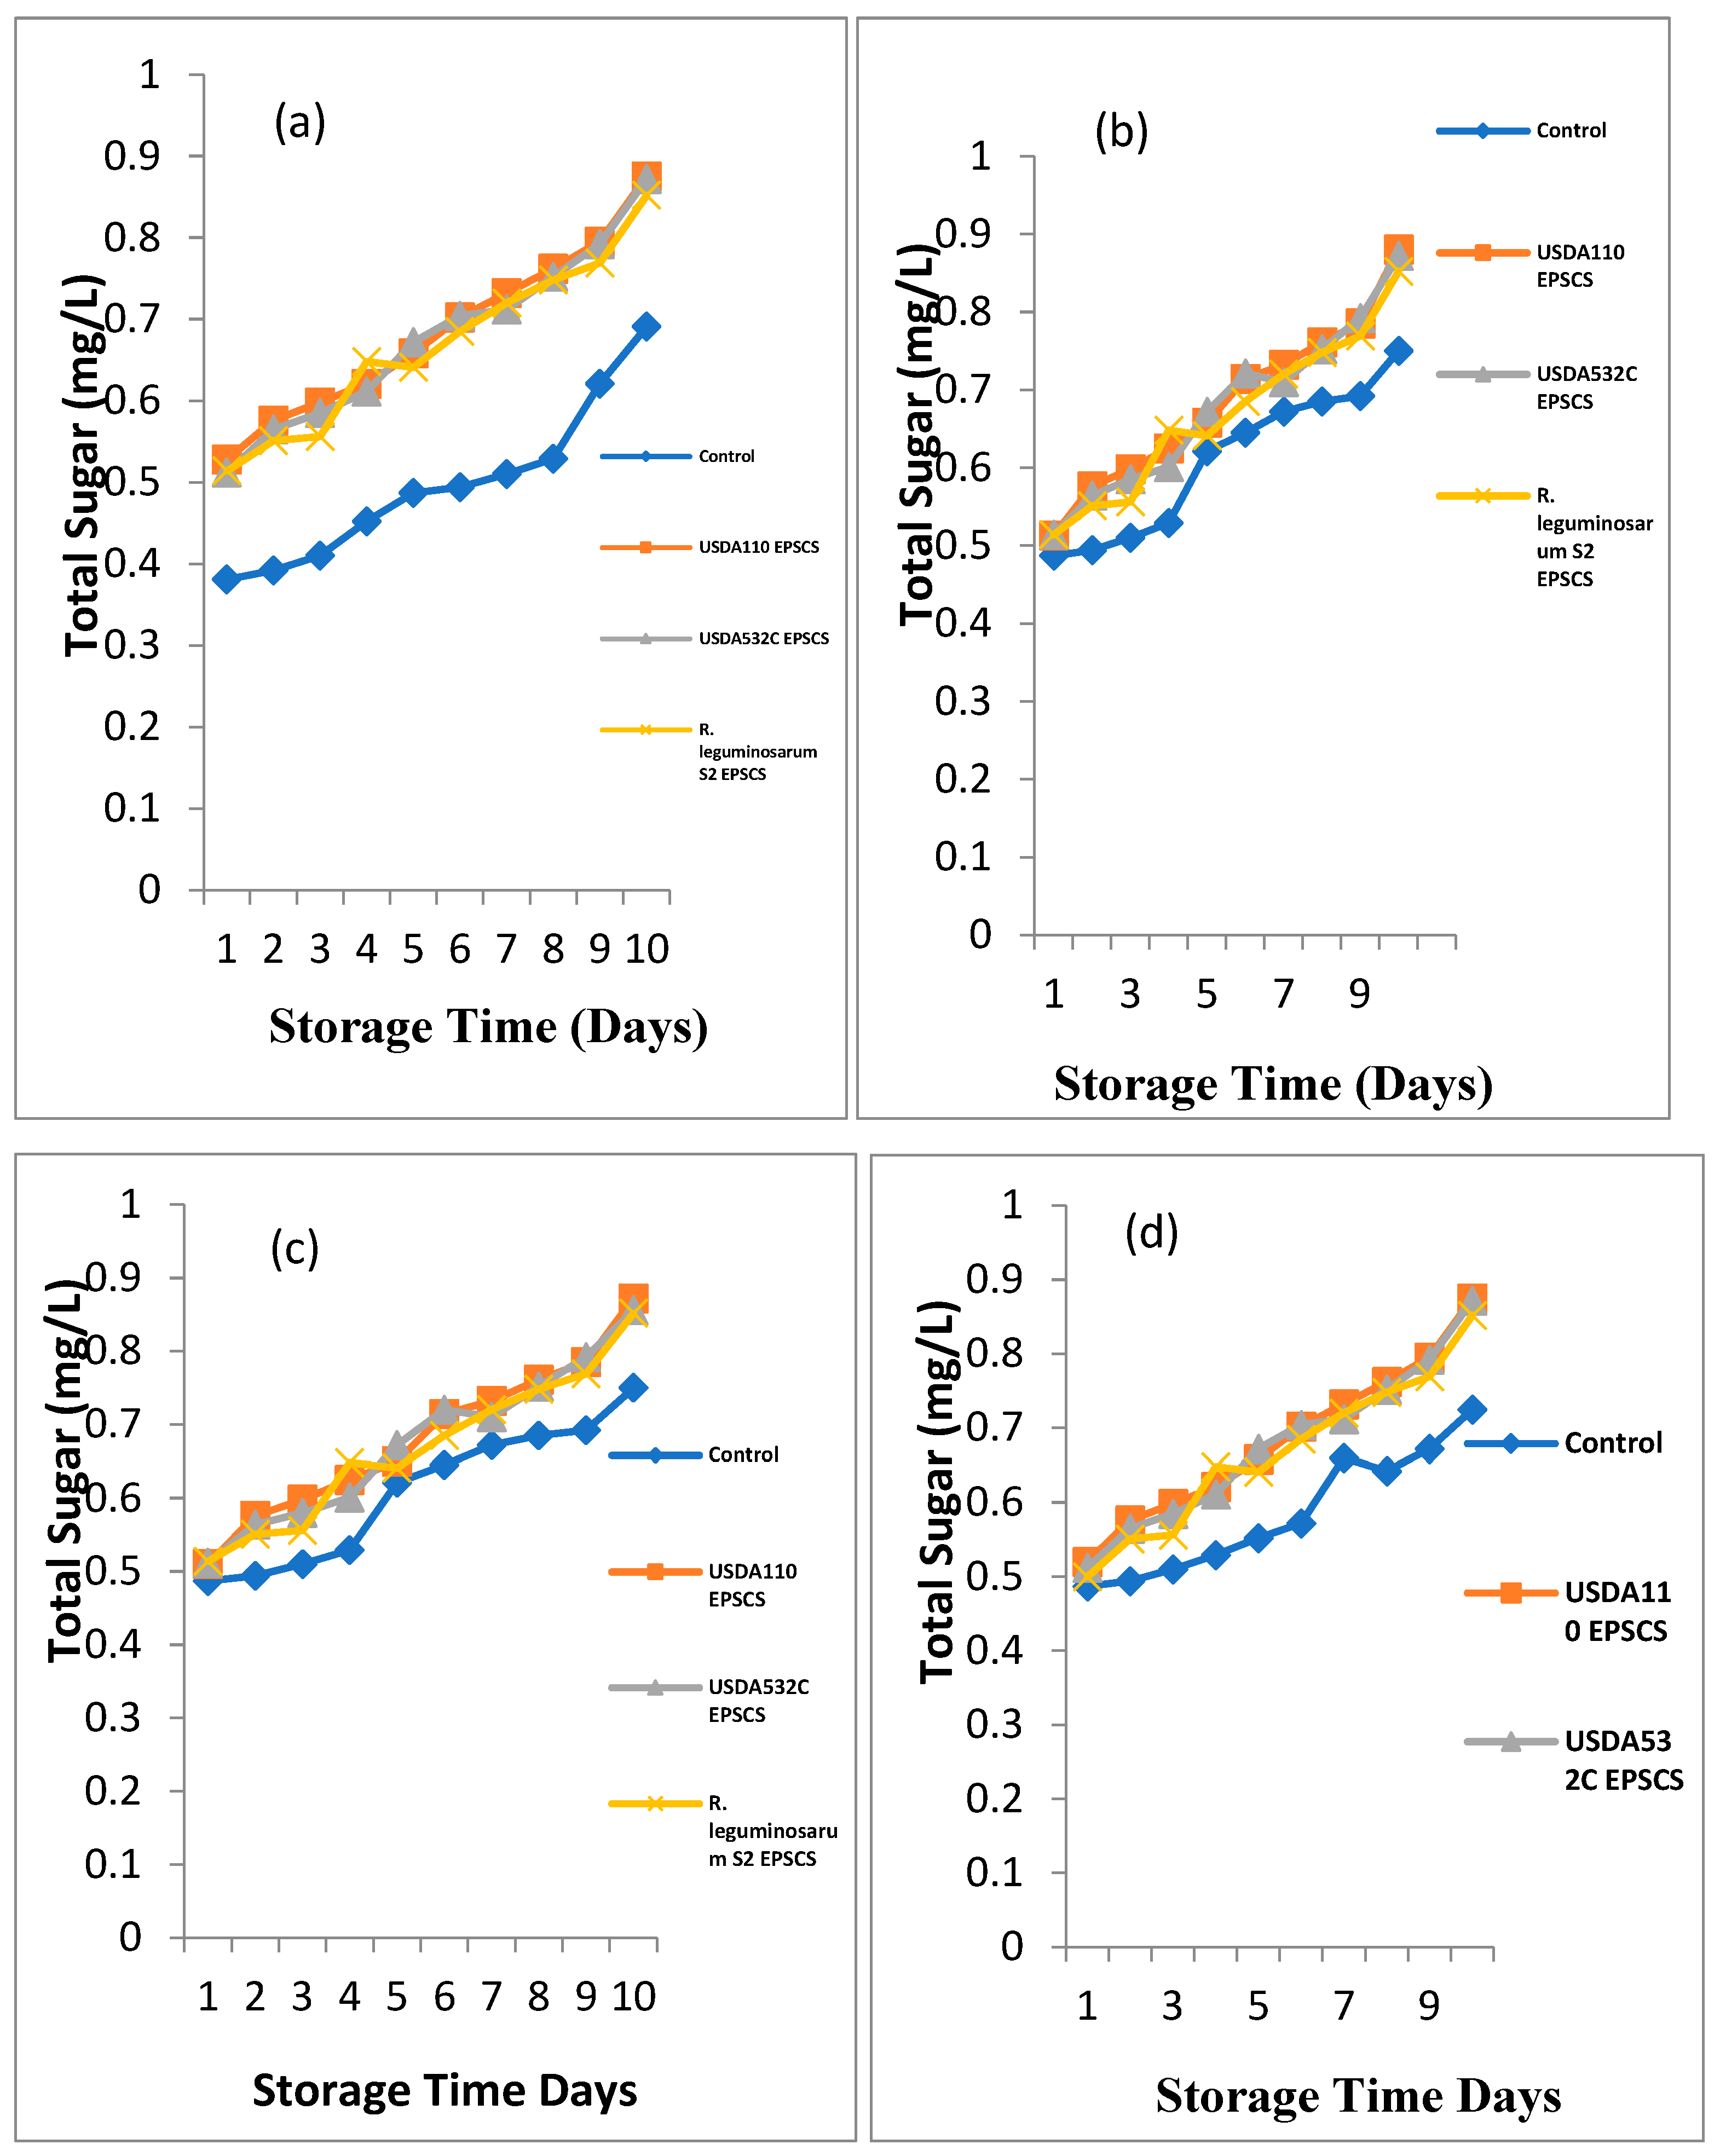
Effect of Rhizobial EPS coating on total sugar of Musa paradisiaca (Plantain), Musa sp. (Apple Banana), Musa acuminata (Lady Finger) and Musa balbisiana (Cooking Banana) during storage is shown in Figure 3a - d. For Musa paradisiaca (Plantain), a major difference (P≤0.05) on the outcome of Rhizobial EPS coating on the total sugar of M. paradisiaca (Plantain) during storage as shown in Figure 3a. The total sugar was from 0.381 – 0.528mg/L, 0.392 – 0.576 mg/L and 0.41 – 0.598 mg/L at days 1, 2 and 3 respectively. The highest total sugar was recorded in EPSACMP while the UNCMP had the least total sugar. At day 4 of storage, total sugar was from 0.529 – 0.648 mg/L. The highest total sugar was recorded in EPSCCMP while the UNCMP had the least total sugar. The total sugar ranged from 0.621 – 0.672 mg/L and 0.645 – 0.721 mg/L at day 5 and 6 of storage. EPSBCMP had the highest total sugar while least total sugar was obtained from UNCMP. At day 7 and 8, the total sugar ranged from 0.672 – 0.732 mg/Land 0.685 – 0.761 mg/L. The highest total sugar was recorded in EPSACM while the least was obtained from UNCMP. At day 9 of storage, the total sugar was from 0.692 – 0.792 mg/L. The maximum total sugar was recorded in EPSBCMP while the least was observed in UNCMP. The total sugar ranged from 0.75 – 0.88 mg/Lat the 10th day of storage. The maximum total sugar was recorded in EPSACMP followed in order by EPSBCMP while the least was recorded in UNCMP.
Effect of Rhizobial EPS coating on total sugar of Musa sp. (Apple Banana) during storage at room temperature is illustrated in Figure 3b. A major difference (P≤0.05) on the outcome of Rhizobial EPS on total sugar of Musa sp. (Apple Banana) during storage was noticed. The total sugar of EPSCMS was from 0.487– 0.514 mg/L at the 1st day. The maximum total sugar was recorded in EPSACMS and EPSCCMS while the UNCMS had the least total sugar. At day 2 and 3 of storage, total sugar was from 0.494 – 0.576 mg/L and 0.51 – 0.598 mg/L. The highest on total sugar was recorded EPSACMS follow in order by EPSBCMS while the UNCMS had the least. The total sugar of EPSCMS ranged from 0.529 – 0.648 mg/L at day 4 of storage. The highest total sugar was recorded in EPSCCMS followed in order by EPSACMS while the UNCMS had the least total sugar. At day 5 and 6 of storage, the total sugar was from 0.621 – 0.658 mg/L, 0.645 – 0.721mg/L. The highest total sugar was recorded in EPSBCMS while the UNCMS had the least total sugar. At day 7 and 8 of storage, the total sugar ranged from 0.672 – 0.732 mg/L and 0.672 – 0.761mg/L. The highest total sugar was EPSACMS while the UNCMS had the least total sugar. The total sugar ranged from 0.692 – 0.792 mg/L at day 9 of storage. The highest total sugar was recorded in EPSBCMS while the UNCMS had the least total sugar. At day 10 of storage, the total sugar ranged from 0.75 – 0.88 mg/L. The highest total sugar was seen in EPSACMS while UNCMS had the least total sugar.
Effect of Rhizobial EPS coating on total sugar of Musa acuminata (Lady Finger) during storage at room temperature is depicted in Figure 3c. A major difference (P≤0.05) on the effect of Rhizobial EPS coating on the total sugar of Musa acuminata (Lady Finger) during storage was noticed. The total sugar ranged from 0.487 – 0.514 mg/L at day 1 of storage. The highest total sugar was recorded in EPSCCMA while the UNCMA had the least total sugar. At day 2 and day 3 of storage, the total sugar was from 0.494 – 576 mg/L and 0.51 – 0.598 mg/L. The maximum total sugar was recorded in EPSACMA while the UNCMA had the least. The total sugar was from 0.529 – 0.648 mg/L at the day 4 of storage. The utmost total sugar was recorded in EPSCCMA while the UNCMA had the least total sugar. At day 5 of storage, the total sugar ranged from 0.621 – 0.672 mg/L. The highest total sugar was obtained from EPSBCMA while the UNCMA had the least. The total sugar was from 0.645 – 0.714 mg/L, 0.672 – 0.732 mg/L and 0.685 – 0.761 mg/Lat the day 6, 7 and 8 of storage. The maximum total sugar was recorded in EPSACMA while the UNCMA had the least total sugar. At day 9 of storage, the total sugar was from 0.692 – 0.792 mg/L. The highest total sugar was recorded in EPSBCMA while UNCMA had the least. At day 10 of storage, the total sugar was from 0.75 – 0.872 mg/L. The highest total sugar was recorded in EPSACMA as UNCMA had the least.
Effect of Rhizobial EPS coating on total sugar of Musa balbisiana (Cooking Banana) during storage is depicted in Figure 3d. Significant difference (P≤0.05) on the outcome of Rhizobial EPS coating on the total sugar of Musa balbisiana (Cooking Banana) during storage at room temperature was noticed. The total sugar was from 0.487 – 0.512 mg/L at day 1 of storage. The highest total sugar was recorded in EPSACMB while the UNCMB had the least total sugar. At day 2 and day 3 of storage, the total sugar ranged from 0.494 – 576 mg/L and 0.51 – 0.598 mg/L. The highest total sugar was recorded in EPSACMB while the UNCMB had the least. The total sugar ranged from 0.529 – 0.648 mg/L at day 4 of storage. The utmost total sugar was recorded in EPSCCMB while the UNC had the least total sugar. The total sugar ranged from 0.552 – 0.67 mg/L, 0.572 – 0.704 mg/L, 0.66 – 0.718 mg/L, 0.642 – 0.742 mg/L, 0.672 – 0.789 mg/L and 0.725 – 0.879 mg/L at day 5, 6, 7, 8, 9 and 10 of storage. The highest total sugar was recorded in EPSBCMB while UNCMB had the least total sugar.
Figure 3.
a-d. Biopreservative Effect of Rhizobial EPS coating on Total Sugar of (a) Musa paradisiaca (Plantain) (b) Musa sp (Apple Banana) (c) Musa acuminata (Lady Finger) (d) Musa balbisiana (Cooking Banana) during storage.
Figure 3.
a-d. Biopreservative Effect of Rhizobial EPS coating on Total Sugar of (a) Musa paradisiaca (Plantain) (b) Musa sp (Apple Banana) (c) Musa acuminata (Lady Finger) (d) Musa balbisiana (Cooking Banana) during storage.
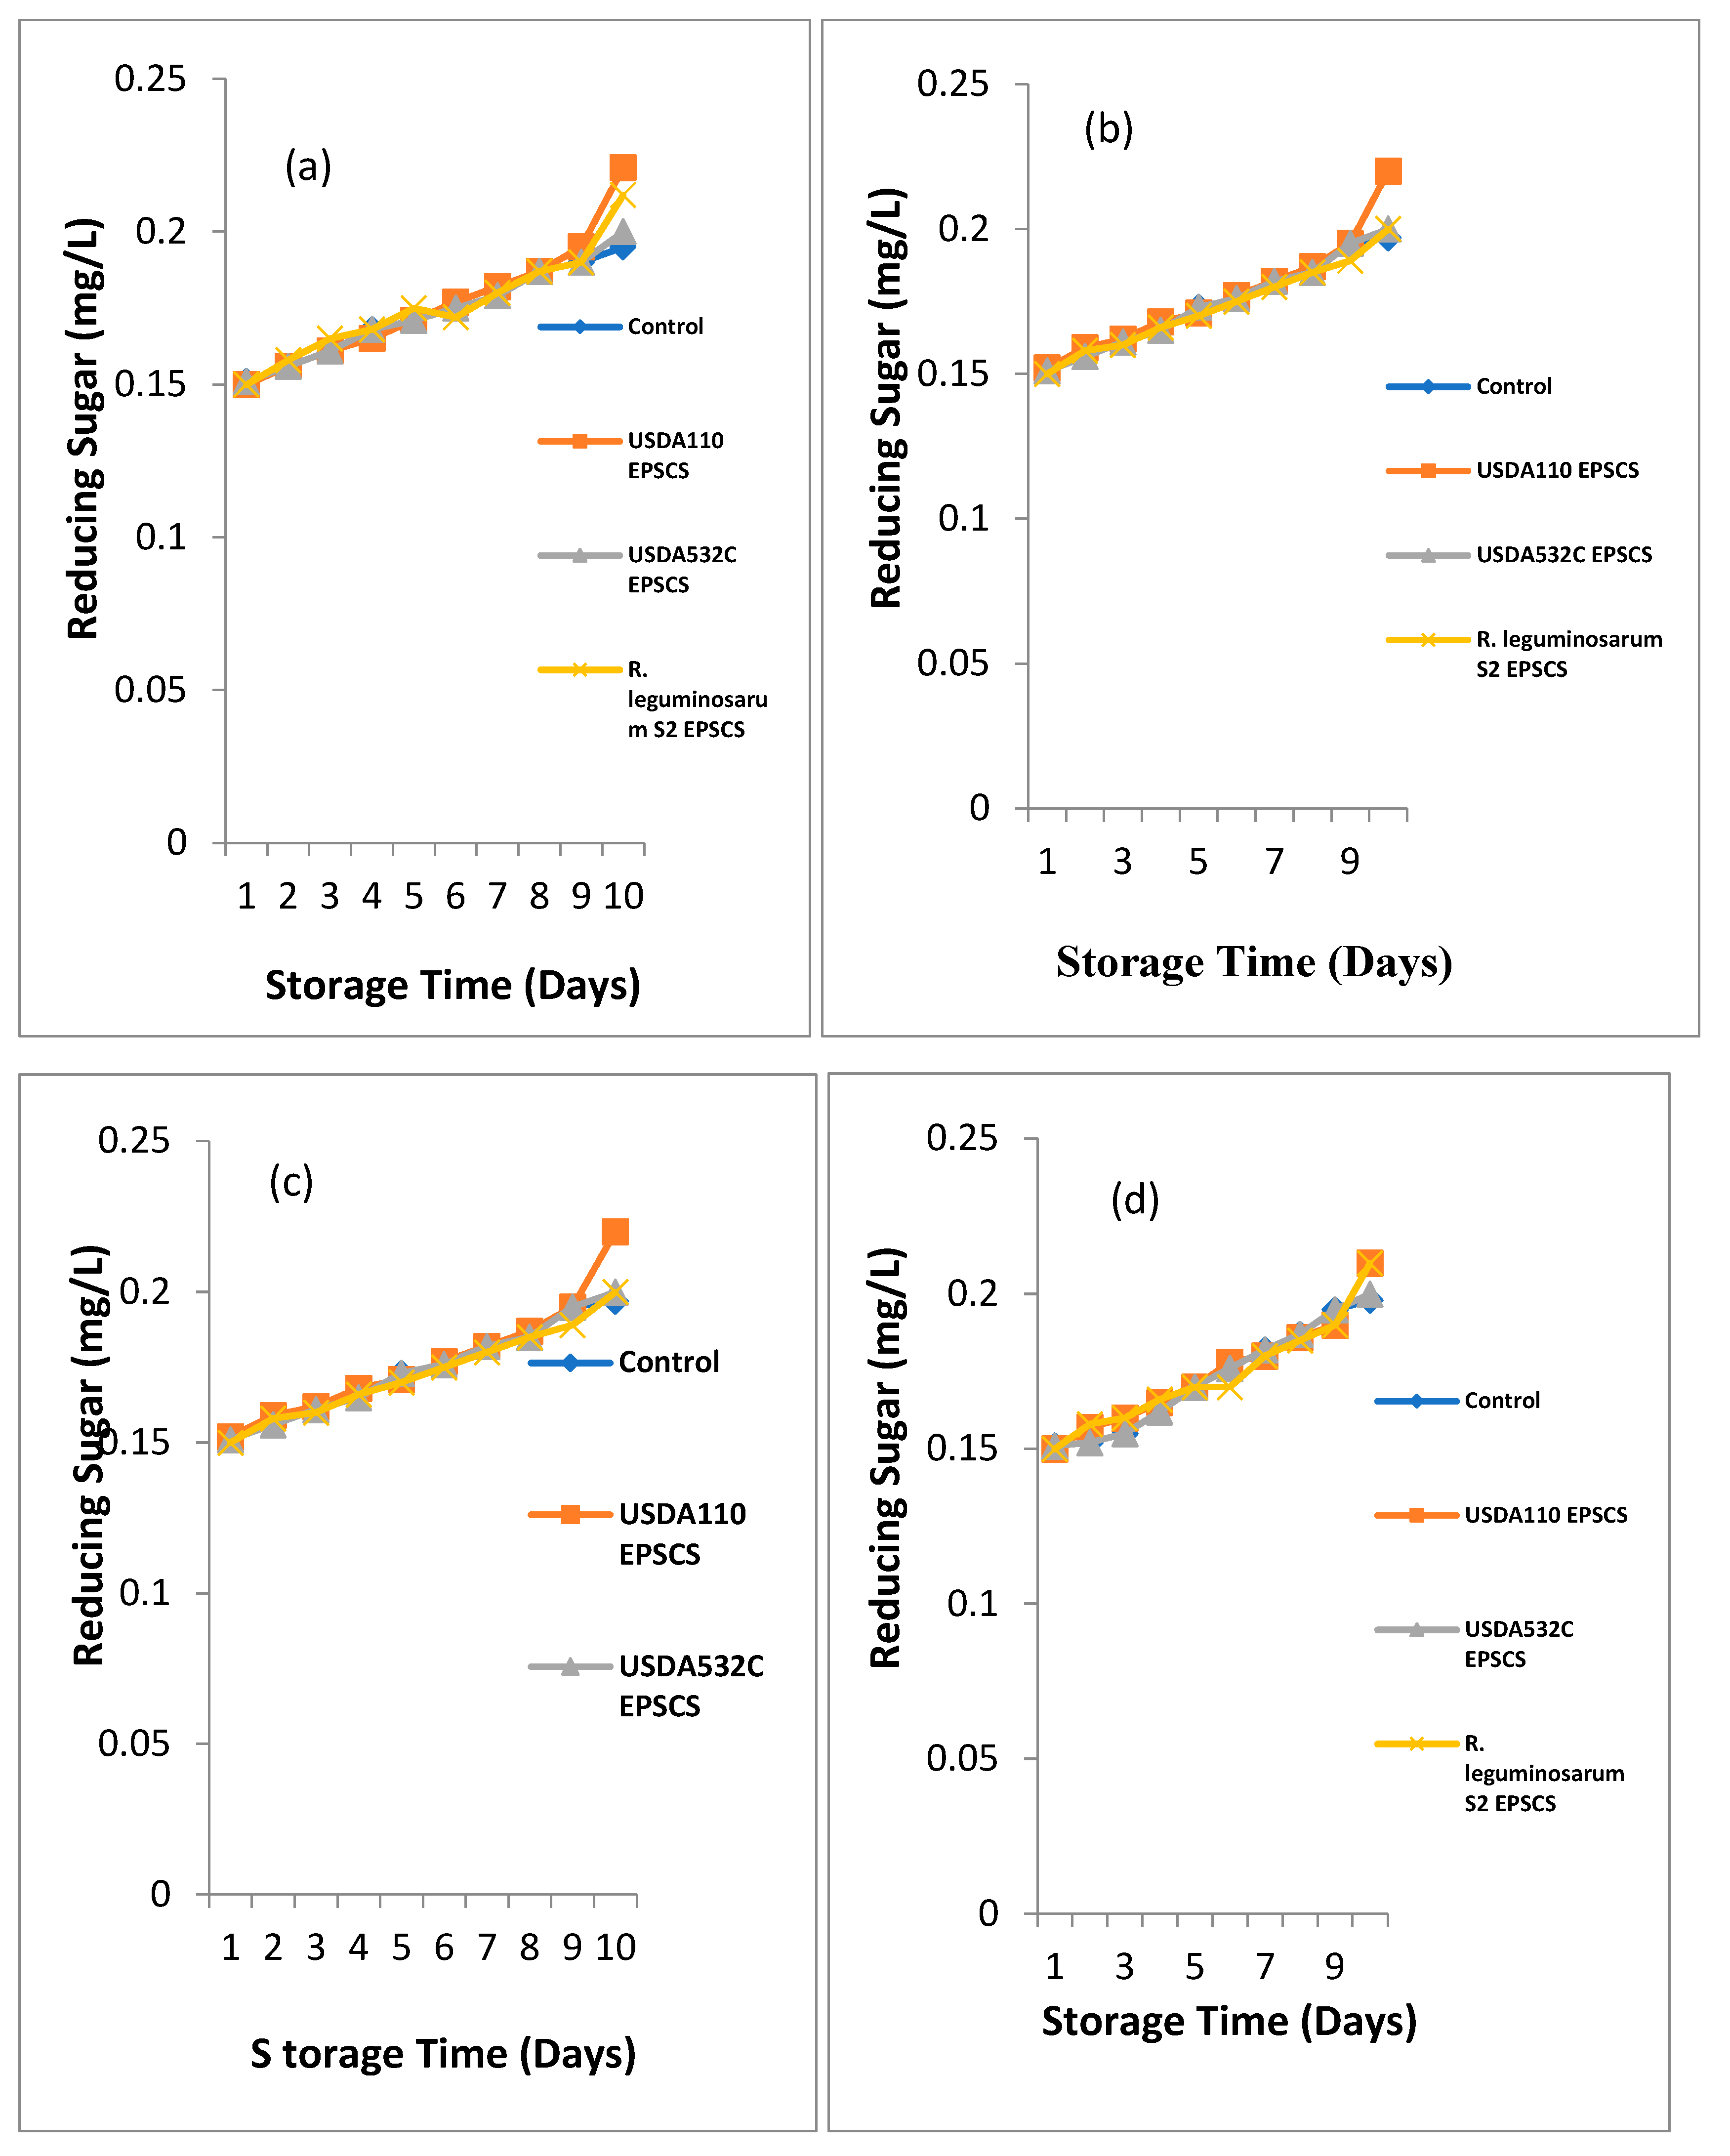
Effect of Rhizobial EPS coating on reducing sugar of Musa paradisiaca (Plantain), Musa sp. (Apple Banana), Musa acuminata (Lady Finger) and Musa balbisiana (Cooking Banana) during storage at room temperature is illustrated in Figure 4a - d.
Effect of Rhizobia EPS coating on reducing sugar of Musa paradisiaca (Plantain) during storage at room temperature is shown in Figure 4a. Major difference (P≤0.05) was seen on the effect of Rhizobia EPS coating on the reducing sugar of Musa paradisiaca (Plantain) during storage. The reducing sugar was from 0.15 – 0.151 mg/L at the 1st day of storage. EPSBCMP had the highest while EPSACMP, EPSCCMP and UNCMP had the least reducing sugar. At day 2 of storage, the reducing sugar was from 0.156 – 0.159 mg/L and 0.16 – 0.162 mg/L. The highest reducing sugar recorded in EPSACMP while UNCMP had the least. At day 3 of storage, the reducing sugar ranged from 0.16 – 0.162 mg/L. The highest reducing sugar was recorded in EPSACMP while the least reducing sugar was recorded in UNCMP and EPSCCMP. At day 4 of storage, the reducing sugar was from 0.166 – 0.168 mg/L. The highest reducing sugar was observed in EPSACMP which was not significantly different from EPSBCMP and UNCMP while the least reducing sugar was obtained from EPSCCMP. At day 5 of storage, the reducing sugar ranged from 0.17 – 0.171 mg/L. EPSACMP and EPSBCMP had the highest reducing sugar while EPSCCMP and the UNCMP had the least was reducing sugar. At day 6 of storage, the reducing sugar ranged from 0.178 – 0.182 mg/L. EPSACMP had the highest reducing sugar while the UNCMP had the least reducing sugar. The reducing sugar ranged from 0.178 – 0.182 mg/L and 0.19 – 0.187 mg/L at 7 and 8 days of storage. EPSACMP and EPSBCMP had the highest reducing sugar while UNCMP had the least reducing sugar. The reducing sugar ranged from 0.19 – 0.2 mg/L at the day 9 of storage. EPSBCMP and EPSCCMP had the highest reducing sugar while UNCMP was observed with the least reducing sugar. At day 10 of storage, the reducing sugar ranged from 0.195 – 0.22 mg/L. EPSACMP and EPSCCMP had the highest reducing sugar while UNCMP had the least reducing sugar.
Effect of Rhizobial EPS covering on reducing sugar of Musasp (Apple Banana) during storage is depicted in Figure 4b. A major difference (P≤0.05) was seen on the effect of Rhizobial EPS covering on the reducing sugar of Musasp (Apple Banana) during storage at 28 oC. At day 1 of storage, the reducing sugar ranged from 0.15 – 0.151 mg/L. UNCMS and EPSBCMS had the highest while EPSACMS and EPSCCMS had the least reducing sugar. At day 2 and 3 of storage, the reducing sugar ranged from 0.156 – 0.158 mg/L and 0.161 – 0.165 mg/L. The maximum reducing sugar was recorded in EPSCCM while UNCMS, EPSACMS and EPSCCMS had the least. At day 4 of storage, the reducing sugar ranged from 0.165 – 0.168 mg/L. The highest reducing sugar was observed in the UNCMS, EPSBCMS and EPSCCMS while the least was obtained from samples coated with EPSACMS. At day 5 of storage, the reducing sugar ranged from 0.171 – 0.75 mg/L. The maximum reducing sugar was recorded in EPSCCMS while the least reducing sugar was recorded in UNCMS which was not significantly different (P ≥ 0.05) from EPSACMS and EPSBCMS. At day 6 of storage, the reducing sugar ranged from 0.173 – 0.77 mg/L. The highest reducing sugar was recorded in EPSCCMS while the least reducing sugar was recorded in UNCMS. At day 7, 8, 9 and 10 of storage, the reducing sugar ranged from 0.1735– 0.182 mg/L, 0.179 – 0.18 mg/L, 0.182 – 0.19 mg/Land 0.189 – 0.212 mg/L. The highest reducing sugar was recorded in EPSCCMS while the least reducing sugar was recorded in UNCMS.
Effect of Rhizobial EPS coating on reducing sugar of Musa acuminata (Lady Finger) during storage is depicted in Figure 4.21c. A major difference (P≤0.05) was noticed on the outcome of Rhizobial EPS coating on the reducing sugar of Musa acuminata (Lady Finger) during storage at room temperature. At day 1 of storage, the reducing sugar ranged from 0.15 – 0.152 mg/L. The highest reducing sugar was recorded in EPSACMA while the UNCMA, EPSBCMA and EPSCCMA had the least. At day 2, 3, 4, 5, 6 and 7of storage, the reducing sugar ranged from 0.156– 0.159 mg/L, 0.161 – 0.164 mg/L, 0.163 – 0.168 mg/L, 0.168 – 0.172 and 0.17 – 0.177, 0.175 – 0.183. The highest reducing sugar was recorded in EPSCCMA while the least reducing sugar was recorded in UNCMA. The reducing sugar ranged from 0.18 – 0.185 mg/L at day 8 of storage. The highest reducing sugar was recorded in EPSACMA which was not significantly higher than EPSBCMA and EPSCCMA while the least reducing sugar was recorded in the UNCMA. At day 9 and 10 of storage, the reducing sugar was from 0.187 – 0.193 mg/L and 0.189 – 0.21 mg/L. The highest reducing sugar was recorded in EPSCCMA while the least reducing sugar was recorded in UNCMA.
Effect of Rhizobial EPS covering on reducing sugar of Musa balbisiana (Cooking Banana) during storage is depicted in Figure 4d. A major difference (P≤0.05) was noticed on the effect of Rhizobia EPS covering on the reducing sugar of Musa balbisiana (Cooking Banana) during storage at room temperature. The reducing sugar ranged from 0.15 – 0.151 mg/L at the 1st day of storage. EPSBCMB had the highest while EPSACMB had the least reducing sugar. At day 2, 3, 4, 5, 6, 7, 8, 9 and 10 of storage, the reducing sugar ranged from 0.152 – 0.158 mg/L, 0.155 – 0.162 mg/L, 0.162 – 0.166 mg/L, 0.17 – 0.173 mg/L, 0.174 – 0.178 mg/L, 0.178 – 0.184 mg/L, 0.18 – 0.187 mg/L, 0.183 – 0.196 mg/L and 0.186 – 0.21 mg/L. EPSCCMB had the highest reducing sugar while the least was recorded in UNCMB.
Figure 4.
a-d. Biopreservative Effect of Rhizobial EPS coating on Reducing Sugar of (a) Musa paradisiaca (Plantain) (b) Musa sp (Apple Banana) (c) Musa acuminata (Lady Finger) (d) Musa balbisiana (Cooking Banana) during storage.
Figure 4.
a-d. Biopreservative Effect of Rhizobial EPS coating on Reducing Sugar of (a) Musa paradisiaca (Plantain) (b) Musa sp (Apple Banana) (c) Musa acuminata (Lady Finger) (d) Musa balbisiana (Cooking Banana) during storage.
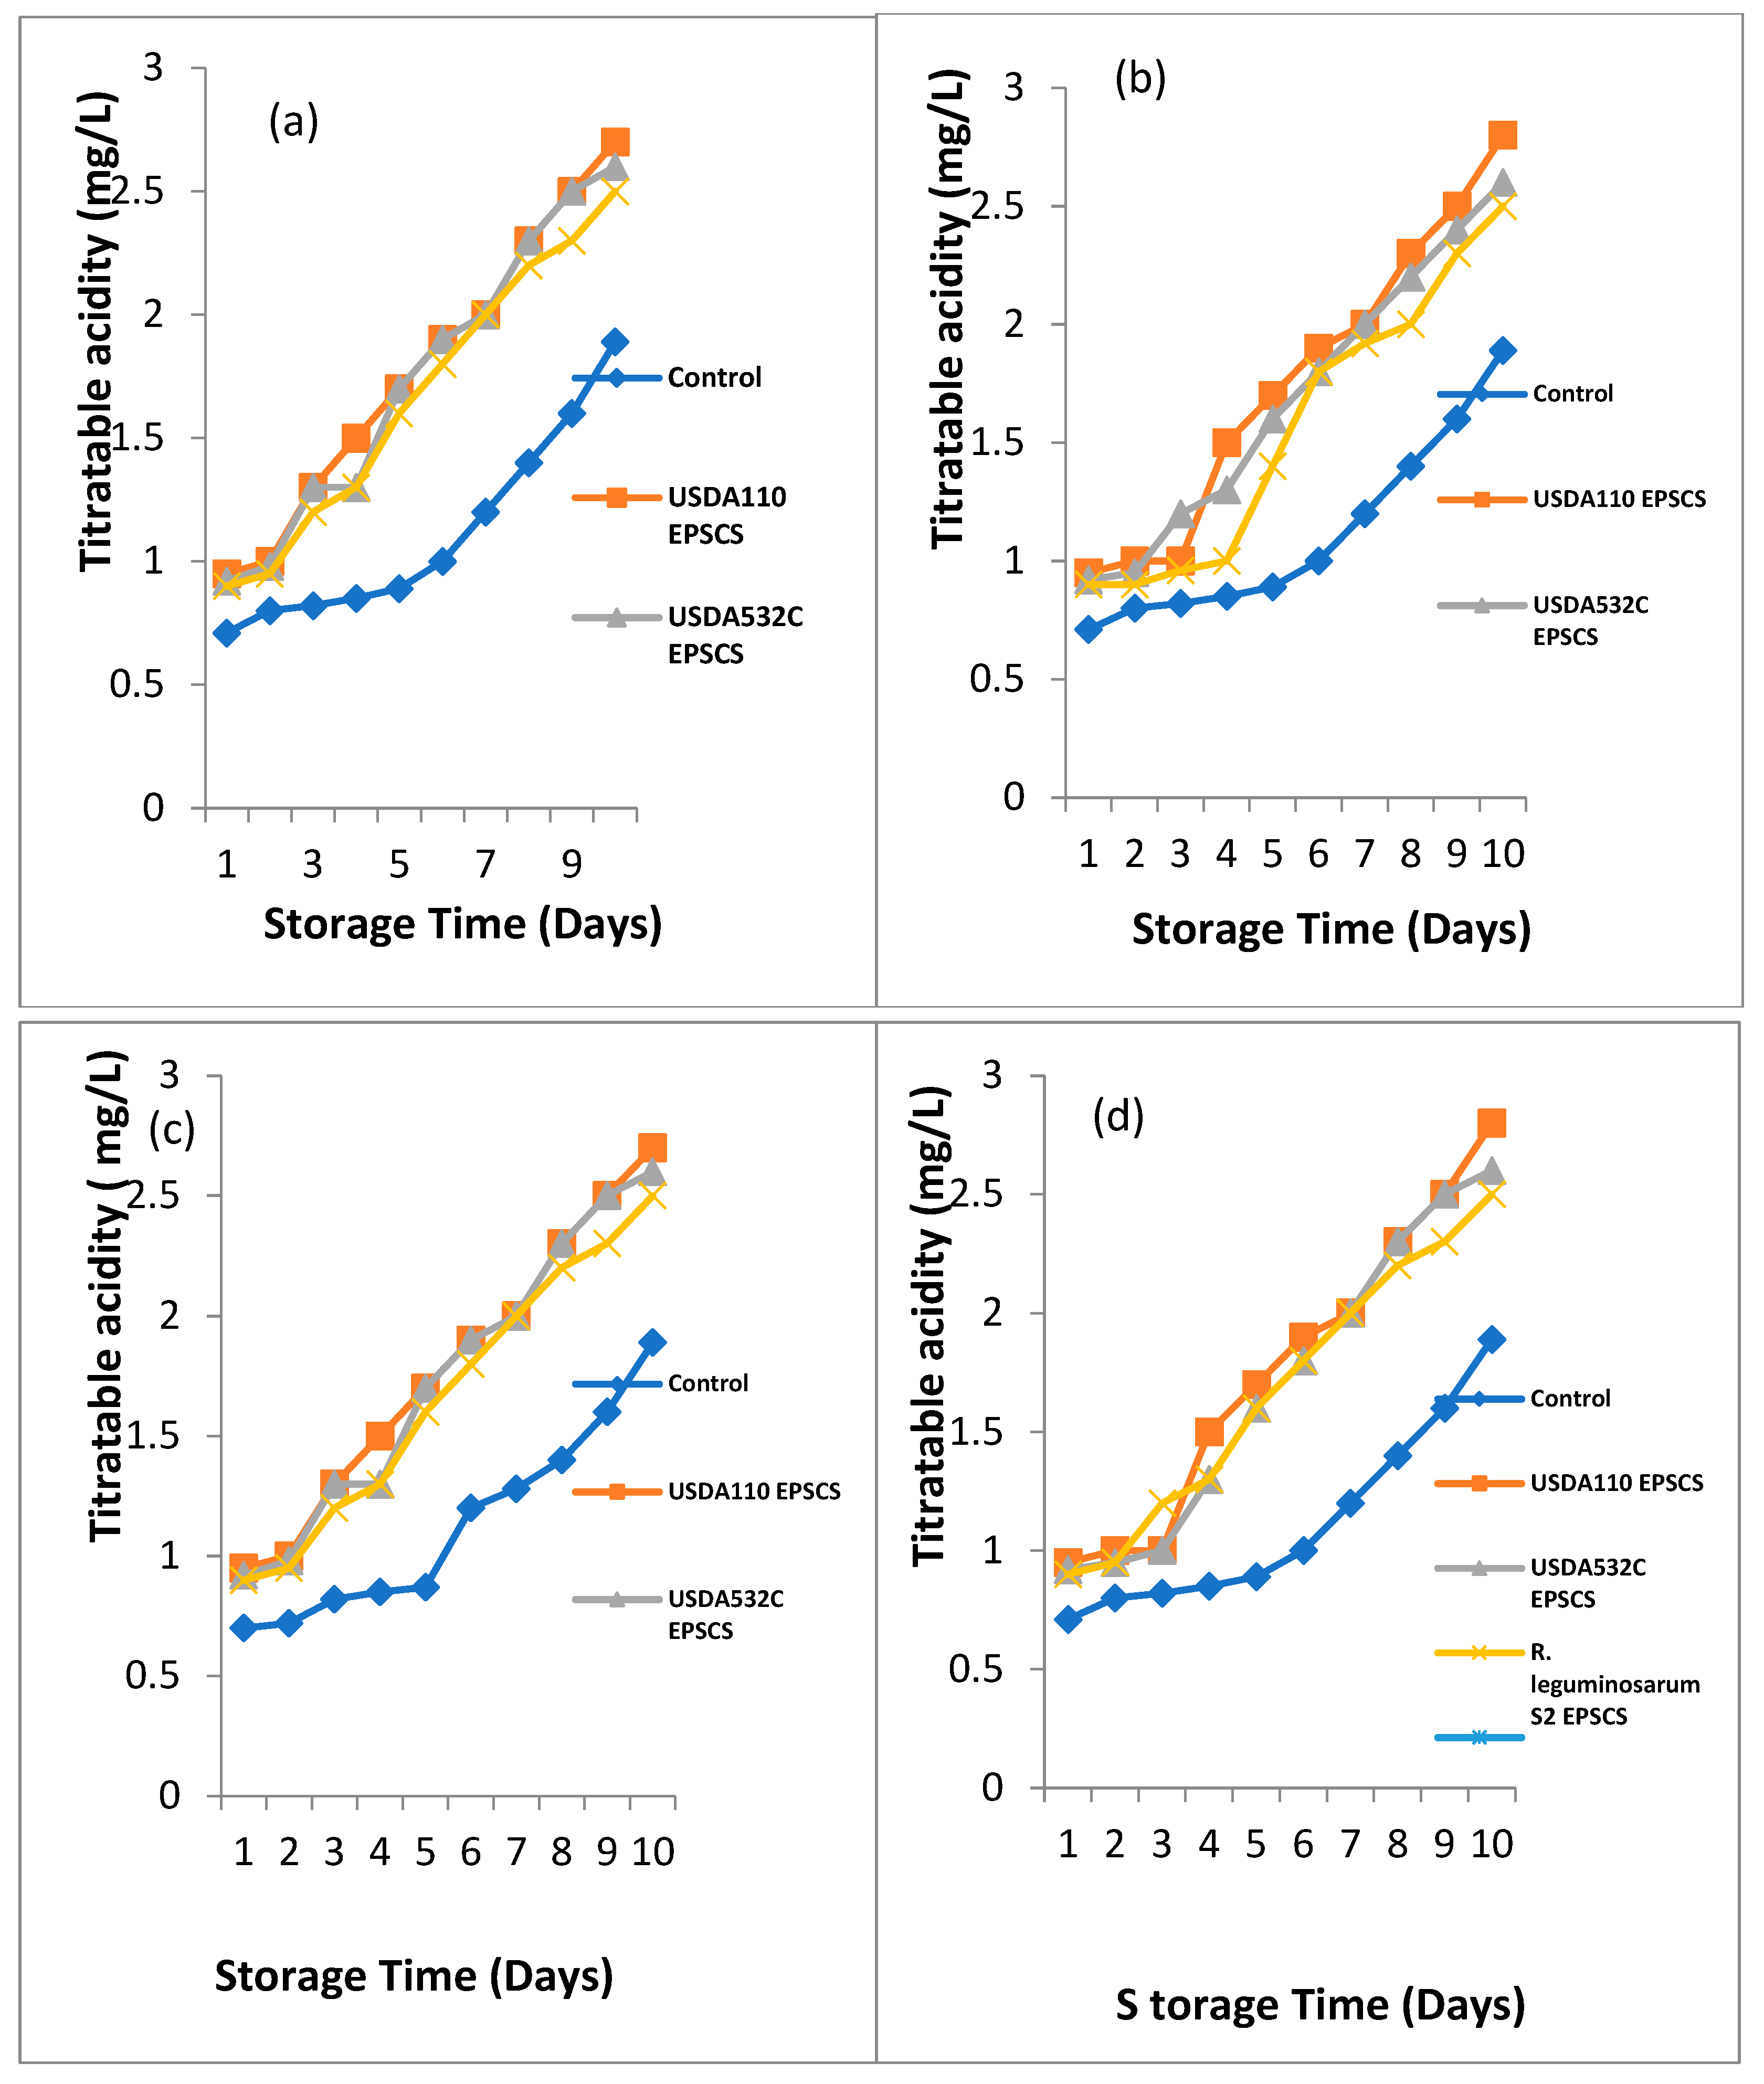
Effect of Rhizobial EPS coating on titratable acidity of Musa paradisiaca (Plantain), Musa sp. (Apple Banana), Musa acuminata (Lady Finger) and Musa balbisiana (Cooking Banana) during storage at room temperature is shown in Figure 5a - d.
Effect of Rhizobial EPS coating on titratable acidity of Musa paradisiaca (Plantain) during storage is illustrated in Figure 5a. A major difference (P≤0.05) on outcome of Rhizobial EPS covering on the titratable acidity of Musa paradisiaca (Plantain) during storage. At day 1and 2 of storage, the titratable acidity ranged from 0.71 – 0.95 mg/L and 0.8 – 1 mg/L. The highest titratable acidity was observed in EPSACMP follow in order by EPSBCMP while UNCCMP had the least titratable acidity. At day 3 of storage, the titratable acidity ranged from 0.82 – 1.3 mg/L. EPSACMP and EPSBCMP had the highest titratable acidity while UNCMP had the least.
Titratable acidity ranged from 0.82 – 1.3 mg/L at day 4 of storage. The highest Titratable acidity was recorded in EPSACMP followed in order by EPSBCMP and EPSCCMP while UNCMP had the least titratable acidity. Titratable acidity ranged from 0.89 – 1.7 mg/L, 1 -1.9 mg/L, 1.2 – 2 mg/L, 1.4 – 2.3 mg/L and 1.6 – 2.5 mg/L at day 5, 6, 7, 8, and 9 of storage. The highest titratable acidity was recorded in EPSACMP and EPSBCMP followed in order by EPSCCMP while the UNCMP had the least titratable acidity. At day 10 of storage, titratable acidity ranged from1.89 – 2.7 mg/L. The highest Titratable acidity was observed in EPSACMP followed in order by EPSBCMP while UNCMP had the least titratable acidity.
Effect of Rhizobial EPS covering on titratable acidity of Musasp (Apple Banana) during storage is depicted in Figure 5b. A major difference (P≤0.05) was noticed on the effect of Rhizobial EPS coating on the Titratable acidity during storage. At day 1, 2 and 3 of storage, the titratable acidity ranged from 0.71 – 0.92 mg/L and 0.79 – 1 mg/L and 0.81 – 1 mg/L. The highest Titratable acidity was observed in EPSACMS followed in order by EPSBCMS while the least Titratable acidity was recorded in the UNCMS. At day 4 and 5 of storage, the titratable acidity ranged from0.85 -1.5 mg/L and 0.89 – 1.5 mg/L. EPSACMS had the highest titratable acidity while the least was obtained from the UNCMS samples. At day 6 and 7 of storage, the titratable acidity ranged from 1 -1.9 mg/L and 1.2 – 2 mg/L. EPSACMS had the highest titratable acidity followed in order by EPSBCMS while the least was obtained from UNCMS. The titratable acidity ranged from 1.4 – 2.3 mg/L, 1.6 – 2.5 mg/L and 1.89 – 2.8 mg/L at day 8, 9 and 10. EPSACMS and EPSBCMS had the highest Titratable acidity while the UNCMS sample had the least.
Effect of Rhizobial EPS covering on titratable acidity of Musa balbisiana (Cooking Banana) during storage is depicted in Figure 5d. A major difference (P≤0.05) was seen on the effect of Rhizobia EPS covering on the Titratable acidity of Musa balbisiana (Cooking Banana) during storage. At day 1, 2 and 3 of storage, the titratable acidity ranged from 0.71 – 0.95 mg/L, 0.8 – 1 mg/L and 0.82 – 1 mg/L. The highest Titratable acidity was observed in EPSACMB while the least Titratable acidity was recorded in UNCMB. At day 4, 5 and 6 of storage, the titratable acidity ranged from 0.85 -1.5 mg/L and 0.89 – 1.6 mg/L. The highest Titratable acidity was observed in EPSACMB follow in order by EPSCCMB while the least Titratable acidity was recorded in UNCMB. The Titratable acidity ranged from 1.2 – 2 mg/L at day 7 of storage. The highest Titratable acidity was observed in EPSACMB, EPSBCMB and EPSCCMB. At day 8 and 9 of storage, the titratable acidity ranged from 1.4 – 2.3 mg/L, 1.6 – 2.5 mg/L. The highest Titratable acidity was observed in EPSACMB and EPSBCMB while UNCMB sample had the least. At day 10 of storage, the titratable acidity ranged from 1.89 – 2.8 mg/L. The highest Titratable acidity was observed in EPSACMB follow in order by EPSBCMB while the least Titratable acidity was recorded in UNCMB.
Figure 5.
a-d. Biopreservative Effect of Rhizobial EPS coating on Titratable acidity of (a) Musa paradisiaca (Plantain) (b) Musa sp (Apple Banana) (c) Musa acuminata (Lady Finger) (d) Musa balbisiana (Cooking Banana) during storage.
Figure 5.
a-d. Biopreservative Effect of Rhizobial EPS coating on Titratable acidity of (a) Musa paradisiaca (Plantain) (b) Musa sp (Apple Banana) (c) Musa acuminata (Lady Finger) (d) Musa balbisiana (Cooking Banana) during storage.
4.0. DISCUSSION
Characterisation of EPS using FT-IR: FT-IR spectroscope is a valuable procedure that works on the standard that group of bonds vibrates at characteristic frequencies. It can be employed to identify functional groups and characterizing covalent bonding. Characterisation of EPS from Rhizobia using FT-IR showed the existence of functional groups such as hydroxyl, alkane, alkene, alkyl and amine group as well as stretches of C=O of alcohol group in the EPS. The presence of this band shows that the substance is a polysaccharide [13]. Lack of peaks in the range of 260- 290cm-1obviously shows the lack of any protein and nucleic acids. The EPS contain large number of H-O stretching frequency with a broad absorption peak of 3539, 3395, 3538.66, 3537.11, 3537.09, 3389.58, 3416.92 and 3633.33cm-1. The bands of some stretching vibration of carboxyl group (C=O) were seen and were due to associated water which indicates the presence of some organic substances such as the stretching of sugar (mannose or galactose) [14]. The relatively weak absorption peaks at 888.59, 883.82, 838.22, 839.61, 872.44, 887.08, 888.59 and 892.49 cm-1 might be ascribed to C=C (alkene). Furthermore, the bands within 776.22 – 601.91 cm-1 regions were assigned to the vibration of the C-H and C-I halo bands.
Characterisation of EPS using TGA: Thermal stability is a vital feature to consider for industrial use of EPS, particularly in food industry, because most food manufacturing and processing takes place at elevated temperatures [15]. According to Sri et al. [16] when EPS is subjected to diverse temperatures, the major measures that take place with the initial boost in temperature are gelatinization and swelling. Additional increase in temperature causes drying out and pyrolysis of the exopolysaccharide. The TGA of the EPS shows two stages of weight loss which occurred around 286.46 and 487.94, 262.32 and 498.9, 227 and 547.4, 244.45 and 394.24 and 268.68 and 494.75oC. The large weight loss may be attributed to the breakdown of carbon. This primary weight loss may be related with the loss of moisture. Many reports recommended that initial loss of moisture is due to the carboxyl groups which are present in high level and are bound to water molecules [17]. Thus, the initial weight loss by EPS produced by the Rhizobial strains is due to the existence of elevated content of carboxyl groups. The difference between the degradation temperature values of various EPSs is ascribed to their varied structural composition.
Characterisation of EPS using GC-MS: GC-MS has been used to categorize the constituent volatile matter, long chain, branched chain hydrocarbons, alcohols, acids and esters [18]. The GC-MS chromatogram of all the EPS tested revealed the presence of some active compounds (pentadecanoic acid, octadecanoic acid, oleic acid and heptacosanoic acid).
Determination of monosaccharides constituent of Rhizobial EPS via HPLC: D-ribose had the highest concentration in the EPS produced from USDA 110 (EPSA) while rhamnose was observed to be the highest in USDA 532C (EPSB) and Rhizobium leguminosarumS2 EPS (EPSC) Mannose and arabinose had the least sugar concentration in USDA 110 and USDA 532C respectively. The sugar concentration varied when all the Rhizobial EPS were compared. Sugars such as rhamnose, arabinose, mannose, glucose and galactose were present in all the EPS samples with different concentration. D-ribose, xylose and Inositol was present in USDA 110 EPS. This work is in disparity with the results of Castellane et al. [10] who found that EPS obtained from Mesorhizobium huakuii, M. loti, M. plurifarium, Rhizobium giardinibv. Giardini, R. mongolense and Sinorhizobium (Ensifer) kostiense were primarily composed of glucose and galactose. Castellane et al [10] accounted that the EPSs from R. tropicis showed a related composition to rhizobia isolates, with glucose being the main sugar component accompanied by galactose and then glucuronic acid, rhamnose, and mannose, which were found in trace amounts. Numerous studies have reported that the EPS monosaccharide constituent may depend on the carbon source used for growth [19,20]. The complexities in their monosaccharide and non-carbohydrate compounds are responsible for their biotechnology properties which enable their potential use as gelling agents, emulsifiers [21,22], stabilizers, texture-enhancing agents and flocculation agents.
Effect of Rhizobial EPS coating on weight loss, pH, total sugar, reducing sugar and titratable acidity of Musa paradisiaca (Plantain), Musa sp (Apple Banana), Musa acuminata (Lady Finger) and Musa balbisiana (Cooking Banana) during storage was studied. Post-harvest spoilage is a main cost in food production and when polysaccharides based edible coverings are applied on fresh and minimally processed fruits and vegetables, by formation of a modified atmosphere condition help to trim down their respiratory rate. It’s enhanced mechanical handling property and additives carrying capacity [23]. In all the fruits preserved, the maximum weight loss was noticed in uncoated fruits (control) while the least weight loss was obtained in EPS coated fruits. The lowest pH was noticed in uncoated fruits while the highest pH was observed in covered fruit samples. The maximum titratable acidity was noticed in EPS coated fruits samples while the least titratable acidity was obtained in the non EPS coated fruit samples. The total sugar content steadily increased at day 10 of storage for both the covered and the uncovered fruit samples. The total sugar was noticed in EPS covered fruits samples while the least total sugar was obtained in the uncovered fruit samples. The outcome of EPS coating steadily increase the reducing sugar content among the fruits of the coated and the uncoated fruit samples. The rise in the reducing sugar with the advancement of ripening as well as storage time was due to derogation of starches. The utmost reducing sugar was observed in EPS coated fruits samples while the lowest reducing sugar was obtained in the uncoated fruit samples. In general, EPS coated fruits samples were observed to have longer shelf life than the uncoated samples.
Conclusion
Rhizobium genus used in this study, may be potential candidates for the development of products because they each displayed excellent coating ability and shelf life extension of Musa sp.
Author Contributions
Conceptualization: A.S.C., B.C.A. Data Curation: A.S.C., O.C.O. Methodology: A.S.C. and B.C.A. Formal Analysis: A.S.C. and O.C.O. Writing-Original Draft: A.S.C. Writing – Review and Editing: A.S.C., B.C.A. and O.C.O.
Funding
There was no grant for this work.
Institutional Review Board Statement
Not applicable.
Informed Consent Statement
Not applicable.
Data Availability Statement
All data used during the study are available from the author Akpaji Stephanie Clara by request (akpejistephanie@gmail.com).
Acknowledgments
The authors would like to thank the Department of Petroleum Engineering, University of Ibadan, Dr Olubusola A. Odeniyi, and Miss Ajayi Temitope.
Conflicts of Interest
The corresponding author, on behalf of all the authors declares that there are no conflict of interest.
Compliance Statement
The use of plants in this study complies with international, national and/or institutional guidelines.
References
- Han et al., 2015: Han, Y., Liu, E., Liu, L., Zhang, B., Wang, Y., Gui, M., Wu, R.,.and Li, P. 2015. Rheological, emulsifying and thermostability properties of two exopolysaccharides produced by Bacillus amyloliquefaciens LPL061. Carbohydrate Polymers. 115: 230-237. [CrossRef]
- Bomfetiet al., 201: Bomfeti, C. A., Florentino, A. F., Guimarães, A. P., Cardoso, P. G., Guerreiro, M. C.and Moreira, F. M. S. 2011. Exopolysaccharides produced by the symbiotic nitrogen-fixing bacteria of leguminosae. R Bras Ci Solo. 35:657-71. [CrossRef]
- Freitas et al., 2011: Freita, F. Alves, V. D. and Reis, M. A. 2011. Advances in bacteria exopolysaccharides for production to biotechnological application. Trends Biotechnol. [CrossRef]
- Ribeiro and Burkert, 2016: Ribeiro, V. A. and Burkert C. A. V. 2016. Exopolysaccharides Produced by Rhizobium: Production, Composition and Rheological Properties. Journal of Polymer and Biopolymer Physics Chemistry. 4(1):1-6.
- Marcondes et al., 2014: Marcondes, J. A., Carareto, L. M., Varani, A. M. and Lemos, E. G. M. 2014. Bradyrhizobiaceae Family. Berlin/Heidelberg/New York.Springer-Verlag; 4th.ed. p.135-54.
- Nicolas et al., 2010: Nicolas, B., Kambourova, M. and Tokso, E. 2010. Exopolysaccharides from extremophiles:from fundamentals to biotechnology. Environ Technol. 31:1145–1158. [CrossRef]
- Carareto et al., 2014: Carareto, L. M, Marcondes, J. A., Varani, A. M. and Lemos, E. G. M. 2014. Rhizobiaceae Family. Berlin/Heidelberg/New York: Springer-Verlag 4: 419-37.
- Margret et al., 2011: Margret, I., Backer, A., Blom, J., Bonila, I., Goesmann, A., Gottfert, M., Lloret, J., Mittard-Runte, V., Ruckert, C., Ruiz-Sainz, J. E., Vinardell, J. M. and Weidner, S. 2011. Symbiostic properties and first analyses of the genomic sequence of the fast growing model strain Sinorhizobiumfredii HH103 nodulaing soybean. J. Biotechnol. 155:11-19. [CrossRef]
- Cerning et al., 1992: Cerning, J., Bouillanne, C., Landon, M. and Desmazeaud, M. J. 1992 Isolation and characterization of exopolysaccharides from slime-forming mesophilic lactic acid bacteria. Journal of Dairy Science. 75 692–699. [CrossRef]
- Castellane et al., 2015: Castellane, T. C. L., Lemos, M. V. F., and Lemos, E. G. M. 2014. Evaluation of the biotechnological potential of Rhizobium tropici strains for exopolysaccharide production. Carbo hydr Polym. 111:191-197. [CrossRef]
- Fu and O’Neill (1995): Fu, D. and O’neill, R. A. 1995. Monossaccharide composition analysis of oligosaccharides and glycoproteins by high performance liquid chromatography. Anal Biochem. 227: 377-384. [CrossRef]
- Kumar et al. (2012): Kumar, B. S., Ram, M. R. and Mallaiah, K. V. 2012. Studies on exopolysaccharide and indole acetic acid production by Rhizobium strains from Indigofera. African Journal of Microbiology Research, 3, 10–14.
- Nataraj et al., 2008: Nataraj, S., Schomacker, R., Kraume, M., M Ishra, M. I. and Drews, A. 2008. Analyses of Journal of the Membrane Science. 308: 152 – 161.
- Wang et al., 2015: Wang, J., Zhao, X., Tian, Z., Yang, Y. and Yang, Z. 2015. Characterisation of an exopolysaccharide produced by Lactobacillus plantarumfrom Tibet Kefir. Carbohydrate Polymers. 125:16–25. [CrossRef]
- Sajna et al., 2013: Sajna, K. V., Sukumaran, R. K., Gottumukkala, L. D., Jayamurthy, H., Dhar, K. S. and Pandey, A. 2013. “Studies on structural and physical characteristics of a novel exopolysaccharide from Pseudozyma sp. International Journal of Biological Macromolecules, 59:84–89. [CrossRef]
- Sri et al. (2017).
- Wang et al., 2015: Wang, J., Zhao, X., Tian, Z., Yang, Y. and Yang, Z. 2015. Characterisation of an exopolysaccharide produced by Lactobacillus plantarum from Tibet Kefir. Carbohydrate Polymers. 125:16–25. [CrossRef]
- Hui et al., 2017: Hui, G., Zhen, Y., Meng, L., Zhijia, S., Jiapeng, L. and Chen, X. Q. 2017. Time-dependent categorization of volatile aroma compound formation in stewed Chinese spicy beef using electron nose profile coupled with thermal desorption GC–MS detection. Food Science and Human Wellness, 6(3): 137-146. [CrossRef]
- Fraysse et al., 2003: Fraysse, N. Couderc, F. and Poinsot, V. 2003. Surface polysaccharide involvement in establishing the Rhizobium-legume symbiosis. European Journal of Biochemistry. 270:1365–1380. [CrossRef]
- Gharzouli et al., 2013: Gharzouli, R., Carpene, M. and Couderc, F. 2013. Relevance of Fucose-Rich Extracellular Polysaccharides Produced by Rhizobium sullae Strains Nodulating Hedysarum coronarium L. Legumes. Applied and Environmental Microbiology, 79(6): 1764-1776. [CrossRef]
- Zheng et al., 2011: Zheng, C. He, J. Wang, Y. Wang, M. Huang, Z. 2011. Hydrocarbon degradation and bioemulsifierproduction by thermophilic Geobacillus pallidus strains. Bioresource. 38: 222- 231. [CrossRef]
- Huang et al., 2012: Huang, K. H. Chen, B. Y. Shen, F. T. and Young, C. C. 2012. Optimization of exopolysaccharide production and diesel oil emulsifying properties in root nodulating bacteria. World Journal of Microbiology and Biotechnology. (28) 1367–1373. [CrossRef]
- Bai and Plotto, 2012: Bai, J. and Plotto, A. 2012. Coating for fresh fruits and vegetables, In edible coating and films to improve food quality. Jinhe Bai CRC Press. pp. 186-248.
Disclaimer/Publisher’s Note: The statements, opinions and data contained in all publications are solely those of the individual author(s) and contributor(s) and not of MDPI and/or the editor(s). MDPI and/or the editor(s) disclaim responsibility for any injury to people or property resulting from any ideas, methods, instructions or products referred to in the content. |
© 2023 by the authors. Licensee MDPI, Basel, Switzerland. This article is an open access article distributed under the terms and conditions of the Creative Commons Attribution (CC BY) license (http://creativecommons.org/licenses/by/4.0/).
Copyright: This open access article is published under a Creative Commons CC BY 4.0 license, which permit the free download, distribution, and reuse, provided that the author and preprint are cited in any reuse.


