Submitted:
13 February 2023
Posted:
14 February 2023
You are already at the latest version
Abstract
As one of the world's most populous countries, Indonesia is struggling with the composition of its people, the majority of whom are unemployed productive-age individuals with low education levels. Another issue is the high poverty rate, which is followed by issues of gender inequality. The government cannot solve these social issues on its own. There is a need for community support to solve these problems through sustainable social entrepreneurship activities. Using the Theory of Planned Behavior and Outcome Expectation, this study will determine the factors that influence the interest of individuals known as the Z and Millennial generation, aged 18 to 34 years old, in becoming social entrepreneurs. This study applied a quantitative approach with a judgmental sampling technique to a sample of Generation Z and Millennials who have ever participated in social activities but have not yet started their own business. The study gathered 210 respondents, who were then analyzed using the PLS-SEM method with multiple group analysis generation-based comparison. According to the findings, the Millennial Generation's Attitude Toward Behavior, Subjective Norms, and Outcome Expectation all had a positive impact on Social Entrepreneurial Intention. Meanwhile, Subjective Norms had no effect on Social Entrepreneurial Intention in the Z Generation. Only attitude toward behavior, perceived behavioral control, and outcome expectation have a positive effect on the development of social entrepreneurial intentions. Furthermore, the findings of this study confirm that subjective norms influence attitude toward behavior and Perceived Behavioral Control in both Generation Z and millennials.
Keywords:
Attitude Toward Behavior
; Subjective Norms
; Perceived Behavioral Control
; Outcome Expectation
; Social Entrepreneurial Intention
; Generation Z
; Generation Millennials
1. Introduction
Indonesia experienced a demographic bonus since 2012 and it’s expected to reach highest level in the period of 2020-2035. The demographic bonus will become Indonesia’s competitive advantage if it followed with the high-qualified workforce and competence (Indonesia Central Bureau of Statistics, 2020). On the contrary, the demographic bonus with low-qualified workforce will cause the country’s social economic problem since it will cause higher rate of unemployment (Jati, 2015). The Indonesian Minister of Manpower stated that "Out of 10 people, six of them have low education, less skills" (Hartato, 2019).
The lack of job opportunities in Indonesia is showed by the data released by Global Entrepreneurship Monitor (Bosma et al., 2021) which shows that only 0.3% of Indonesian companies had plan to recruit new six or more employees over the next five years, and 6.3% do not intend to recruit even one employee. According to Central Bureau Statistic, the number of unemployed in Indonesia as of February 2022 reached 8.4 million people, of which more than 59% were young individuals aged between 15-29 years (Indonesia Central Bureau of Statistics, 2022). This unemployment condition dominated with individual with graduated from Vocational High School (11.13%), followed by General High School (9.09%), Junior High School (6.45%) and University (5.98%) (Indonesia Central Bureau of Statistics, 2021).
Another social problem that occurs in Indonesia is the gender gap. In the study of Nasution & Yuniasih (2022), shows that there is a wage gap, where women workers are paid 31.21% lower than men in 2021. In fact, the labor force participation rate in Indonesia is still dominated by men with the participation of 83.18%, while women's participation was only 55.5%. Furthermore, on an annual basis, the male labor force increased by 0.17% while women labor force only increased by 0.06% (Mariyanti et al., 2021).
The government has made various policies in health, economic and financial sectors to overcome the Covid-19 pandemic. According to (Pasaribu et al., 2020), the government needs support and participation of all society members to solve the complex social welfare problems. According to (Taftazani, 2017), social entrepreneurship is one solution to improve social and environmental conditions through social service efforts in which individual is able to participate independently.
Social entrepreneurs have greater influence than traditional entrepreneurial activities (Galindo-Martín et al., 2020). According to (Bornstein, 2007) in (Wibowo & Nulhaqim, 2015), the development of social entrepreneurship is beneficial for: reducing poverty through empowerment, providing health services, education and training, environmental preservation and sustainable development, community regeneration, and welfare projects.
Examples of social entrepreneurs who have succeeded in making a difference in Indonesia are Sabrina Bensawan and Elena Bensawan by establishing SAAB Shares which seeks to break the cycle of poverty by empowering education, health, and empowering women. They succeeded in helping 532,217 people to improve their standard of living (SAAB Shares, 2018). Apart from that, there is also Denica, the founder of Sukkha Citta in 2016 which provides equal opportunities in education, a living wage and access to the market for people living in rural Indonesia. Denica, through Sukka Citta, succeeded in increasing the income of her seven assisted villages by 60% by empowering 340 craftsmen and a total of 1432 Sukka Citta members (Sukkha Citta, 2022).
According to the British Council and UNESCAP (2018),67% of social entrepreneurs in Indonesia are led by people between the ages of 18 and 34. The previous study of Garai-fodor et al. (2021), the motivation to participate in volunteering among young people (Gen Z) in Hungary is driven by the following reasons: the fate of humanity and the environment is dependent on one's own actions, and volunteer actions can also change the world. Furthermore, millennials (those born between 1980 and 2000) are more likely than previous generations to become social entrepreneurs (Zhang et al., 2021).
There is an urgency to increase the number of social entrepreneurs. According to (Hockerts, 2017), that entrepreneur intention is generally considered as a strong predictor of behavior. In this study, the prediction of social entrepreneurial intention using the Theory of Planned Behavior has been carried out by (Ruiz-Rosa et al., 2020), (Anh & Minh, 2022), and (Chinaire et al., 2021). The results showed that the Theory of Planned Behavior was able to predict interest in becoming a social entrepreneur. This theory proposes that the interest in social entrepreneurship is influenced by three variables, namely: personal attitude, subjective norms, and perceived behavioral control. In addition, (Bacq, 2020) recommend social entrepreneurial research to seek a deeper understanding of the outcomes of social entrepreneurs, and the motives behind that reason. The outcome expectation variable from Social Cognitive Career Theory is added to this study, as has been done by (Luc, 2020), (Ravi & Mohan, 2022), and (Ip et al., 2021). The results of research by (Luc, 2020)show that outcome expectations do not have effect to become a social entrepreneur, but a research by (Ip et al., 2021) and (Ravi & Mohan, 2022) found that outcome expectation influences interest in becoming a social entrepreneur. Therefore, this study is expected to further examining whether outcome expectations have an effect on the intention to become a social entrepreneur using the Theory of Planned Behavior approach.
This study is also unique in that it includes the moderating role of age group and/or age (generation) in the study of social entrepreneurship intentions in Indonesia. According to (Moisescu & Gică, 2020), the study of generation as a moderating variable is a relatively unexplored research topic. Individuals of various generations are born and raised in various historical contexts or significant events, which influence their perspective and way of seeing things (Wolfinger & McCrindle, 2014). As a result, people of different generations are expected to engage in different ways, as well as have different attitudes and reactions to the possibility of pursuing a career in social entrepreneurship.
This study compared the formation of entrepreneurial intentions among generation Y or Millennials and generation Z, using the framework of the Theory of Planned Behavior and outcome-based expectations.
This study contributes to the literature on entrepreneurship, particularly for social entrepreneurial intentions, by developing and testing theoretical models that explicitly outline the influence of attitudes toward entrepreneurship variables, subjective norms, and perceived behavioral control within the framework of the Theory of Planned Behavior, as well as outcome-based expectation variables, across several generations.
2. Literature Review
Social Entrepreneurship and Social Entrepreneurial Intention
Social entrepreneurship is the process of establishing a business with entrepreneurial skills and employing innovative approaches to solve social problems while profiting. In other words, social entrepreneurship is a business concept that aims for double profits, i.e. how to create a business that has a social impact while also aiming for financial independence / profitability (Sengupta & Sahay, 2017). Social entrepreneurship is an improved business system in which business development is carried out with a new approach in capturing business opportunities that others overlook and producing solutions to improve society (Gandhi & Raina, 2018). Individuals who are engaged in a mission and use entrepreneurial behavior to provide social value to those who are less fortunate through financially independent and sustainable entrepreneurs are referred to as social entrepreneurs (Abu-Saifan, 2012).
Intention emerges from rational and intuitive thinking, which is influenced by an individual's social, political, economic, experience, personality, and abilities (Kujinga, 2017). Entrepreneurial Intention is a person's first step toward starting a business because they have prior experience and motivation. Entrepreneurial intent is an important factor in shaping the characteristics of a person's business (Park, 2017). Social Entrepreneurial Intention (SEI) refers to an individual's intention to start a social enterprise and is considered a psychological behavior that encourages individuals to implement a social plan in order to eventually become a social entrepreneur (Tan et al., 2020). Social Entrepreneurial Intention describes an individual's desire to start a new business that will solve social problems and provide long-term solutions (Zhang et al., 2021)..
Hypothesis Development
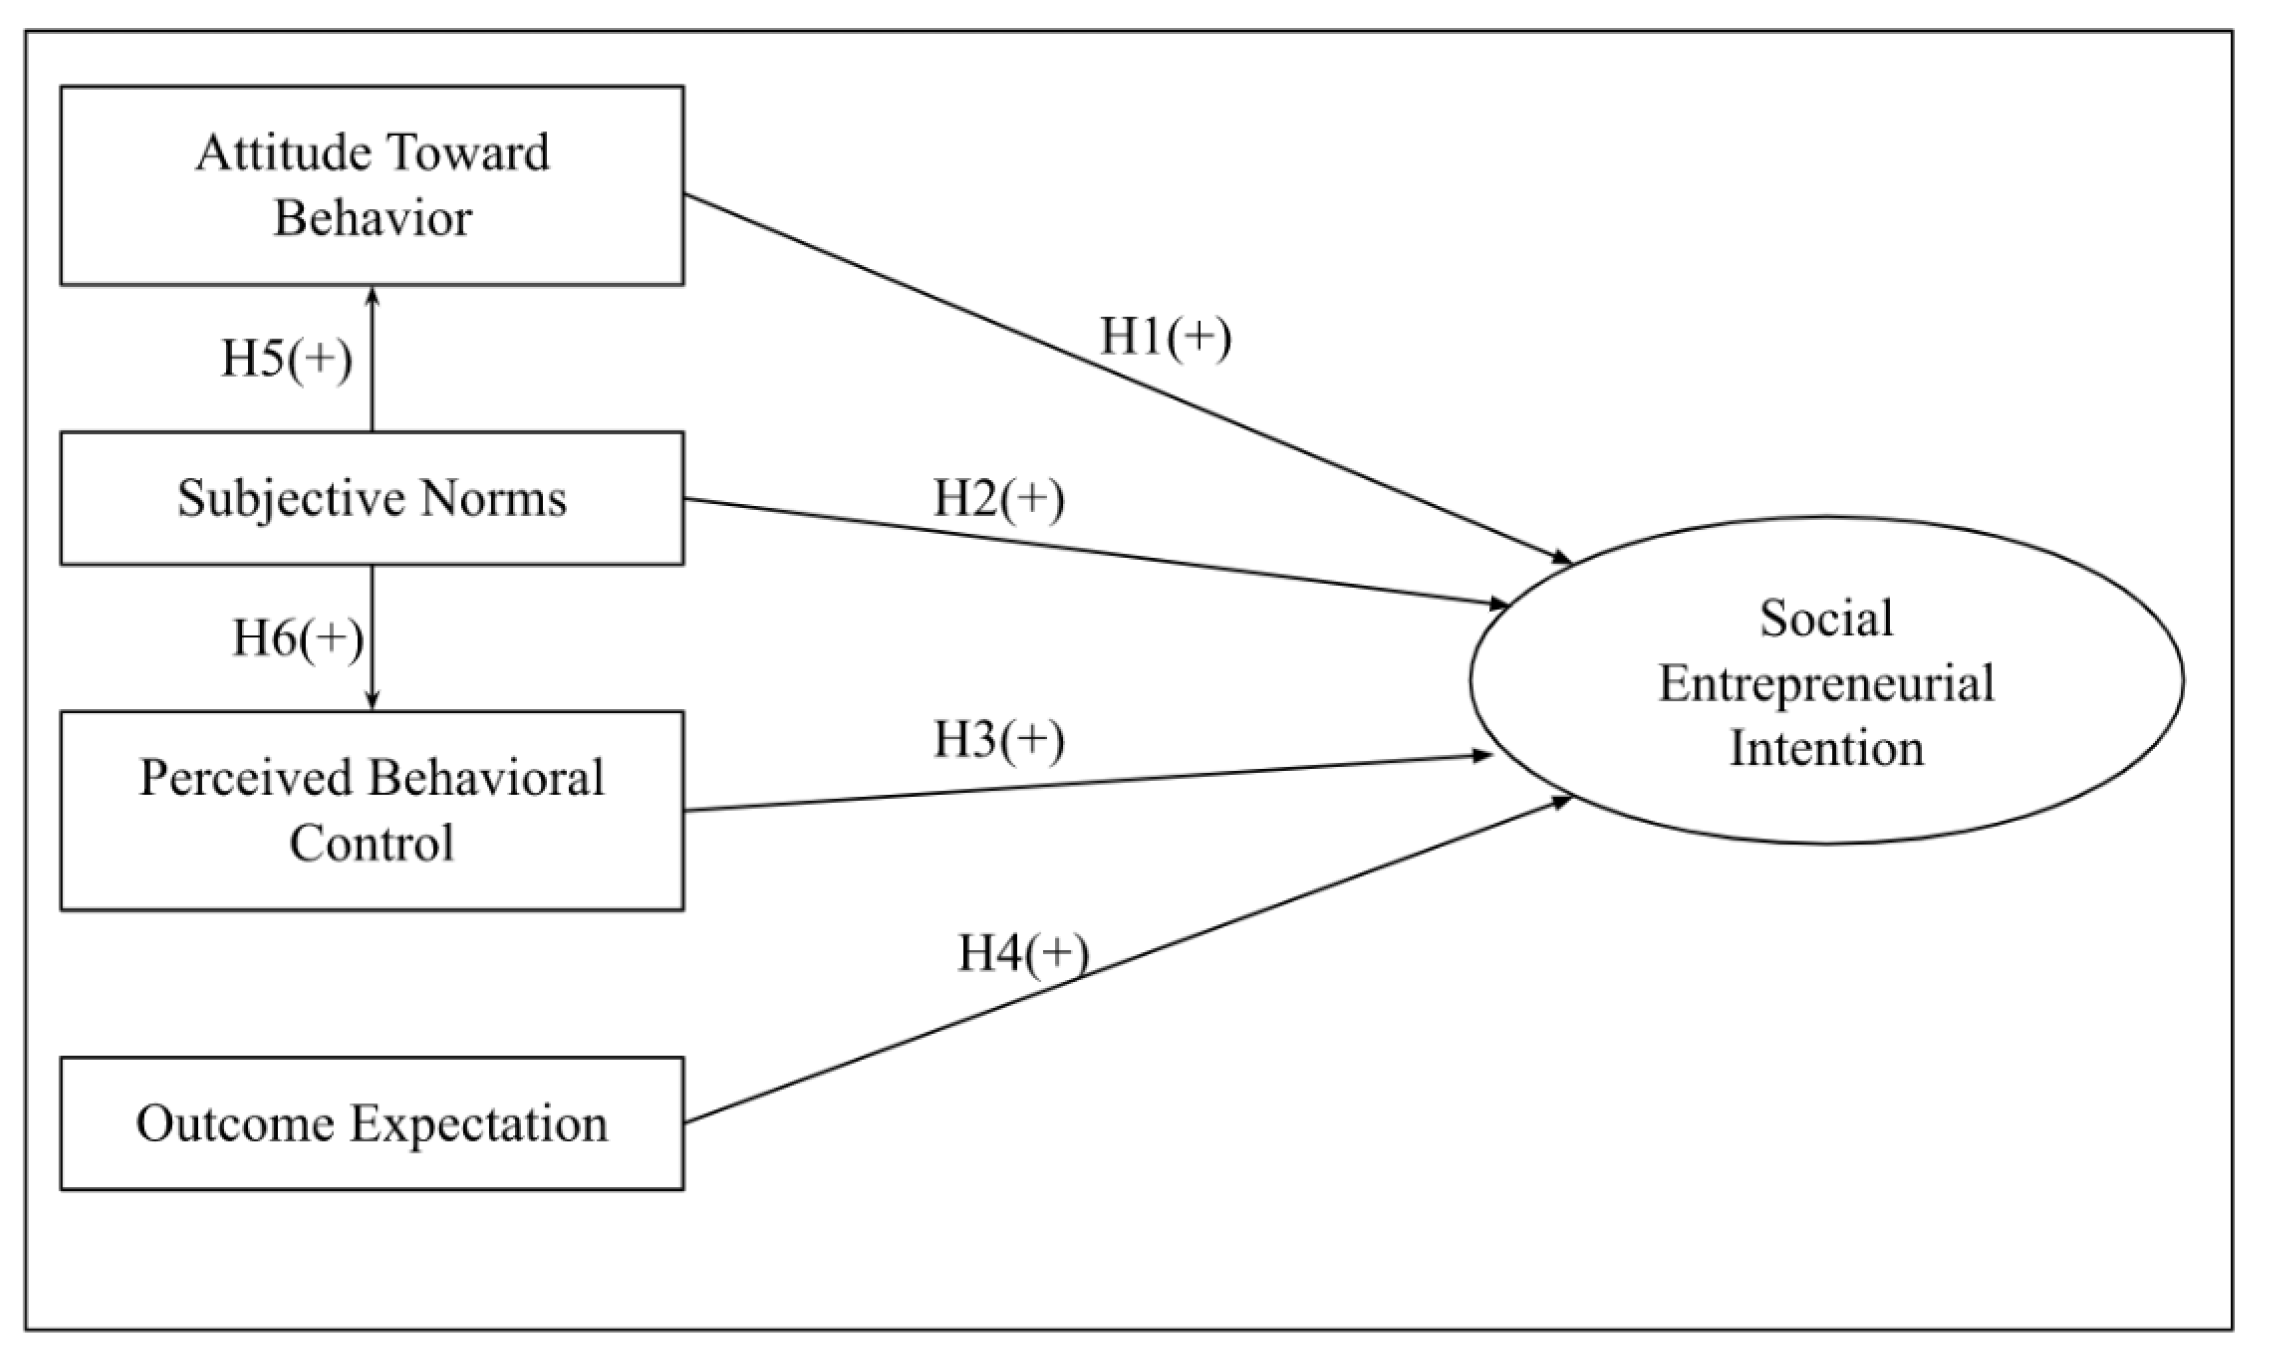
The Theory of Planned Behavior by (Ajzen, 1991) is an ideal perspective to explain the formation of social entrepreneurial intentions by considering its antecedent events, both directly and indirectly (Ruiz-Rosa et al., 2020). This theory proposes that interest in social entrepreneurship is influenced by three variables, namely: personal attitude, subjective norms, and perceived behavioral control (Ajzen, 1991). Attitude is defined with how far a person assesses the behavior concerned as profitable or unfavorable (Ajzen, 1991). There are several studies that find a positive relationship between attitude and social entrepreneurial intention, namely research by (Ruiz-Rosa et al., 2020), (Kruse et al., 2019), and (Nathanael & Nuringsih, 2020). Attitude toward behavior has the most important role in the formation of an interest in becoming a social entrepreneur because the more positive the student's assessment of social entrepreneurship, the stronger the intention to undergo social entrepreneurship (Ruiz-Rosa et al., 2020). Following this reflection, the first hypothesis is proposed.
H1: There is a positive influence between attitude toward behavior on social entrepreneurial intention.
Furthermore, subjective norms are social pressures to perform or not perform a behavior that is felt by an individual (Ajzen, 1991). There are several studies that find a positive relationship between subjective norms and social entrepreneurial intention, namely research by (Marco & Selamat, 2022), (Jadmiko, 2020), (Jatiningrum et al., 2021), and (Chinaire et al., 2021). Perceived support gives individuals the opportunity to make decisions about starting new social enterprises and influences the entrepreneur's career choices (Jatiningrum et al., 2021). Following this reflection, the second hypothesis is proposed.
H2: There is a positive influence between subjective norms on social entrepreneurial intention.
The third variable of the theory of planned behavior is perceived behavioral control, the level of how easy or difficult it is to feel about behavior and is thought to describe experiences and obstacles that can be calculated (Ajzen, 1991). There are several studies that find a positive relationship between perceived behavioral control and social entrepreneurial intention, namely research by (Anh & Minh, 2022), (Tiwari et al., 2017), (Luc, 2020), and (Barton et al., 2018). Individuals who are confident have higher intentions to become social entrepreneurs than individuals who lack the confidence that they can (Tiwari et al., 2017). Following this reflection, the third hypothesis is proposed.
H3: There is a positive influence between perceived behavioral control on social entrepreneurial intention.
Outcome expectation is a personal belief regarding the results a person will feel from an action (Anh & Minh, 2022). There are several studies that examine outcome expectations of social entrepreneurial intention, namely research by (Ravi & Mohan, 2022), (Ip et al., 2021), and (Aure et al., 2019). According to (Ip et al., 2021), the positive association between Outcome Expectation and SEI only applies to those who feel the extrinsic reward is a relatively unimportant criterion in choosing a job. Extrinsic rewards are meant as opportunities to earn lots of money, high salaries, opportunities for promotion, high status, and prestige, respect by most people, and receive compensation. These results are similar to the findings of (Aure et al., 2019), where the result of his research is that the concept of internal outcome expectation is a more reliable determinant of SEI than external outcome expectation. Following this reflection, the fourth hypothesis is proposed.
H4: There is a positive influence between outcome expectation on social entrepreneurial intention.
Subjective norms can modify PA and PBC levels, whereby when individuals feel "role models" approve of their decision to become entrepreneurs, they will be more interested in that choice and feel more capable of doing it satisfactorily (Liñán & Chen, 2009). There are several studies that find a positive relationship between SN to PA and PBC, such as research by (Ruiz-Rosa et al., 2020), (Zaremohzzabieh et al., 2019), (Dickel & Eckardt, 2021), (Lechuga Sancho et al., 2020), and (Kruse et al., 2019) Following this reflection, the fifth and sixth hypothesis is proposed.
H5: There is a positive influence between subjective norms on attitude toward behavior.
H6: There is a positive influence between subjective norms on perceived behavioral control.
3. Materials and Methods
This research is quantitative research with the type of Conclusive Research Design which is analyzed descriptively and cross-sectionally where information is collected once per sample from the population. Regarding research data, primary data was obtained by distributing online surveys via Google Form, which consisted of 21 statements and was measured using a Likert Scale-5 point (1 = sangat tidak setuju sampai 5 = sangat setuju). In addition, secondary data is obtained by collecting literature, journals, websites, news, and books according to the research.
This research use non-probability sampling with judgemental sampling. The study's respondent criteria are individuals aged 18 to 34 years as a population, and the sample is divided into two groups, namely: individuals aged 18 to 25 years as Generation Z and individuals aged 26 to 34 years as Millennials who have participated in social activities and have not owned a business but plan to own one in the future. The sampling size formula developed by Hair et al. (2009) was used in this study to calculate the minimum sampling technique by multiplying the total observed variables (indicators) by 5. There are 21 indicators in this research model. As a result, there will be 105 respondents from each group. The data was analyzed using PLS-SEM (Partial Least Square-Structural Equation Modeling) method since it can measure relatively small samples with high statistical power. The statistical test of indicators of the theory of Planned Behavior and Outcome Expectation was using Smart PLS 4 software with multigroup analysis to compare social entrepreneurship intention between Generation Z and Generation Millenialls. According to (Cheah et al., 2020), MGA analysis is useful for analyzing meaningful differentiation in multiple relationships Among the groups studied.
This research questions measurement is take from previous studies. The questions of attitude toward Social Entrepreneurship and subjective norm is originally taken and modify from (Liñán & Chen, 2009). The measurement of perceived behavioral control is taken from (Zhao et al., 2005). The measurement of outcome expectation is take from (Ip et al., 2021), and social entrepreneurship intention is taken from (Ruiz-Rosa et al., 2020).
4. Results
4.1. Descriptive Analysis Results
Table 1 below showed the descriptive analysis of the respondents from each group. This research is able to collect 210 respondents that represent Generation Z (150 respondents) and Generation Millenials (105 respondents).
Table 1 shows that in Generation Z and Millenial respondents were dominated by female who are frequently participate in various social activities. Majority of the respondents involved in money or material donation activities.
3.2. Analysis of Measurement (Outer Model)
In this study, a multigroup analysis was performed with reference to Roldán & Sánchez-Franco (2012). The first step is to check the indicator loadings value from the research model for each generation. According to the data in Table 2, the loadings value of each indicator on the variables in the study exceeded the threshold value of 0.6. (Chin et al., 1997; Hair et al., 2009). . According to Hair et al. (2017), the Average Variance Extracted (AVE) value indicates convergent validity in the evaluation of the measurement model. If a variable's AVE value is greater than 0.5, it is said to have good convergent validity (Hair et al., 2017). Table 2 shows that the AVE values for each variable attitude toward behavior (ATB), Subjective Norms (SN), PBC (Perceived Behavioral Control), Outcome Expectation (OE), and Social Entrepreneurial Intention (SEI) are greater by 0.5 in the millennial and generation Z groups.
According to Hair et al. (2017), internal consistency reliability is measured by examining the Cronbach Alpha and Composite Reliability values (CR). A variable is said to have good reliability if it has a Cronbach Alpha value and a Composite Reliability (CR) value greater than 0.7 (Hair et al., 2011b; Hair et al., 2017). According to Table 2, the CR and Cronbach Alpha values of the ATB, SN, PBC, OE, and SEI variables for both the overall research data and the millennial and generation Z groups are greater than 0.7. As a result, the study's reliability can be described as satisfactory.
Finally, discriminant validity is used in this study to assess differences between composite models (Hair et al. 2017). The discriminant's validity is determined by examining the AVE square root value of each construct, which must be greater than its correlation with the other constructs (Fornell & Larcker, 1981). According to Table 3, the AVE square root values of each ATB, OE, PBC, SEI, and SE construct are higher than their highest correlation values with the other constructs in both the overall and millennial and generation Z samples.
3.3. Analysis of Structural (Inner Model)
The structural model testing analysis is used to determine whether or not the path relationships of the research model, both overall and generation-based models, are significant. The first step before beginning structural analysis is to ensure that the research model is multicholinear-free. The VIF (Variance Inflation Factor) value is used to determine multicollinearity. According to Hair et al. (2017), a model is considered multicollinear-free if its VIF value is less than 0.5. The VIF value of the study's sample ranged from 1,440 to 2,490 for the entire sample, 1,458 to 3,082 for the Millennial generation sample, and 1,332 to 2,581 for the generation Z sample. As a result, the study does not have the problem of multicollinearity.
After ensuring that all variables are valid, reliable, and free of multicollinearity, a hypothesis test using the coefficient determinant (R2) is performed (Chin, 1998; Cohen, 1988a). The coefficient of determination (R2) quantifies the variance in the yield variable described by the predictor variable. According to Chin (1998), the R2 value of the endogenous latent variable should be 0.67 for a significant category, 0.33 for a moderate category, and 0.19 for a weak category.
The relevance of the measurement model will then be determined by examining the values of and T Statistics from path relationship analysis (Hair et al., 2014, 2017; Ringle et al., 2018). According to Hair et al. (2017), path relationship analysis was performed on 5,000 sub-samples of cases in this study. In this study, the research hypothesis test was analyzed by looking at the β value and the T value. The value of β indicates the expected variation in a construct that is dependent on the variation of units in another independent construct. The magnitude of the significant effect on endogenous latent construction increases proportionally to the parameter value. However, to determine whether or not the β value is statistically significant, it must be examined using a T-statistical test (Chin, 1998). To test the hypothesis, the t-statistic and p-value at a significant level of 5% are used. When the t-statistics value is greater than the critical value, the coefficient is statistically significant. The critical value for the one-tailed test is 1.64, and the p-value must be less than 0.05 (p-value 0.05) to conclude that the relationship under consideration is significant at a rate of 5% (Hair et al., 2017).
According to Hair et al. (2014), the study also looked at predictive relevance (Q2) and effect size values (f2). Predictive relevance (Q2) measurements were performed in this study using blindfolding procedures against endogenous variables in reflective measurements (Hair et al., 2014). If the value of Q2 is greater than zero, a structural model is said to have good predictive capacity (Hair et al., 2014). Furthermore, in accordance with Hair et al. (2014), this study evaluated the effect size (f2) to demonstrate substantive significance. Statistical significance, such as the P value, can only indicate whether an effect exists but not the magnitude of the effect. As a result, both statistical significance (P value) and substantive significance (f2 value) measurements are required for good data reporting and interpretation (Sullivan & Feinn, 2012). Meanwhile, Cohen (1988) stated that 0.02, 0.15, and 0.35 represent the measurement of a small, medium, and large effect, respectively. Here are the structural test results of the model from the entire sample and also the generation sample:
The overall sample R2 for ATB is 0.319. The subjective norms variable, according to the findings, can explain 31.9% of ATB in the overall sample. Meanwhile, the overall data sample R2 for PBC is 0.278. In other words, subjective norms can account for 27.8% of ATB in the overall sample. Finally, the overall data sample R2 for SEI is 0.677. According to this result, ATB, SN, PBC, and OE can explain 67.7% of the variable SEI in the overall sample. Finally, R2 for ATB and SN are substantial and moderate, respectively, while R2 for SEI is significant (Cohen, 1988b).
Moreover, based on Table 4, the Effect Size Q² is also tested by measuring the predictive power of the model (Hair et al. 2017) and the results of all endogenous variables obtained in overall sample have values above 0 (Q²> 0), it can be concluded that the model has good predictive relevance.
Hypothesis Testing
The hypothesis test uses a bootstrapping test to determine whether the independent variable has a significant effect on the dependent variable. According to Hair et al. (2017), Bootstrapping is a method that involves resampling a random sample of data and estimating the path model several times under slightly different data constellations, as stated by Hair et al. (2017). It is necessary for there to be a sizable number of bootstrap samples, but this number must be lower than the total amount of valid observations contained in the data set. It is recommended that a bootstrap subsample of 5,000 cases be used in order to facilitate the procedure of estimating a model for each subsample(Hair et al., 2011b; Hair et al., 2017). According to Table 4, all of the hypothesis is supported by the overall sample . First, in regard to Hypothesis 1, where a significantly positive attitude toward behavior has an effect on social entrepreneurial intention in the overall sample (B=0.393, T=5.520, P=0.000 with a medium effect size where f2=0.240). Regarding the second hypothesis, we find that the influence of subjective norms on the intention to engage in social entrepreneurship is positive across the entire sample (B=0.158, T=2.529, P=0.006 with a small effect size where f2=0.046). Regarding Hypothesis 3, PBC has been shown to have a positive influence on the intention to engage in social entrepreneurship across the entire sample (B=0.233, T=3.839, P=0.000 with a small effect size where f2=0.096). For the fourth hypothesis, we find that the outcome expectation has a positive influence on the intention to engage in social entrepreneurship across all of our samples (B = 0.208, T = 3.561, P = 0.000, with a small effect size where f2 = 0.075). In addition, a positive influence of subjective norms on attitude toward behavior has been reported (B=0.5568, T=10.460, P=0.000 with a large effect size where f2=0.476). Therefore, the evidence supports hypothesis number 5. Last but not least, hypothesis 6 is supported by all of the sample data. It can be postulated that the influence of subjective norms on perceived behavioral control is a positive and significant (B=0.530, T=10.593, P=0.000 with a large effect size where f2=0.391), considering the overall sample data.
Multigroup Analysis
This study employs multigroup analysis to examine the effect of generation on the relationship between outcome expectation and TPB antecendent's attitude toward behavior, subjective norms, and Perceived Behavior control in the formation of students' social entrepreneurial intention. For this study, we conduct a comparative analysis of millennials and generation Z samples. According to Hair et al. (2017), , measurement invariance is critical in SEM-PLS multigroup analysis. To evaluate it, we used a three-step MICOM (measurement invariance of composite models) procedure (Henseler et al., 2016).
The first step is to ensure that the research model is have configural invariance. To analyze configuration invariance, the measurement model, structural model, and algorithm for all model estimates must be identical for the integrity of each sample and for each group (using identical questionnaires in both cases). Therefore, in case, configural invariance has been achieved.
After achieving configural invariance, the next step will be to check model compositional invariance. Compositional invariance (c), defined as an indicator evenness coefficient. To evaluate compositional invariance, a MICOM procedure with 5000 permutations was implemented using SmartPLS 4 software. To assess configural invariance, we must compare the results of the correlation c between the first and second group's composite scores (column Original Correlations) with the 5% quantile (Cheah et al., 2020). According to Table 5, the quantile result for all constructs was less than (or equal to) correlation c. The permutation's p-values were greater than 0.05, indicating that the correlation was not significantly lower than one. The findings suggested that compositional invariance had been established.
Refer to Cheah et al. (2020), the third step is to assess the equality of mean values and variances across groups of composites (constructs). Step 3a will determine whether the value of each construct was within the 95% confidence interval. If the mean original difference falls between the lower (5%) and upper (95%) confidence intervals, the first part of Step III is met, providing preliminary evidence of invariance. According to Figure 6, the mean differences of ATB, OE, and SEI fell within the 95% confidence interval of 95% confidence level boundaries, whereas PBC and SN did not, indicating that there were no significant differences in the mean values of the two groups (Millennials vs Generation Z). The next step (3b) is to evaluate the results of composite variances, which have the same interpretation as mean differences. According to Table 7, all of the original differences in latent variables are within the 95% confidence interval and have p-values greater than 0.05. It is possible to conclude that the model has equal variance. Only partial measurement invariance was supported because the Step III results concluded that not all of the composite mean values were equal.

Table 5.
MICOM Compositional Invariance (Step 2).
| Original correlation | Correlation permutation mean | 5.0% | Permutation p value | Original correlation | |
| ATB | 0.997 | 0.999 | 0.996 | 0.101 | 0.997 |
| OE | 0.999 | 0.997 | 0.992 | 0.852 | 0.999 |
| PBC | 0.999 | 0.998 | 0.995 | 0.834 | 0.999 |
| SEI | 1.000 | 1.000 | 0.999 | 0.695 | 1.000 |
| SN | 0.996 | 0.999 | 0.995 | 0.076 | 0.996 |
Table 6.
MICOM Equal Mean (Step 3a).
| Original difference | Permutation mean difference | 5.0% | 95.0% | Permutation p value | |
| ATB | 0.004 | 0.002 | -0.245 | 0.225 | 0.512 |
| OE | 0.132 | 0.001 | -0.235 | 0.225 | 0.188 |
| PBC | 0.450 | 0.002 | -0.235 | 0.231 | 0.000 |
| SEI | 0.093 | -0.001 | -0.239 | 0.233 | 0.272 |
| SN | 0.240 | -0.003 | -0.239 | 0.220 | 0.035 |
Table 7.
MICOM Equal Variance (Step 3b).
| Original difference | Permutation mean difference | 5.0% | 95.0% | Permutation p value | |
| ATB | 0.217 | -0.007 | -0.424 | 0.431 | 0.216 |
| OE | 0.169 | -0.010 | -0.404 | 0.380 | 0.236 |
| PBC | -0.024 | -0.010 | -0.348 | 0.323 | 0.478 |
| SEI | 0.041 | -0.009 | -0.351 | 0.341 | 0.396 |
| SN | -0.046 | -0.005 | -0.325 | 0.338 | 0.402 |
Based on 3 step MICOM analysis (Table 5, Table 6 and Table 7), we can conclude that the model have partial measurement invariance. Therefore, the standardized coefficients of the structural model can be compared across the groups (Hair et al., 2017). Table 8 shows the Bootstrapping results of MGA analysis.
According to Table 8, The model-standardized coefficients of the structural model comparison of the millennial and generation Z samples show that the effects of ATB to SEI, OE to SEI, SN to ATB, and SN to PBC are significantly invariant for both generations. This results mean that hypothesis 1,4,5 and 6 accepted for both millennial and generation Z sample. In contrast, the effect of PBC on SEI and SN on SEI is significant different for the two generation groups. The effect of SN on SEI (hypothesis 2) is only positive and significant in the sample of millennials. Moreover, PBC is only positively significant for generation Z sample. This result means that hypothesis 3 is supported for generation Z while insignificant for millennial sample.
4. Discussion
The results of hypothesis 1 testing in this study are accepted, indicating that attitude toward behavior has a positive effect on social entrepreneurial intention in the analysis of Generation Z and Millennial Generation. Based on the results of this study, it can be said that Attitude Toward Behavior has a positive effect on Social Entrepreneurial Intention, which means that attitudes toward social entrepreneurship can encourage individual intentions to undertake social entrepreneurship in the future. Based on original sample value, among three of TPB antecendent’s, ATB is the most significant predictor for stimulate social entrepreneurial intention in overall sample and also millennial and generation Z sub sample. The findings of this study are in line with research conducted by Ruiz-Rosa et al. (2020), Kruse et al. (2019), and Nathanael & Nuringsih (2020) with the results of research that Attitude Toward Behavior has a positive and significant effect on Social Entrepreneurial Intention which indicates attitude toward behavior has an important role in the formation of interest in becoming a social entrepreneur.
In Hypothesis 2, subjective norms have a positive effect on social entrepreneurial intention in all sample case. In addition to the evaluation of the entire sample, the theoretical framework was validated and reported on within the context of generation-specific research. The result of multigroup analysis found that subjective norms have a positive effect on social entrepreneurial intention in the Millennial Generation analysis but have no effect on the Generation Z analysis. Based on the results of research on the Millennial Generation, it can be said that subjective norms have a positive effect on social entrepreneurial intention in the Millennial Generation, which means positive opinions and high support from parties considered important by Millennial Generation individuals are able to increase these individuals' interest in making social entrepreneurship a career in the future. The findings of this study are in line with research conducted by Ruiz-Rosa et al. (2020), Marco & Selamat (2022), Jadmiko (2020), Jatiningrum et al. (2021), and Chinaire et al. (2021) that subjective norms affect the intention to start a social entrepreneurship business. The support and perception of people who are considered important by the individual will increase individual interest in carrying out social projects.
In contrast to the results of research on Generation Z that subjective norms do not have a positive effect on social entrepreneurial intention. This shows that the support from parties considered important by Generation Z individuals does not affect the level of interest of Generation Z individuals to make social entrepreneurship a career in the future. This finding is in line with research by (Hasmidyani et al., 2022) and (Kesumahati, 2021) who also examines interest in entrepreneurship in Generation Z. Based on previous research, Ernst (2011) found that subjective norms have no effect on social entrepreneurial intention because the decision to become a social entrepreneur is based on self-evaluation, not third party approval. Linan & Chen (2009) argue that SN tends to play a weaker role in explaining intentions in individualistic societies. This is consistent with the characteristics of Generation Z. Generation Z is the most individualistic generation, where they will try something related to themselves and according to their own interests (Howard, 2018). In addition, subjective norms do not arouse students' interest in creating social entrepreneurship projects, perhaps because the surrounding community does not yet have a good understanding of the concept of social entrepreneurship itself, resulting in a lack of support and motivation for people who will open businesses and also have a social mission (Kesumahati 2021) .
This study result shows that Perceived Behavioral Control positively affect social entrepreneurial intention. Thus, hypothesis 3 is accepted in overall sample in this study. Moreover for generation comparison result, perceived behavioral control has a positive effect on social entrepreneurial intention in the analysis of millennials sampel, while insignificant for Generation Z sampel . Based on the results of this study, it can be said that perceived behavioral control has a positive effect on social entrepreneurial intention, which means that individuals who have control over something within themselves can increase the individual desire to make a better effort to become a social entrepreneur. The findings of this study are in line with research conducted by Ruiz-Rosa et al. (2020), Anh and Minh (2022), (Luc, 2020), Tiwari et al. (2017), and (Barton et al., 2018) that perceived behavioral control has a significant positive influence on social entrepreneurial intention. This confirms that the more positive the perception of one's own abilities, the stronger the social entrepreneurship intention will be.
Hypothesis 4 is accepted where outcome expectation has a positive effect on social entrepreneurial intention in the analysis of overall sample and also Generation Z and Millennial Generation. The Millennial Generation towards a career as a social entrepreneur can achieve certain results and is seen as important. The findings of this study are in line with research conducted by Ravi & Mohan (2022), Ip et al. (2020), and Aure et al. (2019) that outcome expectation which is part of the Social Cognitive Career Theory has a positive influence on social entrepreneurial intention.
Moreover, the study resuly shows that hypothesis 5 is accepted. This result indicates that there is a positive influence between subjective norms on attitude toward behavior in the analysis of overall sampel, and also Generation Z and the Millennial Generation sampel. Based on the results of this study, it can be said that the support and opinions of people who are considered important by an individual will influence individual attitudes, namely increasing individual positive perceptions about social entrepreneurship. The results of subjective norms have a positive effect on attitude toward behavior, in line with the research conducted by Ruiz-Rosa et al. (2020), Dickel & Eckardt (2021) Dickel & Eckardt (2020) and Zaremohzzabieh et al. (2019).
Last, this study also confirm the positive influence of subjevtive norms on perceived behavioural control. Thus, hypothesis 6 is supported in overall data sample and also generation sample (both, millennial and generation Z). This result reconfirm the same findings from previous researchs on how subjective norms forming one’s entrepreneurial perceived behavioral control (Dickel & Eckardt, 2021; Kruse et al., 2019; Lechuga Sancho et al., 2020; Ruiz-Rosa et al., 2020; Zaremohzzabieh et al., 2019).
5. Conclusions
This study integrates TPB framework with outcome expectation to examines factors that stimulate individual social entrepreneurial intention in Indonesia. The data analysis in this study is carried out using Partial Least Square-SEM with Multigroup analysis on two generation sample namely generation Z and millennial.
The study results of the multigroup analysis generation-based sample of 105 Generation Z respondents and 105 Millennial Generation respondents were carried out to examine the relationship between attitude toward behavior, subjective norms, perceived behavioral control, outcome expectations on social entrepreneurial intention variables. Overall sample hypotheses testing shows that all of the hypotheses is supported. Nevertheless, the multigroup generation-based analysis shows that two out of six hypotheses are having invariance different between two generations.
In summary, among three TPB antecedent’s only attitude toward behavior that positively affect social entrepreneurial intention in overall sample and also found invariance among the generation group. PBC only significantly affect SEI for generation Z sample. While SN significantly affect SEI on millennial sample. Moreover, SN is positevly affect PBC and ATB development in overall sample, also in multigroup generation-based result. Lastly, the result also reconfirmed outcome expectation positive effect on SEI development in overall sample, also in generation-based sample.
Based on this study result, government could increase interest in becoming a social entrepreneur are to provide Generation Z and Millennials with support such as networks such as mentors who have successful business experience, financial support such as student social business capital assistance which can be done through social incubator because the attitude toward behavior is the most influential factor in interest formation. In addition, the government should create entrepreneurial policies, especially for social entrepreneurs that make it easier for business actors to start and run their businesses, for example, office subsidy policies for social enterprise operational activities, business tax exemptions, etc. With supportive policies/regulations, the Millennial Generation will feel they have the opportunity and resources, they can be freer to undertake social entrepreneurship so as to increase Millennial Generation's interest in becoming social entrepreneurs. In addition, given that Generation Z and Millennials are closely related to technology, the government can utilize mass media and social media to increase awareness of social issues and raise awareness that Generation Z and Millennials are the agents of change needed.
This study has certain limitations that open new research avenues. Researchers suggest that specifying variables in this research is like the outcome expectation variable to become an internal outcome expectation variable and an external outcome expectation variable. With the presence of more specific variables, it is hoped that future researchers will be able to reach more precise conjectures regarding the effect of outcome expectation on social entrepreneurial intention. Other than that, the researcher suggests that further research can expand their research by not only examining the interest in becoming a social entrepreneur but also examining how far the research object seeks to translate this interest into actual behavior (behavior). Also, for further researchers, the researcher suggests using a different research object from this study, the goal is to be able to add different and new information, that can be used as a comparison for learning.
Author Contributions
Following is the individual contribution for this research: Conceptualization: Florentina Kurniasari and Elissa Dwi Lestari; Research Methodology: Florentina Kurniasari and Elissa Dwi Lestari; Data Collection and Data Processing: Herlin Handayani, Writing—original draft preparation: Herlin Handayani; Writing—review and editing: Florentina Kurniasari and Elissa Dwi Lestari; Supervision: Florentina Kurniasari; Project Administration: Elissa Dwi Lestari. All authors have read and agreed to the published version of the manuscript.
Funding
This research received no external funding.
Informed Consent Statement
Informed consent was obtained from all subjects involved in the study.
Data Availability Statement
We encourage all authors of articles published in MDPI journals to share their research data. In this section, please provide details regarding where data supporting reported results can be found, including links to publicly archived datasets analyzed or generated during the study. Where no new data were created, or where data is unavailable due to privacy or ethical restrictions, a statement is still required. Suggested Data Availability Statements are available in section “MDPI Research Data Policies” at https://www.mdpi.com/ethics.
Acknowledgments
All authors give highly appreciation to Universitas Multimedia Nusantara for the support in doing the research.
Conflicts of Interest
The authors declare no conflict of interest.
References
- Abu-Saifan, S. (2012). Social Entrepreneurship: Definition and Boundaries. Technology Innovation Management Review, 2, 22–27. [CrossRef]
- Ajzen, I. (1991). The theory of planned behavior. Organizational Behavior and Human Decision Process, 50, 179–211. [CrossRef]
- Anh, B.N.T., & Minh, P. (2022). Combination of SCCT and TPB in explaining the social entrepreneurial intention. Ho Chi Minh City Open University Journal of Science-Economics and Business Administration, 12. [CrossRef]
- Aure, P.A.H., Dui, R.P., Jimenez, S.V., Daradar, D.D., Gutierrez, A.N.A., Blasa, A.C., & Sy-Changco, J. (2019). Understanding social entrepreneurial intention through social cognitive career theory: A partial least squares structural equation modelling approach. Organizations and Markets in Emerging Economies, 10, 92–110. [CrossRef]
- Bacq, S. (2020). Social Entrepreneurship and COVID-19. Journal of Management Studies, 1, 1–7. [CrossRef]
- Barton, M., Schaefer, R., & Canavati, S. (2018). To be or not to be a social entrepreneur: Motivational drivers amongst american business students. Entrepreneurial Business and Economics Review, 6, 9–35. [CrossRef]
- Bornstein, D. (2007). How to Change the World: Social Entrepreneurs and the Power of New Ideas. Oxford University Press.
- Bosma, N., Hill, S., Ionescu-Somers, A., Kelley, D., Guerrero, M., & Schott, T. (2021). Global Entrepreneurship Monitoring (GEM) 2020/2021. Global Entrepreneurship Research Association. https://www.gemconsortium.org/report/gem-20202021-global-report.
- Cheah, J.H., Thurasamy, R., Memon, M.A., Chuah, F., & Ting, H. (2020). Multigroup analysis using smartpls: Step-by-step guidelines for business research. Asian Journal of Business Research, 10, I–XIX. [CrossRef]
- Chin, W.W. (1998). The Partial Least Squares Approach to Structural Equation Modeling. Modern Methods for Business Research, 295, 295-336.
- Chin, W.W., Gopal, A., & Salisbury, W.D. (1997). Advancing the Theory of Adaptive Structuration: The Development of a Scale to Measure Faithfulness of Appropriation. Information Systems Research, 8, 342–367. [CrossRef]
- Chinaire, T.I., Chimucheka, T., & Khayundi, H.A. (2021). Factors Influencing Social Entrepreneurial Intentions of Students At a University in South Africa. Academy of Entrepreneurship Journal, 27(SpecialIssue 4), 1–16.
- Cohen, J. (1988a). Set Correlation and Contingency Tables. Applied Psychological Measurement, 12, 425–434. [CrossRef]
- Cohen, J. (1988b). Statistical Power Analysis for the Behavioral Sciences. tRoutledge. [CrossRef]
- Dickel, P., & Eckardt, G. (2021). Who wants to be a social entrepreneur? The role of gender and sustainability orientation. Journal of Small Business Management, 59, 196–218. [CrossRef]
- Ernst, K. (2011). Heart over mind – An empirical analysis of social entrepreneurial intention formation on the basis of the theory of planned behaviour . 1–309. http://elpub.bib.uni-wuppertal.de/servlets/DocumentServlet?id=2689%0Ahttp://nbn-resolving.de/urn/resolver.pl?urn=urn:nbn:de:hbz:468-20120327-142543-6.
- Fornell, C., & Larcker, D.F. (1981). Evaluating Structural Equation Models with Unobservable Variables and Measurement Error. Journal of Marketing Research, 18, 39. [CrossRef]
- Galindo-Martín, M.A., Castaño-Martínez, M.S., & Méndez-Picazo, M.T. (2020). The relationship between green innovation, social entrepreneurship, and sustainable development. Sustainability (Switzerland), 12, 1–19. [CrossRef]
- Gandhi, T., & Raina, R. (2018). Social entrepreneurship: the need, relevance, facets and constraints. Journal of Global Entrepreneurship Research, 8. [CrossRef]
- Garai-fodor, M., Varga, J., & Csiszárik-kocsir, Á. (2021). Correlation between generation z in hungary and the motivating factors to do volunteer work in a value-based approach. Sustainability (Switzerland), 13. [CrossRef]
- Hair, J., Black, W., & Babin, B.J. (2009). Multivariate data analysis 7th edition. Prentice Hall.
- Hair, Joe, F., Ringle, C.M., & Sarstedt, M. (2011). PLS-SEM: Indeed a silver bullet. Journal of Marketing Theory and Practice, 19, 139–152. [CrossRef]
- Hair, Joseph, F., Black, W.C., Babin, B.J., & Anderson, R.E. (2009). Multivariate Data Analysis (7th Edition). Prentice Hall.
- Hair, Joseph, F., Hult, G.T., Ringle, C.M., & Sarstedt, M. (2014). A Primer on Partial Least Squares Structural Equation Modeling. In SAGE (Vol. 46, Issues 1–2). [CrossRef]
- Hair, Joseph, F., Sarstedt, M., Ringle, C.M., & Gudergan, S.P. (2017). Advanced Issues in Partial Least Squares Structural Equation Modeling. Sage Publications Inc.
- Hartato, A.P. (2019). Menaker: Kualitas SDM Tenaga Kerja Indonesia Rendah. Https:/www.Jawapos.Com/. jawapos.com: https://www.jawapos.com/nasional/14/10/2019/menaker-kualitas-sdm-tenaga-kerja-indonesia-rendah/.
- Hasmidyani, D., Mardetini, E., & Eka Amrina, D. (2022). Generasi Z Dan Kewirausahaan: Mengukur Intensi Berwirausaha Berbasis Theory of Planned Behavior. Jurnal Ekonomi Pendidikan Dan Kewirausahaan, 10, 19–30. [CrossRef]
- Henseler, J., Hubona, G., & Ray, P.A. (2016). Using PLS path modeling in new technology research: Updated guidelines. Industrial Management and Data Systems, 116, 2–20. [CrossRef]
- Hockerts, K. (2017). Determinants of Social Entrepreneurial Intentions. Entrepreneurship: Theory and Practice, 41, 105–130. [CrossRef]
- Howard, K. (2018). Gen Z and the challenges of the most individualistic generation yet. Https://www.Quirks.Com/. https://www.quirks.com/articles/gen-z-and-the-challenges-of-the-most-individualistic-generation-yet.
- Indonesia Central Bureau of Statistics. (2020). Analisis Profil Penduduk Indonesia. Https://Www.Bps.Go.Id/Publication/2022/06/24/Ea52f6a38d3913a5bc557c5f/Analisis-Profil-Penduduk-Indonesia.Html. https://www.bps.go.id/publication/2022/06/24/ea52f6a38d3913a5bc557c5f/analisis-profil-penduduk-indonesia.html.
- Indonesia Central Bureau of Statistics. (2021). Tingkat Pengangguran Terbuka Berdasarkan Tingkat Pendidikan 2019-2021. Https://Www.Bps.Go.Id/. https://www.bps.go.id/indicator/6/1179/1/tingkat-pengangguran-terbuka-berdasarkan-tingkat-pendidikan.html.
- Indonesia Central Bureau of Statistics. (2022). Februari 2022: Tingkat Pengangguran Terbuka (TPT) sebesar 5,83 persen dan Rata-rata upah buruh sebesar 2,89 juta rupiah per bulan. Https://Www.Bps.Go.Id/. https://www.bps.go.id/pressrelease/2022/05/09/1915/februari-2022--tingkat-pengangguran-terbuka--tpt--sebesar-5-83-persen.html.
- Ip, C.Y., Liang, C., Lai, H.J., & Chang, Y.J. (2021). Determinants of social entrepreneurial intention: An alternative model based on social cognitive career theory. Nonprofit Management and Leadership, 31, 737–760. [CrossRef]
- Jadmiko, P. (2020). Minat Berwirausaha Sosial Dikalangan Mahasiswa. Jurnal Manajemen Bisnis, 17, 445. [CrossRef]
- Jati, W.R. (2015). Bonus Demografi Sebagai Mesin Pertumbuhan Ekonomi: Jendela Peluang Atau Jendela Bencana Di Indonesia? Populasi, 23, 1–19. [CrossRef]
- Jatiningrum, C., Utami, B.H.S., Norawati, S., & Silvany. (2021). Intensi Kewirausahaan Sosial Wirausaha Muda di Indonesia: Studi Masa Pandemi Covid-19. ECo-Buss, 4, 95–106. [CrossRef]
- Kesumahati, E. (2021). Social Entrepreneurship Intention During Covid-19 Crisis Among University Students: a Case Study From Indonesia. E-Jurnal Manajemen Universitas Udayana, 10, 1221. [CrossRef]
- Kruse, P., Wach, D., Costa, S., & Moriano, J.A. (2019). Values Matter, Don’t They?–Combining Theory of Planned Behavior and Personal Values as Predictors of Social Entrepreneurial Intention. Journal of Social Entrepreneurship, 10, 55–83. [CrossRef]
- Kujinga, B.U.L. (2017). The institutional environment and social entrepreneurship intentions Introduction. Journal of Entrepreneurial Behaviour & Research, 23, 1–41.
- Lechuga Sancho, M.P., Martín-Navarro, A., & Ramos-Rodríguez, A.R. (2020). Will they end up doing what they like? the moderating role of the attitude towards entrepreneurship in the formation of entrepreneurial intentions. Studies in Higher Education, 45, 416–433. [CrossRef]
- Liñán, F., & Chen, Y.-W. (2009). Development and Cross-Cultural Application of a Specific Instrument to Measure Entrepreneurial Intentions. 594 ENTREPRENEURSHIP THEORY and PRACTICE, 593–617. [CrossRef]
- Luc, P.T. (2020). Outcome expectations and social entrepreneurial intention: Integration of planned behavior and social cognitive career theory. Journal of Asian Finance, Economics and Business, 7, 399–407. [CrossRef]
- Marco, B.C., & Selamat, F. (2022). Pengaruh Efikasi Diri Kewirausahaan, Dukungan Sosial, Dan Dukungan Edukasi Terhadap Intensi Kewirausahaan Sosial Pada Mahasiswa Perguruan Tinggi Di Jakarta. Jurnal Manajerial Dan Kewirausahaan, 04, 289–300. [CrossRef]
- Mariyanti, S., Lunanta, L. ., & Handayani, S. (2021). Optimisme ibu bekerja di Indonesia ditinjau dari work family conflict dan kepemilikan asisten rumah tangga. Jurnal Psikologi : Media Ilmiah Psikologi, 19, 9–21.
- Moisescu, O.I., & Gică, O.A. (2020). The impact of environmental and social responsibility on customer loyalty: A multigroup analysis among generations x and y. International Journal of Environmental Research and Public Health, 17, 1–21. [CrossRef]
- Nasution, R., & Yuniasih, F. (2022). Analisis Kesenjangan Upah Antargender di Kawasan Timur Indonesia pada Masa Sebelum dan Saat Pandemi Analysis of the Gender Wage Gap in Eastern Indonesia in the Period Before and During the Pandemic Pendahuluan Kesenjangan upah antargender sampai Berdasark. Aspirasi: Jurnal Masalah-Masalah Sosial, 13, 187–204. [CrossRef]
- Nathanael, D., & Nuringsih, K. (2020). Social Support, Personality Traits, Social Innovation Mempengaruhi Intensi Kewirausahaan Sosial: Entrepreneurial Attitude Sebagai Mediasi. Jurnal Manajerial Dan Kewirausahaan, 2, 33. [CrossRef]
- Park, C. (2017). A study on effect of entrepreneurship on entrepreneurial intention. Asia Pacific Journal of Innovation and Entrepreneurship, 11, 159–170. [CrossRef]
- Pasaribu, S.I., Vanclay, F., & Zhao, Y. (2020). Challenges to implementing socially-sustainable community development in oil palm and forestry operations in Indonesia. Land, 9. [CrossRef]
- Ravi, A., & Mohan, D.K. (2022). Role Of Pro-Socialness In Creating Social Entrepreneurial Intention: A Study Of Omani Undergraduate Students. Journal of Positive School Psychology , 2022, 4092–4102. https://journalppw.com/index.php/jpsp/article/view/8114.
- Ringle, C.M., Sarstedt, M., Mitchell, R., & Gudergan, S.P. (2018). Partial least squares structural equation modeling in HRM research. International Journal of Human Resource Management, 31, 1617–1643. [CrossRef]
- Roldán, J.L., & Sánchez-Franco, M.J. (2012). Variance-based structural equation modeling: Guidelines for using partial least squares in information systems research. In Research Methodologies, Innovations and Philosophies in Software Systems Engineering and Information Systems (Issue May). [CrossRef]
- Ruiz-Rosa, I., Gutiérrez-Taño, D., & García-Rodríguez, F.J. (2020). Social entrepreneurial intention and the impact of COVID-19 pandemic: A structural model. Sustainability (Switzerland), 12, 9–12. [CrossRef]
- SAAB Shares. (2018). About Us. Https://Saabshares.Org/En/about.Php. https://saabshares.org/en/about.php.
- Sengupta, S., & Sahay, A. (2017). Social entrepreneurship research in Asia-Pacific: perspectives and opportunities. Social Enterprise Journal, 13, 17–37. [CrossRef]
- Sukkha Citta. (2022). Our Program: Imvesting in Woman to Reverse Climate Change. Https://www.Rumahsukkhacitta.Org/Ourprogram. https://www.rumahsukkhacitta.org/ourprogram.
- Sullivan, G.M., & Feinn, R. (2012). Using Effect Size—or Why the P Value Is Not Enough. Journal of Graduate Medical Education, 4, 279–282. [CrossRef]
- Taftazani, B.M. (2017). Masalah Sosial Dan Wirausaha Sosial. Share : Social Work Journal, 7, 90. [CrossRef]
- Tan, L.P., Le, A.N.H., & Xuan, L.P. (2020). A Systematic Literature Review on Social Entrepreneurial Intention. Journal of Social Entrepreneurship, 11, 241–256. [CrossRef]
- Tiwari, P., Bhat, A.K., & Tikoria, J. (2017). An empirical analysis of the factors affecting social entrepreneurial intentions. Journal of Global Entrepreneurship Research, 7, 1–25. [CrossRef]
- Wibowo, H., & Nulhaqim, S.A. (2015). Kewirausahaan Sosial : Merevolusi Pola Pikir dan Menginisiasi Mitra Pembangunan Kontemporer. UNPAD Press.
- Wolfinger, E., & McCrindle, M. (2014). The ABC of XYZ: Understanding the Global Generations (3rd ed.). McCrindle Research: Bella Vista.
- Zaremohzzabieh, Z., Ahrari, S., Krauss, S.E., Samah, A.B.A., Meng, L.K., & Ariffin, Z. (2019). Predicting social entrepreneurial intention: A meta-analytic path analysis based on the theory of planned behavior. Journal of Business Research, 96(November 2018), 264–276. [CrossRef]
- Zhang, Y., Trusty, J., Goroshnikova, T., Kelly, L., Kwong, K.K., McGuire, S.J.J., Perusquia, J., Prabhu, V.P., Shen, M., & Tang, R. (2021). Millennial social entrepreneurial intent and social entrepreneurial self-efficacy: a comparative entrepreneurship study. Social Enterprise Journal, 17, 20–43. [CrossRef]
- Zhao, H., Hills, G.E., & Seibert, S.E. (2005). The mediating role of self-efficacy in the development of entrepreneurial intentions. Journal of Applied Psychology, 90, 1265–1272. [CrossRef]
Table 1.
Results of Descriptive Analysis.
| Generation Z | Generation Millennials | ||||
| Items | Category Answers | Numbers | (%) | Numbers | (%) |
| Gender | Male | 43 | 59% | 40 | 62% |
| Female | 62 | 41% | 65 | 38% | |
| Age | 18-25 years old | 105 | 100% | ||
| 26-34 years old | 105 | 100% | |||
| Social Activity Frequency | Very rarely (1 time per month) | 20 | 19% | 16 | 15% |
| Rarely (2 times per month) | 14 | 13% | 38 | 37% | |
| Often (3 times every month) | 63 | 60% | 41 | 39% | |
| Very often (>4 every month) | 8 | 8% | 9 | 9% | |
| The Social Activities Followed | Donations (money or material) | 80 | 38% | 97 | 50% |
| Become a Volunteer | 70 | 33% | 51 | 27% | |
| Community service in the environment | 58 | 27% | 20 | 10% | |
| Follow CSR (Corporate Social Responsibility) at work | 4 | 2% | 25 | 13% | |
Table 2.
Indicator Reliability, Reliability and Convergent Validity.
| Item | Overall Data | Millennial | Generation Z | ||||||||||
|---|---|---|---|---|---|---|---|---|---|---|---|---|---|
| Outer Loadings | Alpha | CR | AVE | Outer Loadings | Alpha | CR | AVE | Outer Loadings | Alpha | CR | AVE | ||
| ATB | ATB1 | 0.717 | 0.834 | 0.843 | 0.601 | 0.778 | 0.871 | 0.874 | 0.661 | 0.624 | 0.792 | 0.816 | 0.855 |
| ATB2 | 0.843 | 0.870 | 0.821 | ||||||||||
| ATB3 | 0.752 | 0.787 | 0.708 | ||||||||||
| ATB4 | 0.772 | 0.793 | 0.773 | ||||||||||
| ATB5 | 0.788 | 0.835 | 0.747 | ||||||||||
| SN | SN1 | 0.867 | 0.821 | 0.830 | 0.737 | 0.879 | 0.791 | 0.825 | 0.877 | 0.854 | 0.855 | 0.857 | 0.912 |
| SN2 | 0.896 | 0.888 | 0.905 | ||||||||||
| SN3 | 0.809 | 0.743 | 0.882 | ||||||||||
| PBC | PBC1 | 0.784 | 0.858 | 0.862 | 0.584 | 0.783 | 0.857 | 0.862 | 0.893 | 0.773 | 0.845 | 0.849 | 0.885 |
| PBC2 | 0.790 | 0.766 | 0.801 | ||||||||||
| PBC3 | 0.764 | 0.814 | 0.705 | ||||||||||
| PBC4 | 0.774 | 0.768 | 0.766 | ||||||||||
| PBC5 | 0.712 | 0.668 | 0.732 | ||||||||||
| PBC6 | 0.757 | 0.776 | 0.718 | ||||||||||
| OE | OE1 | 0.811 | 0.809 | 0.836 | 0.636 | 0.842 | 0.842 | 0.866 | 0.894 | 0.789 | 0.771 | 0.806 | 0.851 |
| OE2 | 0.882 | 0.899 | 0.868 | ||||||||||
| OE3 | 0.795 | 0.835 | 0.739 | ||||||||||
| OE4 | 0.691 | 0.711 | 0.665 | ||||||||||
| SEI | SEI1 | 0.876 | 0.870 | 0.869 | 0.793 | 0.893 | 0.890 | 0.890 | 0.932 | 0.859 | 0.849 | 0.849 | 0.908 |
| SEI2 | 0.899 | 0.899 | 0.903 | ||||||||||
| SEI3 | 0.896 | 0.924 | 0.866 | ||||||||||
Note: ATB: Attitude Toward Behaviour, SN: Subjective Norms, PBC: Perceived Behavioral Control, OE: Outcome Expectations, SEI: Social Entrepreneurail Intention, CR: Composite Reliability, AVE: Average Variance Extracted.
Table 3.
Discriminant Validity.
| Overall Data | Millennial | Generation Z | |||||||||||||
| 1 | 2 | 3 | 4 | 5 | 1 | 2 | 3 | 4 | 5 | 1 | 2 | 3 | 4 | 5 | |
| 1. ATB | 0.775 | 0.813 | 0.738 | ||||||||||||
| 2. OE | 0.604 | 0.798 | 0.632 | 0.824 | 0.567 | 0.769 | |||||||||
| 3. PBC | 0.604 | 0.537 | 0.764 | 0.700 | 0.595 | 0.764 | 0.540 | 0.477 | 0.750 | ||||||
| 4. SEI | 0.749 | 0.655 | 0.666 | 0.891 | 0.808 | 0.698 | 0.696 | 0.905 | 0.692 | 0.611 | 0.655 | 0.876 | |||
| 5. SN | 0.568 | 0.541 | 0.530 | 0.617 | 0.858 | 0.608 | 0.618 | 0.582 | 0.686 | 0.839 | 0.553 | 0.474 | 0.479 | 0.558 | 0.881 |
Note: ATB: Attitude Toward Behaviour, SN: Subjective Norms, PBC: Perceived Behavioral Control, OE: Outcome Expectations, SEI: Social Entrepreneurail Intention, CR: Composite Reliability, AVE: Average Variance Extracted.
Table 4.
Path Coefficient.
| Hyphotheses | Overall Data | ||||||
|---|---|---|---|---|---|---|---|
| β | T | P | Results | f2 | R2 | Q2 | |
| ATB→SEI | 0.393 | 5.520 | 0.000 | Supported | 0.240 | 0.677 | 0.473 |
| SN→SEI | 0.158 | 2.529 | 0.006 | Supported | 0.046 | ||
| PBC→SEI | 0.233 | 3.839 | 0.000 | Supported | 0.096 | ||
| OE→SEI | 0.208 | 3.561 | 0.000 | Supported | 0.075 | ||
| SN→ATB | 0.568 | 10.460 | 0.000 | Supported | 0.476 | 0.319 | 0.313 |
| SN→PBC | 0.530 | 10.593 | 0.000 | Supported | 0.391 | 0.278 | 0.269 |
Table 8.
Bootstrapping results.
| Original (Gen Z) | p value (Gen Z) | Original (Millennial) | p value (Millennial) | Invariance | |
| ATB -> SEI | 0.334 | 0.001 | 0.464 | 0.000 | Yes |
| OE -> SEI | 0.215 | 0.011 | 0.199 | 0.007 | Yes |
| PBC -> SEI | 0.315 | 0.000 | 0.135 | 0.176 | No |
| SN -> ATB | 0.553 | 0.000 | 0.608 | 0.000 | Yes |
| SN -> PBC | 0.479 | 0.000 | 0.582 | 0.000 | Yes |
| SN -> SEI | 0.120 | 0.190 | 0.203 | 0.010 | No |
Disclaimer/Publisher’s Note: The statements, opinions and data contained in all publications are solely those of the individual author(s) and contributor(s) and not of MDPI and/or the editor(s). MDPI and/or the editor(s) disclaim responsibility for any injury to people or property resulting from any ideas, methods, instructions or products referred to in the content. |
© 2023 by the authors. Licensee MDPI, Basel, Switzerland. This article is an open access article distributed under the terms and conditions of the Creative Commons Attribution (CC BY) license (http://creativecommons.org/licenses/by/4.0/).
Copyright: This open access article is published under a Creative Commons CC BY 4.0 license, which permit the free download, distribution, and reuse, provided that the author and preprint are cited in any reuse.


