
Submitted:
11 February 2023
Posted:
13 February 2023
You are already at the latest version
Abstract
Background: Initial phases of molecular and cellular maladaptive bone response at early CKD remain mostly unknown. Methods: We induced mild CKD in SHRs by either arterial hypertension lasting six months (sham-operated rats, SO6) or in its’ combination with 3/4 nephrectomy lasting two and six months (Nx2 and Nx6, correspondently). Sham operated SHRs (SO2) and Wistar Kyoto rats (WKY2) with two-month follow-up served as controls. Animals were fed standard chow containing 0.6% phosphate. We measured creatinine clearance, urine albumin-to-creatinine ratio, renal interstitial fibrosis, inorganic phosphate (Pi) exchange, intact PTH and FGF23, Klotho, dickkopf-1, sclerostin. And assessed bone response by static histomorphometric indices and gene expression profiles. Results: Mild CKD groups had no increase in renal Pi excretion, FGF23 and PTH levels. Serum Pi, dickkopf-1, and sclerostin were higher in Nx6. Decrease in trabecular bone area and osteocyte number was obvious in SO6. Nx2 and Nx6 had additionally lower osteoblast number. The decline in eroded perimeter was only apparent in Nx6. Significant downregulation of genes related to Pi transport, MAPK, WNT, and BMP signaling accompanied histological alterations in Nx2 and Nx6. Conclusions: We found an association of mild CKD with histological and molecular features suggesting lower bone turnover, which occurred at normal levels of systemic Pi-regulating factors.
Keywords:
Chronic kidney disease
; bone remodeling
; static bone histomorphometry
; inorganic phosphate transporters
; intracellular signaling
1. Introduction
Inorganic phosphate (Pi) retention is a hallmark of progressive CKD [1]. Hyperphosphatemia, the indicator of a positive Pi balance, is a major predictor of adverse clinical events and a therapeutic target [2,3]. An increase in the level of circulating Pi typically develops at a significant decrease in nephron’s number (i.e. to <30–40%) [1]. Phosphate per se, independent of calcium and calcitriol, leads to the development of parathyroid gland hyperplasia and secondary hyperparathyroidism [4]. A response of systemic endocrine factors (i.e. PTH, FGF23) precedes hyperphosphatemia, likely counterbalancing renal Pi retention and delaying increase in serum Pi at earlier CKD [5,6,7,8,9]. Besides phosphate and calcium imbalance and its endocrine and paracrine environment overt CKD is also associated with progressive alterations of skeleton concurrently with myocardium remodeling and vascular calcification known as chronic kidney disease – mineral and bone disorder (CKD-MBD) [3,8,9,10,11,12,13].
There is a direct correlation between the degree of chronic kidney injury and skeleton abnormalities, which becomes apparent in almost all patients with end-stage renal disease [12,14,15,16]. CKD-MBD results in a variety of bone phenotypes [2,17,18,19,20,21]. Among them the osteitis fibrosa (a high bone turnover), adynamic bone disorder (a low bone turnover) or its combination are prevalent [2,6,7,8,10,11,12,13,14,15,16,17,18,19,20,21].
Most studies of CKD-MBD, however, were performed in animal or clinical models of overt CKD or end-stage renal disease [8,13,14,15,16,17,18,20]. Particularly, 5/6 nephrectomy or genetic models used in experimental CKD-MBD are characterized by at least 50% decline in GFR corresponding to moderate-to-severe human CKD [8,10,12]. Notably, bone alterations in these models occurred on the background of hyperphosphatemia [7,10,13] and significant changes in circulating levels of FGF23 [7,10,12,13], PTH [10], dickkopf-1 and sclerostin [8,12]. Contrariwise, a paucity of data on a bone remodeling at early CKD highlight an issue of the initial phases of CKD-MBD pathogenesis and related regulatory factors. Studies of bone turnover and associated molecular events in mild CKD prior to the hyperphosphatemia and the increase in Pi-regulatory hormones are currently lacking. This knowledge, however, might be of importance for the development of strategies aiming to prevent overt, mainly irreversible, consequences of CKD-MBD. In this study, we focused on in vivo assessment of molecular and cellular bone response to early stages of experimental CKD.
2. Results
2.1. Animal models of chronic kidney disease
2.1.1. Features of mild chronic kidney disease
All experimental groups (SO6, Nx2, Nx6) demonstrated 6-12-fold increase in albuminuria with either normal (SO6) or decreased by 30% (Nx2, Nx6) creatinine clearance (CCr) compared to control (Table). Additionally, serum Klotho decline and mild, but statistically significant, increase in IF area were obvious in all experimental groups (Table). Albuminuria, serum Klotho, CCr, and IF area in SO2 did not differ from genetic control (WKY2) (Table).
Table. Parameters studied in sham-operated and nephrectomised rats.

| Groups Name |
Group 1 WKY2 |
Group 2 SO2 |
Group 3 SO6 |
Group 4 Nx2 |
Group 5 Nx6 |
|---|---|---|---|---|---|
| Strain | Wistar Kyoto rats | Spontaneously hypertensive rats | |||
| Model | normotensive control | control | mild CKD models | ||
| Surgery | sham-operated | sham-operated | sham-operated | 3/4 nephrectomy | 3/4 nephrectomy |
| Duration of the experiment, mo | 2 | 2 | 6 | 2 | 6 |
| Rats number, n | 8 | 8 | 8 | 8 | 8 |
| Systolic blood pressure, mmHg | 135 (130-142)2-4# | 170 (160-182) 3,4*5# | 195 (183-200) | 195 (180-205) | 208 (195-223) |
| Serum creatinine, mmol/L | 74.0 (69.0;79.5)3-5# | 73.0 (67.5;77.0)3-5‡ | 83.2 (80.5;85.5)4,5# | 92.5 (91.0;97.0)5# |
106.5 (101.5;110.0) |
| Urea, mmol/L | 4.89 (3.81;6.93)3-5# | 5.36 (4.19;6.41)4,5† | 5.37 (4.36;7.09) 4,5# | 7.10 (6.95;7.58) 5# | 10.7 (9.63;12.4) |
| Creatinine clearance, ml/min/100g | 0.20 (0.15;0.26) | 0.27 (0.20;0.35) 4,5‡ | 0.23 (0.14;0.30) | 0.19 (0.16;0.23) | 0.19 (0.16;0.25) |
| Urinary albumin/ creatinine, mg/mg | 0.026 (0.017;0.035)3-5# | 0.043 (0.031;0.065)3-5‡ | 0.288 (0.237;0.336) | 0.327 (0.153-0.370) | 0.543 (0.345;1.114) |
| Renal interstitial fibrosis, % | 2.5 (1.6;3.1)3-5# | 1.9 (0.1;3.3)3-5# | 5.8 (3.5;7.2)5# | 6.9 (3.9;7.7)5# | 14.5 (13.2;17.2) |
| Serum Klotho, pg/ml | 2698 (2413;2831) |
2916 (2520;5374)3-5* |
2043 (1676;2663) |
2304 (2074;2524) | 2259 (1428;2696) |
| Serum inorganic phosphate, mmol/L | 1.47 (1.22-1.60)3-5# | 1.89 (1.79;1.95)5* | 1.90 (1.80;1.98)5‡ | 1.60 (1.50;1.84)5* | 2.21 (2.15;2.28) |
| Urinary phosphate/ creatinine, mg/mg | 5.6 (4.5;6.5)5* | 8.9 (6.9;10.1) | 8.6 (7.9;9.8) | 10.1 (7.6;12.7) | 9.3 (8.9;11.2) |
| Bone phosphorus, g/kg | 58.6 (33.4;62.7) | 63.5 (58.1;64.5) | 62.8 (61.8;64.1) | 62.8 (55.2;65.6) | 59.7 (58.9;63.6) |
| Kidney phosphorus, mg/kg | 818.6 (770.5;877.4) |
872.0 (606.7;1241.5) | 822.9 (637.7;1024.4) | 699.9 (668.1;825.9) | 734.2 (671.1;862.1) |
| Intact parathyroid hormone, pg/ml | 55.1(12.7;112.9) | 76.6 (18.4;111.0) | 45.5 (12.6;67.1) | 45.9 (21.2;76.6) | 33.5 (9.6;84.9) |
| Intact fibroblast growth factor 23, pg/ml | 351.9 (290.1;836.7) | 361.7 (330.8;1530.3) | 468.0 (326.9;694.9) | 676.0 (330.9;793.7) | 630.7 (330.8;953.1) |
Superscripts show p-values vs named groups; * p < 0.05, † p < 0.01, ‡ p < 0.005, # p < 0.001.
2.1.2. Phosphate and its regulators
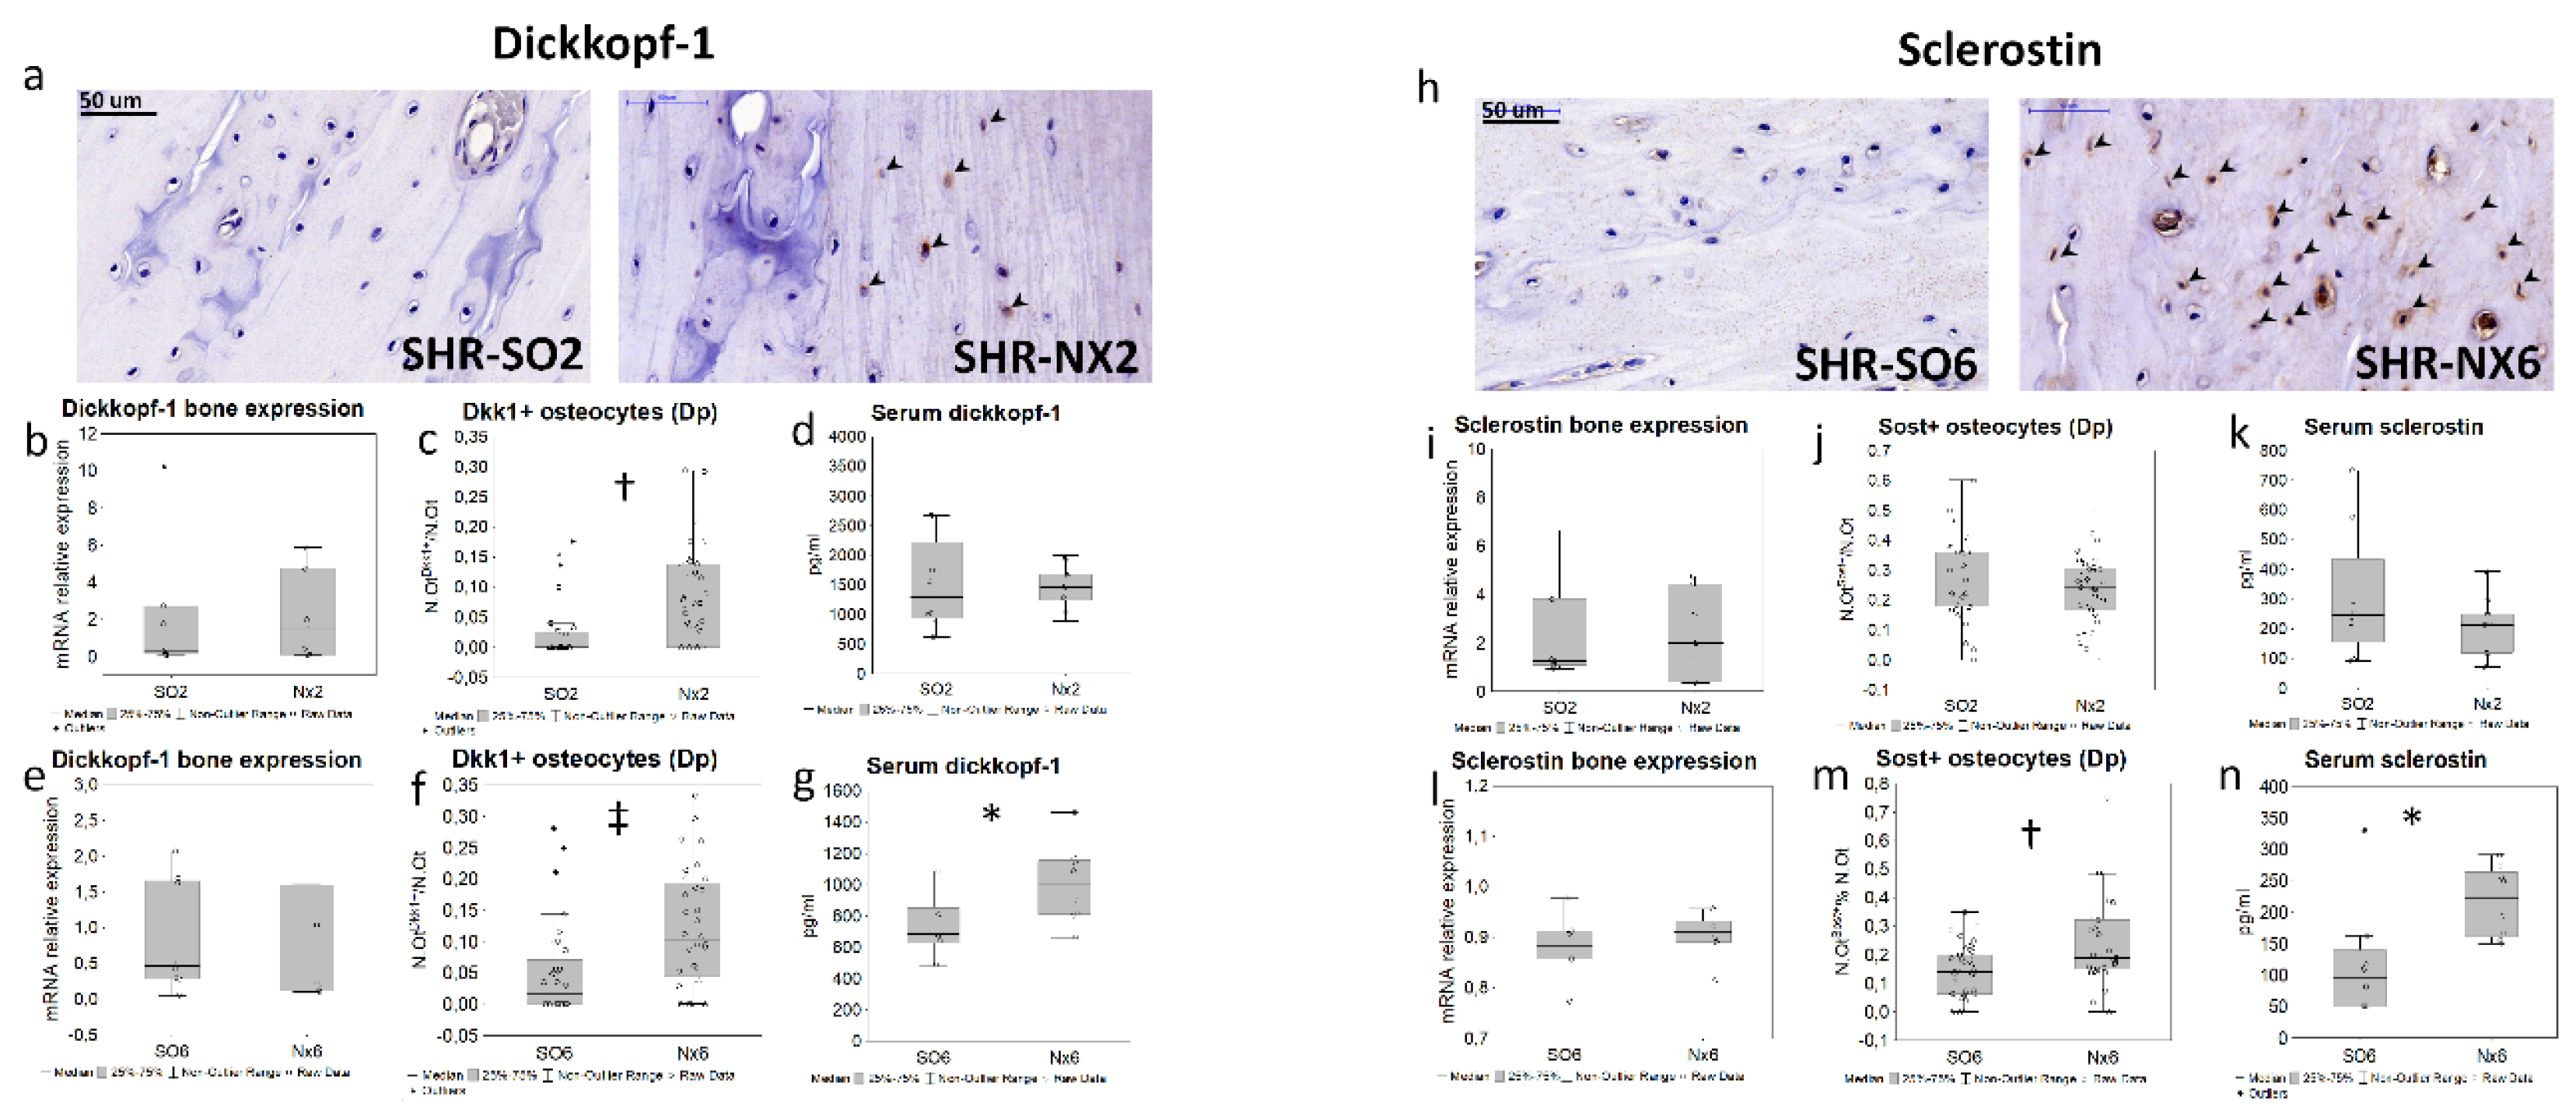
Serum level of Pi did not increase in SO6, Nx2, and was higher in Nx6 compared to control and other experimental groups (Table). Urinary Pi excretion, bone and kidney tissue phosphorus content did not change between study groups (Table). We observed no inter-group differences in FGF23 and PTH levels (Table). Only Nx6 animals had significantly elevated serum dickkopf-1 and sclerostin concentrations (Figure 2g,n).
2.1.3. Static bone histomorphometry
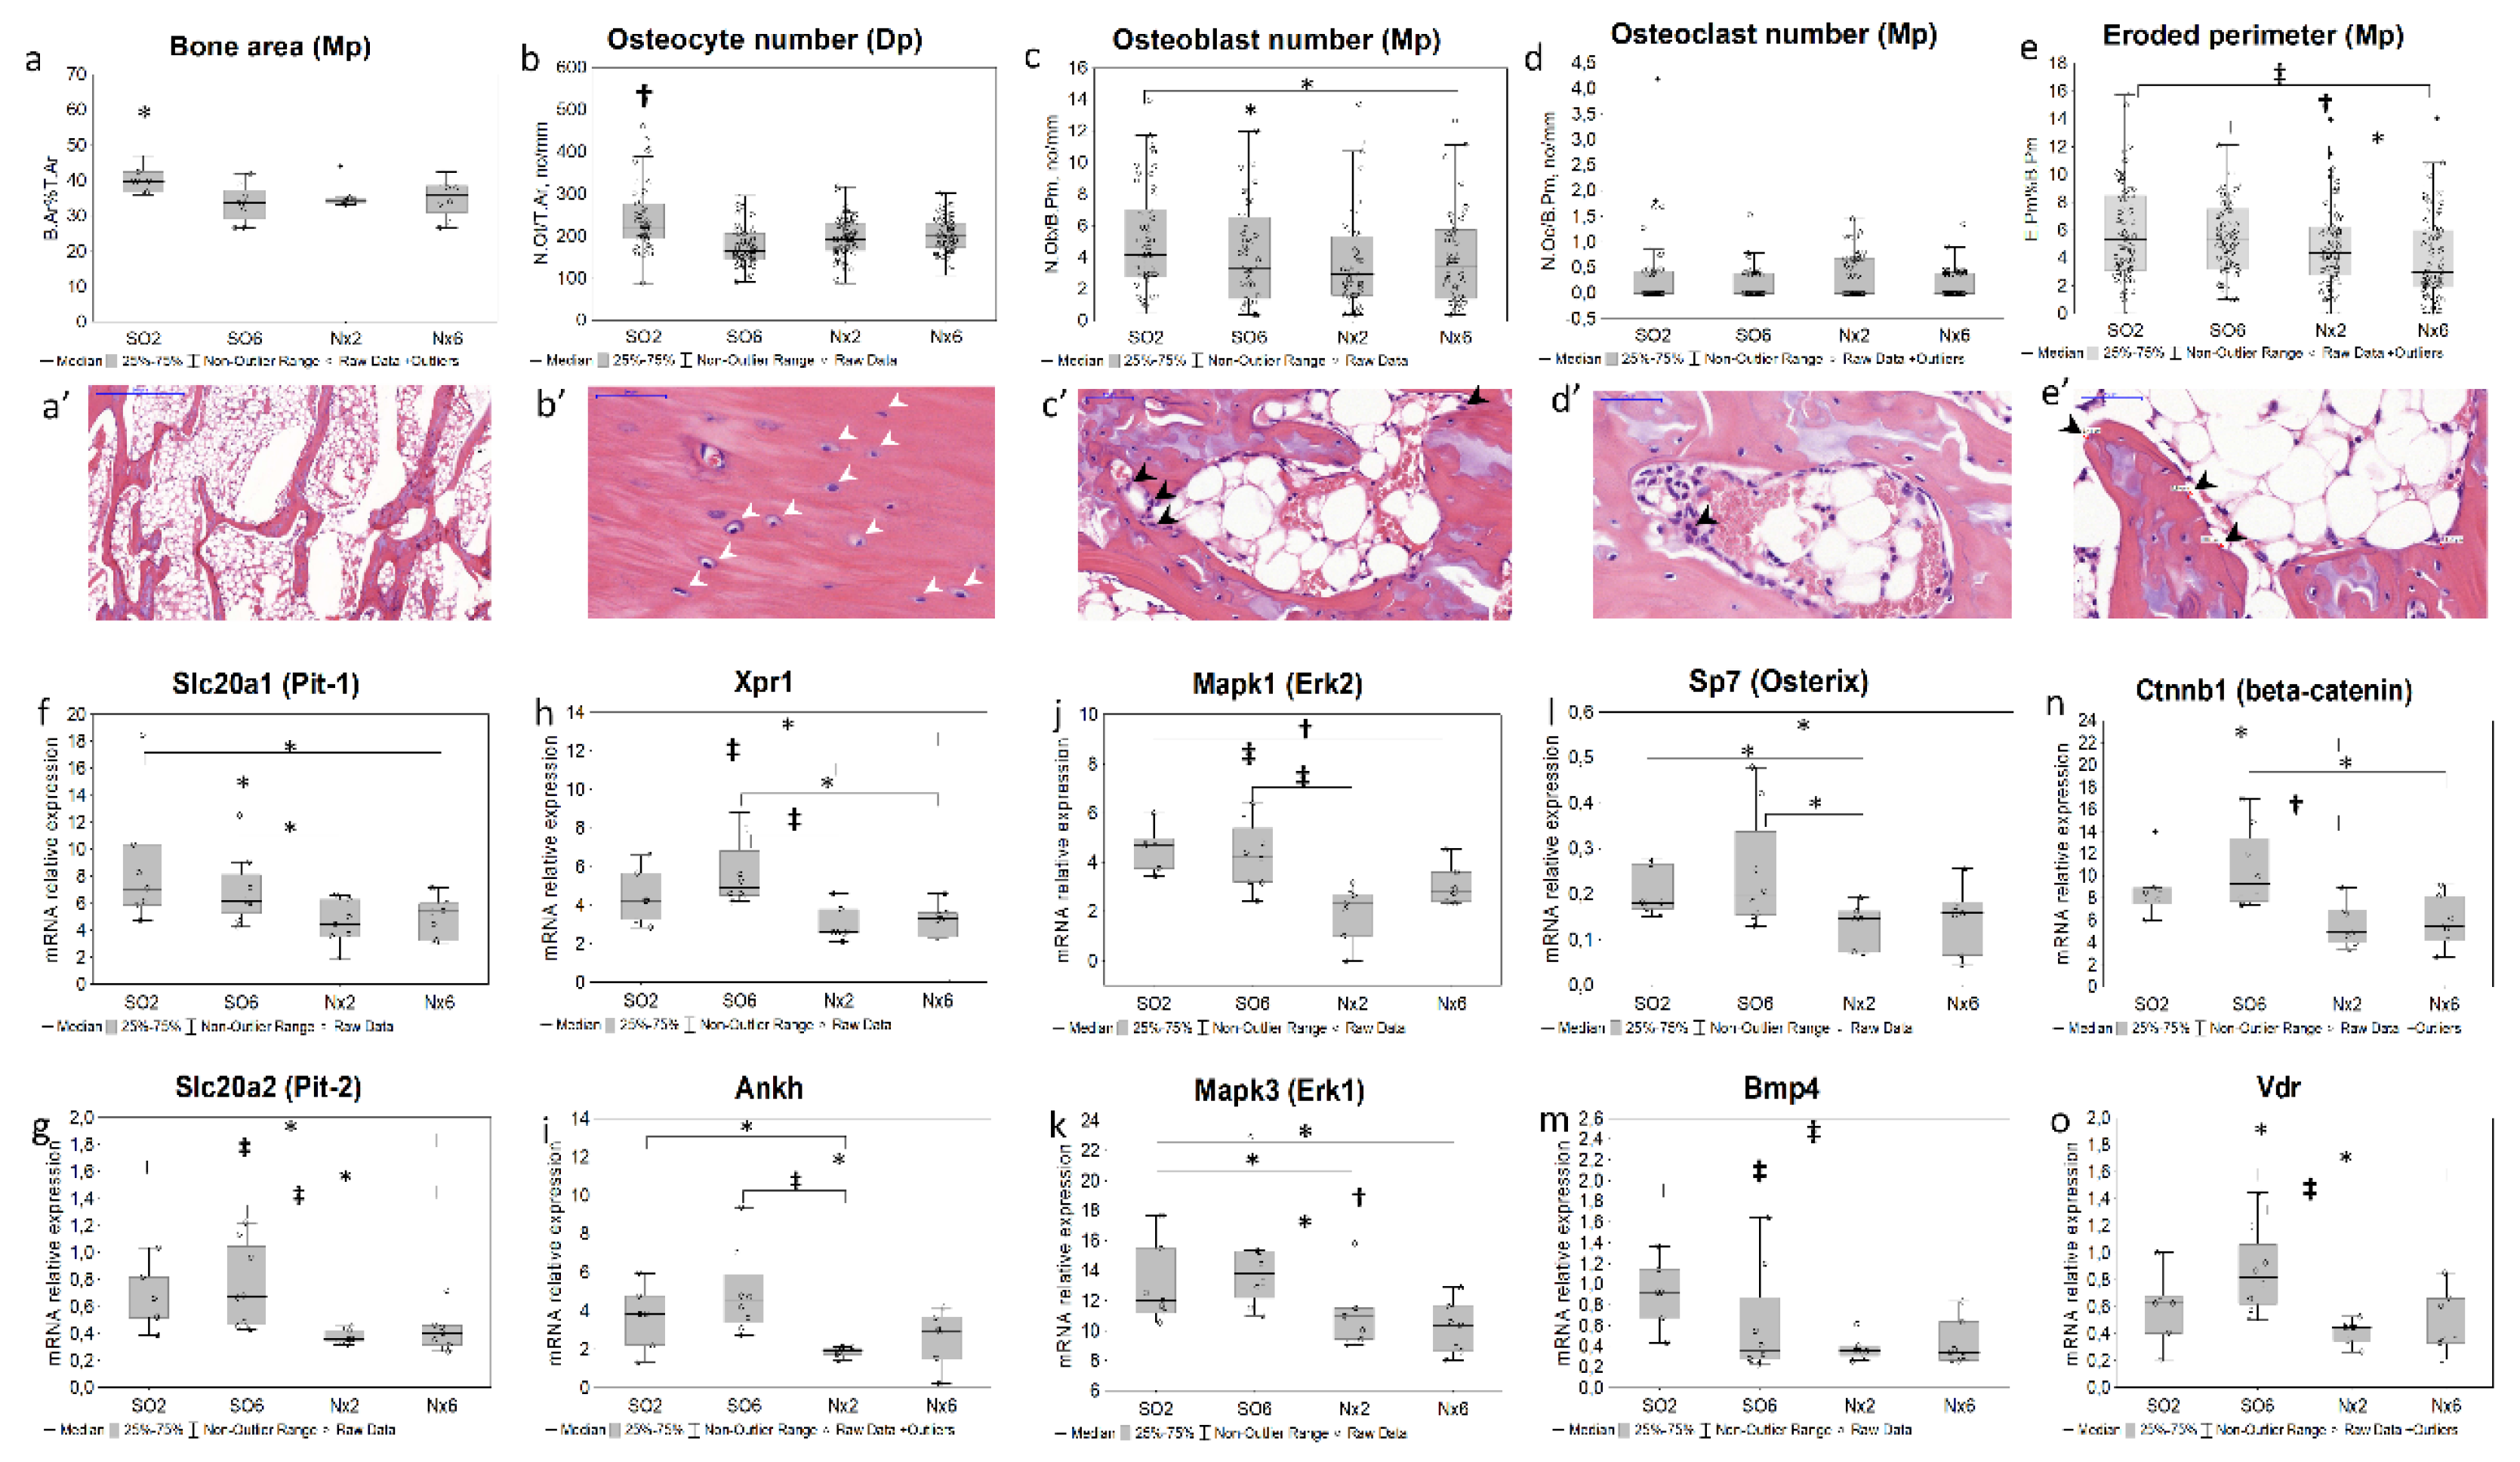
Subtle but statistically significant decrease in trabecular bone area (Figure 1a-a’) and osteocyte number in diaphyseal (Figure 1b-b’) and metaphyseal (data not shown) regions occurred in SO6 compared with SO2. Having more advanced kidney injury, Nx2 and Nx6 groups additionally exhibited lower osteoblast number (Figure 1 c-c’). The decline in eroded perimeter (Figure 1 e-e’) was also apparent in Nx6. Osteoclast number (Figure 1 d-d’) did not significantly differ between study groups.
2.2. Bone gene expression in mild chronic kidney disease models
We found a significant downregulation of genes related to Pi transport (Slc20a1 (PiT-1), Slc20a2 (PiT-2), Xpr1, Ankh; Figure 1f-i) and cellular signaling (Mapk1/3, Bmp4, Ctnnb1, Sp7, Vdr, Figure 1j–o; Fgfr2, Table S2) in Nx2 and Nx6 groups, but not in SO6. Bone expressions of Dkk1 (Figure 2 b, e), Sost (Figure 2 i,l), Kl, Fgf23, Lgr4, Tnfrsf11b, Tnfsf11, Cyp27b1, Sfrp2, Fzd2, Wnt10b (Table S2) did not differ significantly between groups.
2.3. Bone immunohistochemistry in mild chronic kidney disease models
Dickkopf-1-positive staining was found in osteocytes (Figure 2a), endotheliocytes, cartilage cells and extracellular matrix within cartilage zone (data not shown). Sclerostin expressed in osteocytes, endotheliocytes (Figure 2h), chondroblasts, and bone marrow cells (data not shown). In Nx2, the proportion of dickkopf-1-positive osteocytes in diaphysis increased in Nx2 versus SO2 (Figure 2j), while sclerostin-positive osteocytes remained unchanged (Figure 2c). In Nx6, the percentage of both dickkopf-1 and sclerostin-positive osteocytes in the diaphyseal region was higher compared to SO6 (Figure 2f,m), with no differences between SO6 and SO2.
Figure 2.
Bone and serum dickkopf-1 and sclerostin levels in mild CKD models; representative microphotographs for bone dickkopf-1 (a) and sclerostine (h) IHC staining in the distal diaphyseal region (black arrowheads — IHC-positive osteocytes); the levels of Dkk1 (b,e) and Sost (i,l) mRNA bone expression; the ratio of dickkopf-1-positive (N.OtDkk1+/N.Ot; N=160, n=40 for each group; c,f) and sclerostin-positive osteocytes (N.OtSost+/N.Ot; N=160, n=40 for each group; j,m) in the diaphyseal region; serum dickkopf-1 (d,g) and sclerostin (k,n) levels; * p < 0.05, † p < 0.01, ‡ p < 0.005.
3. Discussion
The study focused on bone changes at earlier stages of experimental CKD. Taking into consideration the evidence of bone remodeling in more advanced CKD [2,6,8,13,18,19,20], here we found that even mild kidney dysfunction is also associated with a bone response. The latter included decline in trabecular bone area, active osteoblast and osteocyte number, and eroded perimeter in used CKD models.
Notably, that compared to controls, sham operated SHR (SO6) have already had features of CKD in the background of hypertension, manifesting as an albuminuria and decreased serum Klotho level. Nephrectomised animals additionally had a significant change in CCr and IF, on average not exceeding 30% vs controls (Table). Thus, kidney injury in applied experimental models approximately corresponded to stages 1-2 of human CKD.
Unlike other studies, this approach allowed us assessing a bone response to CKD before the development of hyperphosphatemia and elevation of conventional phosphate regulatory factors, FGF23 and PTH [11,13,20,21,25]. Nonetheless, we observed an increase in serum Pi, sclerostin and dickkopf-1 levels in Nx6 animals consistent with prior studies of more advanced CKD models [2,6,8,13,20].
Bone turnover is a simultaneous process of synthesis and resorption. In applied CKD models, a decline in active osteoblasts, trabecular bone, and eroded perimeter could represent an initial reduction in bone formation [26]. Previous studies showed that changes in similar bone indices mediated by experimental kidney dysfunction independently of low PTH levels induced by parathyroidectomy [8,12].
In our experimental CKD groups with unchanged basal serum PTH and FGF23 levels, we also observed histological bone alterations that tended to be aggravated by an extent of chronic kidney injury.
Although there are no clear recommendations for using osteocyte-related indices in assessing bone remodeling [24], osteocyte phenotype alterations and apoptosis associated with experimental kidney dysfunction and Pi loading [8,27]. The latter likely underlie the reduction in osteocyte number, consistently observed in all studied CKD models.
To capture the early molecular events in the progression of CKD-MBD we examined pathways associated with bone remodeling at the gene expression level. In parallel with the bone histomorphometric alterations in Nx2 and Nx6, we found the down-regulation of gene expression profile related to osteoblastogenesis (Sp7 [28], Ctnnb1 [29], Bmp4 [30]), and Pi transport and sensing (Slc20a1, Slc20a2, Xpr1, Ankh, Fgfr2, Mapk1, Mapk3 [31,32]). Contrariwise, there were differences neither in osteoclast number nor in osteoclast regulatory genes expression (Tnfrsf11B, Tnfsf11, Lgr4 [9]) between experimental groups and controls.
The studied gene expression profile remained unchanged compared to controls in the earliest CKD model (SO6), associated with albuminuria and Klotho decline only. Observed decrease in the osteocyte number without the change in osteoblasts in SO6 model, likely point out a disorder of osteocyte maturation or increased apoptosis [8,27]. Our data did not confirm a reduced bone Dmp1 expression, as one of potential mechanisms of osteocyte apoptosis and maturation delay [33], while other pathways involved in the osteocyte regulation at early CKD require further investigation.
In prior studies, down-regulation of Ctnnb1 (β-catenin) might represent the canonical WNT repression mediated by its inhibitors (iWnt) as a mechanism of osteoblastogenesis alterations [6]. However, we found that in Nx2 and Nx6, a decline in Ctnnb1 mRNA occurred in the absence of a significant elevation in bone expression of iWnt genes, Dkk1, Sost and Sfrp2. At the same time, an increase in the number of dickkopf-1 and sclerostin positive osteocytes, and serum iWnt levels was apparent in Nx6. These findings could suggest the role of post-translational modification and stability in cytoplasm, in the maintenance of these proteins’ levels and WNT inhibitory functions, rather than gene expression regulation. Additionally, downregulation in genes of osteoblast pathways, WNT and MAPK, might be also mediated by significant downregulation in Fgfr2 and Bmp4 (Table S2, Figure 1) consistent with other studies [34,35].
The Pi transport systems (Slc20a1, Slc20a2, Xpr1, Ankh) are important for osteoblasts and osteoclasts differentiation, bone resorption and matrix mineralization [36,37,38,39]. According to our data, the downregulation in these genes and their eventual downstream signaling (Fgfr2, Mapk1/3, Bmp4, Ctnnb1) appears to be an early bone response to mild CKD in addition to histological features of lower bone turnover in Nx2 and Nx6. These transporters, particularly, Pit-1 and Pit-2, are regulated by ambient Pi, likely serving Pi sensing, controlling the phosphate cell content and transcription [31,32]. The effects of Pi on an expression of genes related to its transport and or sensing may have an opposite direction, being dose- and time-dependent [34,40].
Short-term response to Pi or hydroxyapatite exposure in cell media was found to be associated with up-regulation in Pi transporters (Slc20a1, Slc20a2) and downstream MAPK signals [31,40]. Contrariwise, in Nx6 animals exhibited hyperphosphatemia, we found Slc20a1/2, Xpr1, and Mapk1/3 to be downregulated, suggesting opposite effects of longer bone exposure to increased extracellular Pi in regulation of gene expression.
However, in Nx2 CKD model, similar pattern of gene expression profile was obvious in the absence of serum Pi elevation. One reasonable explanation is that postprandial serum Pi load and local Pi distribution may be implicated in transcription regulation even in fasting normophosphatemia. The simultaneous down-regulation of Pi transport and export systems seems to prevent bone Pi overload, since the total bone phosphorus content was unchanged in all mild CKD models. Consequently, a decrease in Pi-buffering capacity of skeleton in settings of CKD-induced Pi imbalance could predispose to further re-distribution of this anion toward cardiovascular tissues. One cannot also rule out the existence of Pi-independent mechanisms of early bone remodeling, including the impact of various growth factors, hormones, and neurotransmitters produced by bone marrow, adipose, vascular, and nervous bone compartments.
Research Limitations
Our research has several limitations. First, we did not perform dynamic histomorphometry of bone and mineralization indexes. However, in this exploratory study, we found the difference between CKD groups and controls using histomorphometric assessment of static bone parameters and gene expression profiles that tightly related to bone turnover as indicated earlier [9,12,29,30]. Next, serum Pi levels, its excretion and regulatory factors were assessed only in the fasting statement. Thus, we were not able to evaluate whether diurnal variations of Pi and its postprandial load in CKD have an impact on a bone histology and gene expression profile. Additionally, to elucidate the role of intestinal Pi load, it seemed feasible to include groups fed a high phosphate diet. However, in planning of this study we intentionally did not include such groups to avoid hyperphosphatemia and secondary hyperparathyroidism, exerting well-known effects on bone turnover.
4. Materials and Methods
Animals
Animals were obtained from Pavlov Institute of Physiology (Saint Petersburg, Russia). The study was conducted according to the Code of Practice for the Housing and Care of Animals Used in Scientific Procedures and approved by the local Ethics Committee of Pavlov First Saint Petersburg State Medical University (protocol code № 206, 23 April 2018).
Adult male spontaneously hypertensive rats (SHR) and Wistar Kyoto (WKY) rats weighting 190-230 g were housed using a 12-h/ 12-h daylight cycle at room temperature (20-22 oC) with ad libitum access to water and standard rat chow containing 0.6% phosphate.
We induced mild CKD in SHR by arterial hypertension (AH) exposure combined with sham operation (SO) or 3/4 nephrectomy (Nx) (Table). SHR with two-month AH exposure served as controls (SO2). Experimental groups were AH exposure for six-months combined with sham operation (SO6); or 3/4 nephrectomy with two- or six-months experiment duration (Nx2 and Nx6, respectively). SO WKY rats with two-month experiment duration (WKY2) were the genetic control.
Systolic blood pressure was measured the day before the euthanasia via a tail-cuff method using an electrometer (ELEMA, Sweden) and registered at a paper speed 10 mm/s. Blood, left-side kidney and tibia samples were harvested immediately after sacrifice. 24-h urine samples were collected a day before.
Laboratory measurements
The blood and 24-h urine samples were centrifuged at 3000 rpm for 10 min, aliquoted, and stored at −80 °C with temperature control. The stored samples underwent a single thaw followed by assays. The levels of creatinine (by enzymatic method), Pi, and urea were measured using reagent kits on SYNCHRON CX DELTA (Beckman Coulter, USA). The levels of urinary albumin were measured by immunoturbidimetry using reagent kits (Vital, Saint Petersburg, Russia) on analyzer CA-90 (Furuno, Japan). The levels of intact PTH and intact FGF23, dickkopf-1, sclerostin were measured using a MILLIPLEX MAP «Rat Bone Magnetic Bead Panel 1» (EDM Millipore Corporation, Billerica, MA01821, USA) on Bio-Plex 200 Reader (BioRad, USA), and serum α-Klotho – using ELISA Kit for Rat (Cloud-Clone Corp., Katy, TX77494, USA) on Microplate Reader Immunochem 2100 (High Technology, USA).
Inductively coupled plasma atomic emission spectroscopy
Tibial diaphysis and kidney were sampled and stored at −80 °C with temperature control. An inductively coupled plasma-atomic emission spectrometry method was used for the measuring of phosphorus in bone and kidney. The specimens were mineralized by nitric acid (Merck, Darmstadt, Germany) with subsequent microwave decomposition: temperature-time ramp for 20 min with a final temperature of 210 °C, then 25 min hold time at 1,500 W at 210 °C. The analysis was performed with an ICPE-9000 (Shimadzu, Japan) with the following parameters: radio frequency power 1,550 W, sample depth 10 mm, carrier gas 0.65 L/min, nebulizer pump 0.10 rps, spray chamber temperature 13 °C (55.4 °F), and dilution gas 0.40 L/min as described previously [22].
Real-time polymerase chain reaction
Tibial diaphysis were flushed with phosphate-buffered saline to remove all the bone marrow and were incubated overnight at 4 oС with RNAlater solution (Evrogen, Moscow, Russia) and then stored at −80 °C with temperature control. Then bone samples were ground to a fine powder using a mortar and pestle under liquid nitrogen in RNase-free conditions. Total RNA was extracted using TriZ reagent RNA Kit (Inogene, Saint Petersburg, Russia) following the manufacturer's instruction. The extracted RNA was eluted in RNAse free water. A reverse transcriptase reaction was performed with RevertAid First Strand cDNA Synthesis Kit (Thermo Scientific, Waltham, MA02451, USA). For each generated cDNA sample, multiplex qPCR was performed for genes of interest and glyceraldehyde-3-phosphate-dehydrogenase (Table S1). All reactions were adapted from the manufacturer’s protocol (Syntol, Moscow, Russia, M-428), containing 2.5 mM each dNTP, x10PCR buffer, 5 Units of Taq-DNA polymerase and 2.5µl of 25 mM MgCl2, supplemented with 7 pmol of each gene-specific primers, 5 pmol of Taqman probes for the genes of interest and glyceraldehyde-3-phosphate-dehydrogenase. The final reaction volume was 25 µl. Quantitative real-time PCR was performed with BioRad CFX 96 (BioRad, USA). The amplification protocol was 95 °С for 10 min followed by 45 cycles of heating at 95 °С (15 sec), annealing at 60 °С (1 min), and signal detection. Relative expression gene of interest level was calculated as Delta Ct Method and expressed as a percent value.
Histology and immunohistochemistry
Two-mm midcoronal renal slices and tibial distal metaphysis with diaphysis were fixed in buffered 4% formaldehyde for 24-hours and for 48-hours, correspondently. Afterward, tibial samples were washed in distilled water followed by 10% EDTA (pH 7.4) incubation for around two months (needle test). EDTA solution was replaced twice a week. Processed tissues were embedded in paraffin and cut at two-micron sections, dewaxed, rehydrated and stained.
For bone IHC after retrieval with Proteinase K for 20 min at 37 oС and endogen peroxidase blocking, sections were incubated with rabbit polyclonal antibodies to dickkopf-1 (1:400 dilution, ab109416, Abcam, Cambridge, United Kingdom), and sclerostin (1:100 dilution, ab63097, Abcam, United Kingdom) overnight at 4 oС followed by anti-rabbit Histofine® Simple StainTM MAX PO I detection system for 30 min at room temperature (Nichirei Biosciences Inc., Tokyo, Japan). A 3,3-diaminobenzidine Histofine® DAB-3S kit (Nichirei Biosciences Inc., Tokyo, Japan) was used as the chromogen. Finally, the slides were counterstained with hematoxylin and mounted after dehydration.
Quantitative morphometry
Renal interstitial fibrosis (IF) area, static bone histomorphometric indices, and IHC-positive osteocyes were calculated quantitatively with the two examiners blinded to the study groups who examined ten fields of view (FOV; 400x magnification, 10x/22) for section or whole slide image (WSI) using freeware Orbit Image Analysis Version 3.64 and Pannoramic Viewer 1.15.4.
IF was measured at the renal cortex on the areas without glomeruli in ten random FOV for slide and expressed as a percent of Masson’s trichrome stained blue color area using Orbit Image Analysis. The mean values for each animal were analyzed afterward.
Bone histomorphometric parameters were measured in compliance with «Bone research protocols, Methods in molecular biology (Histomorphometry in Rodents)» [23] and the recommendations of the nomenclature committee of the American Society for Bone and Mineral Research [24].
To quantify the bone area in the metaphyseal region, the trabecular bone area and bone tissue area were measured in three WSIs for sections spaced at least 100 um from each other. Trabecular bone area was standardized to bone tissue area (B.Ar%T.Ar) and the mean values of three measurements for each animal were analyzed (N=96, n=8 for each group).
The number of active osteoblasts (N.Ob) and osteoclasts (N.Oc), eroded perimeter (E.Pm) and bone perimeter (B.Pm) in the metaphyseal region; the number of osteocytes (N.Ot) in the metaphyseal and the diaphyseal regions were calculated in ten FOVs for each animal. N.Ob, N.Oc and E.Pm were standardized to B.Pm (the number of FOVs for each parameter – N(N.Ob/B.Pm)=320, N(N.Oc/B.Pm)=299, N(E.Pm/B.Pm)=320). N.Ot were standardized to bone tissue area (the number of FOVs: N(N.Ot/T.Ar)=261 in the diaphyseal region). The values for individual FOV were used for statistical tests.
To quantify the bone expression of dickkopf-1 and sclerostin, IHC-staining was classified as “present” or “absent” in any given osteocyte, and the total number of osteocytes with positive staining was counted and normalized to all osteocytes in five FOVs in the diaphyseal region for section using Orbit Image Analysis (N.OtDkk1+/N.Ot, N=160, n=40 for each group; N.OtSost+/N.Ot, N=160, n=40 for each group). These normalized values were used for further statistical tests.
Statistical analyses
Analyses were performed using SAS version 9.4 (SAS Institute Inc., Cary, NC, USA). Values are expressed as median [interquartile range (IQR)]. Groups were compared using a two-tailed Mann-Whitney U-test and Kruskal-Wallis H-test. Statistical significance was defined as P-values <0.05.
5. Conclusions
In conclusion, the bone response to mild experimental CKD associated with histological and molecular alterations that are suggestive for lower bone turnover. These findings could have relevance to the clinical setting of CKD-MBD, particularly, being of importance for planning further experimental and human research in this area, focusing on pathophysiology, early recognition and prevention of the disease progression.
Supplementary Materials
The following supporting information can be downloaded at: www.mdpi.com/xxx/s1, Table S1: Primer and probe sequences for RT-PCR; Table S2: Bone mRNA relative expressions (tibial diaphysis).
Author Contributions
Conceptualization, Evdokia Bogdanova and Vladimir Dobronravov; methodology, Evdokia Bogdanova, Airat Sadykov, Irina Zubina, Natalia Semenova, Olga Beresneva, Galina Ivanova and Marina Parastaeva; validation, Olga Galkina, Natalia Semenova; formal analysis, Evdokia Bogdanova; investigation, Evdokia Bogdanova; resources, Evdokia Bogdanova, Airat Sadykov and Vladimir Dobronravov; data curation, Irina Zubina; writing—original draft preparation, Evdokia Bogdanova; writing—review and editing, Vladimir Dobronravov; visualization, Evdokia Bogdanova, Natalia Semenova and Airat Sadykov; supervision, Evdokia Bogdanova; project administration, Evdokia Bogdanova; funding acquisition, Vladimir Dobronravov. All authors have read and agreed to the published version of the manuscript.
Funding
This research was funded by Russian Foundation for Basic Research, grant number 18-315-00342.
Institutional Review Board Statement
The animal study protocol was approved by the local Ethics Committee of Pavlov University (protocol code № 206, 23 April 2018).
Informed Consent Statement
Not applicable.
Data Availability Statement
All data presented in this study are available from the corresponding author on reasonable request.
Conflicts of Interest
The authors declare no conflict of interest. The funders had no role in the design of the study; in the collection, analyses, or interpretation of data; in the writing of the manuscript; or in the decision to publish the results.
References
- Hruska, K.A.; Mathew, S.; Lund, R. Hyperphosphatemia of chronic kidney disease. Kidney Int 2008, 74, 148–157. [Google Scholar] [CrossRef] [PubMed]
- Drüeke, T.B.; Massy, Z.A. Changing bone patterns with progression of chronic kidney disease. Kidney Int 2016, 89, 289–302. [Google Scholar] [CrossRef] [PubMed]
- Li, J.W.; Xu, C.; Fan, Y. Can serum levels of alkaline phosphatase and phosphate predict cardiovascular diseases and total mortality in individuals with preserved renal function? A systemic review and meta-analysis. PLoS One 2014, 9, e102276. [Google Scholar] [CrossRef] [PubMed]
- Bricker, N.S.; Morrin, P.A.; Kime, S.W. Jr. The pathologic physiology of chronic Bright's disease. An exposition of the "intact nephron hypothesis". Am J Med 1960, 28, 77–98. [Google Scholar] [CrossRef] [PubMed]
- Isakova, T.; Wolf, M.S. FGF23 or PTH: which comes first in CKD? Kidney Int 2010, 78, 947–949. [Google Scholar] [CrossRef]
- Sabbagh, Y.; Graciolli, F.G.; O'Brien, S. Repression of osteocyte Wnt/β-catenin signaling is an early event in the progression of renal osteodystrophy. J Bone Miner Res 2012, 27, 1757–1772. [Google Scholar] [CrossRef] [PubMed]
- Stubbs, J.R.; He, N.; Idiculla, A. Longitudinal evaluation of FGF23 changes and mineral metabolism abnormalities in a mouse model of chronic kidney disease. J Bone Miner Res 2012, 27, 38–46. [Google Scholar] [CrossRef] [PubMed]
- Ferreira, J.C.; Ferrari, G.O.; Neves, K.R. Effects of dietary phosphate on adynamic bone disease in rats with chronic kidney disease--role of sclerostin? PLoS One 2013, 8, e79721. [Google Scholar] [CrossRef] [PubMed]
- Carrillo-López, N.; Martínez-Arias, L.; Fernández-Villabrille, S. Role of the RANK/RANKL/OPG and Wnt/β-Catenin Systems in CKD Bone and Cardiovascular Disorders. Calcif Tissue Int 2021, 108, 439–451. [Google Scholar] [CrossRef] [PubMed]
- Moe, S.M.; Radcliffe, J.S.; White, K.E. The pathophysiology of early-stage chronic kidney disease-mineral bone disorder (CKD-MBD) and response to phosphate binders in the rat. J Bone Miner Res 2011, 26, 2672–2681. [Google Scholar] [CrossRef] [PubMed]
- Mathew, S.; Lund, R.J.; Strebeck, F. Reversal of the adynamic bone disorder and decreased vascular calcification in chronic kidney disease by sevelamer carbonate therapy. J Am Soc Nephrol 2007, 18, 122–130. [Google Scholar] [CrossRef]
- Iwasaki-Ishizuka, Y.; Yamato, H.; Nii-Kono, T. Downregulation of parathyroid hormone receptor gene expression and osteoblastic dysfunction associated with skeletal resistance to parathyroid hormone in a rat model of renal failure with low turnover bone. Nephrol Dial Transplant 2005, 20, 1904–1911. [Google Scholar] [CrossRef] [PubMed]
- Fang, Y.; Ginsberg, C.; Seifert, M. CKD-induced wingless/integration1 inhibitors and phosphorus cause the CKD-mineral and bone disorder. J Am Soc Nephrol 2014, 25, 1760–1773. [Google Scholar] [CrossRef] [PubMed]
- Magnusson, P.; Sharp, C.A.; Magnusson, M. Effect of chronic renal failure on bone turnover and bone alkaline phosphatase isoforms. Kidney Int 2001, 60, 257–265. [Google Scholar] [CrossRef] [PubMed]
- Nickolas, T.L.; Stein, E.M.; Dworakowski, E. Rapid cortical bone loss in patients with chronic kidney disease. J Bone Miner Res 2013, 28, 1811–1820. [Google Scholar] [CrossRef] [PubMed]
- Tasnim, N.; Dutta, P.; Nayeem, J. Osteoporosis, an Inevitable Circumstance of Chronic Kidney Disease: A Systematic Review. Cureus 2021, 13, e18488. [Google Scholar] [CrossRef] [PubMed]
- Malluche, H.H.; Ritz, E.; Lange, H.P. Bone histology in incipient and advanced renal failure. Kidney Int 1976, 9, 355–362. [Google Scholar] [CrossRef]
- Coen, G.; Mazzaferro, S.; Ballanti, P. Renal bone disease in 76 patients with varying degrees of predialysis chronic renal failure: a cross-sectional study. Nephrol Dial Transplant 1996, 11, 813–819. [Google Scholar] [CrossRef] [PubMed]
- Barreto, F.C.; Barreto, D.V.; Canziani, M.E. Association between indoxyl sulfate and bone histomorphometry in pre-dialysis chronic kidney disease patients. J Bras Nefrol 2014, 36, 289–296. [Google Scholar] [CrossRef]
- Graciolli, F.G.; Neves, K.R.; Barreto, F. The complexity of chronic kidney disease-mineral and bone disorder across stages of chronic kidney disease. Kidney Int 2017, 91, 1436–1446. [Google Scholar] [CrossRef]
- Misof, B.M.; Blouin, S.; Roschger, P. Bone matrix mineralization and osteocyte lacunae characteristics in patients with chronic kidney disease - mineral bone disorder (CKD-MBD). J Musculoskelet Neuronal Interact 2019, 19, 196–206. [Google Scholar] [PubMed]
- Fleischer, H.; Vorberg, E.; Thurow, K. et al. Determination of Calcium and Phosphor in Bones Using Microwave Digestion and ICP-MS. 5th IMEKO TC19 SYMPOSIUM, ISBN, 978-92-990073-6-5.
- Erben, R.G.; Glösmann, M. (2019). Histomorphometry in Rodents. In, pp. Idris, A. (eds) Bone Research Protocols. Methods in Molecular Biology, vol 1914. Humana Press, New York, NY.
- Dempster, D.W.; Compston, J.E.; Drezner, M.K. Standardized nomenclature, symbols, and units for bone histomorphometry: a 2012 update of the report of the ASBMR Histomorphometry Nomenclature Committee. J Bone Miner Res 2013, 28, 2–17. [Google Scholar] [CrossRef]
- Liao, H.W.; Huang, T.H.; Chang, Y.H. Exercise Alleviates Osteoporosis in Rats with Mild Chronic Kidney Disease by Decreasing Sclerostin Production. Int J Mol Sci 2019, 20, 2044. [Google Scholar] [CrossRef] [PubMed]
- Jørgensen, H.S.; Behets, G.; Viaene, L. Static histomorphometry allows for a diagnosis of bone turnover in renal osteodystrophy in the absence of tetracycline labels. Bone 2021, 152, 116066. [Google Scholar] [CrossRef] [PubMed]
- Metzger, C.E.; Swallow, E.A.; Stacy, A.J.; Allen, M.R. Strain-specific alterations in the skeletal response to adenine-induced chronic kidney disease are associated with differences in parathyroid hormone levels. Bone 2021, 148, 115963. [Google Scholar] [CrossRef] [PubMed]
- Hoshikawa, S.; Shimizu, K.; Watahiki, A. Phosphorylation-dependent osterix degradation negatively regulates osteoblast differentiation. FASEB J 2020, 34, 14930–14945. [Google Scholar] [CrossRef]
- Iezaki, T.; Onishi, Y. , Ozaki, K. et al. The Transcriptional Modulator Interferon-Related Developmental Regulator 1 in Osteoblasts Suppresses Bone Formation and Promotes Bone Resorption. J Bone Miner Res 2016, 31, 573–584. [Google Scholar] [CrossRef] [PubMed]
- Kubota, K.; Sakikawa, C.; Katsumata, M. Platelet-derived growth factor BB secreted from osteoclasts acts as an osteoblastogenesis inhibitory factor. J Bone Miner Res. 2002, 17, 257–265. [Google Scholar] [CrossRef]
- Ha, S.W.; Park, J.; Habib, M.M.; Beck, G.R. Jr. Nano-Hydroxyapatite Stimulation of Gene Expression Requires Fgf Receptor, Phosphate Transporter, and Erk1/2 Signaling. ACS Appl Mater Interfaces 2017, 9, 39185–39196. [Google Scholar] [CrossRef] [PubMed]
- Bon, N.; Couasnay, G.; Bourgine, A. Phosphate (Pi)-regulated heterodimerization of the high-affinity sodium-dependent Pi transporters PiT1/Slc20a1 and PiT2/Slc20a2 underlies extracellular Pi sensing independently of Pi uptake. J Biol Chem 2018, 293, 2102–2114. [Google Scholar] [CrossRef] [PubMed]
- Dussold, C.; Gerber, C.; White, S. DMP1 prevents osteocyte alterations, FGF23 elevation and left ventricular hypertrophy in mice with chronic kidney disease. Bone Res 2019, 7, p12. [Google Scholar] [CrossRef] [PubMed]
- Camalier, C.E.; Yi, M.; Yu, L.R. An integrated understanding of the physiological response to elevated extracellular phosphate. J Cell Physiol 2013, 228, 1536–1550. [Google Scholar] [CrossRef] [PubMed]
- Xu, W.; Luo, F.; Wang, Q. Inducible Activation of FGFR2 in Adult Mice Promotes Bone Formation After Bone Marrow Ablation. J Bone Miner Res 2017, 32, 2194–2206. [Google Scholar] [CrossRef] [PubMed]
- Yamada, S.; Wallingford, M.C.; Borgeia, S. Loss of PiT-2 results in abnormal bone development and decreased bone mineral density and length in mice. Biochem Biophys Res Commun 2018, 495, 553–559. [Google Scholar] [CrossRef] [PubMed]
- Albano, G.; Moor, M.; Dolder, S. Sodium-dependent phosphate transporters in osteoclast differentiation and function. PLoS One. 2015, 10, e0125104. [Google Scholar] [CrossRef] [PubMed]
- Giovannini, D.; Touhami, J.; Charnet, P.; Sitbon, M.; Battini, J.L. Inorganic phosphate export by the retrovirus receptor XPR1 in metazoans. Cell Rep 2013, 3, 1866–1873. [Google Scholar] [CrossRef] [PubMed]
- Szeri, F.; Niaziorimi, F.; Donnelly, S. The Mineralization Regulator ANKH Mediates Cellular Efflux of ATP, Not Pyrophosphate. J Bone Miner Res 2022, 37, 1024–1031. [Google Scholar] [CrossRef] [PubMed]
- Beck, L.; Beck-Cormier, S. Extracellular phosphate sensing in mammals: what do we know? J Mol Endocrinol 2020, 65, R53–R63. [Google Scholar] [CrossRef] [PubMed]
Figure 1.
Bone turnover in mild CKD models; static bone histomorphometry: a—bone area (B.Ar%T.Ar; N=96, n=8 for each group) and representative micropicture for the histological patterns (а’), * - p < 0.034 vs SO6, Nx2, Nx6; b,b’– osteocyte number in the diaphyseal (Dp) region (N.Ot/T.Ar, no/mm2; N=291, n(SO2)=72, n(SO6)=74, n(Nx2)=73, n(Nx6)=72), † p < 0.011 vs SO6, Nx2, Nx6; c-c’—osteoblast number in the metaphyseal (Mp) region (N.Ob/B.Pm, no/mm; N=320, n=80 for each group); d,d’—osteoclast number (N.Oc/B.Pm, no/mm; N=299, n(SO2)=74, n(SO6)=76, n(Nx2)=72, n(Nx6)=77), e,e’—eroded perimeter (E.Pm.%B.Pm; N=320, n=80 in each group); mRNA relative expression in bone: f—Slc20a1, solute carrier family 20 member 1 (Pit-1); g—Slc20a2, solute carrier family 20 member 2 (Pit2); h—Xpr1, xenotropic and polytropic retrovirus receptor 1; i—Ankh, ANKH pyrophosphate transport regulator; j—Mapk3, mitogen activated protein kinase 3 (Erk1); k—Mapk1, mitogen activated protein kinase 1 (Erk2); l—Sp7, transcription factor osterix; m—Bmp4, bone morphogenetic protein 4; n—Ctnnb1, catenin beta 1; o—Vdr, vitamin D receptor; * p < 0.05, †p <0.01, ‡p < 0.005.
Disclaimer/Publisher’s Note: The statements, opinions and data contained in all publications are solely those of the individual author(s) and contributor(s) and not of MDPI and/or the editor(s). MDPI and/or the editor(s) disclaim responsibility for any injury to people or property resulting from any ideas, methods, instructions or products referred to in the content. |
© 2023 by the authors. Licensee MDPI, Basel, Switzerland. This article is an open access article distributed under the terms and conditions of the Creative Commons Attribution (CC BY) license (http://creativecommons.org/licenses/by/4.0/).
Copyright: This open access article is published under a Creative Commons CC BY 4.0 license, which permit the free download, distribution, and reuse, provided that the author and preprint are cited in any reuse.


