

Submitted:
05 February 2023
Posted:
06 February 2023
Read the latest preprint version here
Abstract
The paper portrays a linear model for synchronous prediction of the dissolved oxygen (DO) level in a protected urban lake by using independent variables in real-time monitoring of the water quality parameters. Multi-linear regression and machine learning techniques were applied to the Dissolved Oxygen (DO) using the basic four parameters of Water Quality Index (WQI). Three real-time industry standard sensors PHEHT, CTZN, OPTOD were used for sampling, data was then interpolated through ArcGIS kriging method. 25 correlations were checked through the ML algorithm, a correlation heat map was produced and the top five relations were taken under consideration and validated by r-score and root mean squared error (RMSE) to develop the linear regression model. The performance of the model was validated through the RMSE, mean squared error (MSE), and mean absolute error (MAE) the r2 accuracy came to 0.983 when it is checked against the sample data. The suggested model can be used as a technique for unknown or malfunctioned sensor’s null DO data prediction.
Keywords:
Multiple Linear Regression
; Dissolve Oxygen
; Machine Learning
; Urban Lake
1. Introduction
Throughout many nations water purity is a precious, valuable and essential subject matter. Additionally, there seems to be a critical necessity to evaluate surface-water health because of the growing awareness of the relevance of water supply for human exposure and freshwater quality for the aquatic ecosystem (Ouyang, 2005). Urban lakes are essential for collecting precipitation, restocking aquifers, promoting leisure functions mostly in lake area, providing freshwater for crisis incidents like firefighting, disaster prevension, open spaces/clean air, and preserving ecosystem equilibrium (Cansu Filik Iscen, 2007). Freshwaters are degraded and rendered less useful for consumption, commerce, irrigation, sports, and perhaps other uses due to societal factors and also for some geological processes (S.R. Carpenter, 1998). Unplanned development causes major issues for urban lakes. The consequence of overexploitation upon those waterbodies can indeed be significant because of their magnitude, volume, or stagnancy (Bookmark, 2002).
Numerous water health forecasting models have been developed during recent decades (J.C.Chena, 2003). Conventional information analysis techniques, however, aren't adequate to address the issue because a significant variety of factors impacting the aquatic environment and have complex linear-nonlinear relationships with the WQI (Kunwar P.Singh, 2009). Additionally, because these phenomena are generally real-time structured, these simulations call for accurately calculated yield mathematically exponential for a variety of aqueous, mechanical, biochemical, and biological functions. These models too have governing solutions. Consequently, a strategy on observing water performance is required to conserve freshwater wealth (Pesce, 2000). Understanding various exogenic rotations of minerals and chemicals inside the land-fluvial-oceanic structure has been made easier with the advancement of the geochemical investigative study of watersheds, which mainly shows the complexity of such geochemical influences (L. Giridharan, 2010). Lake's hydro geochemical characteristics significantly influence significant role in influencing how it is used for farming, home consumption, and heavy industrial processes. Overall biochemistry as well as the condition of the water are primarily governed by where the water interacts further with geomorphic layers whereby it runs (T. Subramani, 2009).
For the period of January through December 2008, which included the three seasons of summertime, wintertime, and monsoon season, Nagpur City, Maharashtra (India), determined its water quality index (WQI) across various waterbodies, particularly lakes. The choice of gauging stations was made based upon the significance of each. The National Sanitation Foundation (NSF) data platform's water quality index tool is being used to compute the index. Overall determined (WQI) in the several lakes under research suggests moderate water condition during the rainy season, intermediate water health during the wintertime, while low water health during the summertime. All seasons, excluding the monsoon season, provided an average water ranking for Gorewada Reservoir. Mostly in the past 10 years, the appearance of Futala, Ambazari, and Gandhisagar Lakes has significantly decreased due to the intrusion of marine plants like (P.J. Puri, 2011). The study shows that the water quality index is indeed a unique value which indicates surface water health by aggregating several water conditioning variables. Their goal seems to be offering a clear and succinct way to convey quality of water throughout various needs. This project focuses upon tracking periodic changes in the water quality index from a few carefully chosen lakes and rivers. The indicator clarifies fundamental difficulties with water health, conveys water quality conditions, and shows the overall necessity or value of preventative measures. Across the course of such observation period, any variation of the WQI level often reflects fairly consistent pattern. Throughout all these consecutive seasons, this same source of water been reported as being of top condition (WQI: 67.7 through 78.5). Eventually, it is discovered that the lake's water freshness marginally declines between December through February due to the fact and as a consequence of the rising in microbial population increase in the presence of organic pollutants brought on by evaporation (Shobhana Ramteke, 2016)
Relevant research shows that several WQI indicators have been effective in locating contamination origins and determinants as well as comprehending seasonal and regional fluctuations affecting surface water condition monitoring (Prakash Raj Kannel, 2007). And then choose the variables to take into account and which ones to investigate are, nonetheless, still open for debate. Using the PCA method was examined in this research, and efforts were attempted to identify one of the most crucial measurement factors for determining changes in water health in the Shahr Chai River. Standard water health laws use quality grades depending upon precise groupings, but there is substantial uncertainty throughout the limitations within grades. The proximity to or distance mostly from the threshold of a factor impacts how concentrated it is. A particular batch may not contain all of the water quality indexes, in addition. Representing different quality batches in singular monitoring stations could make the given monitoring station's quality criterion clearer (Icaga, 2007). Recently, the utilization of various distinctive statistical methods, including discriminate analysis (DA), cluster analysis (CA), factor analysis (FA), as well as principal component analysis (PCA) had already provided an insightful tool for the dependable planning and management of water resources by assisting mostly in the identification of potential inputs that impact water ecosystem (Rajesh Reghunath, 2002) (P. Simeonova, 2003). These methods are usually used successfully in numerous scientific articles to categorize water contamination findings and find patterns in collections or other factors. WQI combines computationally the data from many waters’ performance measures, including such DO, EC, pH, BOD, and turbidity, together into specific numerical. Now, this number can also be used to evaluate the water health standards at various locations and look into long-term developments. Focusing on the requirements for any surface water health, numerous WQIs all around the globe employ varied metrics (Saffran, 2001) (Patrick Debels, 2005).
Throughout this research, correlation, as well as regression model, have been utilized to analyze water quality indexes, make inferences regarding the comparisons and differences that arise among the multiple water quality parameters. Using basic water quality parameters and pinpoint aspects and accuracy specifically related to researching a model to predict DO in Hahitjheel Lake, Gulshan, Bangladesh. Lastly, the impact of the contaminants on the indicators of the lake's health was established. This research paper is imperative to model Dissolved Oxygen (DO), in another case criticizing the environmental condition of Hatirjheel urban lake, Dhaka, Bangladesh. Moreover, the objectives are to.
- Development of a predictive linear model for Dissolved Oxygen of unknown lake water using basic water quality parameters.
- Accessing water health conditions, an insight into protected urban Hatirjheel lake, Dhaka, Bangladesh.
2. Materials and Methods
2.1. Study area
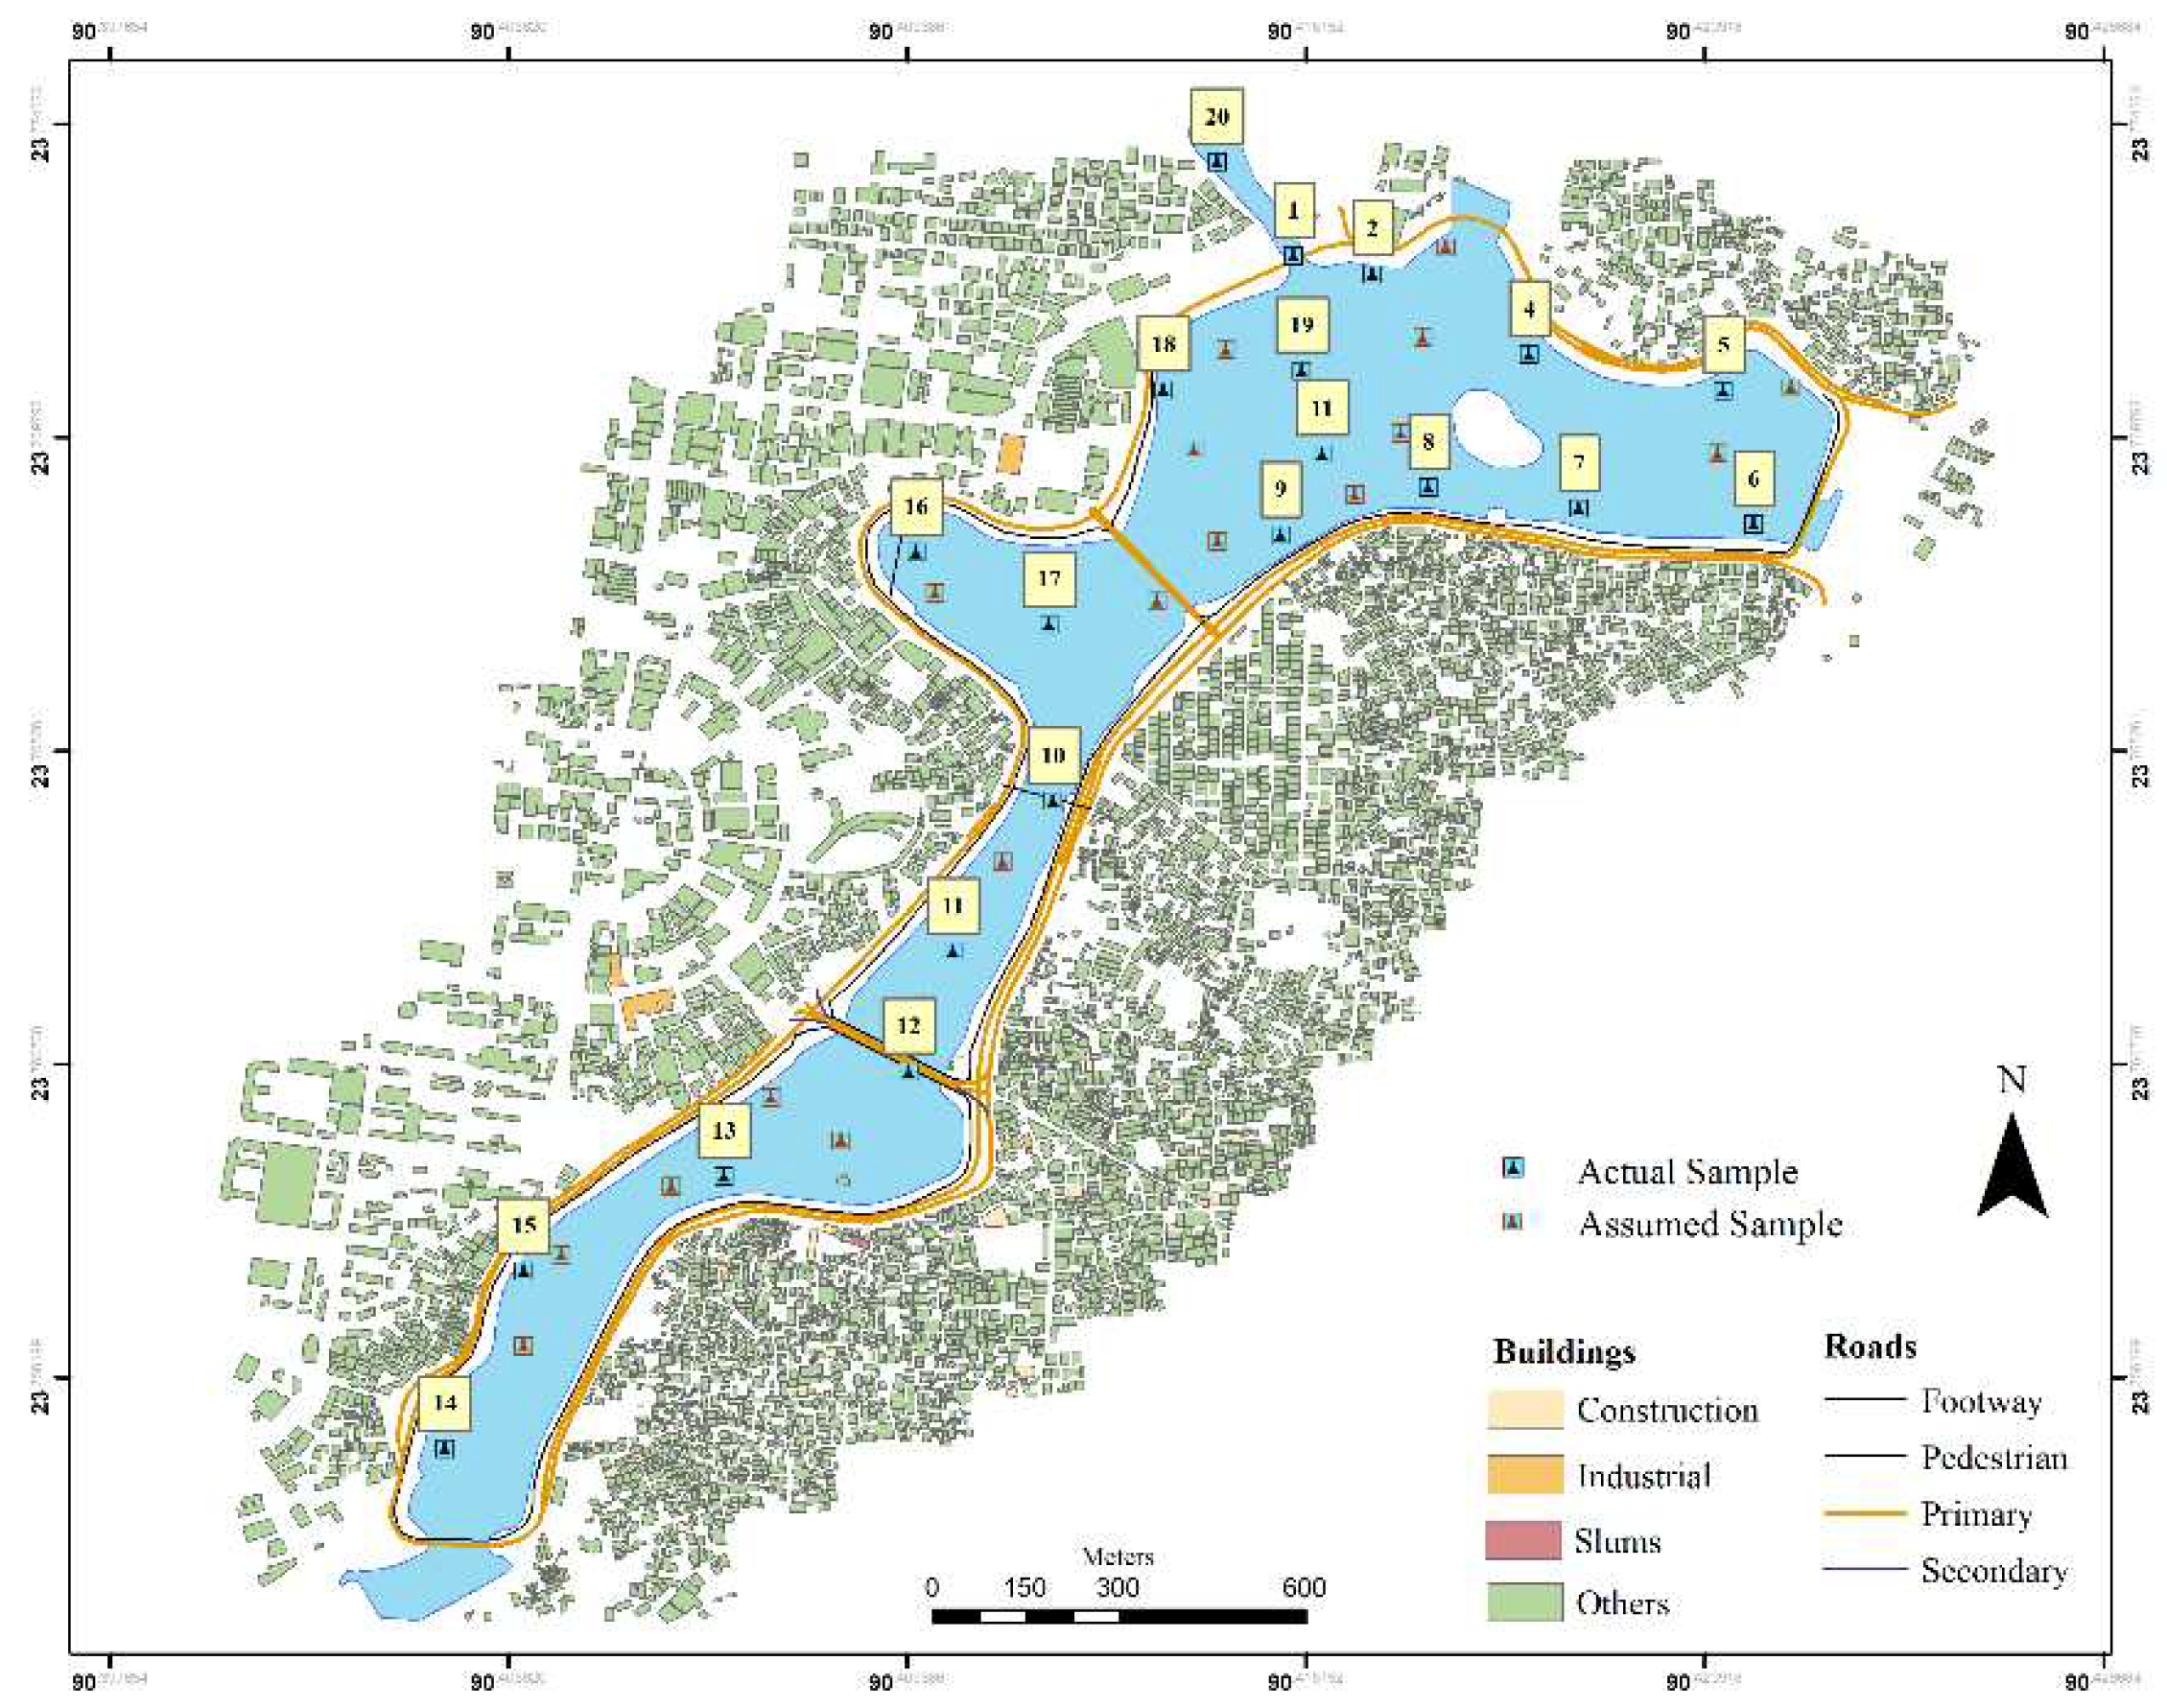
Hatirjheel lies in the centre of D haka, the national capital city. Hatirjheel has geo-coordination of 23°44′58.47′′N and 90°23′48.35′′E. This region stretches between Pan Pacific Hotels and Resorts in the southern side through Banasree on the northern. This region seems to border with Tejgaon industrial region, Gulshan residential region, Rampura, Banasree, Niketon, Badda as well as Maghbazar, making commuting for residents of such sectors convenient (MAA Mokaddes, 2013). Hatirjheel has covered a total space of 311.79 acres. Three significant streams border the region of Dhaka. Throughout the wet seasons, the backwater movement of water from these streams floods the city's outskirts, congesting the sewage system inside the city's core. There are numerous wetland areas throughout the region. A few of the main sewage khals/canals that convey stormwater runoff across catchments within eastern and central Dhaka towards the Balu River are the Begunbari Khal or Banasree Khal (S. Afrin, 2015). This khal's crucial hydrological role in emptying and containing rainwater from Dhaka metropolis's vast expanse is the vast expanse of Dhaka metropolis is very well acknowledged. The rainwater sewers that discharge into Hatirjheel are intended to convey rainwater but also transport dry weather circulation. Among the few surviving large bodies of water inside Dhaka seems to be Gulshan Lake, which is significant both for the sustainability of the local environment and as a potential source of aquifer supply.
Figure 1.
Map of the study area and sampling points.
2.2. Data collection and sampling procedure
The sample was collected from 20 sites on a random basis method of the ArcGIS software technologies. 16th of March 2022 was the date of the sampling and the timestamp mark was between 16.00 to 18.30. pH, salinity, temperature, redox and conductivity and DO (dissolve oxygen) parameters of the water quality were logged with the ML-317 ADS data logger and the CTZN: Inductive conductivity sensor for salinity, conductivity and temperature data, the OPTOD: Optical sensor for dissolved oxygen and the PHEH sensor for pH, Oxidation-Reduction Potential (ORP) was used. For every 5 seconds interval, the raw data was logged for each of the parameters for every 20 sites for 3 minutes. Through the process, 30 to 36 raw data were collected for e ach sampling site and for each of the six parameters.
2.3. Description of the materials
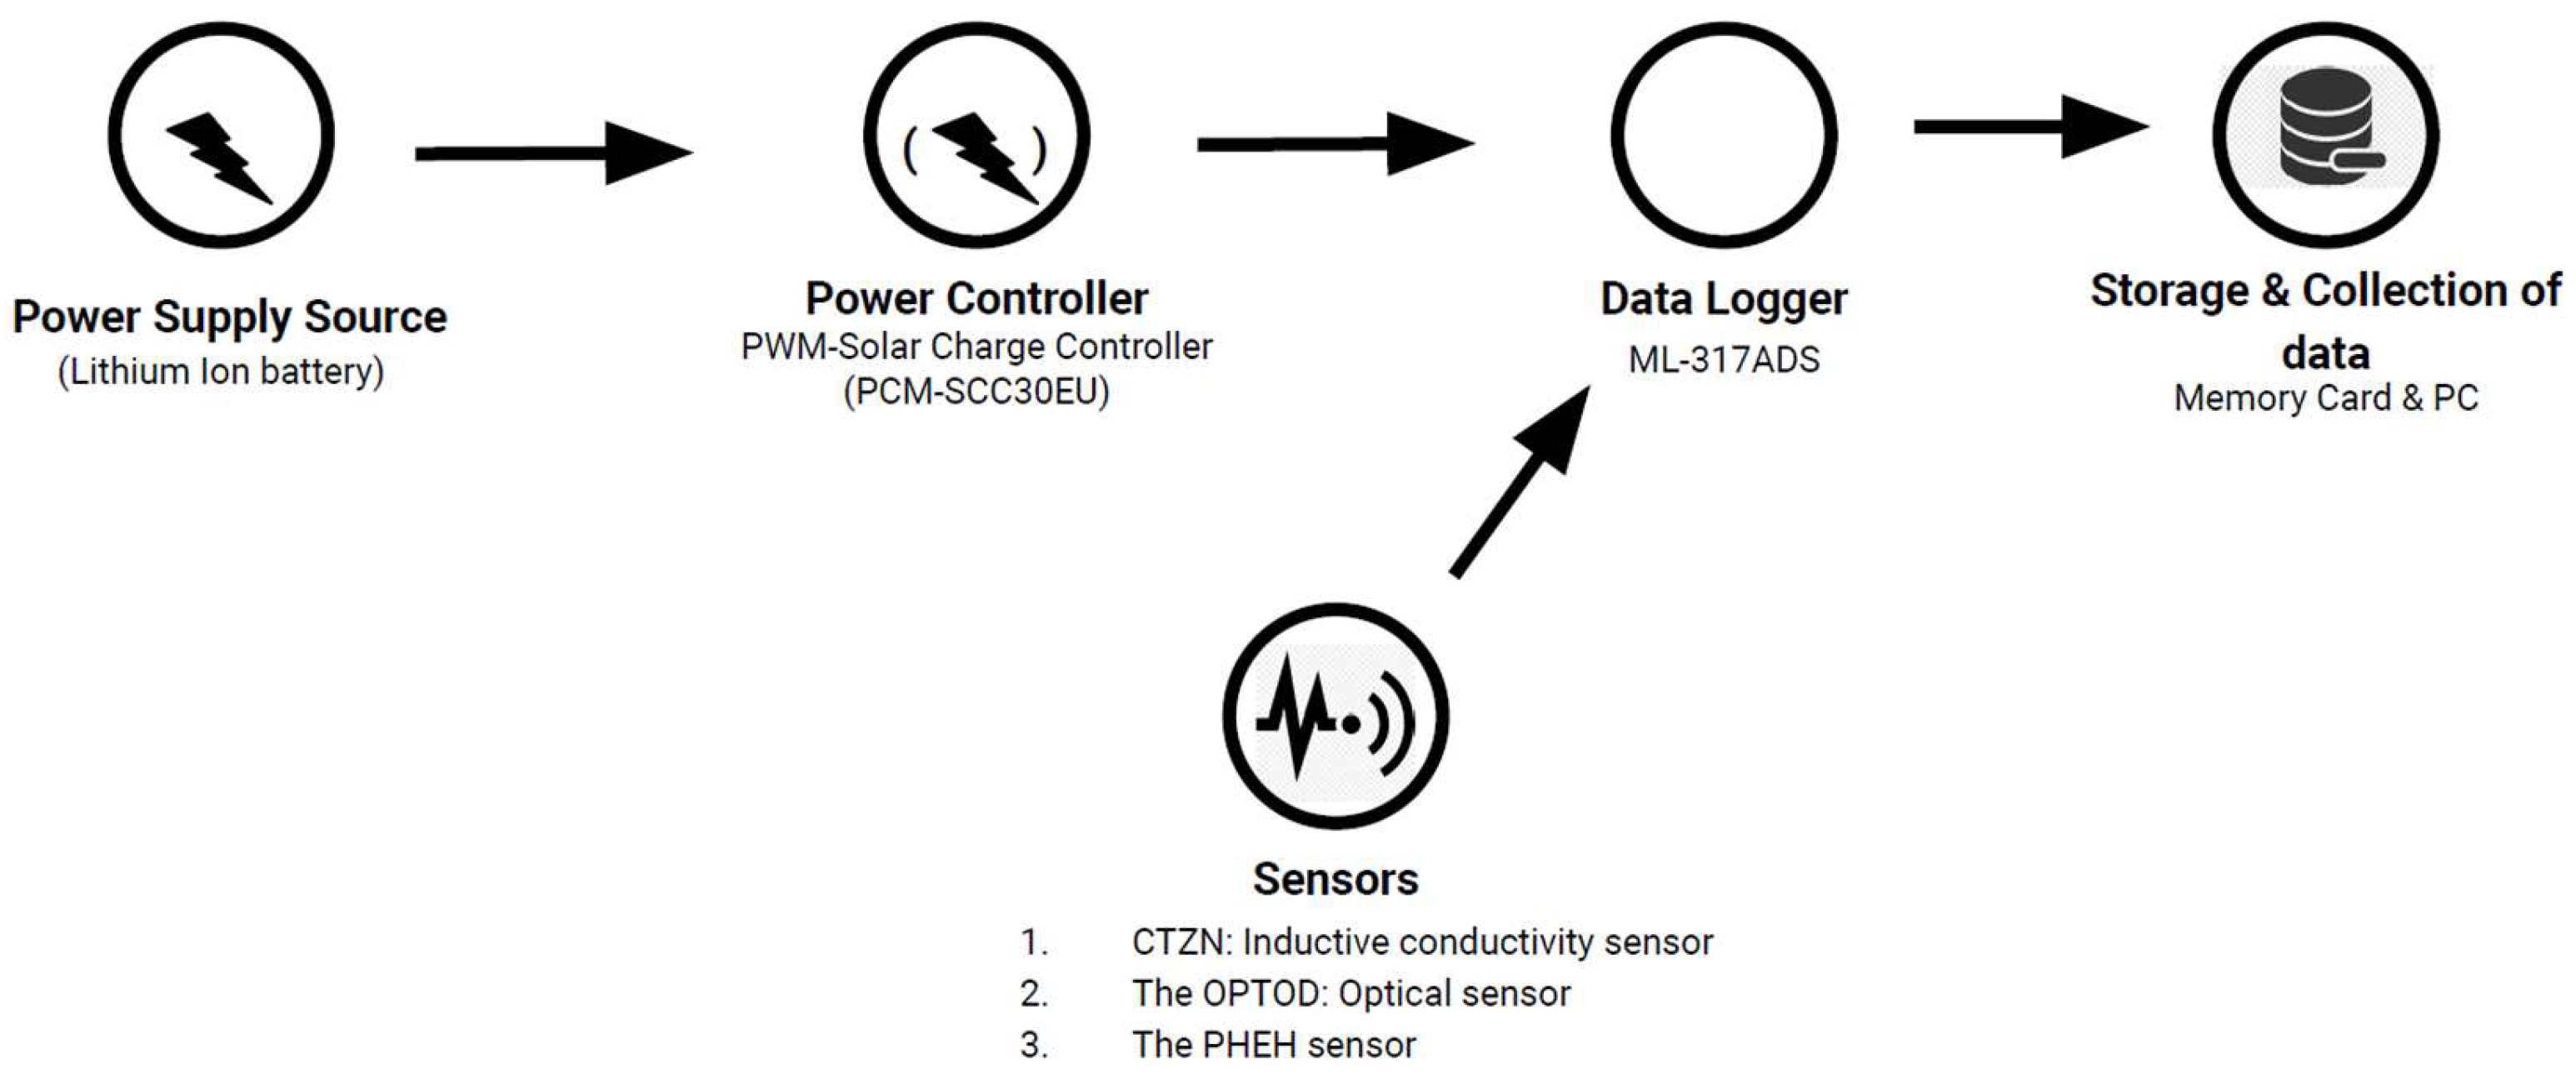
The sensors were used for the study to retrieve the water quality parameters was described by their manners. AQUALABO’s CTZN: Inductive conductivity sensor which uses the method of inductive conductivity sensor regulated in temperature, it has an accuracy of ± 0.5⁰C. The OPTOD: Optical sensor, uses the method of optical measure by luminescence, which has an accuracy of ± 0,1 ppm. The PHEHT: it uses the method of Combined electrode (pH/ref): special glass, Ag/AgCI ref. Gelled electrolyte (KCI) has the accuracy of ± 0,1 pH, ± 2 mV for ORP, ± 0,5 °C for temperature. These sensors’ data were combined and logged through the data logger YDOC’s ML-317 ADS using SDI-12 protocol and a storage device/memory card.
Figure 2.
Real-time data collection framework.
2.4. Data Cleaning
Collected data needs cleaning and filtering for precise examination. In the process of data cleaning and filtering null values machine learning algorithm has been used. It was coded that if the null value is true and found algorithm has to put the mean value instead of the null value.
2.5. Data Analysis
Collected and cleaned data from the 20 sampling sites were interpolated throughout the lake map using ArcGIS from ESRI for each of the parameters of water quality. These sample data were then verified and correlated among each other on a combination process to see if these data have a correlation with DO. All these processes were done using a machine learning algorithm for automation and for low latency temporal benefits using Python programming language. Now the sampled and interpolated data were generated into 30 more random values. A total of 50 values is now being constructed for further analysis. These 50 data merged into the equation of linear regression. The hypothesis is accumulated through a multiple regression equation that if one has the four of the parameters one might calculate through this machine learning method (sklearn, seaborn & matplotlib) and/or through the developed equation of multiple linear regression one can generate the unknown DO of the water. In the equation:
where, y=DO (of unknown water), X1=temperature, X2=salinity, X3=conductivity, X4=ORP are taken value; c=constant, m1, m2, m3, m4 are constructed in the result analysis part of this research paper.
y=m1x1 +m2x2 + m3x3 +m4x4 +c
2.6. Multivariate Statistical Analysis
In arithmetic analytics, mean is a singular integer typically represents the data's midpoint value. It would be the most frequent central tendency that is referred to as arithmetic mean.
The standard deviation is utilized to calculate the weights of dispersion in observations. In statistical simple terms, standard deviation seems to be the discrepancy between observations or statistics from an average. The shorter the standard deviation, the closer the measurements are to the mean. Bigger scores indicate that the measurements are significantly different from the average number.
2.7. Correlation Heat map
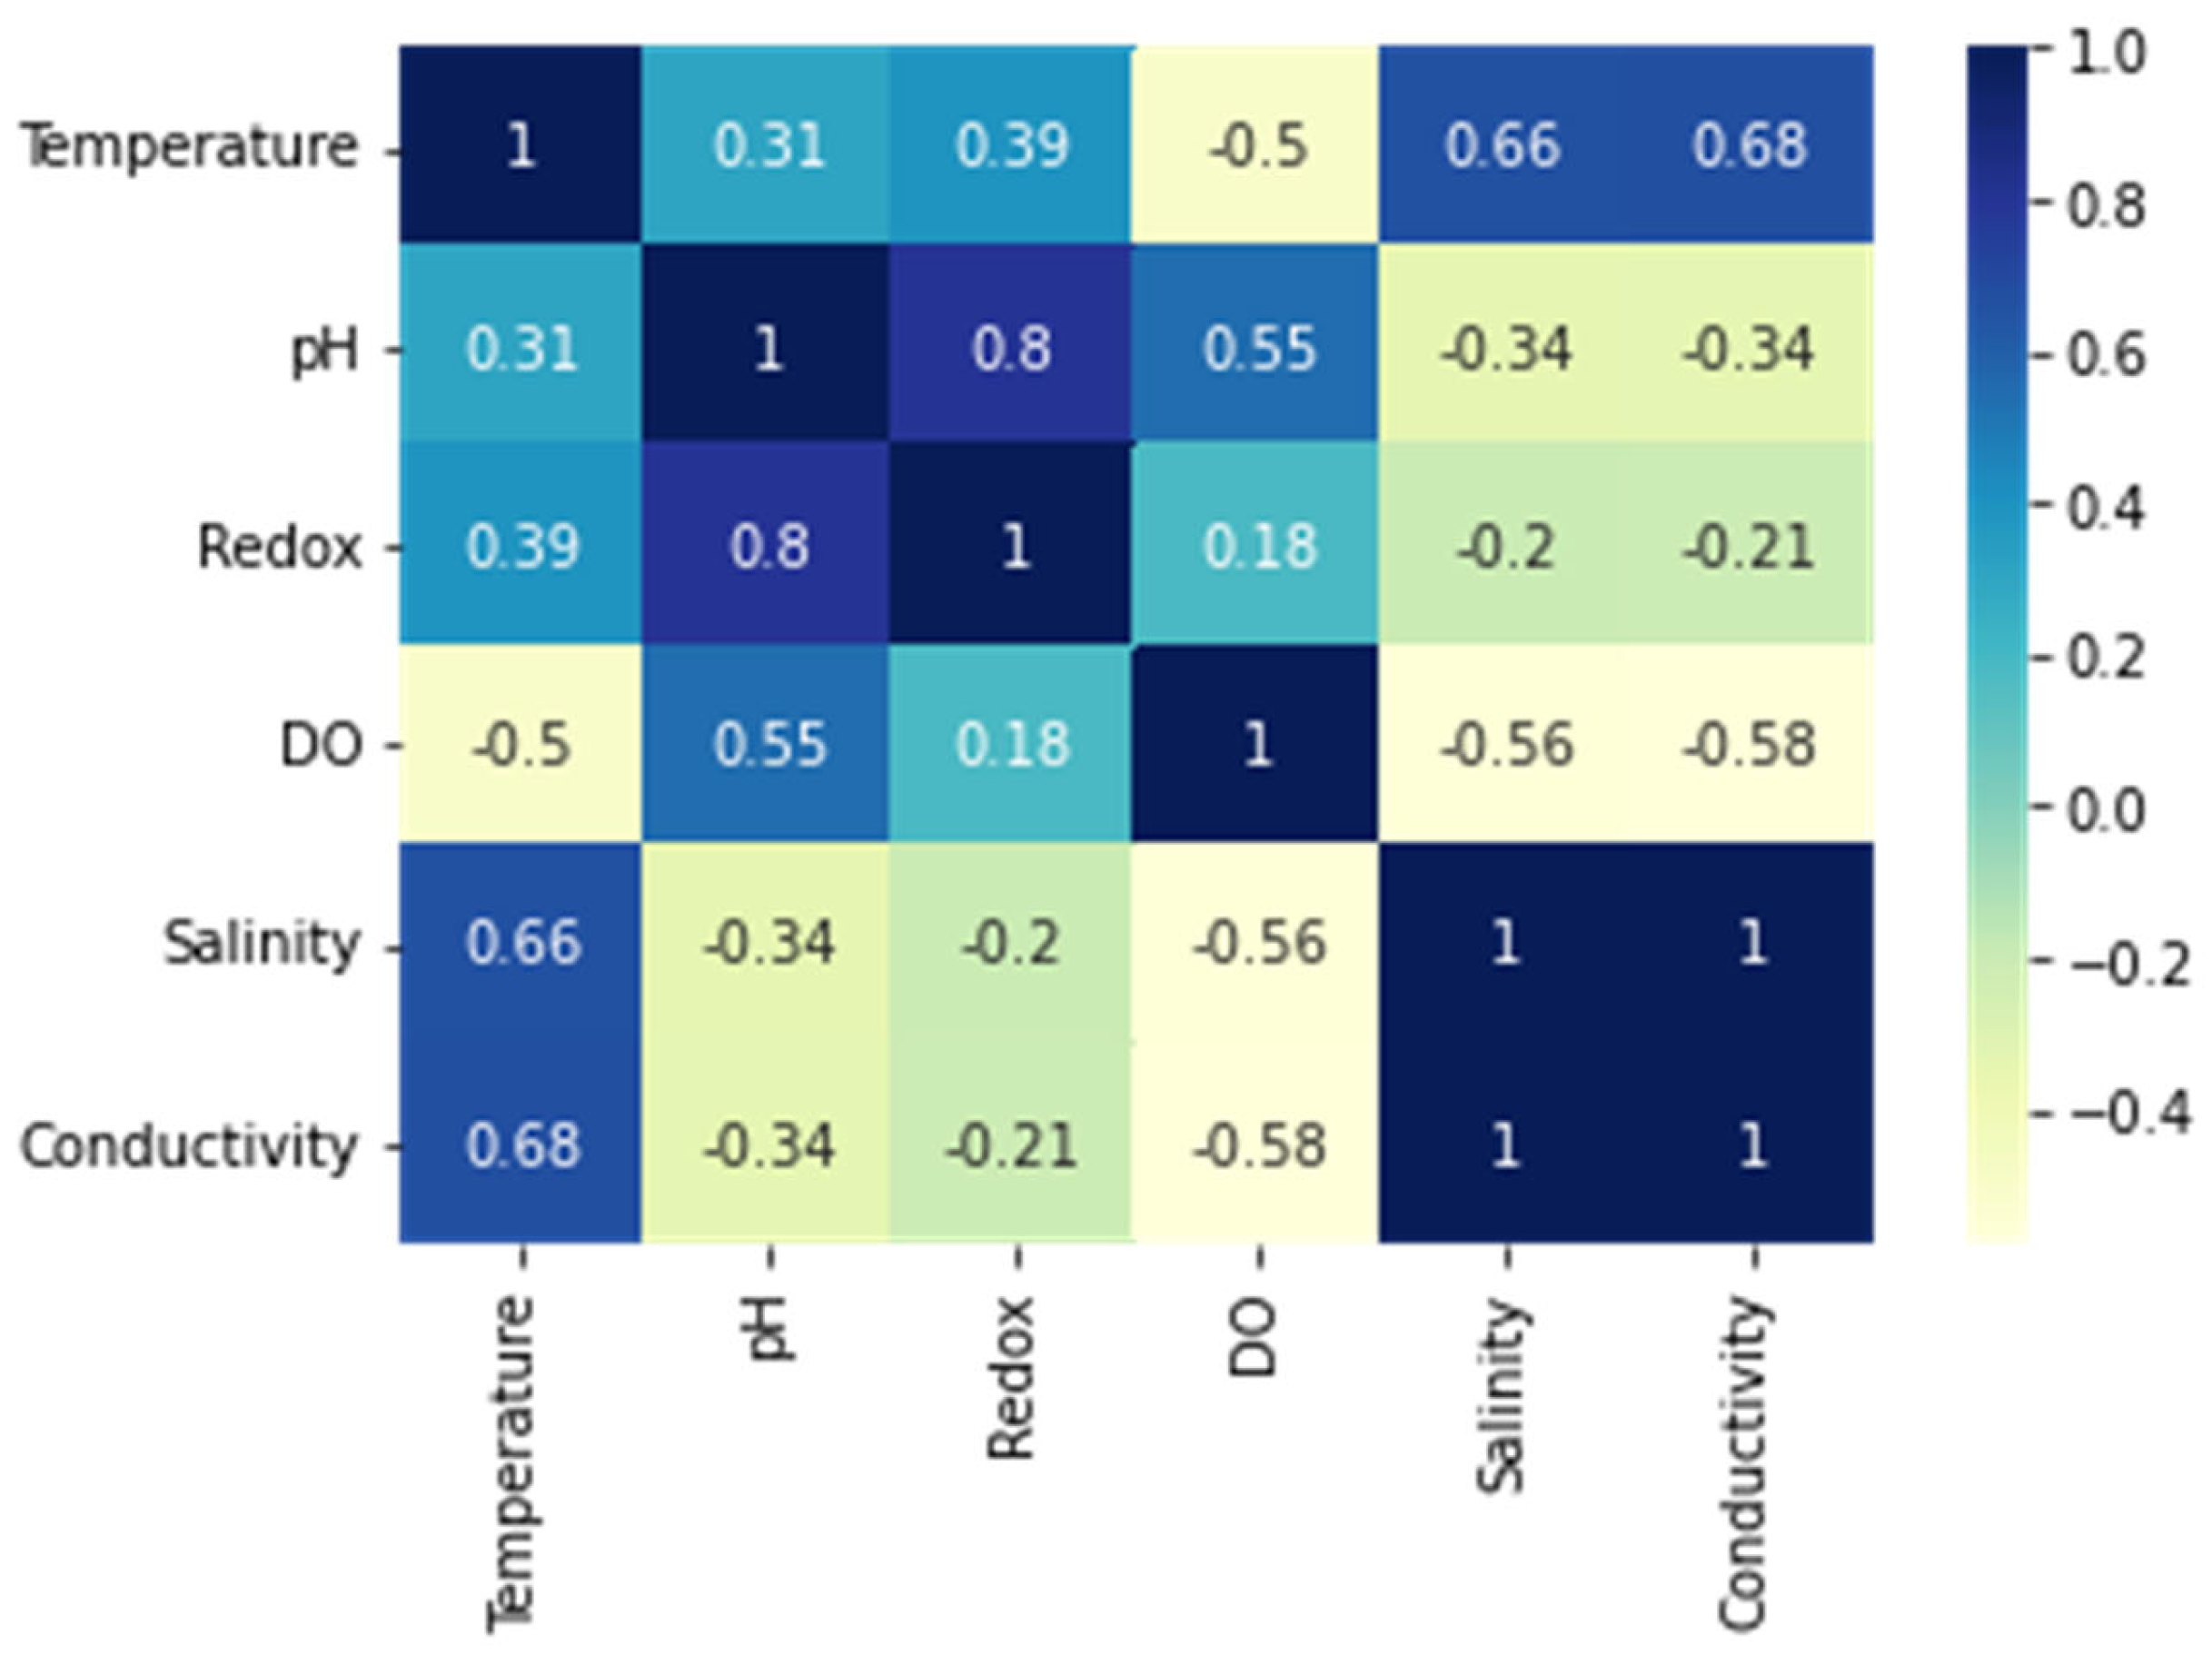
The intensity of the association among variables is expressed statistically as a correlation. There seem to be only two forms of relations: positive and negative. Whenever two variables trend towards a similar manner, they have a strong correlation; as such increases, so does the second. Correlation heat maps provide graphical representations of such intensity of correlations among quantitative data. Correlation maps are being utilized to determine which of them are related to another and how strong that association is. Figure 3 has given an insight into the relationship between the parameters taken into consideration in this research paper. As the graphical illustration, DO has a moderate correlation with pH and negative relation with temperature, conductivity and salinity.
Figure 3.
Correlation Heat map of the parameters.
2.8. Correlation Analysis
In statistics, correlation denotes the relationship of two numerical data. The relationship is linear, meaning that an operator increasing/decreasing in one operator causes a particular number increase/reduction in another.

Table 1.
Correlation with DO against other parameters.
| Variables used | R-score | RMSE |
| pH, Salinity, Conductivity, Temperature | 0.687 | 0.834 |
| pH, ORP, Salinity, Conductivity, Temperature | 0.680 | 0.843 |
| pH, Conductivity, Temperature | 0.591 | 0.954 |
| pH, Temperature | 0.544 | 1.007 |
| pH, ORP, Salinity, Conductivity | 0.4368 | 1.119 |
When checking the correlation among the other parameters it seemed that 25 correlations are found and among them, the top 5 correlated tables are given in Table 2. Table 2 indicates that the correlation of DO against pH, Salinity, Conductivity and temperature is higher in the result than in other parameters included. The score of R is 0.687. Also, the mean discrepancy between variables observed versus obtained variables is measured by RMSE. It gives an estimate of how well the model fits the accuracy. Here the score of RMSE is 0.834 which is quite a good score. A lower value of RMSE indicates a better fit for the model.
Table 2.
Mean and Standard Deviation of WQI data.
| Sl. | Temp. (⁰C) | ORP (mV) | Salinity (g/l) | EC (mS/cm) | pH | DO (mg/l) | ||||||
| Mean | SD | Mean | SD | Mean | SD | Mean | SD | Mean | SD | Mean | SD | |
| 1 | 28.72 | 0.14 | 115.47 | 1.23 | 0.24 | 0.00 | 0.49 | 0.00 | 7.43 | 0.02 | 0.00 | 0.00 |
| 2 | 28.72 | 0.15 | 138.71 | 2.23 | 0.19 | 0.02 | 0.37 | 0.04 | 7.75 | 0.03 | 1.03 | 0.40 |
| 3 | 28.37 | 0.08 | 138.89 | 4.72 | 0.20 | 0.01 | 0.39 | 0.02 | 7.70 | 0.02 | 1.48 | 0.24 |
| 4 | 28.02 | 0.07 | 153.93 | 3.48 | 0.19 | 0.01 | 0.37 | 0.03 | 7.67 | 0.02 | 1.34 | 0.19 |
| 5 | 27.77 | 0.04 | 168.56 | 1.12 | 0.18 | 0.03 | 0.35 | 0.06 | 7.62 | 0.02 | 0.81 | 0.08 |
| 6 | 28.28 | 0.03 | 141.44 | 4.96 | 0.19 | 0.00 | 0.39 | 0.00 | 7.80 | 0.01 | 2.44 | 0.08 |
| 7 | 28.31 | 0.08 | 137.13 | 5.19 | 0.20 | 0.01 | 0.39 | 0.02 | 7.70 | 0.02 | 1.67 | 0.30 |
| 8 | 28.19 | 0.09 | 127.39 | 5.00 | 0.20 | 0.01 | 0.40 | 0.02 | 7.63 | 0.02 | 1.52 | 0.60 |
| 9 | 26.74 | 0.09 | 72.70 | 19.20 | 0.18 | 0.00 | 0.36 | 0.00 | 7.41 | 0.01 | 2.78 | 1.65 |
| 10 | 28.43 | 0.09 | 130.43 | 4.20 | 0.20 | 0.01 | 0.41 | 0.02 | 7.63 | 0.02 | 1.15 | 0.39 |
| 11 | 27.77 | 0.07 | 138.08 | 8.22 | 0.19 | 0.01 | 0.37 | 0.02 | 7.74 | 0.02 | 3.50 | 0.72 |
| 12 | 28.28 | 0.06 | 172.43 | 2.48 | 0.19 | 0.00 | 0.38 | 0.00 | 7.92 | 0.02 | 4.18 | 0.10 |
| 13 | 27.74 | 0.06 | 147.62 | 4.65 | 0.18 | 0.01 | 0.36 | 0.03 | 7.76 | 0.02 | 3.44 | 0.05 |
| 14 | 27.15 | 0.04 | 124.26 | 1.08 | 0.17 | 0.03 | 0.33 | 0.06 | 7.57 | 0.02 | 2.11 | 0.16 |
| 15 | 27.42 | 0.03 | 143.90 | 4.97 | 0.18 | 0.02 | 0.35 | 0.03 | 7.73 | 0.03 | 3.54 | 0.13 |
| 16 | 27.66 | 0.09 | 113.54 | 6.27 | 0.19 | 0.01 | 0.38 | 0.02 | 7.58 | 0.02 | 2.25 | 0.82 |
| 17 | 27.38 | 0.08 | 101.01 | 9.99 | 0.19 | 0.01 | 0.38 | 0.02 | 7.53 | 0.02 | 2.41 | 1.10 |
| 18 | 28.43 | 0.10 | 124.86 | 4.04 | 0.21 | 0.01 | 0.43 | 0.02 | 7.58 | 0.02 | 0.97 | 0.39 |
| 19 | 28.60 | 0.10 | 128.02 | 3.03 | 0.21 | 0.01 | 0.43 | 0.02 | 7.60 | 0.02 | 0.75 | 0.29 |
| 20 | 28.63 | 0.10 | 123.35 | 3.14 | 0.22 | 0.01 | 0.45 | 0.02 | 7.54 | 0.02 | 0.50 | 0.15 |
* SD = Standard Deviation.
3. Result and Discussion
3.1. Mean and Standard Deviation table
The below table indicates that the SD of DO and ORP from the dataset is much scattered and has shown significant deviation. The below data is shocking that the DO is very low from the standard level. This DO signify that the nutrients of the water are becoming absent and the water is not qualified for the fish culture. This prominent lake of Dhaka city has negative and almost no good for social benefits but is a mere tourist attraction.
3.2. Interpolation Study
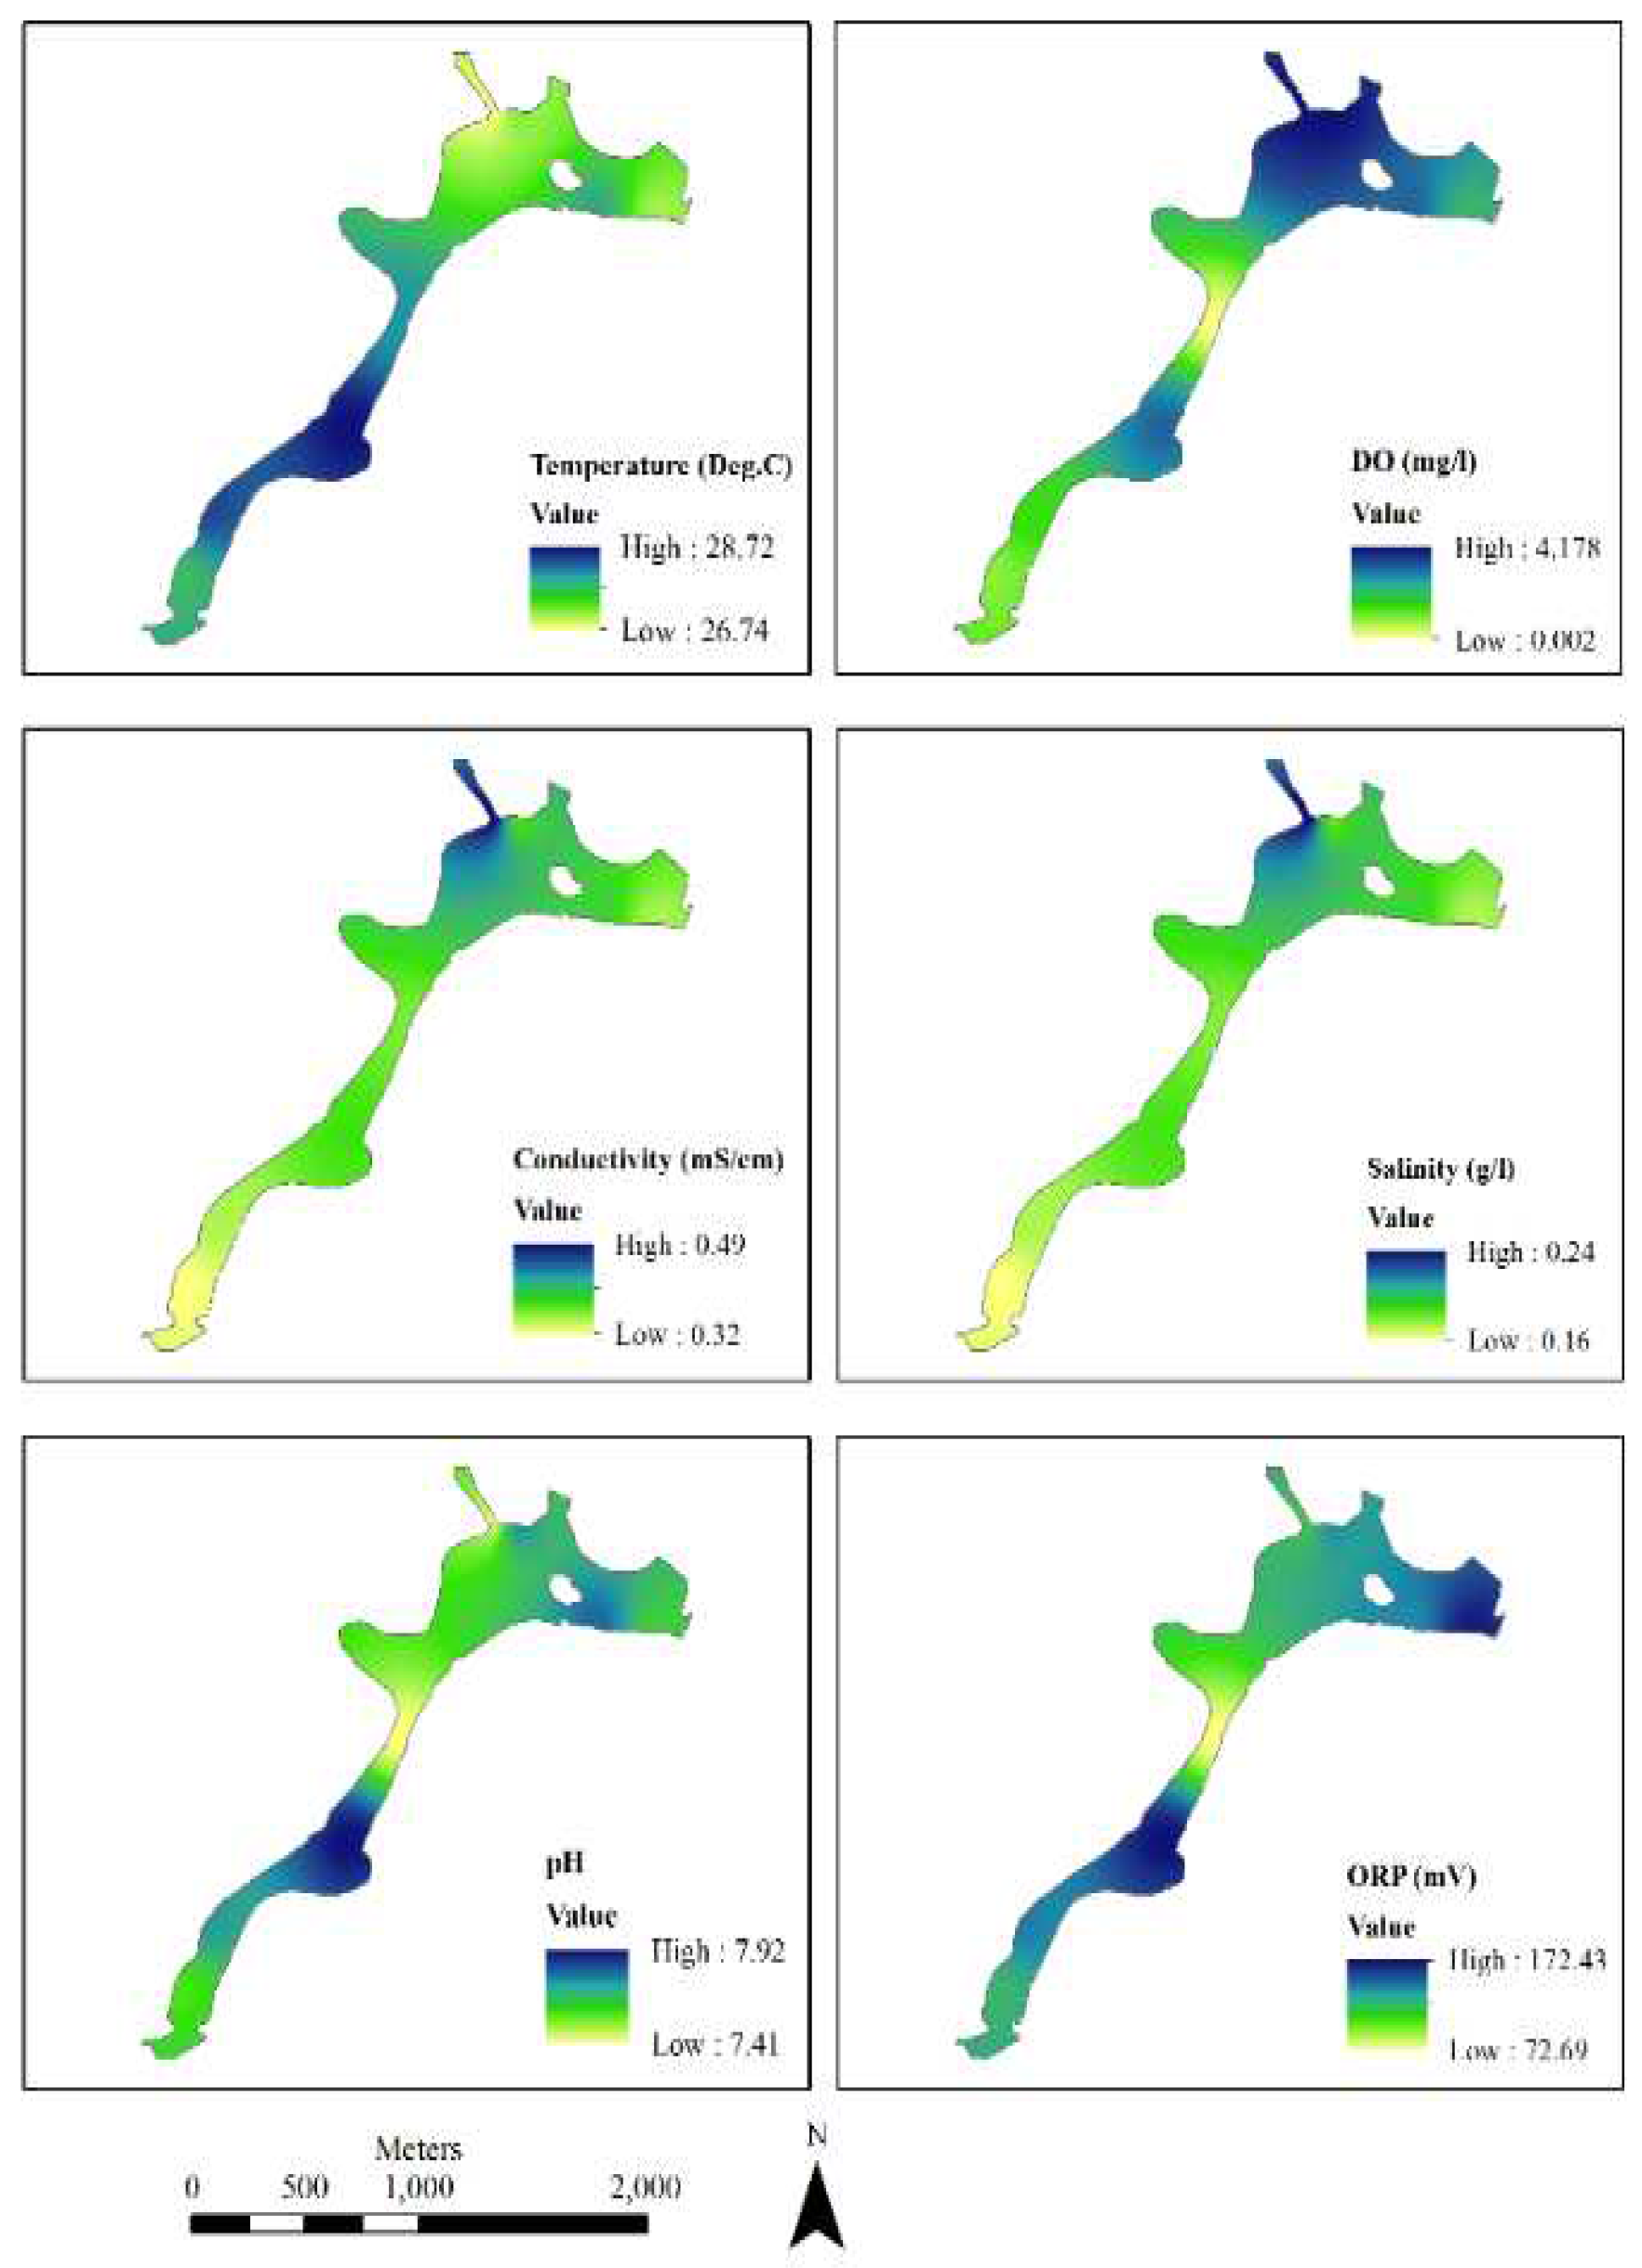
As shown in Figure 4, 20 samples were interpolated here from the original 20 observed values. The map represents the visible indication of an inverse relationship between pH value and DO. Again, among the other basic WQI parameters of the Hatirjheel lake. These maps were produced by ArcGIS from ESRI using the method of Kriging interpolation.
Figure 4.
Interpolation of different WQI parameters of Hatirjheel.
3.3. Regression model
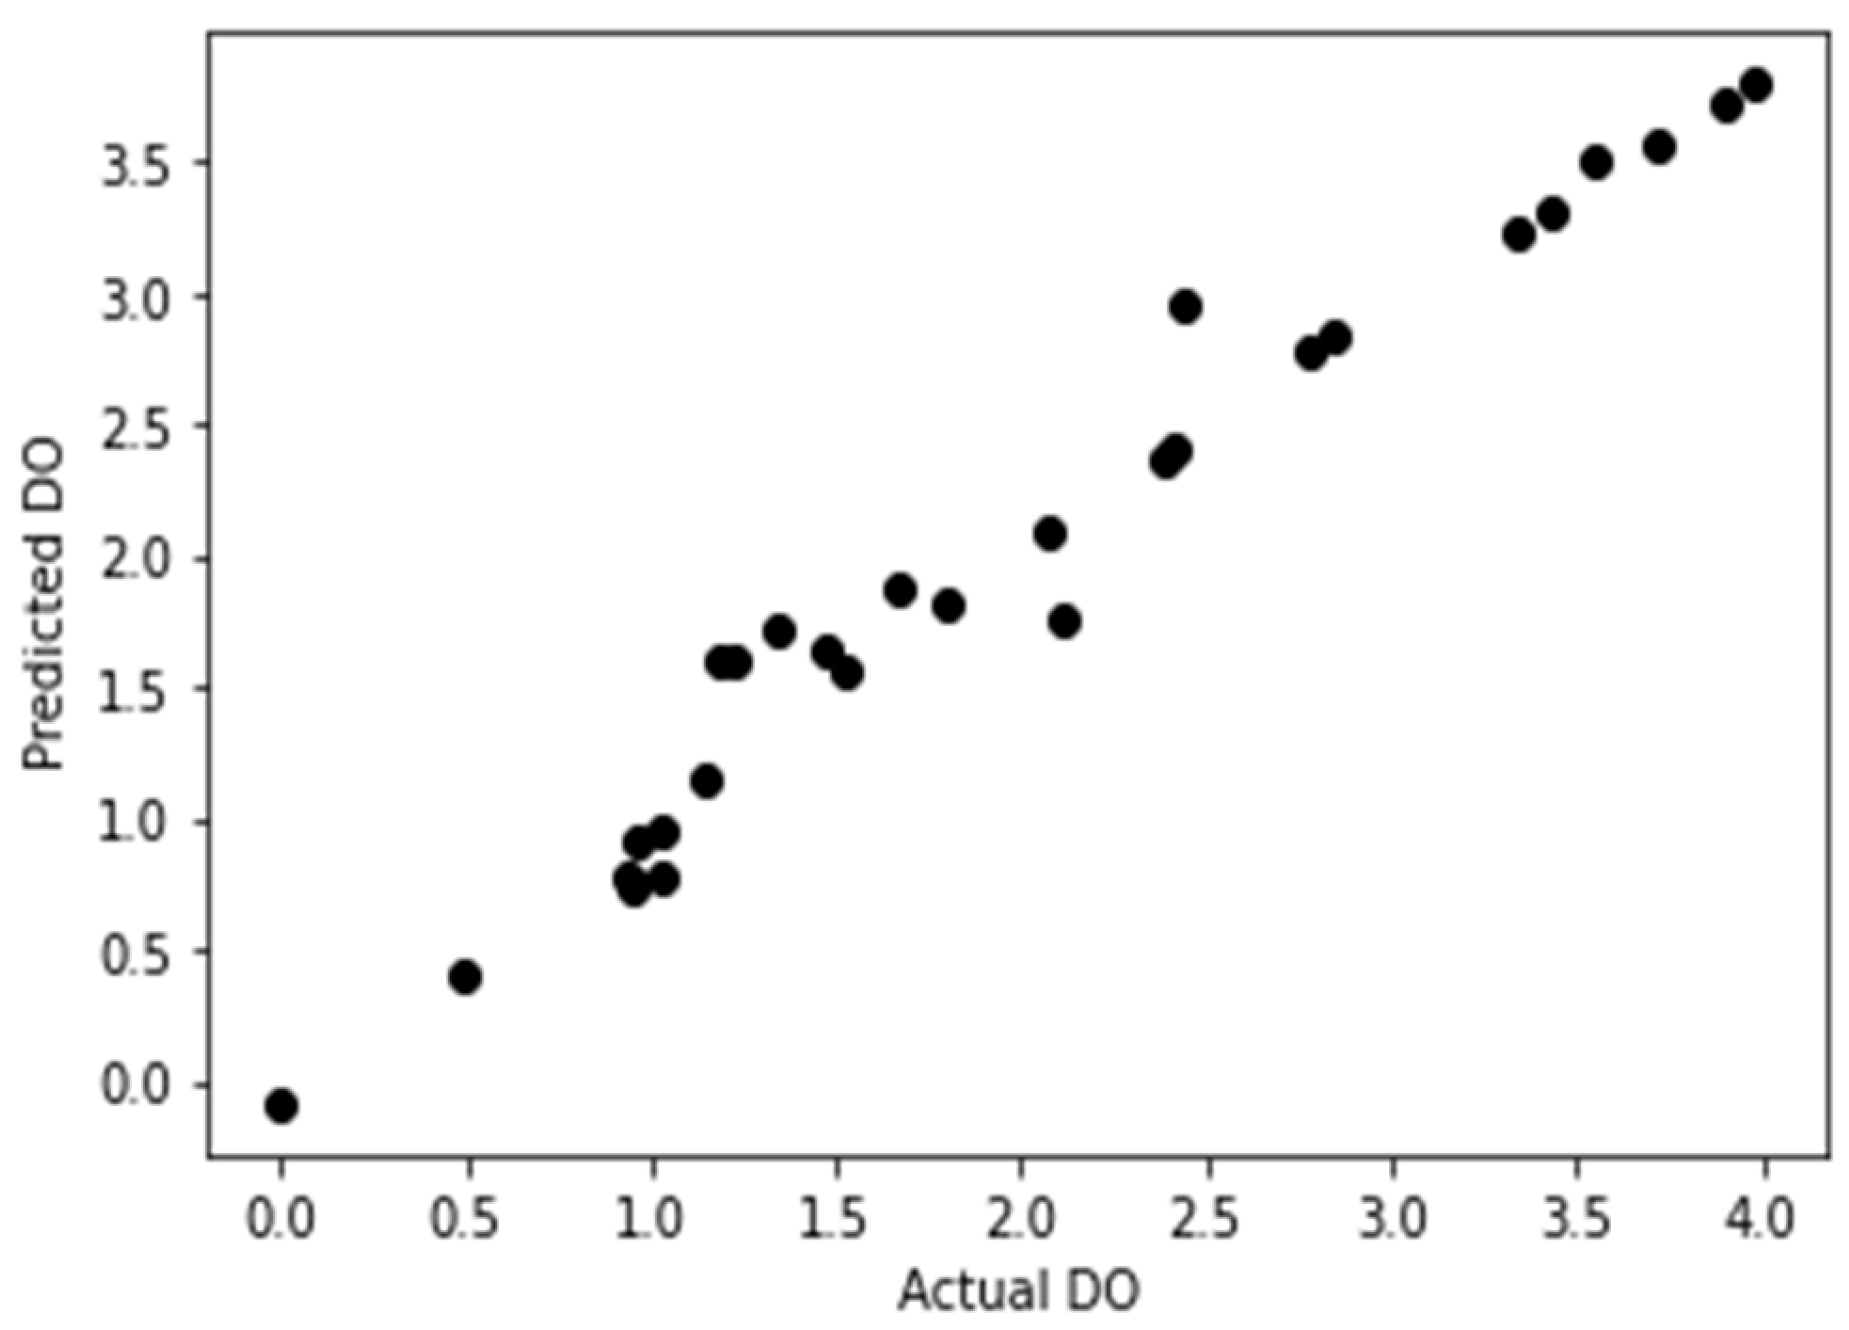
DO prediction model using the four parameters of water quality developed through machine learning method was used to produce the statistical results of regression model. Where, 40 total sample data was used. In the dataset 20 was original sampling and 20 was interpolated data. The model was trained in a way that the machine learning model itself used 70% data as in 28 data for training the model and the rest 12 data kept to check if the model is valid. The accuracy of the model came in 0.96 that is a great fit for the model building and the equations RMSE (root-mean-square-error), MSE (mean squared error), MAE (mean absolute error) was developed and the c=Intercept value also found.
Table 3.
Statistical results of regression model.
| r2 | 0.9636419890515832 |
| MAE | 0.15244809592781455 |
| MSE | 0.04297761323587285 |
| RMSE | 0.20731042722418197 |
| Intercept | -3.243182537397614 |
| Temperature coef. | -3.50012194 |
| pH coef. | 12.43320371 |
| Salinity coef. | -315.35944705 |
| Conductivity coef. | 179.27832613 |
Figure 5.
DO Predictive model.
So, the derived equation can be written as follows:
Y (Predicted DO) = (−3.50012194*Temperature) + (12.43320371*pH) + (−315.35944705*Salinity + (179.27832613*Conductivity) − 3.243182537397614
3.4. Model Validation
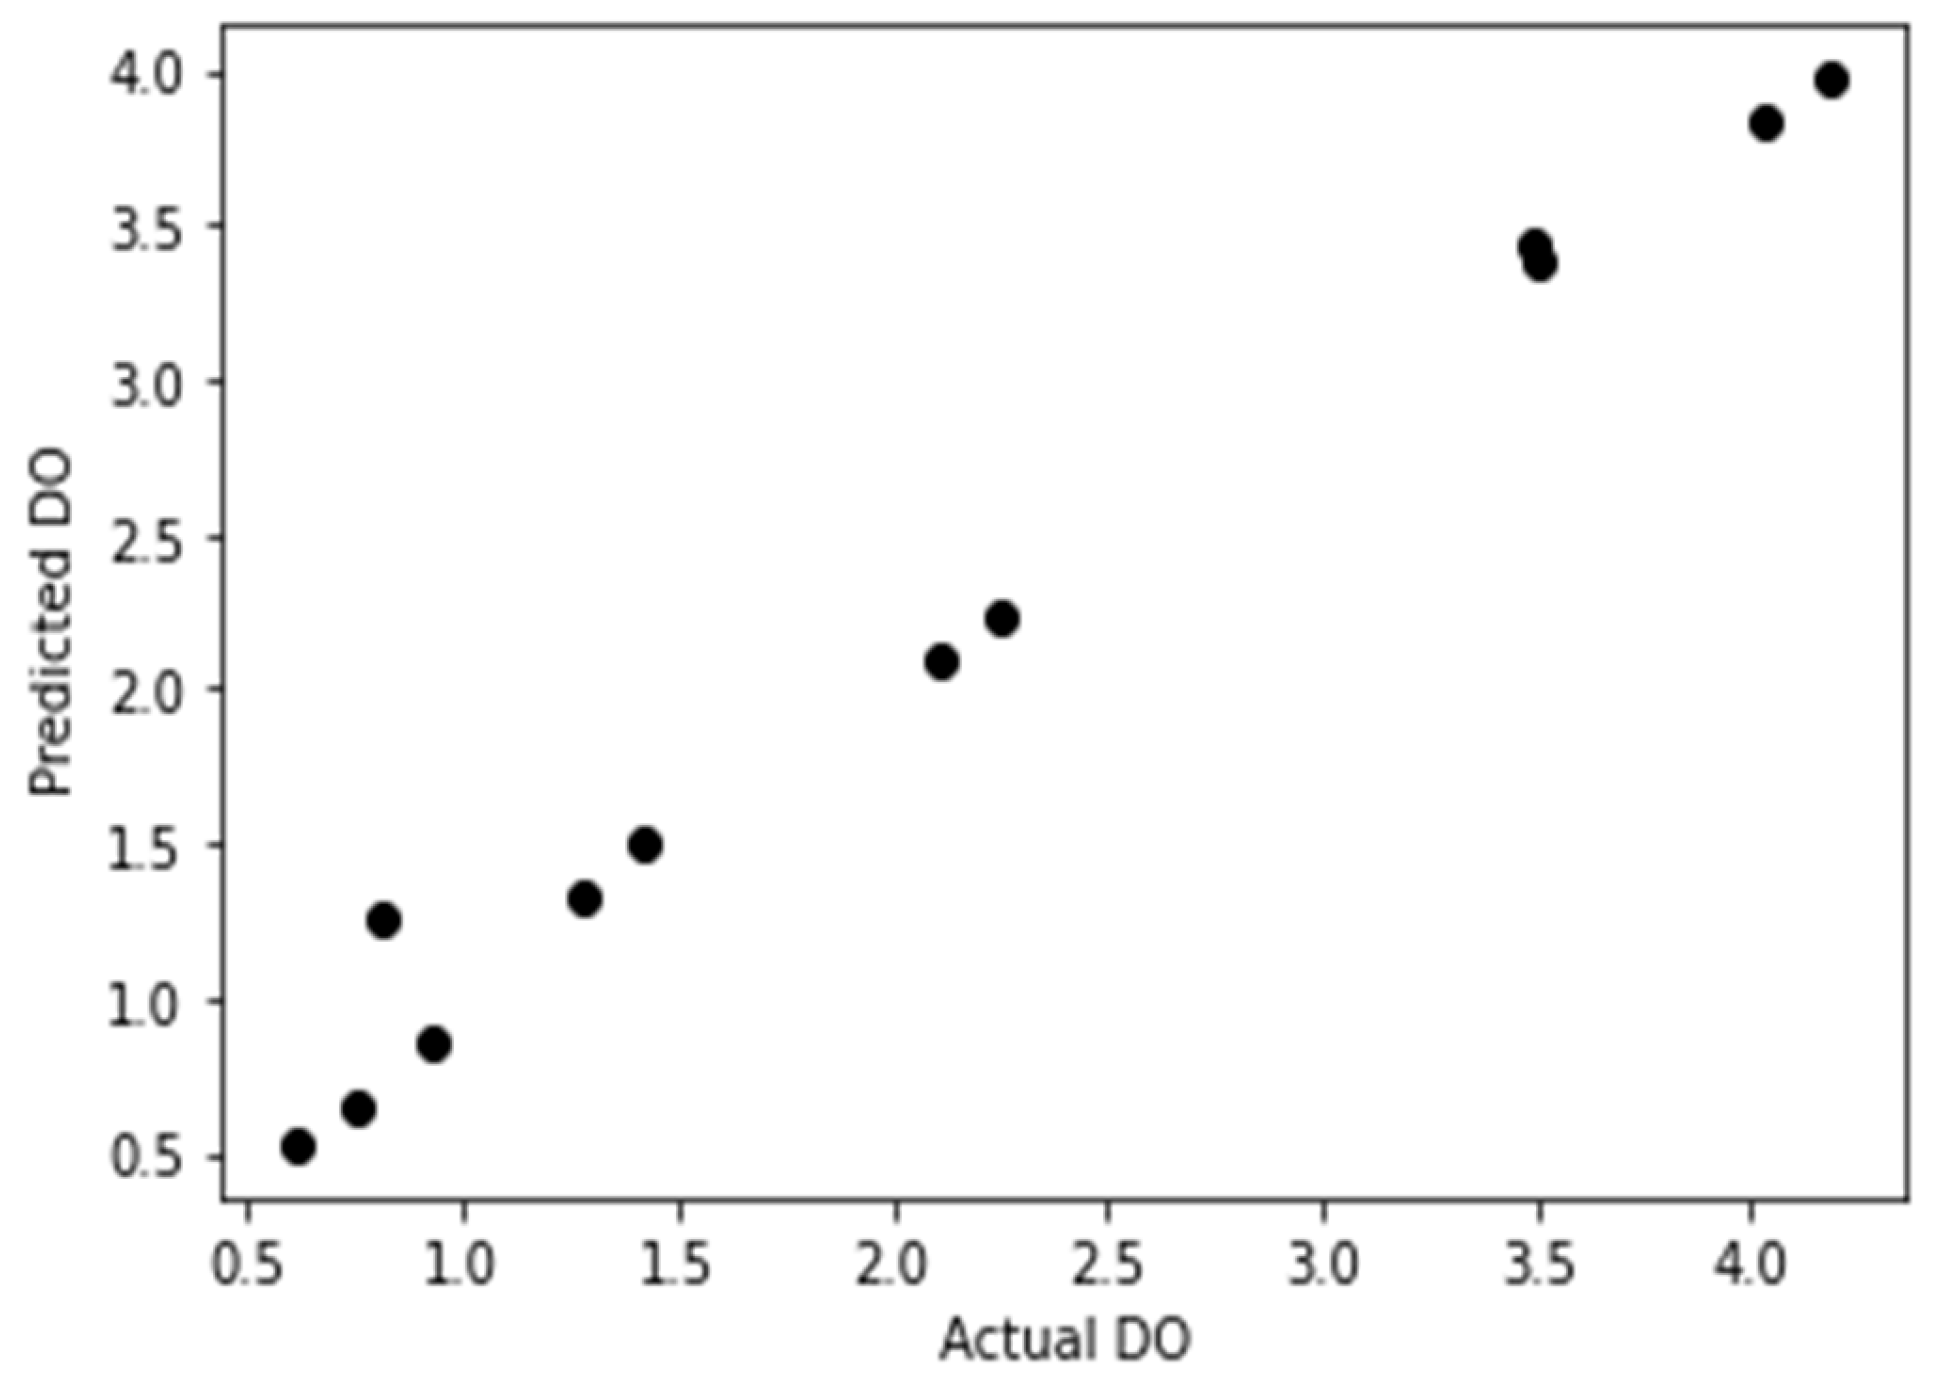
The model was tested against those 12 data means 30% of the dataset and the result is given below.
Table 4.
Statistical result of model validation.
| r2 | 0.9830437024851376 |
| MAE | 0.12126691975959207 |
| MSE | 0.028476917606881477 |
| RMSE | 0.16875105216525754 |
Simulation of the dissolved oxygen machine learning prediction model in Matlab, the model accuracy curve was shown in Figure 6. Importing the 12-forecast sample data to the prediction model, and the prediction result was shown. This demonstrated how effectively this proposed dissolved oxygen forecasting model performed.
Figure 6.
Model validation curve (r2 = 0.98).
3.5. Water quality standard
According to World Health Organization (WHO)’s Guidelines for drinking water quality. Vol. 2, Health criteria and other supporting information, 2nd ed, water quality parameters are standardized in 1996 (WHO, 1996). Table 5 for DO, ORP, salinity, pH, EC are standard according to DoE, Gov. of Bangladesh also (Department of Environment, 2003). The Department of Public Health Engineering, Gov. of Bangladesh also gave standard data ((DPHE), 2019) table on their website which is marginally similar to the data given by DoE.
Table 5.
Water quality standard according to WHO & DoE.
| Parameters | Standard (WHO) | Standard (DoE) |
| DO | 6.5-8 mg/L | 6 mg/L |
| ORP | 300-500 mV | - |
| Salinity | < 0.5 ppt | 0.6 ppt |
| pH | 7-8 | 6.5-8.5 |
| EC | 500-1400 µ/cm | 1200 µ/cm |
| Temp. | 12-25°C | - |
3.6. DO importance in a protected urban lake
Among the very significant parameters of water health is dissolved oxygen. It is necessary for waterborne species to survive. As a consequence of underwater photosynthesis, oxygenation is however immersed in the stream. The aquatic organism may not sustain if DO levels fall below standard. warmer the temperature lesser the dissolved oxygen in the water. The volume of oxygen that a pool of water may store is indeed affected by salinity; pure water may capture additional oxygen versus saline water. If there is the bacterial activity or algal activity in the marine ecosystem, oxygen concentrations might well be decreased. Pseudomonades devour phytoplankton when they have completed their gestation period and died. The pseudomonades devour the DO in the water throughout this degradation stage. This might result in lower quantities of physiologically accessible oxygen, which can result in species extinction in the aquatic system. (Sarasota County, 2023) A significant study has shown shocking results of DO 0.2 mg/L to 3.20 mg/L (standard 4.5 to 8 mg/L) in the studied lake water which is almost impossible for any living organism to survive (Kalimur Rahman, 2021). This study backs and explains the reason for the odor from the very lake. Our study shows a similar result of DO which is 0.002 mg/L to 4.1 mg/L. In such protected urban lake pollution control needs to happen immediately, government and responsible administration personnel should make policy against the polluters and take necessary steps to contain such a threatened major lake in the capital of Dhaka, Bangladesh.
3.7. Limitations of the study and further scope
The main and foremost limitation of the research is that DO is compared with only a few basic water quality parameters, other parameters such as Biological and Chemical dissolve oxygen demand were not taken into consideration. Heavy metals like Cd, Cr, Ni, Arsenic and other significant ones were also not taken into consideration for this scientific study and remain for future scope. Fish culture damage data due to DO decrease is also not taken under lab experiments and close system scientific simulator exploration. As we haven’t there is a high opportunity for further study in this particular idea module.
4. Conclusions
Representation of the real-time water health monitoring process, the research study created a method for dissolved oxygen forecasting. The program utilizes 20 samples as data and 20 samples interpolated to validate the forecasting of the outcome, and the measurement was retrieved from Dhaka's Hatirjheel lake using a real-time water quality monitoring sensor, for each site of such sample constituting water quality parameters like as pH, water temperature, ORP, conductivity, salinity, and dissolved oxygen. The DO prediction framework was demonstrated in multiple linear regression equations to fit the actual data quite well. The forecasting equation model can be used to validate the reliability of sensor data, to give information when sensors malfunction, and to create additional key aquaculture water quality parameters forecasting concepts.
Credit Authorship Contribution Statement
A. Selim: Conceptualization, Data collection, Validation, Formal analysis, S. N. A. Shuvo: Writing – original draft, Conceptualization. M. M. Islam: Writing-review & editing, Conceptualization. S. Shah: Software, Formal analysis. M. Ohiduzzaman: Arranging and reviewing the draft. M. Moniruzzaman: Final review and editing for submission.
Declaration of Competing Interest
The authors declare that they have no known competing financial interests or personal relationships that could have appeared to influence the work reported in this paper.
Acknowledgments
The authors are highly grateful to Eutech Systems Limited, 155/A, Niketon, Gulshan-1, Dhaka, Bangladesh for all kinds of supports to conduct this research including providing the water sensors, data collection facilities, data analysis and associates economic costs.
References
- (DPHE), D. o. (2019, May 15). dphe.gov.bd/. Retrieved from Bangladesh National Portal: http://dphe.gov.bd/site/page/15fa0d7b-11f1-45c0-a684-10a543376873/Water-Quality-Parameters-.
- Brönmark, C. H. (2002). Environmental issues in lakes and ponds: current state. Environmental Conservation, 29 (3), 290–306. [CrossRef]
- Cansu Filik Iscen, Ö. E. (2007). Application of multivariate statistical techniques in the assessment of surface water quality in Uluabat Lake, Turkey. Environmental Monitoring and Assessment, 144, 269–276. [CrossRef]
- Department of Environment, (. (2003). Water Quality Standard, A Compilation of environmentallaws of Bangladesh. (M. E. Huq, Ed.) administered by Department ofEnvironment (DoE), Govt. of Bangladesh.
- Fabliha Anber, N. A. (2020). Restoration of Hatirjheel Lake by designing submerged aeration system and settling zone. IOP Conference Series: Earth and Environmental Science (p. 476). IOP Publishing Ltd.
- Icaga, Y. (2007). Fuzzy evaluation of water quality classification. Ecological Indicators, 7(3), 710-718. [CrossRef]
- J.C.Chena, N. W. (2003). Assessing wastewater reclamation potential by neural network model. Engineering Applications of Artificial Intelligence, 6(2), 149-157.
- Kalimur Rahman, S. B. (2021). Assessment of water quality and apportionment of pollution sources of an urban lake using multivariate statistical analysis. Cleaner Engineering and Technology, 9. [CrossRef]
- Kunwar P.Singh, A. B. (2009). Artificial neural network modeling of the river water quality—A case study. Ecological Modelling, 220(6), 888-895.
- L. Giridharan, T. V. (2010). Identification and evaluation of hydrogeochemical processes on river Cooum, South India. Environmental Monitoring and Assessment, 162, pages277–289.
- MAA Mokaddes, B. N. (2013). Status of Heavy Metal Contaminations of Drain Water of Dhaka Metropolitan City. Journal of Environmental Science and Natural Resources, 5(2), 345-348. [CrossRef]
- Ouyang, Y. (2005). Evaluation of river water quality monitoring stations by principal component analysis. Department of Water Resources. Florida, USA: St. Johns River Water Management District. [CrossRef]
- P. J. Puri, M. K. (2011). Surface water (Lakes) quality assessment in Nagpur city (India) based on Water quality index (WQI). IRJET Journal, Vol.4, 43-48.
- P. Simeonova, V. S. (2003). Water quality study of the Struma river basin, Bulgaria (1989–1998). Celtran European Science Journal, 1, 136–212.
- Patrick Debels, R. F. (2005). Evaluation of Water Quality in the Chillán River (Central Chile) Using Physicochemical Parameters and a Modified Water Quality Index. Environmental Monitoring and Assessment, 110, 301–322.
- Pesce, S. a. (2000). Use of Water Quality Indices to Verify the Impact of Córdoba City (Argentina) on Suquía River. Water Research, 34, 2915-2926. [CrossRef]
- Prakash Raj Kannel, S. L.-S. (2007). Application of Water Quality Indices and Dissolved Oxygen as Indicators for River Water Classification and Urban Impact Assessment. Environmental Monitoring and Assessment, 132, 93–110.
- Rajesh Reghunath, T. R. (2002). The utility of multivariate statistical techniques in hydrogeochemical studies: an example from Karnataka, India. Water Research, 36(10), 2437-2442. [CrossRef]
- S. Afrin, M. M. (2015). Development of IDF Curve for Dhaka City Based on Scaling Theory under Future Precipitation Variability Due to Climate Change. International Journal of Environmental Science and Development, 6(5), 332-335.
- S. R. Carpenter, N. F. (1998). NONPOINT POLLUTION OF SURFACE WATERS WITH PHOSPHORUS AND NITROGEN. the Ecological Society of America, Volume8(Issue3), Pages 559-568.
- Saffran, K. C. (2001). Canadian water quality guidelines for the protection of aquatic life. CCME water quality Index, 1, 34-31.
- Sarasota County, U. W. (2023, January 0). sarasota county wateratlas. Retrieved from wateratlas.org: https://sarasota.wateratlas.usf.edu/library/learn-more/learnmore.aspx?toolsection=lm_dissolvedox#:~:text=Dissolved%20oxygen%20(DO)%20is%20one,byproduct%20of%20aquatic%20plant%20photosynthesis.
- Shobhana Ramteke, V. V. (2016). Pit Lake Water Quality of Central India. Journal of Geographic Information System, 8.
- T. Subramani, N. R. (2009). Groundwater geochemistry and identification of hydrogeochemical processes in a hard rock region, Southern India. Environmental Monitoring and Assessment, 162, 123–137.
- WHO. (1996). Guidelines for drinking-water quality. In W. H. Organization, Health criteria and other supporting information (2 ed., Vol. 2). Geneva, Switzerland.
Disclaimer/Publisher’s Note: The statements, opinions and data contained in all publications are solely those of the individual author(s) and contributor(s) and not of MDPI and/or the editor(s). MDPI and/or the editor(s) disclaim responsibility for any injury to people or property resulting from any ideas, methods, instructions or products referred to in the content. |
© 2023 by the authors. Licensee MDPI, Basel, Switzerland. This article is an open access article distributed under the terms and conditions of the Creative Commons Attribution (CC BY) license (http://creativecommons.org/licenses/by/4.0/).
Copyright: This open access article is published under a Creative Commons CC BY 4.0 license, which permit the free download, distribution, and reuse, provided that the author and preprint are cited in any reuse.