
Submitted:
31 January 2023
Posted:
02 February 2023
You are already at the latest version
Abstract
We present an experimental study of the coherence properties of a single heavy-hole spin qubit formed in one quantum dot of a gated GaAs/AlGaAs double quantum dot device. We use a modified spin-readout latching technique in which the second quantum dot serves both as an auxiliary element for fast spin-dependent readout within a 200ns time window and also as a register for storing the spin-state information. To manipulate the single-spin qubit we apply sequences of microwave bursts of various amplitudes and durations to make Rabi, Ramsey, Hahn-echo, and CPMG measurements. As a result of the qubit manipulation protocols combined with the latching spin readout, we determine and discuss the achieved qubit coherence times: T1, T_Rabi, T2*, and T_CPMG vs microwave excitation amplitude, detuning and additional relevant parameters
Keywords:
spin
; holes
; Rabi
; EDSR
; qubit
; quantum dot
; spin readout
Introduction
The GaAs material system has a long history in quantum technology [1]. The majority of the techniques currently being employed in Si and Ge electronic quantum transport devices were first developed in GaAs. Additionally GaAs possesses several favourable properties for quantum circuits based on hole spins and quantum platform hybridization. These include its direct bandgap for photon to spin conversion (2), strong spin-orbit coupling for fast spin manipulation and an effective hole g-factor that can be tuned in-situ using several approaches for addressable manipulation [2,3,4]. While its coherence times cannot match those of silicon or germanium a predicted weaker interaction with nuclei would suggest increased coherence times compared to the GaAs electronic case [5]. With this in mind in a series of papers we have recently studied this system employing a double quantum dot in the single and two-hole regimes [6]. In this paper we extend this work to characterise the coherent properties of the single hole spin qubit by exploring Rabi, and T2 times using Rabi oscillations, Ramsey fringes, Hahn-echo, and CPMG measurements. Spin-blockade techniques used frequently in electronic systems for qubit readout [7,8,9] cannot be straightforwardly used for holes in GaAs due to a strong tunneling spin-orbit coupling that limits the spin blockade efficiency. To solve this difficulty we developed a new readout technique by adapting the original qubit latching technique [10] and showed in Ref. [11] how it could be used to measure spin relaxation time, T1. In this paper we demonstrate how this technique can be modified further for Rabi and other coherence time measurements. We obtain coherent characteristics of a single hole qubit in GaAs. Finally we discuss physics and the implications of the numbers obtained TRabi (~600ns), (~15ns) and (~1µs).
Sample and single-shot readout
Figure 1a features a scanning electron (SEM) image of the gate layout of the double quantum dot (DQD) device similar to one studied in this work but without a large global gate that lies over the imaged area that is present in the device. The DQD is formed in a GaAs/AlxGa1-xAs (x=0.5) undoped heterostructure using fine surface Schottky gates fabricated by e-beam lithography. A global accumulation gate is deposited over a 110 nm Al2O3 dielectric layer and is used to generate 2D holes at the GaAs/AlGaAs interface located 65 nm below the surface [12]. Gates labeled as VL and VR are used to tune energy levels of the dots and perform the spin manipulations and read out protocols described below. Voltage detuning pulses and microwave (MW) bursts of variable amplitude duration are applied to the left control gate, VL. Current through the nearby charge sensor labeled in Figure 1a as ICS is used to detect single hole charges and map out the charge occupation of the DQD device as a function of VL and VR gate voltages in the form of a stability diagram shown in Figure 1b. The charge sensor current was amplified by a room temperature current-voltage converter (Basel Precision Instruments SP983C) and sent to a digital milli-voltmeter set to 1 NPLC=16ms averaging time. More details on the device have been presented in our previous publications reviewed in Ref. [6]. The device is capable of reaching the last hole regime in each dot. Figure 1b shows a stability diagram covering the four charge configurations of this regime. The vertical dash line with points is the detuning line used in the manipulation and readout protocols that will be described below. In this study, a single hole spin qubit is formed in the left dot. This state is manipulated using MW pulses applied to the left control gate, VL, while the right QD is used for fast spin readout and as a memory register to store the information.
The readout technique used is adapted from our previous experiments used to measure the spin relaxation time constant, T1, based on the transfer of spin information into a charge state with latching [11]. It takes advantage of the strong spin-orbit interaction in this system which allows for efficient non spin-conserving tunneling to take place [13]. The basic readout scheme principle is to transfer the higher spin state of the spin qubit formed in the left quantum dot after manipulation to the second ‘readout’ quantum dot with a reproducible probability (~50%) of transfer if the upper spin state of the qubit is occupied. During measurements the successful transfer probability to the right quantum dot is therefore a direct measure of the occupancy of the upper spin state of the manipulated spin in the left quantum dot. To measure this probability the charge state of the device is measured using the QPC charge detector via room-temperature electronics. Using such a scheme we showed [11] that fast spin relaxations can be measured using electronics with several orders of magnitude slower time response compared to the spin relaxation process. For the experiments in this work the modified scheme was as follows. Firstly, it was important to set the three tunneling times appropriately. The tunneling time from the left quantum dot to the left lead was set to be fast (tL < 20 ns). By contrast the tunneling barrier from the right dot to the right lead is very slow (tR>> 16ms). The tunneling time between the dots on resonance was set to . That is the following condition should be fulfilled. The specific protocol used in the measurements is shown in Figure 2. The pulse sequence is illustrated in Figure 2a together with times and labels relevant to the positions in the stability diagram. In Figure 2b the critical locations labelled in Figure 2a resulting from the pulse are indicated on the stability diagram (M - measure, T - transfer, I –initialization, and D - drive). In Figure 2c schematics of the energy levels and the occupations during the whole sequence ((1) to (7)) are presented. To begin describing the sequence we consider the occupation possibilities resulting from the previous cycle since this is required to perform the necessary initialization. At the end of any cycle (at position M) the two charge occupation possibilities are either a single hole in the right dot (0,1) or an empty system (0,0). For each new cycle it is first necessary to initialize the system in the ground state with a spin up hole in the left dot. This is accomplished by first ensuring the system is empty by transferring the hole in the right dot via the left dot to the left lead i.e. (0,1) to (1,0) to (0,0) (steps 1 through 3 in the sequence), and then adding a single hole from the left lead to the left dot. After waiting sufficiently longer than the T1 spin relaxation time we can ensure the system is initialized in the spin up state in the left dot (Step 4 in the sequence). In this work we used an initialization wait time 10 ms which is much longer than the T1 as will be discussed later in Figure 4e. In Figure 2c the schematics illustrate both readout situations i.e. where the system starts either in (0,0) or (0,1) at the end of the previous cycle. The single hole in the left dot is then manipulated with microwave pulses to perform specific measurements using Rabi, Ramsey, Hahn echo, or CPMG pulse sequences. This is step 5 in the diagram shown in Figure 2. At the conclusion of the microwave sequence the readout is initiated by aligning the upper spin level in the left dot with the lower spin level in the right dot. If the upper spin level of the left dot is occupied at the end of the microwave pulses it will have a 50% occupation probability of transferring to the right dot at the end of the alignment step (i.e. creating a (0,1) charge occupation). If the lower spin state is occupied at the end of the manipulation the system will remain in the (1,0) state at the end of the transfer process. An alignment time of ~200ns was found to be optimal (step 6 in the sequence) for the transfer. At the conclusion of the transfer step, the left dot if occupied is emptied into the left lead (step 7 in the sequence). Thus at the end of the whole sequence there are two charge occupation probabilities (which are easily distinguished by the charge detector as described above). If the hole occupied the lower spin state (up) at the end of the manipulation the device charge state would be (0,0). If the upper (spin up) state was occupied then each of the (0,1) and (0,0) charge configurations would be occupied with a 50% probability. Monitoring changes in the occupation The readout technique used is adapted from our previous experiments used to measure the spin rela probability of the (0,1) state was used as the readout latching register for the spin measurements in this paper.
Rabi oscillations
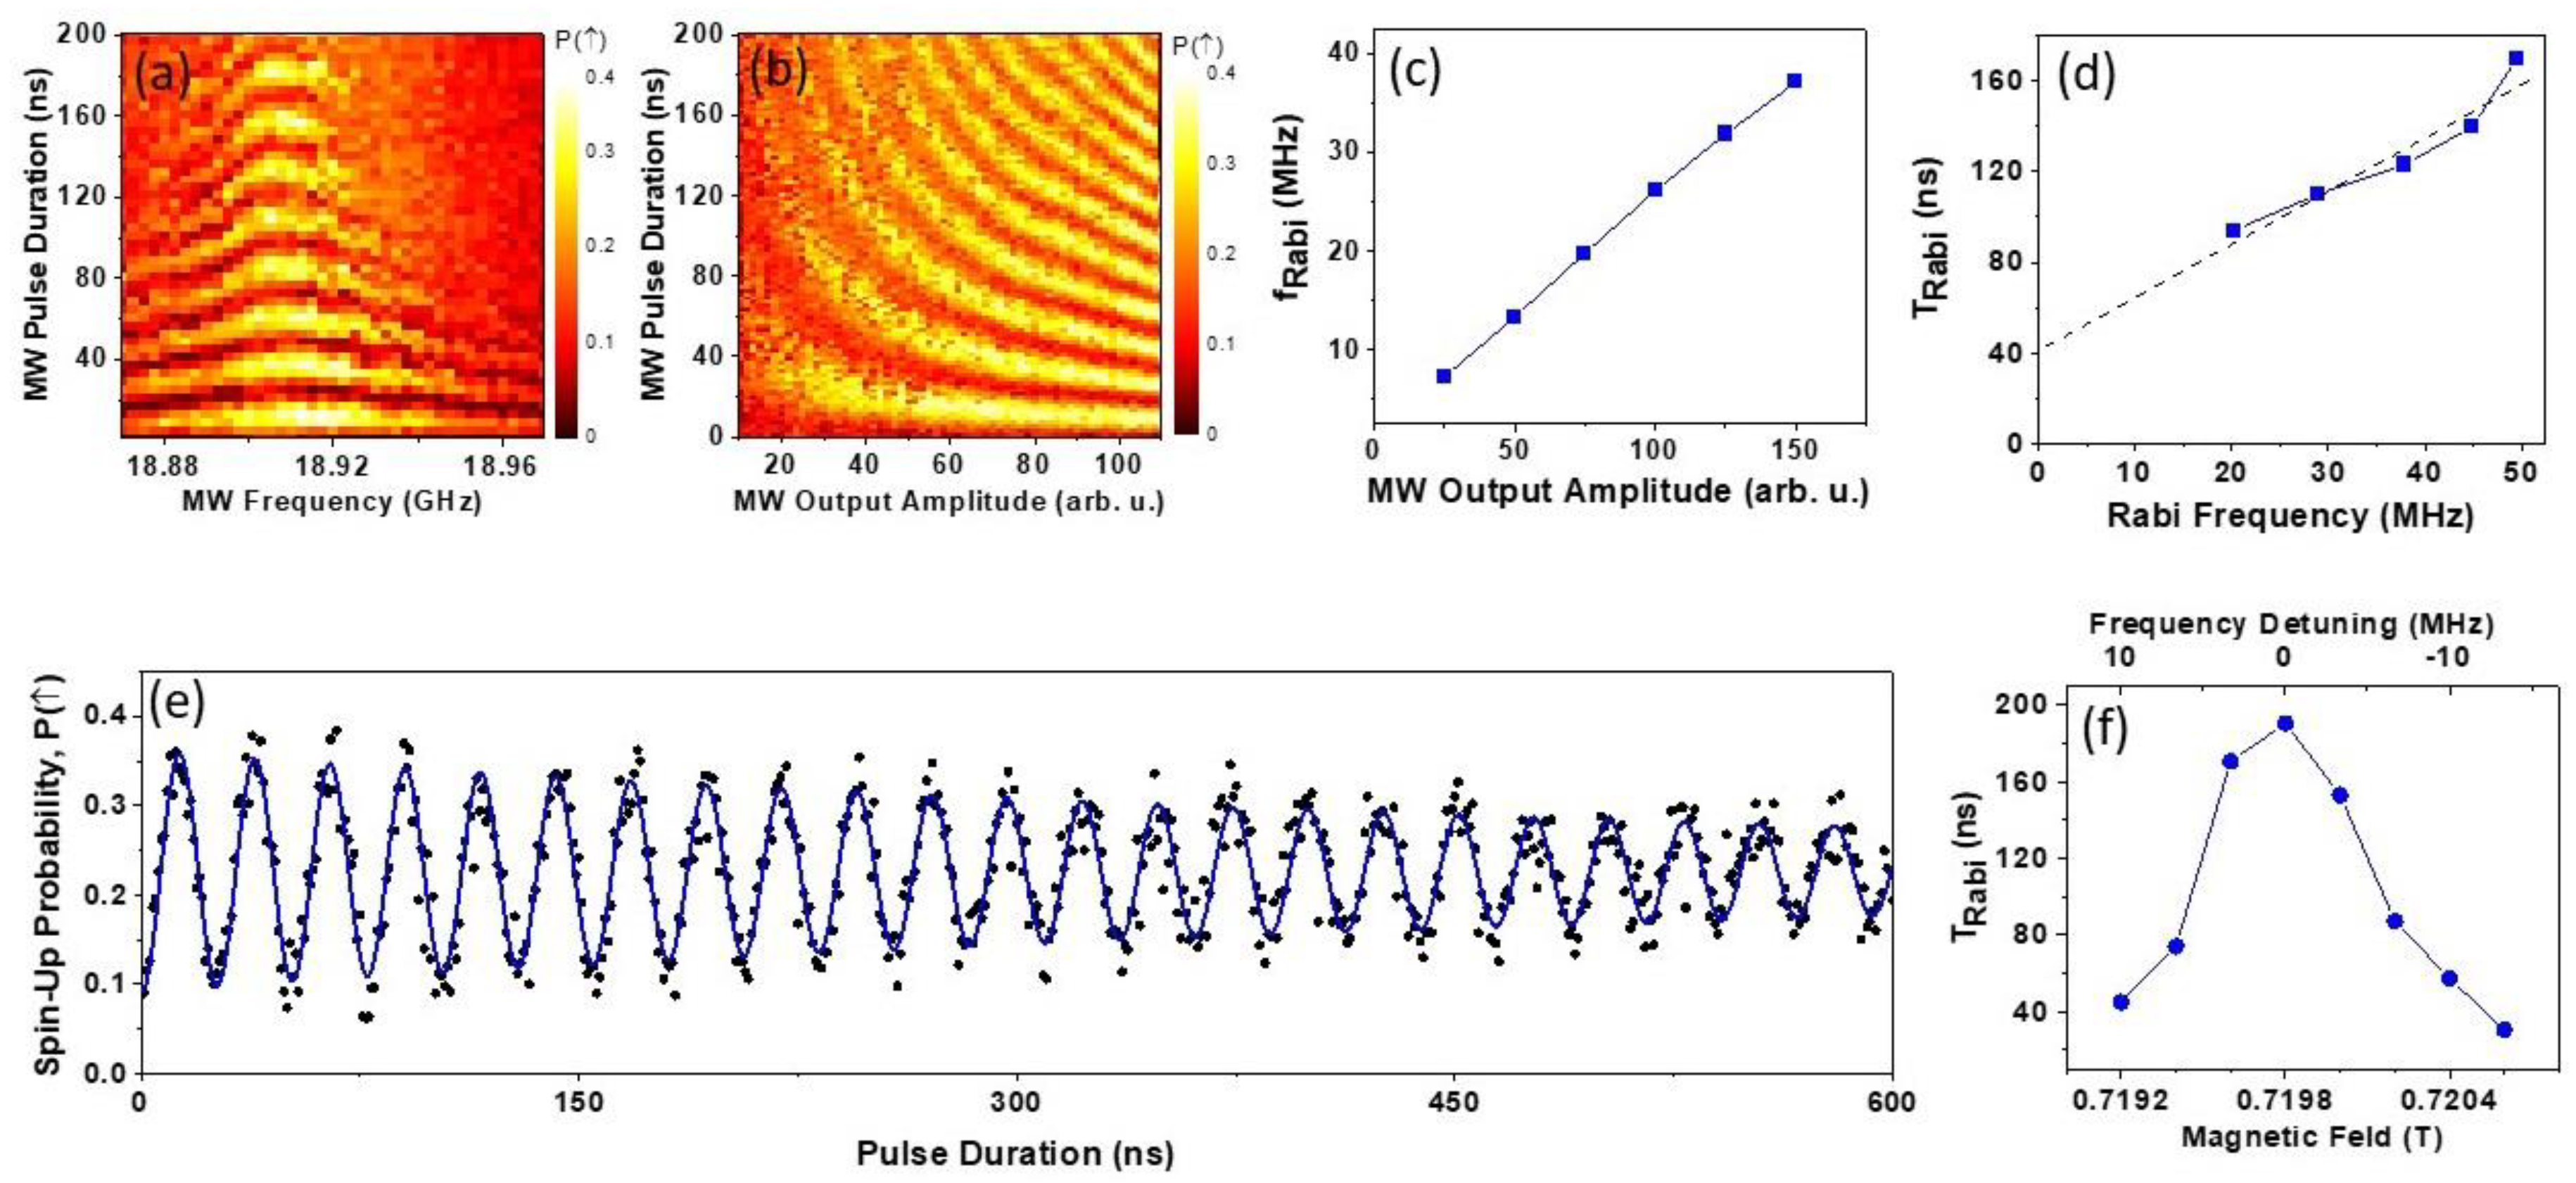
Controlled coherent rotations of a spin qubit require application of MW bursts at the spin Larmor precession frequency, e.g. by employing hole electric dipole spin resonance (EDSR) [4]. Here is the microwave cyclic frequency, is hole effective g-factor, is Bohr magneton, and B is the magnetic field normal to the sample surface. When the MW burst frequency is tuned to the hole spin Larmor frequency, spin Rabi rotations are induced around the big circle between the North and the South poles of the Bloch Sphere (in the rotating frame). These rotations can be observed by measuring the spin-up probability, in the form a 2D color map vs different control parameters. Figure 3a shows an example of the Rabi pattern measured at as a function of the MW pulse duration and frequency. The spin up probability is an averaged result of 200 single shot measurements employing the modified single-shot latching technique described above. A clear chevron-like pattern is evident in Figure 3a as expected for Rabi oscillations. It is notable that the visibility of the oscillations quickly diminishes when the frequency is detuned from the center line f0=18.91GHz which will be discussed later.
Figure 3b presents a 2D map of the Rabi oscillations as a function of the MW pulse duration and amplitude. The amplitude is given in arbitrary units as it is technically difficult to precisely calibrate the frequency transmission of the MW lines and measure the signal amplitude actually reaching the control gate, VL. In the experiment presented in Figure 3b, the MW frequency was kept at the peak frequency while the pulse duration and the output amplitude of the MW generator varied. As expected, the Rabi frequency increased with the MW amplitude. Also, it is qualitatively evident that the Rabi coherence time,, is larger at larger MW driving amplitudes. This is consistent with Figure 3a, where the apparent coherence of the Rabi oscillations diminishes with detuning from the central frequency which is equivalent to reducing the effective driving force.
In order to determine the Rabi frequency, fRabi, and the Rabi relaxation time constant, TRabi, we conducted separate experiments close to the central frequency stepping the MW pulse duration to longer intervals, taking and averaging 500 single-shot measurements for each data point. It should be noted that the employed spin read-out method requires an exact alignment of the levels at the read-out step 6 (Figure 2c) and, therefore, the read-out fidelity is sensitive to slow 1/f noise and drifts. To compensate for any slow 1/f noise, we repeated measurements 8 times in succession and averaged all traces. Figure 3c presents a line graph of the Rabi frequency dependence as a function of the driving MW amplitude. In this graph we observe a close to linear dependence of the Rabi frequency between 10 and 40 MHz. At higher MW driving amplitudes (measured in separate experiments without trace averaging, not shown) fRabi saturated at about 50 MHz. It indicates that the hole spin rotation can be performed in 12 ns, which is very close to the reported values of Rabi rotations in electronic GaAs DQD devices equipped with micromagnets [14]. This is an impressive result since it is expected to be more challenging to manipulate heavy hole spins due to their large g-factor anisotropy [3].
It is qualitatively evident from Figure 3b that the coherence time depends on the MW driving amplitude. It is well-known that the coherence time of continuously driven oscillations differs from and T2 extracted from Ramsey and CPMG experiments [1,5,15,16,17]. In order to obtain qualitative data about TRabi, we conducted single Rabi traces at the central frequency fMW=f0, and fitted each trace with an exponentially decaying sinusoid, where is the MW pulse duration, is the Rabi coherence time, is an instrumental phase factor, and =1/fRabi is the Rabi period. From this procedure we determined two fitting parameters, TRabi and fRabi, both of which vary with the MW amplitude. Since the MW amplitude is less well calibrated, it is instructive to examine dependence of TRabi as a function of fRabi, which is plotted in Figure 3d. Note, because such a dependence of has not been discussed in the literature, we approximate it with a linear dependence (dashed line). Qualitatively, we can conclude that TRabi increases with the Rabi frequency, corresponding to the increasing driving amplitude. This behaviour is expected for TRabi limited by the hyperfine interaction [5]. However, decoherence in a single trace is not explicitly taken into account in Ref. [5] rather the decay is attributed to averaging, related to slightly different hyperfine fields for each individual trace. In the data presented in Figure 3d the linear dependence extrapolated to zero intersects the Y-axis at TRabi=40 ns, not at zero. We speculate, that this indicates that the free evolution decoherence processes needs to be taken into account to simulate the dependence presented in Figure 3d. More details are outside of the scope of this experimental report.
Continuing our analysis of the Rabi chevron in Figure 3a, we conducted an additional experiment to extract quantitative data about the Rabbi coherence time vs detuning frequency away from the center line, . In order to minimize the consequences of the non-uniform frequency transmission function of MW lines, we positioned the EDSR centre frequency in the middle of the flat region of the transmission spectrum and stepped the magnetic field. Similar to the experiments presented in panels (c,d), six consecutive Rabi traces vs. MW burst duration were measured in succession and averaged for each magnetic field, which was stepped around the EDSR resonance , with being an effective hole g-factor [18,19]. The Rabi traces are fitted with a sinusoidal decaying function as described above to extract the TRabi. The Rabi coherence time constant is plotted in Figure 3f as a function of the magnetic field. For convenience of a comparison with other data, the top axis in this plot is given in frequency units using . It is evident from this plot that the coherence time sharply decays within a range away from the center line. We speculate that this behavior is closely linked to the power dependence of TRabi presented in Figure 3b,d. Detuning MW frequency from f0 leads to reduced excitation strength or effectively to a reduced power. Therefore, these two phenomena presented in Figure c,d should be considered together to understand the underlying microscopic mechanisms affecting the Rabi coherence time.
To conclude this section, Figure 3e presents an example of a single Rabi trace with our longest coherence time and Rabi frequency . As mentioned above, our readout method is sensitive to the precise alignment of the levels during the read-out transfer step which is susceptible to 1/f slow electrical noise. This leads to apparent amplitude fluctuations during measurements of spin up probability. For this reason we employ the additional averaging of several consecutive traces. In addition, as is evident from Figure 3f the Rabi coherence time strongly depends on the precise positioning, stability of the effective g-factor, and precise position of the center frequency, which is difficult to determine with good precision using a few Rabi oscillations. On occasion, experiments were interrupted by small telegraphic noise events requiring the ongoing experiment to be restarted after gate voltages were properly re-tuned to restore correct operation points (Figure 1b) and proximity to the EDSR resonance. Nevertheless, based on this result, our data provides evidence that faster read-out methods and more precise tuning to the resonance frequency will result in longer TRabi measured coherence times.
Ramsey and CPMG results and discussion
Using the calibrations from the Rabi measurements, Ramsey experiments were conducted to determine the coherence time of the system [20,21]. Ramsey fringes experiments use two pulses separated by the wait time, . Figure 4a shows a Ramsey type measurement conducted at obtained by changing the MW burst frequency of the two pulses (rotation around the X-axis of the Bloch sphere) and the delay time between them (rotation around the Y-axis of the Bloch sphere). Surprisingly based on our initial expectations, the coherence time of the Ramsey fringes signal is diminished for relatively small above ~50 ns. This measurement was repeated several times under different conditions obtained by switching between flat zones of the MW frequency transmission function, MW power, and gate detuning positions with results consistently similar to one shown in Figure 4a. The overlaid lines in blue indicate the expected fringe position following well-known Ramsey fringes formula, where being the central frequency, being the wait time. This coherence time was extended by introducing one or more refocusing pulses, corresponding to Hanh-echo and CPMG pulse sequences [22]. The Ramsey and Hahn echo experiments are presented in Figure 4a,b. Each of these plots represents the average of eleven successive Ramsey traces performed at the central frequency () for. Figure 4b shows a Ramsey measurement at the central frequency in panel (a) stepping the wait time between the two pulses plotted on a logarithmic scale to display the large dynamic range of wait times. Each point in the plot is an average of 500 single-shot measurements of spin-up probability. The data are fitted with a decaying exponential function (solid line) which indicates a coherence time of. We find this to be a very surprising result which is in contrast to a ten fold enhancement over the GaAs electronic system predicted to occur due to the smaller hyperfine interaction [1,23]. We speculate the following may contribute to the observation.
The hole quantum dot is smaller than the equivalent electron quantum dot as a consequence of the larger hole effective mass [24] compared to electron mass in GaAs . Comparing images of the hole devise in Figure 1a with a typical lateral GaAs quantum dot, e.g. in Ref. [25] the lateral dimensions of the hole device are about 10x smaller. This may be expected to lead to stronger hyperfine fluctuations experienced by the holes. The statistically fluctuating nuclear effective field is of the order of with A being the hyperfine interaction constant and N the number of nuclei interacting with the hole [26]. Therefore, in a hole device since there are a smaller number of interacting nuclei the amplitude of nuclei field fluctuations is greater. The two effects, the smaller hole hyperfine interaction and larger nuclear fluctuations in a smaller QD may be expected to compensate one other resulting in similar coherence decoherence time. In other words, the advantage of holes related to their p type orbital for hyperfine decoherence can be potentially wiped out by the smaller size of the hole. An important conclusion from this observation is that larger quantum dots constructed in materials with smaller effective mass (e.g. from strained p-type germanium [27] are more desirable to reduce hyperfine decoherence effects.
Figure 4.
(a) Ramsey fringes measured by the spin-up probability using a sequence of two MW pulses of different frequency (x-axis) separated by the wait time (Y-axis). Dotted lines indicate expected position of the fringes (for more details see text); (b) Spin up probability measured in the Ramsey experiment (points) fitted by an exponential decay (solid line); (c) spin up probability measured in Hahn echo experiment (points) fitted with an exponential step function (solid line); (d) coherence time for different number of re-focusing CPMG pulses for two values of magnetic field (for details see text); (e) longitudinal spin relaxation time T1 combined with Ramsey and Hahn echo results.
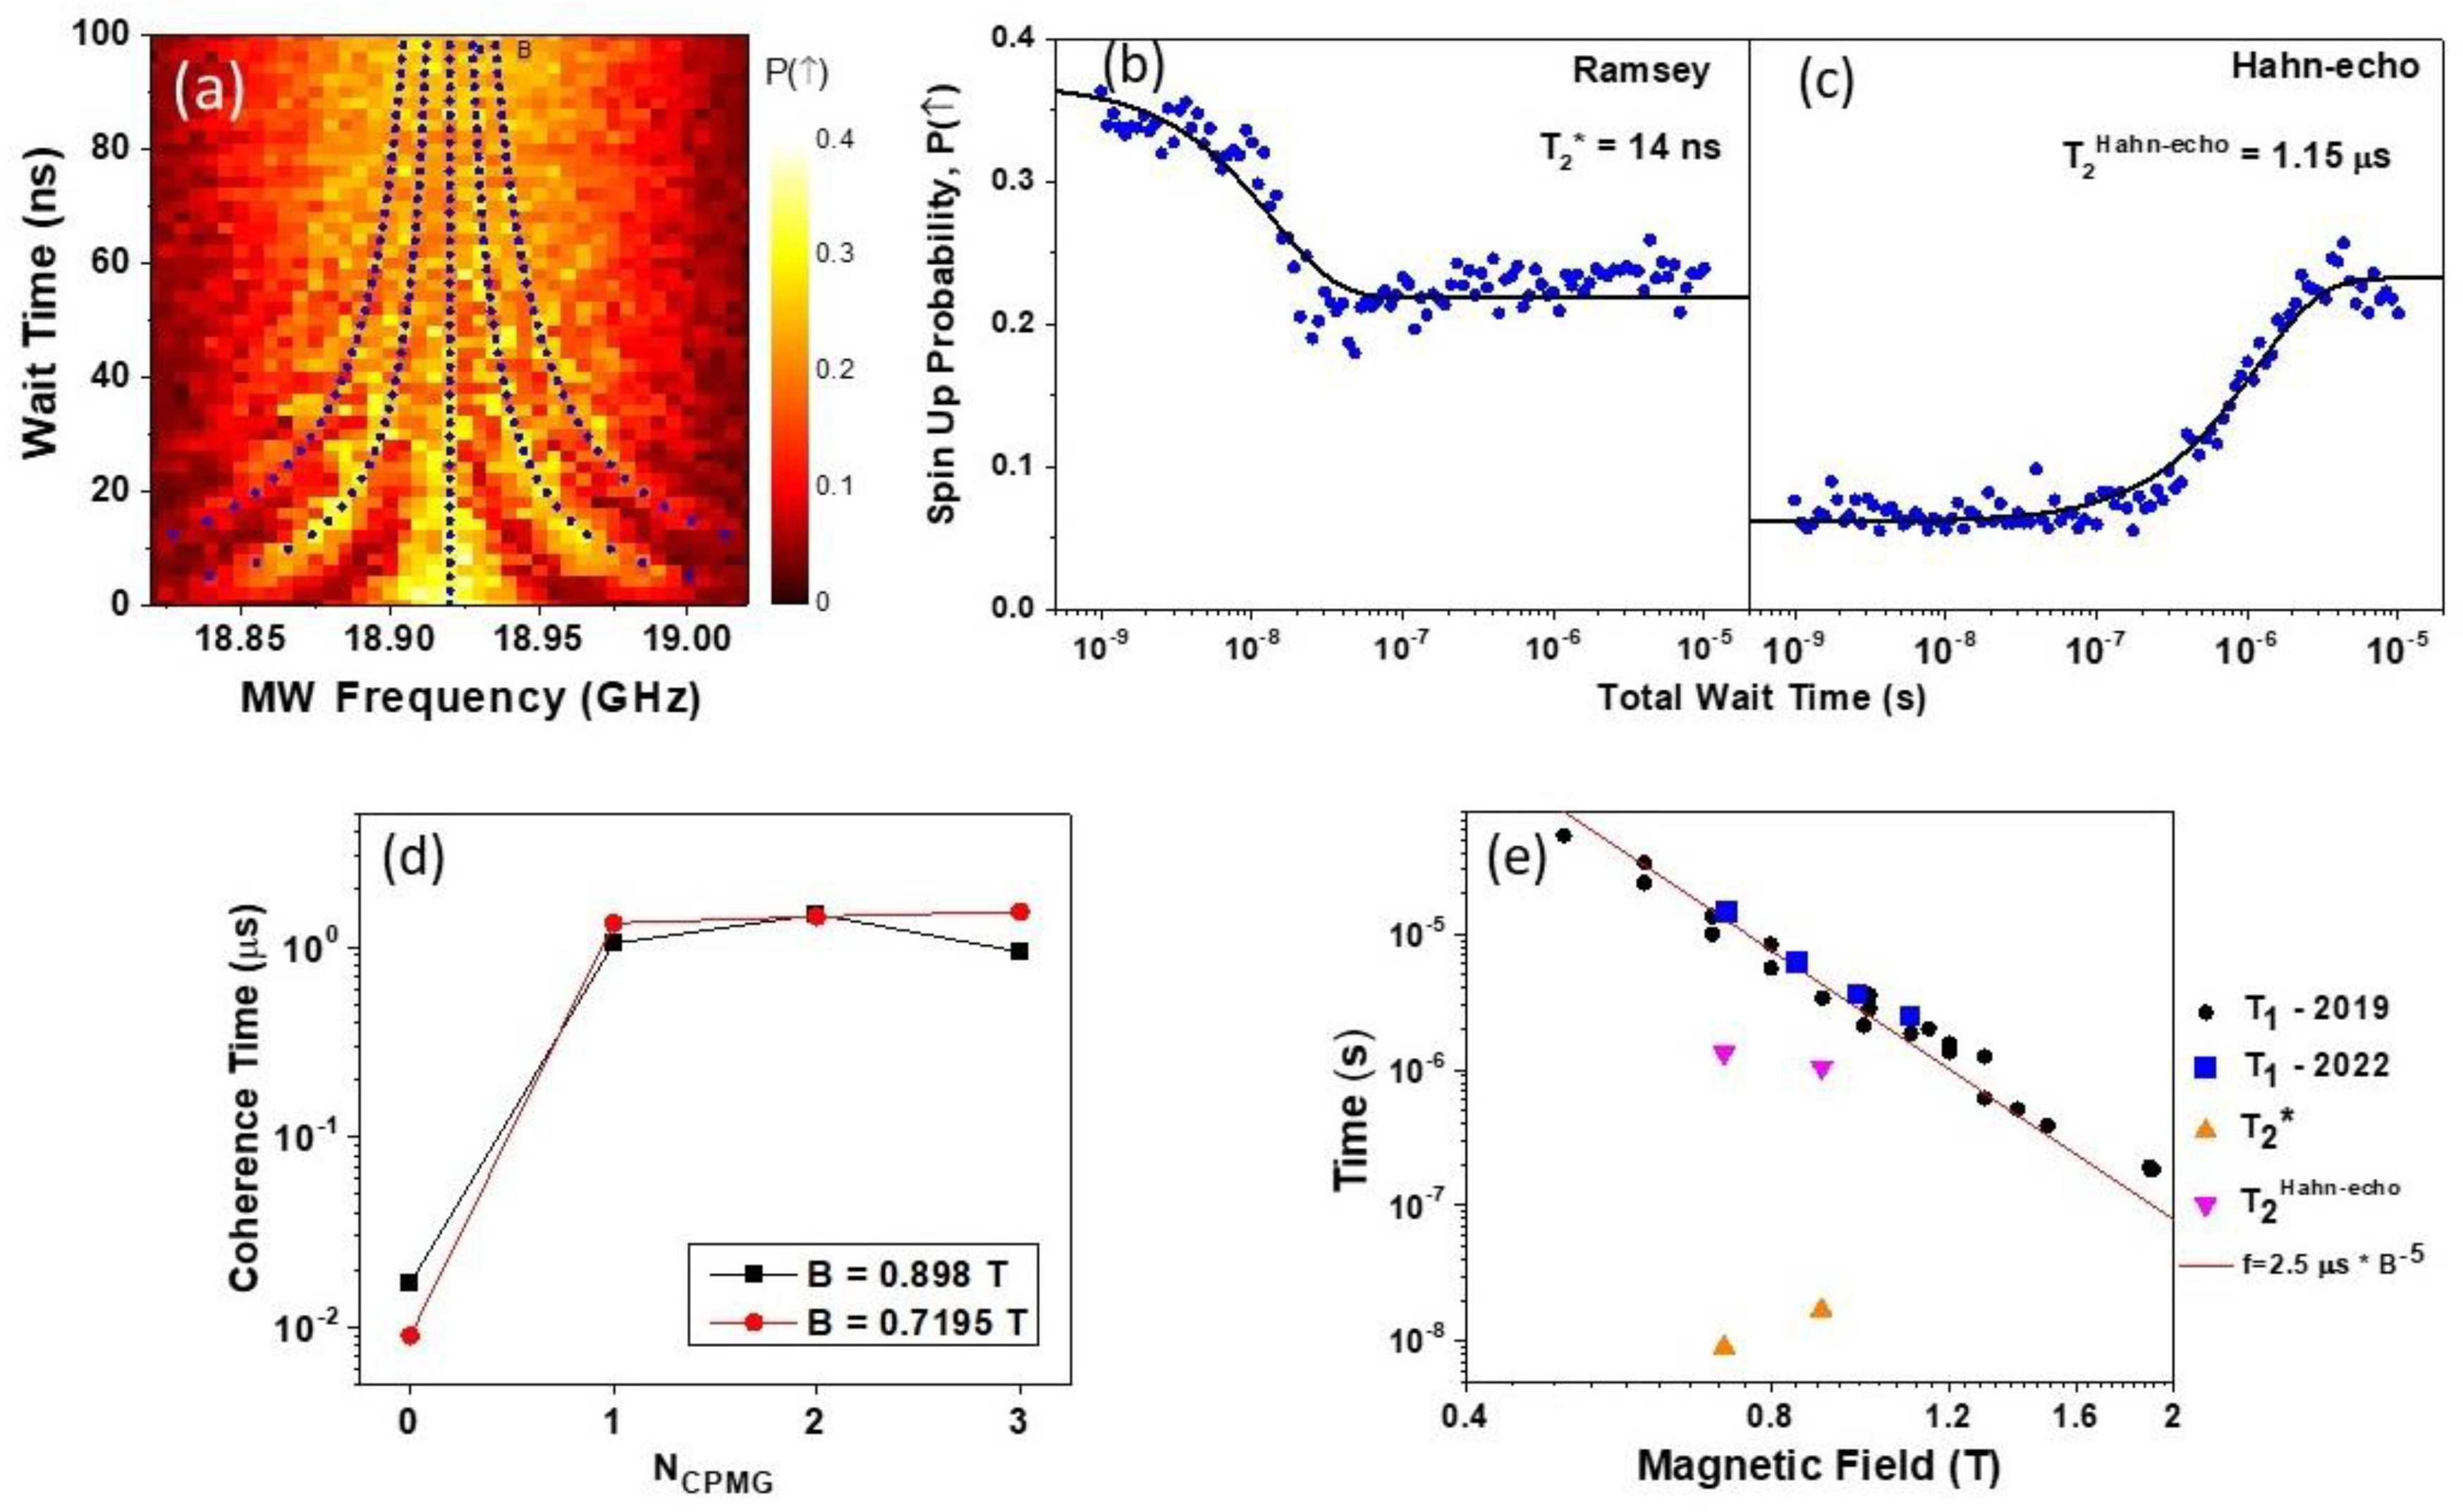
The panel in Figure 4c shows the spin-up probability for a Hahn-echo experiment by introducing a pulse between the two pulses while varying the total wait time plotted on a logarithmic scale. The data is fitted with an exponential transition function (solid line). As expected for a single pulse the initial probability of the spin-up state is low for wait times shorter than the Hahn-echo coherence time,. The spin-up probability increases for long wait times eventually reaching the expected value of 0.25. It is evident from Figure 4c that the coherence time has been extended by almost two orders of magnitude to by introducing just one re-focusing pulse. Adding more refocusing pulses (CPMG sequence [**]) did not increase the coherence time further. The CPMG coherence time, , with the corresponding to the Ramsey (Hahn-echo) vs is presented in Figure 4d for two magnetic field magnitudes ( and ). For both data sets, the coherence time increased by approximately two orders of magnitude after the introduction of a single refocusing pulse. Such a sharp increase of the coherence time after adding just one re-focusing pulse supports the argument that the small decoherence times are limited by slow hyperfine nuclei fluctuations as discussed above.
Finally, it is important to compare and coherence time constants with the longitudinal spin relaxation time T1. We originally carried out T1 measurements in Ref. [11], but since this was three years ago we repeated the measurements on this particular cool down, noting that that the driving/relaxation point D is much deeper in the (1,0) region compared to our earlier measurements. The new results of this work are compared with earlier T1 measurements in Figure 4e. The spin relaxation T1 measurements agree closely with the previous results confirming the very good stability of the device for spin relaxation as well as the independence of T1 on specific gate voltages that is not obvious. For example, the T1 spin relaxation time may be affected by heavy hole –light (HH-LH) hole interactions which may be expected to depend upon the confining potential as defined by the gate voltages. In our device the confining potential is very shallow resulting in the light-hole states being above the confining DQD barrier resulting in an extended spatial distribution of the light hole wave function. This on one hand minimises the HH-LH interaction, while on the other hand it makes certain properties of the device more stable and predictable, including the absolute value of the effective g*-factor and it large anisotropy with respect to the magnetic field direction [3].
Theoretically, can be as long as, outlining the potential for improvement and an extension of investigations of this sample in the future. Figure 4d shows spin relaxation time measurements conducted on the same sample across various cooldowns compared with the newly measured and coherence times. The overlaid line, drawn from previous studies of the same DQD device (11) indicates the alignment of the data measured in 2019 (shown in black) with the dominant Dresselhaus spin-orbit interaction, identified by a dependence. The data collected via the same method in 2022 (shown in blue) exhibits consistency with these previous results despite being measured after multiple warm-up and cool-down cycles of the sample.
Conclussion
In conclusion, we have conducted an experimental study of the coherence properties of a single heavy hole spin qubit formed in a gated GaAs/AlGaAs double quantum dot device. Holes possess a very large spin orbit interaction which is beneficial for fast spin manipulation techniques, but on the other hand, leads to suppression of the spin blockade phenomenon commonly used for spin-read out. We overcame this difficulty by devising a modified method to read the spin state by employing a neighboring dot in a charge-latching regime as an axillary element for fast spin readout and storing the information. The single hole spin qubit was characterized via Rabi, and the CPMG experiments, with NCPMG=0,1 corresponding to Ramsey and Hahn echo experiments, correspondingly. Despite the p-type nature of the hole wave function which is predicted to lead to a reduced decohering hyperfine interaction, unexpectedly, we observe very similar magnitudes to the electronic spin qubits in GaAs quantum dots. We explain this observation by the approximately 10-fold smaller size of the hole quantum dots due to larger effective mass leading to larger fluctuations of the nuclear field bath. We also explored the coherence properties of a single hole spin characterizing it by various time constants, and as a function of the MW detuning frequency, excitation amplitude, . We discussed the microscopic physical mechanisms limiting the coherence time that may be relevant and useful for other material systems.
Author Contributions
Conceptualization, Andrew Sachrajda and Sergei Studenikin; Formal analysis, Victor Marton; Investigation, Victor Marton, Andrew Sachrajda, Marek Korkusinski and Sergei Studenikin; Methodology, Alex Bogan; Software, Alex Bogan; Supervision, Sergei Studenikin; Validation, Marek Korkusinski; Writing – original draft, Victor Marton, Andrew Sachrajda and Sergei Studenikin.
Acknowledgments
We acknowledge Lisa Tracy, John Reno, and Terry Harget at Sandia National Laboratories for kindly providing the GaAs/AlGaAs DQD device. We thank Bill Coish for helpful discussions. We thank Harmohit Bindra for help with initial tuning of the device, and Peter Zawadzki for help with the cryogenics. This work was performed in part within the Quantum Sensors Challenge Program of the National Research Council Canada.
References
- P. Stano, D. Loss, Review of performance metrics of spin qubits in gated semiconducting nanostructures. Nature Reviews Physics 4, 672-688 (2022). [CrossRef]
- L. Gaudreau et al., Entanglement distribution schemes employing coherent photon-to-spin conversion in semiconductor quantum dot circuits. Semiconductor Science and Technology 32, 093001-093014 (2017). [CrossRef]
- Bogan et al., Consequences of Spin-Orbit Coupling at the Single Hole Level: Spin-Flip Tunneling and the Anisotropic $g$ Factor. Physical Review Letters 118, 167701-167705 (2017). [CrossRef]
- S. Studenikin et al., Electrically tunable effective g-factor of a single hole in a lateral GaAs/AlGaAs quantum dot. Communications Physics 2, 159 (2019). [CrossRef]
- F. H. L. Koppens et al., Universal Phase Shift and Nonexponential Decay of Driven Single-Spin Oscillations. Physical Review Letters 99, 106803 (2007). [CrossRef]
- S. Studenikin et al., Single-hole physics in GaAs/AlGaAs double quantum dot system with strong spin-orbit interaction. Semiconductor Science and Technology 36, 053001 (2021). [CrossRef]
- T. Fujisawa, D. G. Austing, Y. Tokura, Y. Hirayama, S. Tarucha, Nonequilibrium Transport through a Vertical Quantum Dot in the Absence of Spin-Flip Energy Relaxation. Physical Review Letters 88, 236802 (2002). [CrossRef]
- J. R. Petta et al., Coherent Manipulation of Coupled Electron Spins in Semiconductor Quantum Dots. Science 309, 2180-2184 (2005). [CrossRef]
- M. Ciorga et al., Addition spectrum of a lateral dot from Coulomb and spin-blockade spectroscopy. Physical Review B (Condensed Matter and Materials Physics) 61, R16315 (2000). [CrossRef]
- S. A. Studenikin et al., Enhanced charge detection of spin qubit readout via an intermediate state. Applied Physics Letters 101, 233101-233103 (2012). [CrossRef]
- Bogan et al., Single hole spin relaxation probed by fast single-shot latched charge sensing. Communications Physics 2, 17 (2019). [CrossRef]
- L. A. Tracy, T. W. Hargett, J. L. Reno, Few-hole double quantum dot in an undoped GaAs/AlGaAs heterostructure. Applied Physics Letters 104, 123101 (2014). [CrossRef]
- Bogan et al., Landau-Zener-Stuckelberg-Majorana Interferometry of a Single Hole. Physical Review Letters 120, 207701 (2018). [CrossRef]
- J. Yoneda et al., Fast Electrical Control of Single Electron Spins in Quantum Dots with Vanishing Influence from Nuclear Spins. Physical Review Letters 113, 267601 (2014). [CrossRef]
- V. V. Dobrovitski, A. E. Feiguin, R. Hanson, D. D. Awschalom, Decay of Rabi Oscillations by Dipolar-Coupled Dynamical Spin Environments. Physical Review Letters 102, 237601 (2009). [CrossRef]
- Y.-C. Yang, S. N. Coppersmith, M. Friesen, Achieving high-fidelity single-qubit gates in a strongly driven silicon-quantum-dot hybrid qubit. Physical Review A 95, 062321 (2017). [CrossRef]
- J. Jing, P. Huang, X. Hu, Decoherence of an electrically driven spin qubit. Physical Review A 90, 022118 (2014). [CrossRef]
- Padawer-Blatt et al., Characterization of dot-specific and tunable effective $g$ factors in a GaAs/AlGaAs double quantum dot single-hole device. Physical Review B 105, 195305 (2022). [CrossRef]
- J. Ducatel et al., Single-hole couplings in GaAs/AlGaAs double dots probed with transport and EDSR spectroscopy. Applied Physics Letters 118, 214002 (2021). [CrossRef]
- H. Watzinger et al., A germanium hole spin qubit. Nature Communications 9, 3902 (2018). [CrossRef]
- KawakamiE et al., Electrical control of a long-lived spin qubit in a Si/SiGe quantum dot. Nat Nano 9, 666-670 (2014). [CrossRef]
- F. K. Malinowski et al., Symmetric operation of the resonant exchange qubit. Physical Review B 96, 045443 (2017). [CrossRef]
- J. Fischer, W. A. Coish, D. V. Bulaev, D. Loss, Spin decoherence of a heavy hole coupled to nuclear spins in a quantum dot. Physical Review B 78, 155329 (2008). [CrossRef]
- F. Nichele et al., Spin-orbit splitting and effective masses in $p$-type GaAs two-dimensional hole gases. Physical Review B 89, 081306 (2014). [CrossRef]
- L. Gaudreau et al., Coherent control of three-spin states in a triple quantum dot. Nature Physics 8, 54-58 (2012). [CrossRef]
- V. Khaetskii, D. Loss, L. Glazman, Electron spin decoherence in quantum dots due to interaction with nuclei. Physical Review Letters 88, 1868021-1868024 (2002). [CrossRef]
- G. Scappucci et al., The germanium quantum information route. Nature Reviews Materials 6, 926–943 (2021). [CrossRef]
Figure 1.
(a) An SEM image of the double quantum dot (DQD) device similar to the one used in this work, but without the global gate laid over the fine surface gates. The yellow and red arrows show the direction of the charge sensing and inter-dot currents. The blue circles indicate the approximate locations of the two quantum dots. The labelled VL and VR gates are used to control the dot occupation and the detuning energy during the spin qubit manipulations. (b) An example of the charge stability diagram measured via the charge sensor current, dICS/dVL. Each region is labelled with the left and right dot hole occupations (nL,nR). The detuning trajectory is indicated as the dash white line with the detuning points of the control pulse sequence during the manipulation and read-out protocol labeled as measurement (M), transfer (T), initialization (I), and (D) Drive.
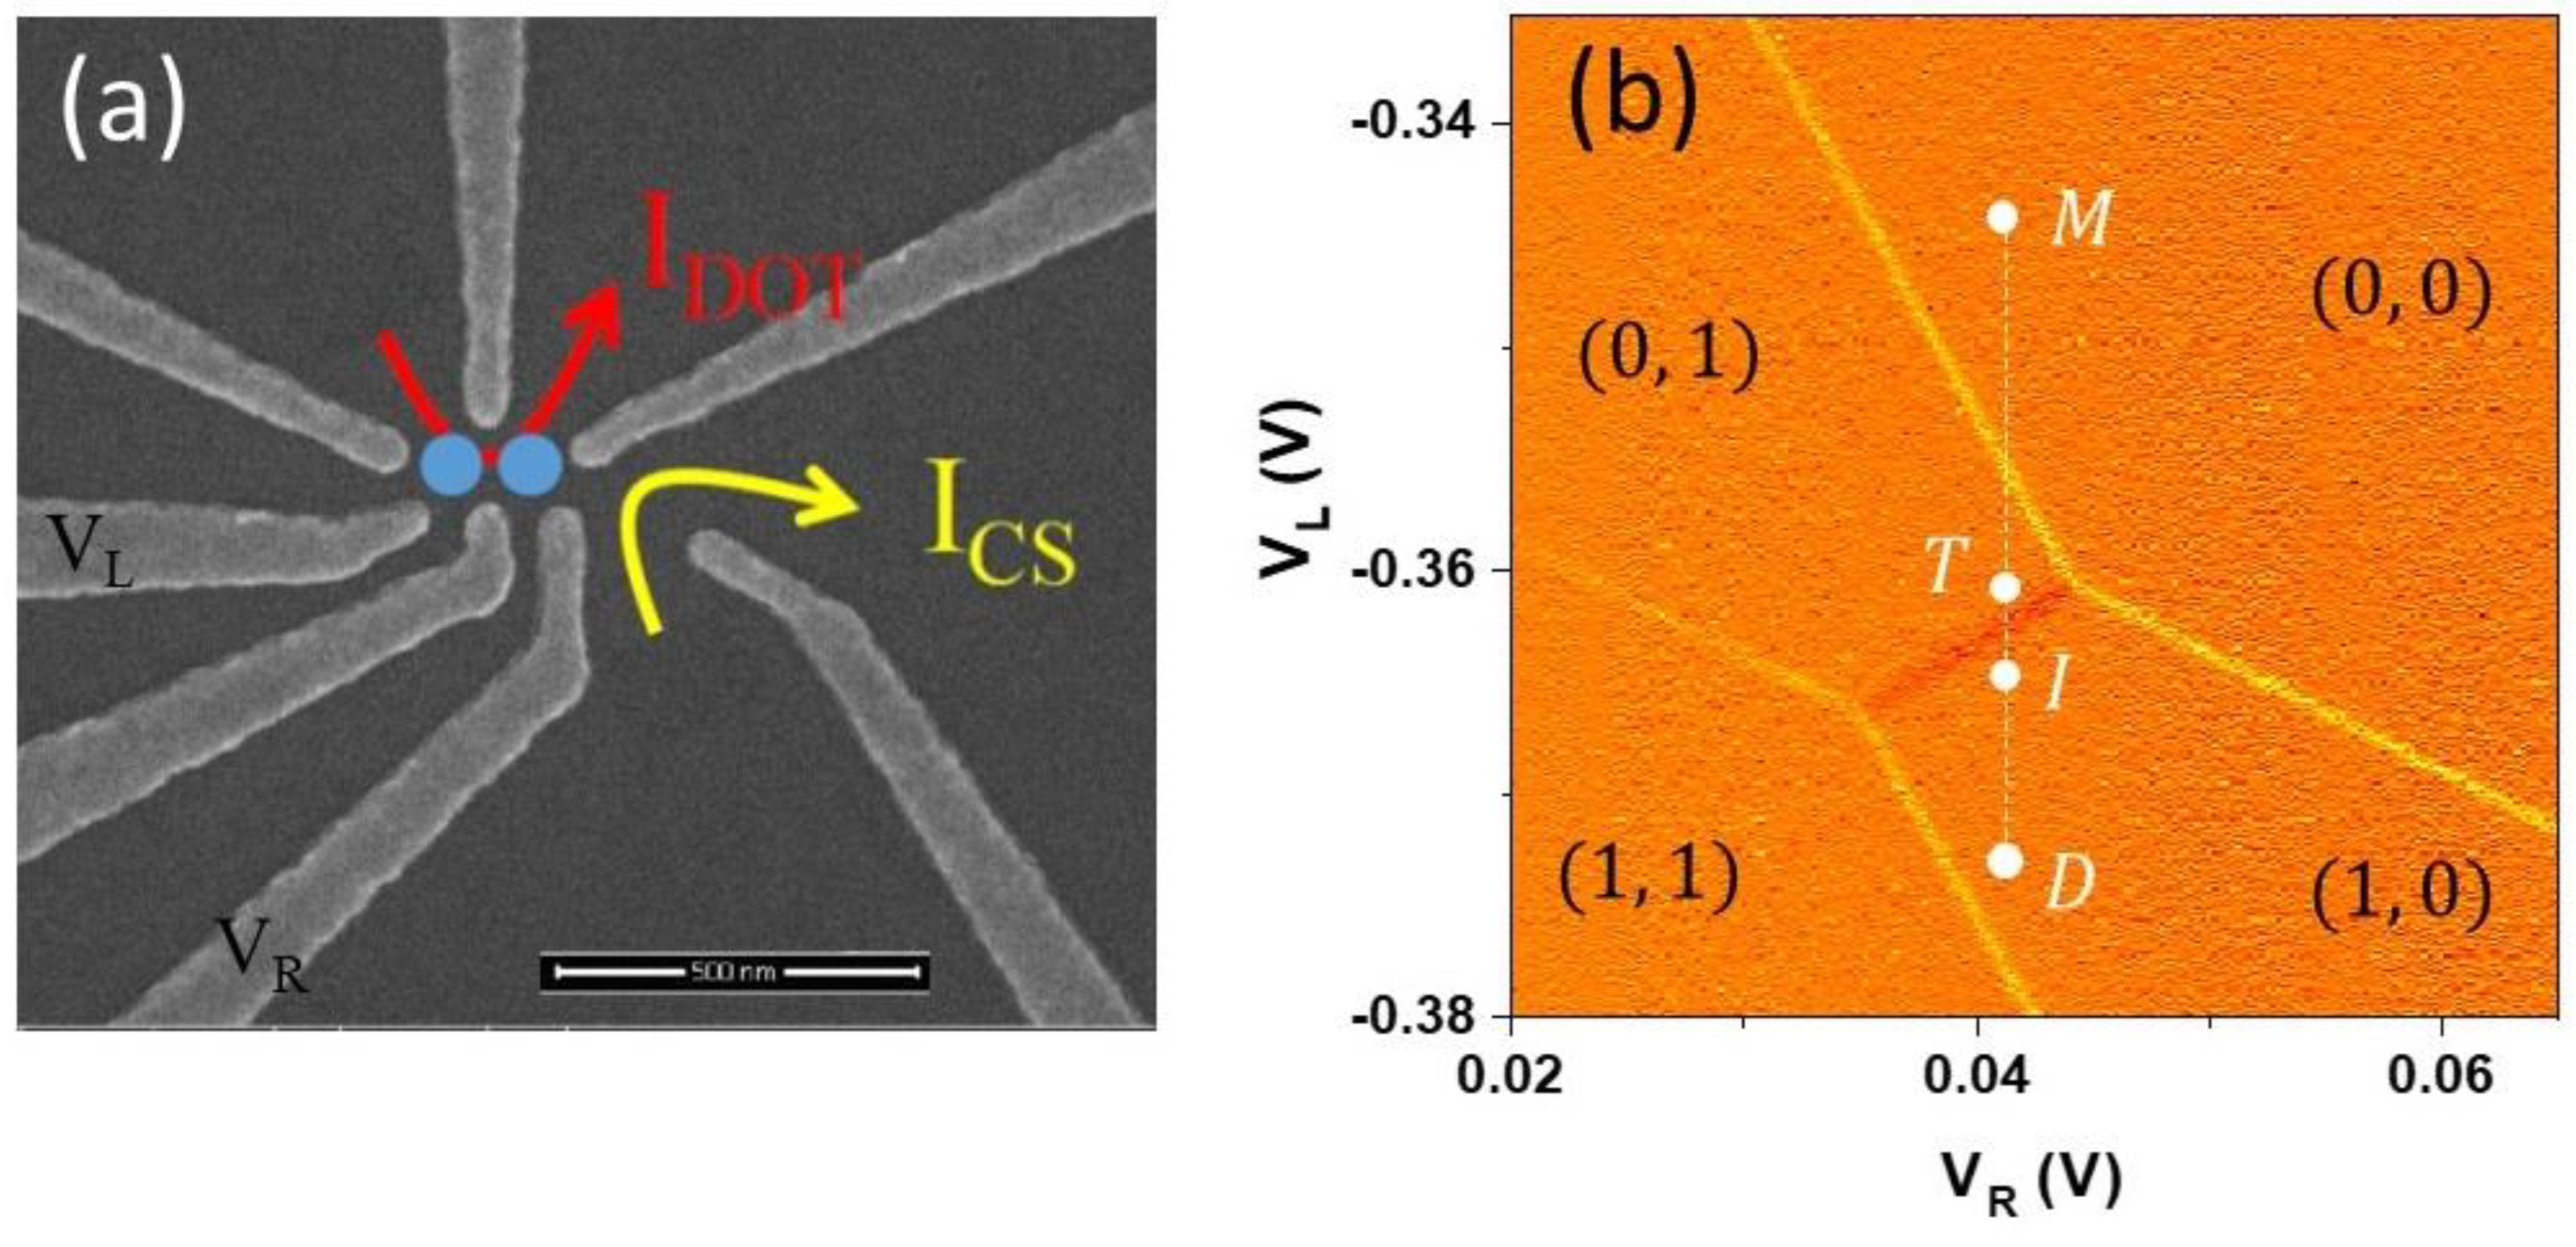
Figure 2.
(a) The control pulse sequence used in the spin manipulation and read-out experiments. (b) Schematic of the stability diagram plotted as the gate detuning voltages with respect to the drive point D. (c) The sequence of DQD energy diagrams with indicated occupations and transitions at each detuning point produced by the control pulse in (a).
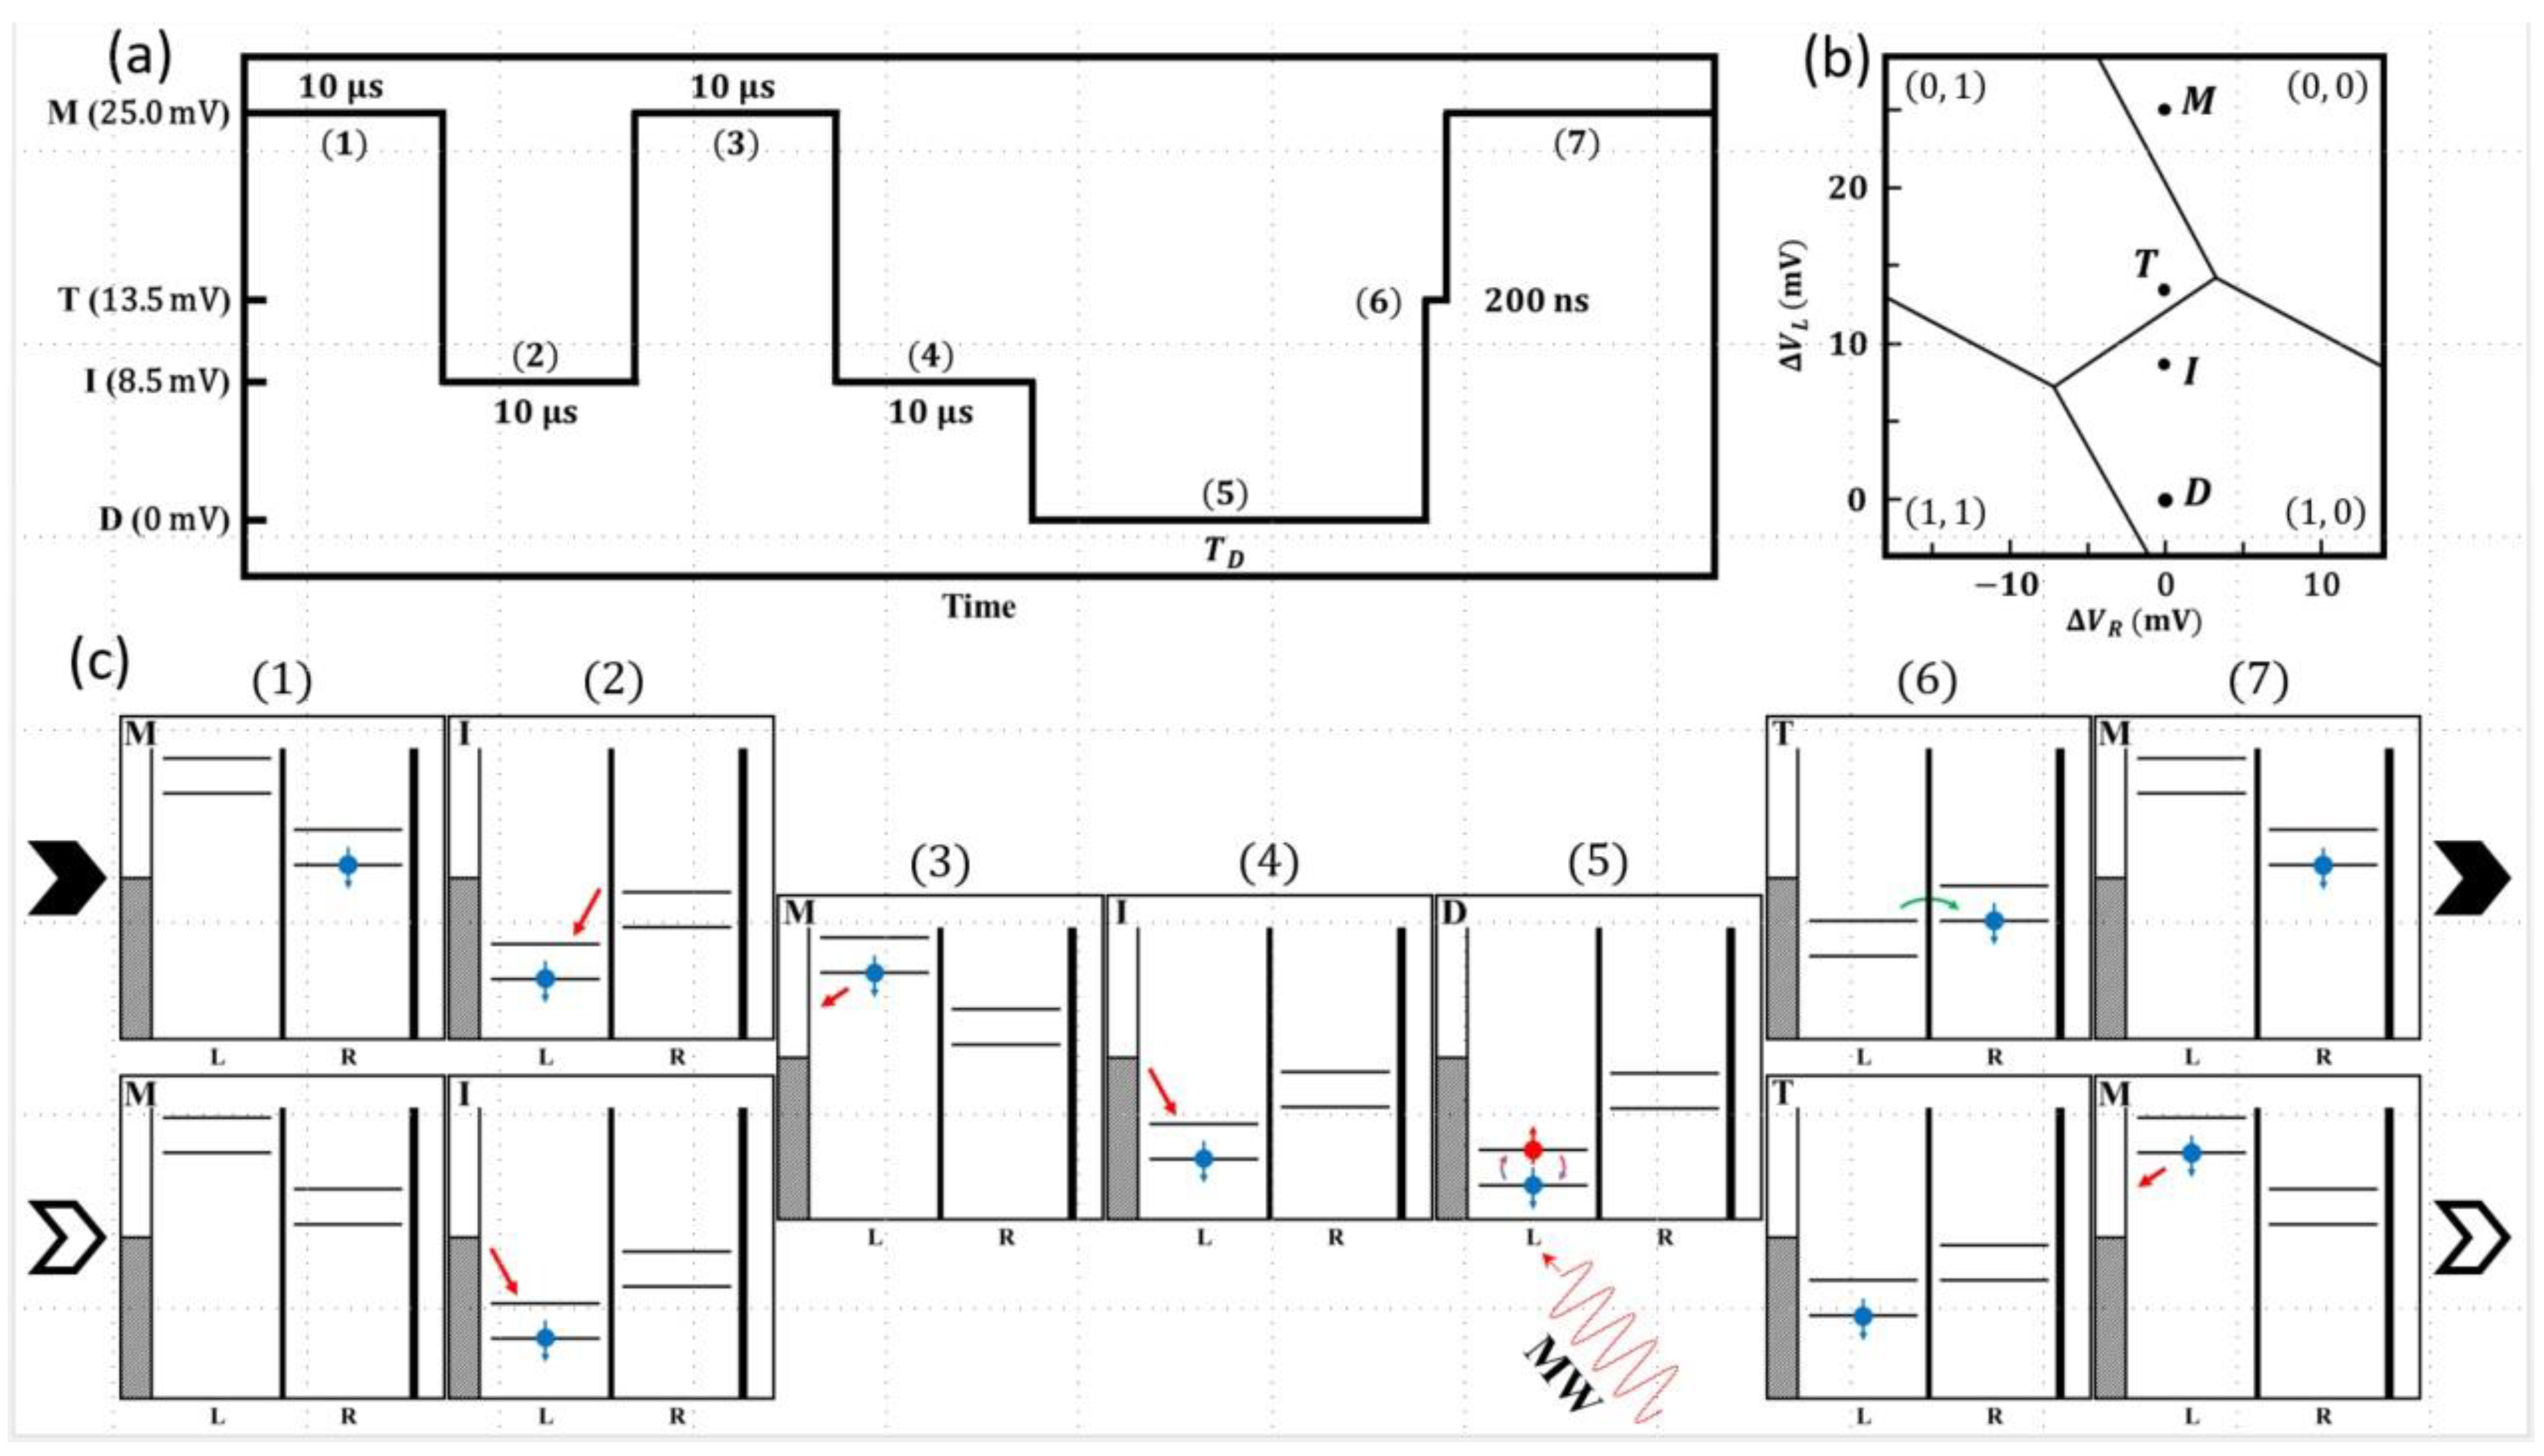
Figure 3.
(a) Averaged spin-up probability to map out the Rabi oscillations as a function of the MW burst duration (Y-axis) and the MW frequency (X-axis); (b) the 2D map of the Rabi oscillations measured as the averaged spin-up probability in the plane of the MW Pulse Duration and MW Amplitude; (c) Rabi frequency as a function of MW pulse amplitude; (d) Period of Rabi oscillations as a function of Rabi frequency tuned by the MW burst amplitude; (e) An example of Rabi oscillations as a function of the MW burst duration; (f) Period of Rabi oscillations as a function of magnetic field stepped around the resonance frequency. Top scale shows effective frequency detuning. (For more details see text.)
Disclaimer/Publisher’s Note: The statements, opinions and data contained in all publications are solely those of the individual author(s) and contributor(s) and not of MDPI and/or the editor(s). MDPI and/or the editor(s) disclaim responsibility for any injury to people or property resulting from any ideas, methods, instructions or products referred to in the content. |
© 2023 by the authors. Licensee MDPI, Basel, Switzerland. This article is an open access article distributed under the terms and conditions of the Creative Commons Attribution (CC BY) license (http://creativecommons.org/licenses/by/4.0/).
Copyright: This open access article is published under a Creative Commons CC BY 4.0 license, which permit the free download, distribution, and reuse, provided that the author and preprint are cited in any reuse.


