Submitted:
29 January 2023
Posted:
30 January 2023
You are already at the latest version
Abstract
Up to now, many studies have been performed on particle radiations before or during earthquakes (EQs). In our previous study, with the help of piezoelectricity relationships and the elastic energy formula, the MCNPX simulation code was applied to find the amount of created atomic/ nuclear particles, the dominant interactions; and the energy of the particles for various sizes of quartz and granite blocks. In this study, using the MCNPX simulation code, we have estimated the flux of the particles (created from under-stressed granitic rocks) at different distances from the EQ hypocenter inside the fractures, filled with air, water, and CO2. It was found that inside a water-filled fracture, the particles do not show the flux far from the EQ hypocenter, but inside the gases like air and CO2 with the normal condition density, different types of particles can have a flux far from the source (more than a kilometer) and they might reach themselves to the surface in the case that the EQ hypocenter is very shallow (0- 5 km). However, for deep EQs, it seems that the most detected nuclear particles on the surface should pass via the vacuum-filled fractures and reach themselves to the surface. Moreover, it was concluded that the more density of the fracture’s filling fluid, the less distance that the particles can have a flux.
Keywords:
Monte Carlo method
; Granite Rocks
; Piezoelectricity
; Earthquake
; Particles radiation
1. Introduction
Up to now, many studies have been performed on the particle radiations before or during the earthquakes (EQs). Fu et al. found anomalous variations in the gamma-ray counting rate a few days before some local EQs in eastern Taiwan [1]. Maksudov et al. proposed a new method for EQ forecasting, based on simultaneous recording of the intensity of fluxes of low-energy neutrons and charged particles by detectors [2].
Volodichev et al. measured neutron emissions in seismic areas of the Pamir region exceeded the usual neutron background “up to two orders of magnitude in correspondence to seismic activity and rather major EQs, greater than or equal to the 4th degree in the Richter scale magnitude” [3]. Moreover, Sigaeva et al. observed neutron emission before the Sumatra EQ at Dec. 2004 [4]. Guo et al. analyzed the characteristic response of gamma radiation monitoring to seismic activity with the data provided by China EQ Data Center. The gamma radiation monitoring in Changsha indicate that near-field EQ swarm or violent EQ affects the gamma radiation in aseismic region [5].
Carpinteri et al. performed some experimental tests on brittle rock specimens specially the piezoelectric rocks like granite to check the neutron emission under different kinds of compression tests and monotonic, cyclic, and ultrasonic mechanical loading [6,7,8,9,10]. Manuelo et al. also performed neutron emission measurements on granite specimens from Sardinia during mechanical compression tests [11]. Besides, Freund et al. applied stress on some kinds of igneous rocks, limestone, marble, and others. These tests prove that electric charge carriers are activated in the metamorphic/ igneous rocks when they become under stress, turning them into semiconductors [12,13,14].
Bahari et al., with the help of piezoelectricity relationships and the elastic energy formula, applied the MCNPX simulation code to find the amount of created atomic/ nuclear particles, the dominant interactions and the possible particle energies for various sizes of quartz and granite blocks. They have proved that for the large granite blocks, “photonuclear” interactions from the “Bremsstrahlung gamma ray” photons due to the run-away electron avalanche, is the main mechanism for nuclear particles creation when the stress is exerted on a large block. In addition, they have presented some formulas to estimate the quantity and energy of various created particles on a fracture surface, when the piezoelectric block is under different uniaxial stress [15].
The cracks/ fractures are generated inside the rock blocks before the EQ happens because of the mechanical stresses, applied on them. Fractures might be filled with fluids like air, oil, gas, water, CO2, etc. and in this situation, the type and state of the fluid (liquid or gas) can make a large difference in the response of the seismic waves [16]. Cracks and boreholes penetrating a fractured rock mass have been shown to efficiently circulate air on both daily and seasonal time scales, depending on the temperature contrast between the in-situ rock and atmosphere [17,18]. Moore et al. analyzed the impact of air and water circulation in deep open fractures on the subsurface thermal field. they have supposed that the origin of convective fracture flow might be the fact that during the winter, air at depth is warmer and lighter than atmospheric air and the resulting density contrast or pressure difference of the columns drives localized convection cells [19].
In this study, using the MCNPX simulation code, we want to answer to the question how the particles, created from under-stressed piezoelectric granitic blocks propagate inside the fractures, filled with fluids like air, water, and CO2 and can reach themselves to the surface. This would be beneficial to understand the particles’ propagation mechanism and to find the flux of the particles in different distances from the EQ hypocenter.
2. Materials and Methods:
2.1. Introduction to MCNPX 2.6.0 Simulation Code
MCNPX (Monte Carlo N-Particle extended) is a general-purpose Monte Carlo radiation transport code with three-dimensional geometry and continuous-energy transport of 34 particles and light ions. Since its inception, MCNPX has focused on the needs of the intermediate energy community, here taken to mean incident energies up to a few GeV. The evaluated data libraries needed to run the code, and several subsidiary libraries needed for the physics models in MCNPX. Tracking is done to a user-settable lower kinetic energy cutoff, and particles will decay with their standard half-lives. For neutrons, all reactions given in a particular cross-section evaluation (such as ENDF/B-VI) are accounted for. Thermal neutrons are described by both the free gas and S (alpha, beta) models. For photons, the code accounts for incoherent and coherent scattering, the possibility of fluorescent emission after photoelectric absorption, absorption in pair production with local emission of annihilation radiation, and bremsstrahlung. A continuous-slowing-down model is used for electron transport that includes positrons, X-rays, and bremsstrahlung but does not include external or self-induced fields [20]. MCNPX contains numerous flexible tallies: surface current & flux, volume flux (track length), point or ring detectors, particle heating, fission heating, pulse height tally for energy or charge deposition, mesh tallies, and radiography tallies [21].
When a particle starts out from a source, a particle track is created. If that track is split two for one at a splitting surface or collision, a second track is created and there are now two tracks from the original source particle, each with half the single track weight. Within a given cell of fixed composition, the method of sampling a collision along the track is determined using the following theory: The probability of a first collision for a particle between l and l + dl along its line of flight is given by [20]:
where is the macroscopic total cross section of the medium and is interpreted as the probability per unit length of a collision. Setting ξ the random number on [0,1), to be:
it follows that
In addition, the cosine of the angle between incident and exiting particle directions is sampled from angular distribution tables in the collision nuclide’s cross-section library [20].
2.2. Assumptions of the Problem for Simulation with MCNPX
As already we have studied (reference [15]), for a typical granite rock with the chemical compound as shown in the Table 1, the piezoelectric coefficient (d) equals to 7×10-13 C/N (at room temperature), Relative permittivity (ϵr) equals to 5 and uniaxial compressive strength of 140 MPa, when the compressive stress is applied on various sizes of rock block, the atomic/ nuclear particles are released from the rock tissue.
To find how much the propagated atomic/ nuclear particles, produced from piezoelectric granite rocks deep inside the Earth can reach themselves to the surface, we first supposed that the particles have been produced from a hypocenter with a focal depth of 2 km. Such an EQ would be categorized among the shallow EQs, (the EQs with a focal depth from 0 to 70 km) [22].
Then, we assumed that a fracture has been produced as a result of different kind of EQ’s stresses (tensional, compressive or shear stress) on the rock block. Hence, the cell card of the code was defined for this fracture as a rectangular shape with depth (d), length (l) and width (w) equals to 2000 m, 1000 m, and 10 cm, respectively. The width (w) of the fracture is an affecting parameter on the number of created particles and flux. Hence, we have selected a normal width of 10 cm for a typical fracture. Nevertheless, it can be argued that as the width of the fracture increases, the source and created new particles have fewer interactions with the surrounding rocks and hence, the flux of the various particles in the upper sections of the fracture will be higher.
In the material card, we supposed that the fracture has been filled with air, water, and CO2. It must be noted that if the fracture is not filled with any kind of material (vacuum occupies the hole volume of the fracture), all particles with the initial energy they have achieved, can reach themselves to the surface with no capturing and energy loss.
Another input parameter of the code is the density of the material. Normally the fluids beneath the surface are under pressure as a result of their hydrostatic column and also due to the upper formations’ weight. However, in the model, proposed by Moore et al., the invaded air into the fractures possesses the lighter density than the atmospheric air density because of the higher heat at depth [19]. Hence, for those near surface fractures that make pathways to the surface in which the air is not under upper layers’ pressure, although the hydrostatic column results in higher air density at depth, the high temperature at depth has a converse effect and it compensates the rise in the air density. Therefore, we have assumed that the fractures’ filling air is not under pressure and we have chosen the air density equals to 1.2041 kg/m3 at 20 0C and atmospheric pressure.
For the water, since it is almost an uncompressible fluid, its density at depth does not change considerably in relation to the surface and we thus, we have set its density equals to 1000 kg/m3.
For the CO2, for those near surface fractures that make pathways to the surface, the condition is the same as for the air and we have chosen its density equals to 1.870 kg/m3 in the normal temperature and atmospheric condition. However, at EQ hypocenters, CO2 pressure can reach 10– 20 MPa. At depth about 20 km, the temperature could rise to about 600 0C [23]. In this condition, the CO2 is in a supercritical phase and the density of this gas at 577 0C and 10 MPa pressure equals to 61.31 kg/m3 [24].
As investigated in our previous research, the initial energy of the run-away electrons inside the granite rock tissues can be calculated, applying the piezoelectric and elastic energy relationships. The average energy of the created particles can be estimated, using the MCNPX simulation. Table 2 reveals the computed initial energy of the runaway electrons and the estimated average energy of the created particles inside the granite rock tissue, achieved from the simulation outputs in NPS electron= 1000 for two EQ Richter magnitudes (ML) [15].
As can be seen in this table, neutron (n), proton (h), electron (e) and photon (γ) particles are created from the photonuclear and/ or other atomic/nuclear interactions of the runaway electron avalanche in piezoelectric rocks being under a huge amount of stress. Besides, although the initial energy of the runaway electrons is too high for these two EQ magnitudes, the average energy of the created electrons is relatively low. That is due to various interactions of runaway electron avalanches inside the rock tissue, specially the “knock on electrons” interactions, resulting in different particles radiation and lowering the average energy of the total created electrons. Thus, in the source card, we considered the neutrons, protons, and gammas as the source particles, separately and we neglect the electrons because of their low energy.
The physics cards for each of the source particles include some input parameters, set according to the conditions and requirements of the problem. For instance, the parameter emax in neutron, proton and electron physics and the parameter emcpf in photon physics indicate the upper limit of the particle’s energy.
3. Results and Discussion
3.1. Simulation when the Fracture Is Filled with Air
As already discussed, a deep fracture in the Earth’s crust can be filled with air. In this case, for each of the source particles: neutron, proton, and photon, we wrote the simulation code for two EQ magnitudes. It must be noted that for simplicity, we have defined the chemical composition of the air as 80% nitrogen plus 20% oxygen in our written code and the other chemical compounds of the air, containing very little percentage were eliminated. Table 3 represents the input parameters for simulation of the neutron propagation inside an air-filled fracture when an EQ with ML= 7.67 is occurred inside a granite block. The average energy for each source particle was achieved from the Table 2. In addition, The No. of particles (NPS) in the written code was supposed to be 100’000, since, that is enough to achieve the appropriate results. The simulation running time (CTME) was about 106 min.
When 24.6 MeV neutrons, already created as a result of the piezoelectric effect, are propagated into an air-filled fracture and have interactions with atoms of the air and the surrounded granite rock, various atomic/nuclear interactions would be anticipated and some new particles will be generated. Some of the particles, by their elastic or inelastic interactions with surrounded granite atoms/ nucleus, will be recoiled into the air.
To achieve a model of the created particles flux, the fracture cell was divided into 125’000 meshes with the rectangular mesh tally card (RMESH) of the MCNPX. The type I of this mesh tally was employed. Since the output of this card is a binary file, we used the gridconv program to convert it to a data file (*.dat). Then, we applied the Tecplot software to plot the 2D view of the constructed mesh tally and the amount of particle flux in unit of No. /cm2 per each source particle (to find the real flux amount, the flux, shown in the mesh tally must be multiplied to the NPS number). Figure 1a,b indicates the 2D views of neutron, electron, photon and proton fluxes per each source particle in an air-filled fracture when the source particle is neutron with En = 24.6 and 10.4 MeV (for EQs with ML = 7.67 and 5.79, respectively).
As is evident in this figure, for En = 24.6 MeV, we would expect the flux of neutron, almost equals to 5E-5 n/cm2 about 1 km above the source position and after that, almost all created neutrons inside the air are lost (captured or their energy decreased below the cut off energy). However, for En= 10.4 MeV, the same flux at about 950 m above the source position would be expected. For En = 24.6 and 10.4 MeV, we would also expect the electron flux up to about 780 and 950 m, photon flux up to about 900 and 950 m and proton flux up to about 800 and 0 m, respectively.
In addition, Table 4 illustrates the simulation results for some of the created particles’ characteristics, including number”, “average energy”, “mean free path (mfp)” and “average time of capture or escape” in an air-filled fracture when the source particle is neutron, photon and proton with NPS=100’000 and the energies equivalent to ML= 7.67 and 5.79, respectively. As could be found in this table, when the source particle is neutron with En = 24.6 MeV (equivalent to ML= 7.67), the mfp of created new neutrons and photons in the air are 133 and 158 m, respectively. In comparison, when the source neutron possesses the energy equals to 10.4 MeV (equivalent to ML= 5.79), the mfp of created neutrons and photons in the air are 141 and 181 m, respectively, representing the higher value, because of lower interactions of these particles with the air’s atoms/ nucleuses. The mfp for created electrons and protons are much lower (in cm dimension) due to their Coulomb interactions with the other atoms/ nucleuses. Besides, when the source neutron contains the energy equals to 24.6 MeV, the average time of capture or escape for created neutrons and photons are 2.68E-04 and 1.87E-04, respectively and for electrons and protons this could not be calculated by the MCNPX due to their very prompt capture or escape in/ from the environment.
Besides, Figure 2a,b indicates 2D views of neutron, electron, photon and proton fluxes per each source particle in an air-filled fracture when the source particle is photon with Eγ = 3.05 and 1.81 MeV (for EQs with ML = 7.67 and 5.79, respectively). As can be understood from this figure, for Eγ = 3.05 MeV, we would expect the flux of photon, almost equals to 1E-8 γ/cm2 about 1.6 km above the source position (EQ hypocenter) and after that, almost all created photons inside the air are lost. However, for Eγ = 1.81 MeV, the same flux at about 1.2 km above the source position would be expected. We would also expect the flux of electrons up to about 1.7 and 1.4 km for Eγ = 3.05 and 1.81 MeV, respectively. The neutron and proton fluxes are almost zero along the whole fracture length, because, the source photons’ energy is not high enough to initiate the photonuclear interactions.
Figure 3 and Figure 4 illustrate the photonuclear total cross section versus the photon energy in 14N and 16O (the main constituent parts of the air), plotted from ENDF library of nuclear data services web page [25]. As can be seen in these figures, the photonuclear interaction in 14N and 16O initiates at 7.55 MeV and 12.5 MeV, respectively. These energies are higher than 3.05 and 1.81 MeV (the average photon’s energy, released from the EQs with ML= 7.67 and 5.79 in granite block, respectively) and hence, no neutrons nor protons are released from photonuclear reactions of the air atoms’ nucleuses.
It must be taken into consideration that, since the photon has a Wave–particle duality, whenever it possesses low energy, its frequency is low enough to allow the electromagnetic wave to pass through kilometers of solids. Therefore, the ultra-low frequency (ULF) photon waves can reach themselves to the surface via the empty or gas-filled fractures or even the solid rocks. Nonetheless, these waves can not be simulated by MCNPX, because this code only simulates the particle’s nature of photon in straight lines. The simulation of ULF waves propagation inside the Earth’ crust and its fractures can be performed via the appropriate models/ simulators.
Moreover, Figure 5a,b reveals 2D views of neutron, electron, photon and proton fluxes per each source particle in an air-filled fracture when the source particle is proton with Eh = 20 and 9.38 MeV (for EQs with ML = 7.67 and 5.79, respectively). As could be seen in this figure, for both Eh = 20 and 9.38 MeV, the protons have a flux of 5E-12 h/cm2 up to about 50 m above the hypocenter (source position) and then, they are all lost. Besides, very little flux of photons and electrons up to about 50 m from the hypocenter and almost no neutron flux can be anticipated.
The reason of very little particles creation and flux when the source particles are protons could be the fact that, the protons have normally short mean free path (mfp) in relation to the neutrons because of their electric charge (Coulomb interactions). Once they are created, they will have atomic or nuclear interactions (elastic, inelastic, fusion, etc), promptly. They might also create stable hydrogen atoms by attracting electrons.
3.2. Simulation when the Fracture Is Filled with Water
We also wrote the same simulation code when the fracture is filled with water (the water chemical composition and density were given to the code). Table 5 represents the input parameters for simulation of the neutron propagation inside a water-filled fracture when an EQ with ML= 7.67 is happened inside a granite block. The simulation running time (CTME) was about 63 min.
Figure 6a–c represents 2D views of different particle fluxes per each source particle in a water-filled fracture when the source particle is (a) neutron with En= 24.6 MeV, (b) photon with Eγ= 3.05 MeV; and (c) proton with Eh= 20 MeV (all for EQ of the ML = 7.67). As is evident in this figure, in all situations, the flux of particles can be seen up to about 50 m above the source position and then, almost all created particles inside the water are lost (captured or their energy is reduced below the cut off energy).
The water density, being much higher than the air density is the most affecting parameter, resulting in particles’ capturing or lowering their energy below the cut off energy. Therefore, it can be argued that if the fractures around the EQ’s hypocenter are filled with water, the radiated particles from the piezoelectric mechanism could not be transmitted to a long distance or to the surface of the Earth even if the EQ magnitude is high.
3.3. Simulation when the Fracture Is Filled with CO2
We also wrote the simulation code when the fracture is filled with CO2 with the same parameters. However, for its density, as previously explained in the section 2.2, we have chosen its density equals to 1.870 kg/m3 in the normal pressure/ temperature condition. However, since at depths below than 20 km, CO2 pressure and temperature are much higher, for comparison, we have also applied the density equals 61.31 kg/m3 for the pressure at 10 MPa and temperature at 577 0C.
Figure 7a,b represents 2D views of neutron, electron, photon and proton fluxes per each source particle in a CO2-filled fracture when the source particle is photon with Eγ = 3.05 MeV (for EQ with ML = 7.67) and the density of CO2 is 1.870 and 61.31 kg/m3, respectively.
As understood from this figure, when the CO2 density is 1.870 kg/m3, we can expect the flux of photon and electron far from the source position (more than a kilometer). In comparison, when the CO2 density is 61.31 kg/m3, the flux of particles, about 50 m above the source position reduces rapidly and thereafter, almost all created particles inside the CO2 are lost (captured or their energy is reduced below the cut off energy).
4. Conclusions:
- 1-
- If we consider a rectangular-shaped fracture from the EQ hypocenter to the surface, in the case that the fracture contains vacuum (no fluid fills it), those created particles from under-stressed granitic rocks, entering into the fracture and moving alongside and parallel to the fracture walls, can pass long distances from the EQ hypocenter and reach themselves to the surface with their initial energy.
- 2-
- Using the MCNPX simulation code, we have estimated the flux of the particles inside the fractures, filled with air, water, and CO2 in different distances from the EQ hypocenter. Those particles are created from under-stressed granite rocks and also from the interactions between them and the filling fluid’s atoms/ nucleuses. It was found that inside a water-filled fracture, the particles do not show the flux far from the EQ hypocenter even if the EQ magnitude is high (more than 7 in Richter’s magnitude), but inside the fractures, filled with gases like air and CO2 with density in a normal condition, various types of particles can have a flux far from the source (more than a kilometer) and they might reach themselves to the surface when the EQ hypocenter is very shallow (0- 5 km). However, for deep EQs, it seems that the most detected atomic/ nuclear particles on the surface have been transmitted to the surface via the vacuum-filled fractures.
- 3-
- By running the simulation code on a CO2-filled fracture, it was concluded that the more density of the fracture’s filling fluid, the less distance that the particles can have a flux.
- 4-
- The fracture’s geometry and size, specially the width of the fracture, the moving direction of the source particles, the type and density of the filling fluid, are amongst the important factors, affecting on how much the particles can reach themselves to the surface.
- 5-
- Due to the photon’s wave- particle duality, low energy photons like ULF waves can pass long distances of solids/ fluids and be detected on the surface. However, the wave properties of photon can not be simulated with MCNPX and it must be simulated with other simulators.
- 6-
- We have considered the “average energy” of the particles for each EQ magnitude. However, some of the interactions in which the particles are created have higher energies than the average and therefore, created particles from those interactions can pass longer distances inside a fluid-filled fracture.
Funding
There is no funding for this research.
Data Availability Statement
The data that support the findings of this study are available from the corresponding author upon reasonable request.
Conflicts of Interest
There are no conflicts of interest for this research.
5. References
- Fu, C.C. et al., “Temporal variation of gamma rays as a possible precursor of EQ in the Longitudinal Valley of eastern Taiwan”, Journal of Asian Earth Sciences 2015, 114, 362. [CrossRef]
- Maksudov, A.U., Zufarov, M.A., “Measurement of neutron and charged particle fluxes toward EQ prediction”, EQ Sci. 2017, 30, 283. [CrossRef]
- Volodichev, N.N.; et al. “Sun-Moon-Earth connections: the neutron intensity splashes and seismic activity”. Astron. Vestnik. 2000, 34, 188. [Google Scholar]
- Sigaeva, E.; et al. , “Thermal neutrons’ observations before the Sumatra EQ”, Geophys. Res. Abstr. 2006, 8, 00435. [Google Scholar]
- Guo, X., Yan, J., Wang, Q., “Monitoring of gamma radiation in aseismic region and its response to seismic events”, Journal of Environmental Radioactivity 2020, 213, 106119. [CrossRef]
- Carpinteri, A., Cardone, F., Lacidogna, G. “Piezonuclear neutrons from brittle fracture: early results of mechanical compression tests”, Strain 2009, 45:332. [CrossRef]
- Cardone, F., Carpinteri, A., Lacidogna, G., “Piezonuclear neutrons from fracturing of inert solids”, Phys. Lett. A 2009, 373:4158. [CrossRef]
- Carpinteri, A., Cardone, F., Lacidogna, G., “Energy emissions from failure phenomena: mechanical, electromagnetic, nuclear”, Exp. Mech. 2010, 50:1235. [CrossRef]
- Carpinteri, A.; et al. Neutron emissions in brittle rocks during compression tests: monotonic vs cyclic loading. Phys. Mesomech. 2010, 13, 268–274. [Google Scholar] [CrossRef]
- Carpinteri, A. et al., “Energy emissions from brittle fracture: neutron measurements and geological evidences of piezonuclear reactions”, Strength, Fract. Complexity 2011, 7, 13-31. [CrossRef]
- Manuello, A., Grosso, B., Ricciu, R., “Anisotropic and impulsive neutron emissions from brittle rocks under mechanical load”, Meccanica 2014, 50 (5). [CrossRef]
- Freund, F. et al., “Highly mobile hole charge carriers in minerals: Key to the enigmatic electrical EQ phenomena?”, in Electromagnetic Phenomena Related to EQ Prediction, F. Fujimori and M. Hayakawa eds., Terra Sci. Publ. Co., Tokyo, 1994; pp. 271-292.
- Freund, F., Takeuchi, A., and Lau, B.W.S., “Electric current streaming out of stressed igneous rocks—A step towards understanding pre-EQ low frequency EM emissions”, Phys. Chem. Earth, Parts ABC 2006, 31, 389–396. [CrossRef]
- Freund, F., and Sornette, D., “Electro-magnetic EQ bursts and critical rupture of peroxy bond networks in rocks”, Tectonophysics 2007, 431, 33–47. [CrossRef]
- Bahari et al., “Simulation with Monte Carlo Methods to Find Relationships between Accumulated Mechanical Energy and Atomic/Nuclear Radiation in Piezoelectric Rocks with Focus on Earthquakes”, Radiation effects and defects in solids 2022, 177, 743-767. [CrossRef]
- Berryman, J. Seismic waves in rocks with fluids and fractures. Geophys. J. Int. 2007, 171, 954–974. [Google Scholar] [CrossRef]
- Weeks, E.P. , “Effect of topography on gas flow in unsaturated fractured rock: concepts and observations, in flow and transport through unsaturated fractured rock”. Geophys. Monogr. Ser. 2001, 42, 53–59. [Google Scholar]
- Weisbrod et al., “Falling through the cracks: The role of fractures in Earth-atmosphere gas exchange”, Geophys. Res. Lett. 2009, 36, L02401. [CrossRef]
- Moore, J.R., “Air circulation in deep fractures and the temperature field of an alpine rock slope”, Earth Surface Processes and Landforms 2011, 36, 1985-1996. [CrossRef]
- Laurie, S.W. et al., “The MCNPX Monte Carlo radiation transport code”, AIP Conf. Proc. 2007, 896, 81. [CrossRef]
- Los Alamos National Laboratory, “Monte Carlo Methods, codes, & applications group”, https://mcnp.lanl.gov/.
- William, S. et al., “Measuring the size of an earthquake”, Earthquakes and Volcanoes 1989, 21, 58-63.
- Miller, S.A. et al., “Aftershocks driven by a high-pressure CO2 source at depth”, Nature 2004, 427, 724-7. [CrossRef]
- Engineering ToolBox. “Carbon dioxide - Density and Specific Weight vs. Temperature and Pressure”. [online] Available at: https://www.engineeringtoolbox.com/carbon-dioxide-density-specific-weight-temperature-pressure-d_2018.html, (2018).
- International Atomic Energy Agency (IAEA), “Evaluated Nuclear Data File (ENDF)”: https://www-nds.iaea.org/exfor/endf.htm, database version of: (2022-04-22).
Figure 1.
2D views of neutron, electron, photon and proton fluxes per each source particle in an air-filled fracture when the source particle is neutron with (a) En = 24.6 MeV and (b) En = 10.4 MeV (for EQs with ML = 7.67 and 5.79, respectively).
Figure 1.
2D views of neutron, electron, photon and proton fluxes per each source particle in an air-filled fracture when the source particle is neutron with (a) En = 24.6 MeV and (b) En = 10.4 MeV (for EQs with ML = 7.67 and 5.79, respectively).

Figure 2.
2D views of neutron, electron, photon and proton fluxes per each source particle in an air-filled fracture when the source particle is photon with (a) Eγ = 3.05 MeV and (b) Eγ = 1.81 MeV (for EQs with ML = 7.67 and 5.79, respectively).
Figure 2.
2D views of neutron, electron, photon and proton fluxes per each source particle in an air-filled fracture when the source particle is photon with (a) Eγ = 3.05 MeV and (b) Eγ = 1.81 MeV (for EQs with ML = 7.67 and 5.79, respectively).
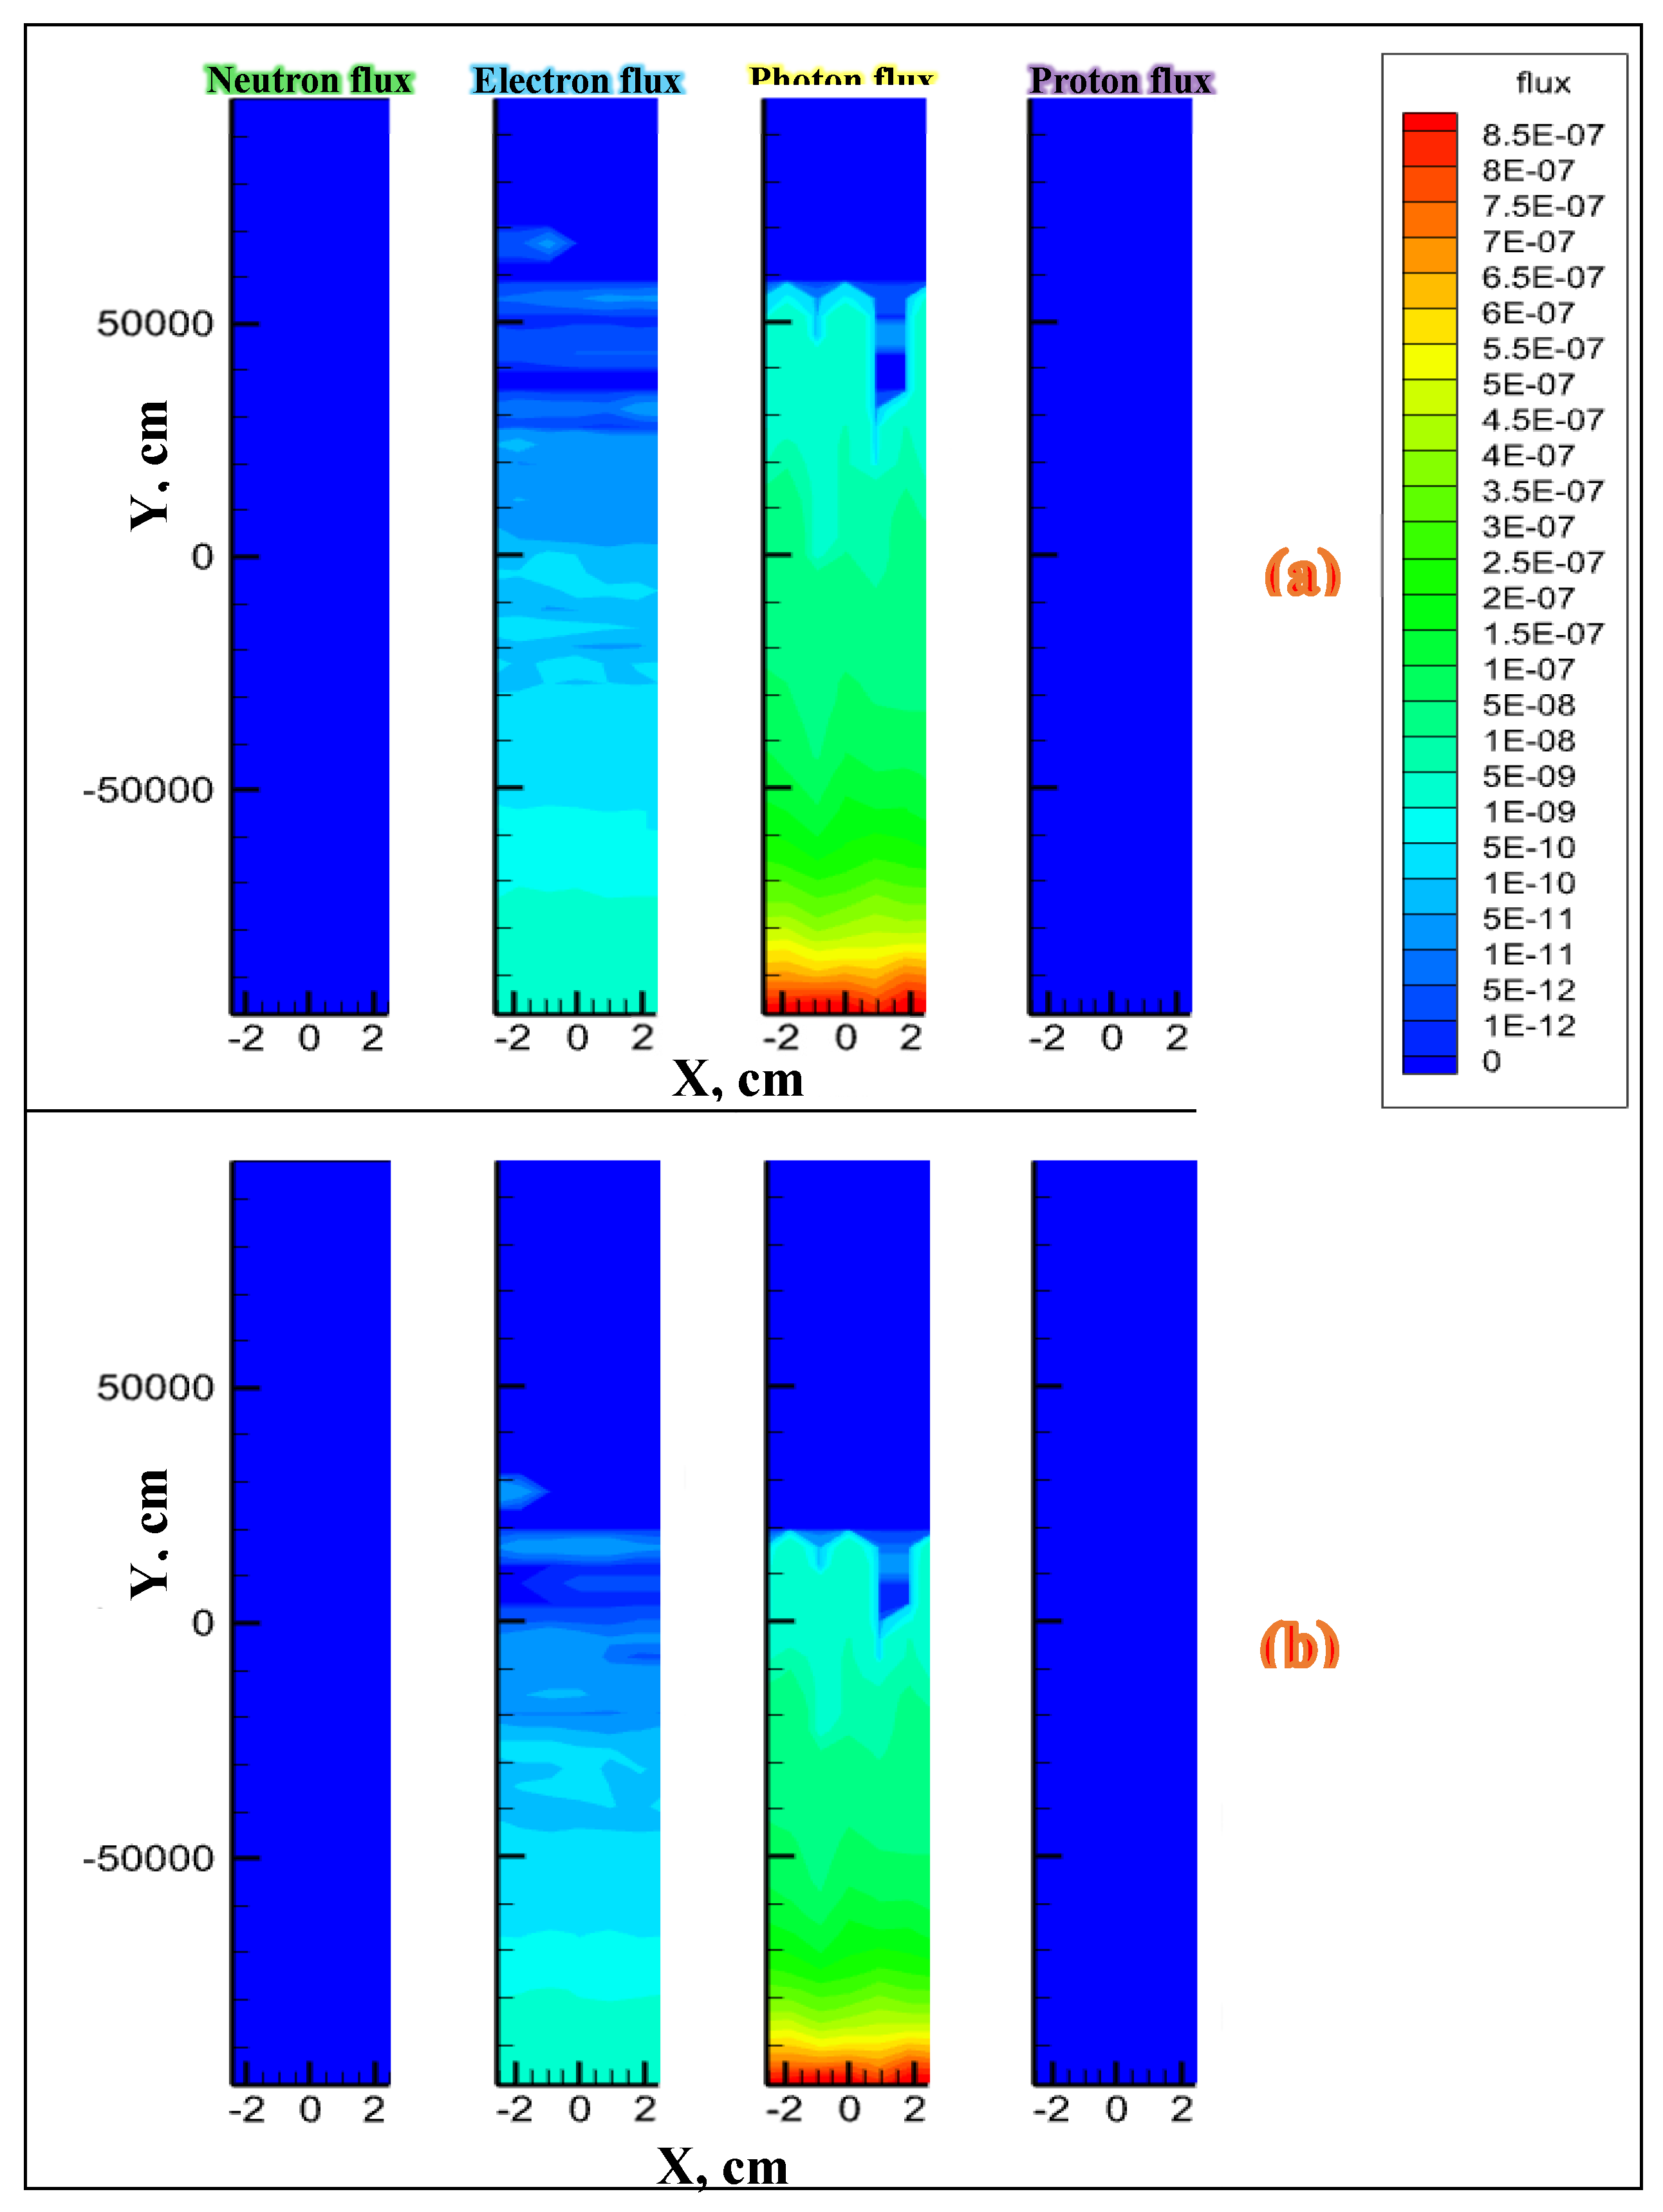
Figure 3.
The photonuclear total cross section versus the photon energy in 14N, plotted from ENDF library data.
Figure 3.
The photonuclear total cross section versus the photon energy in 14N, plotted from ENDF library data.
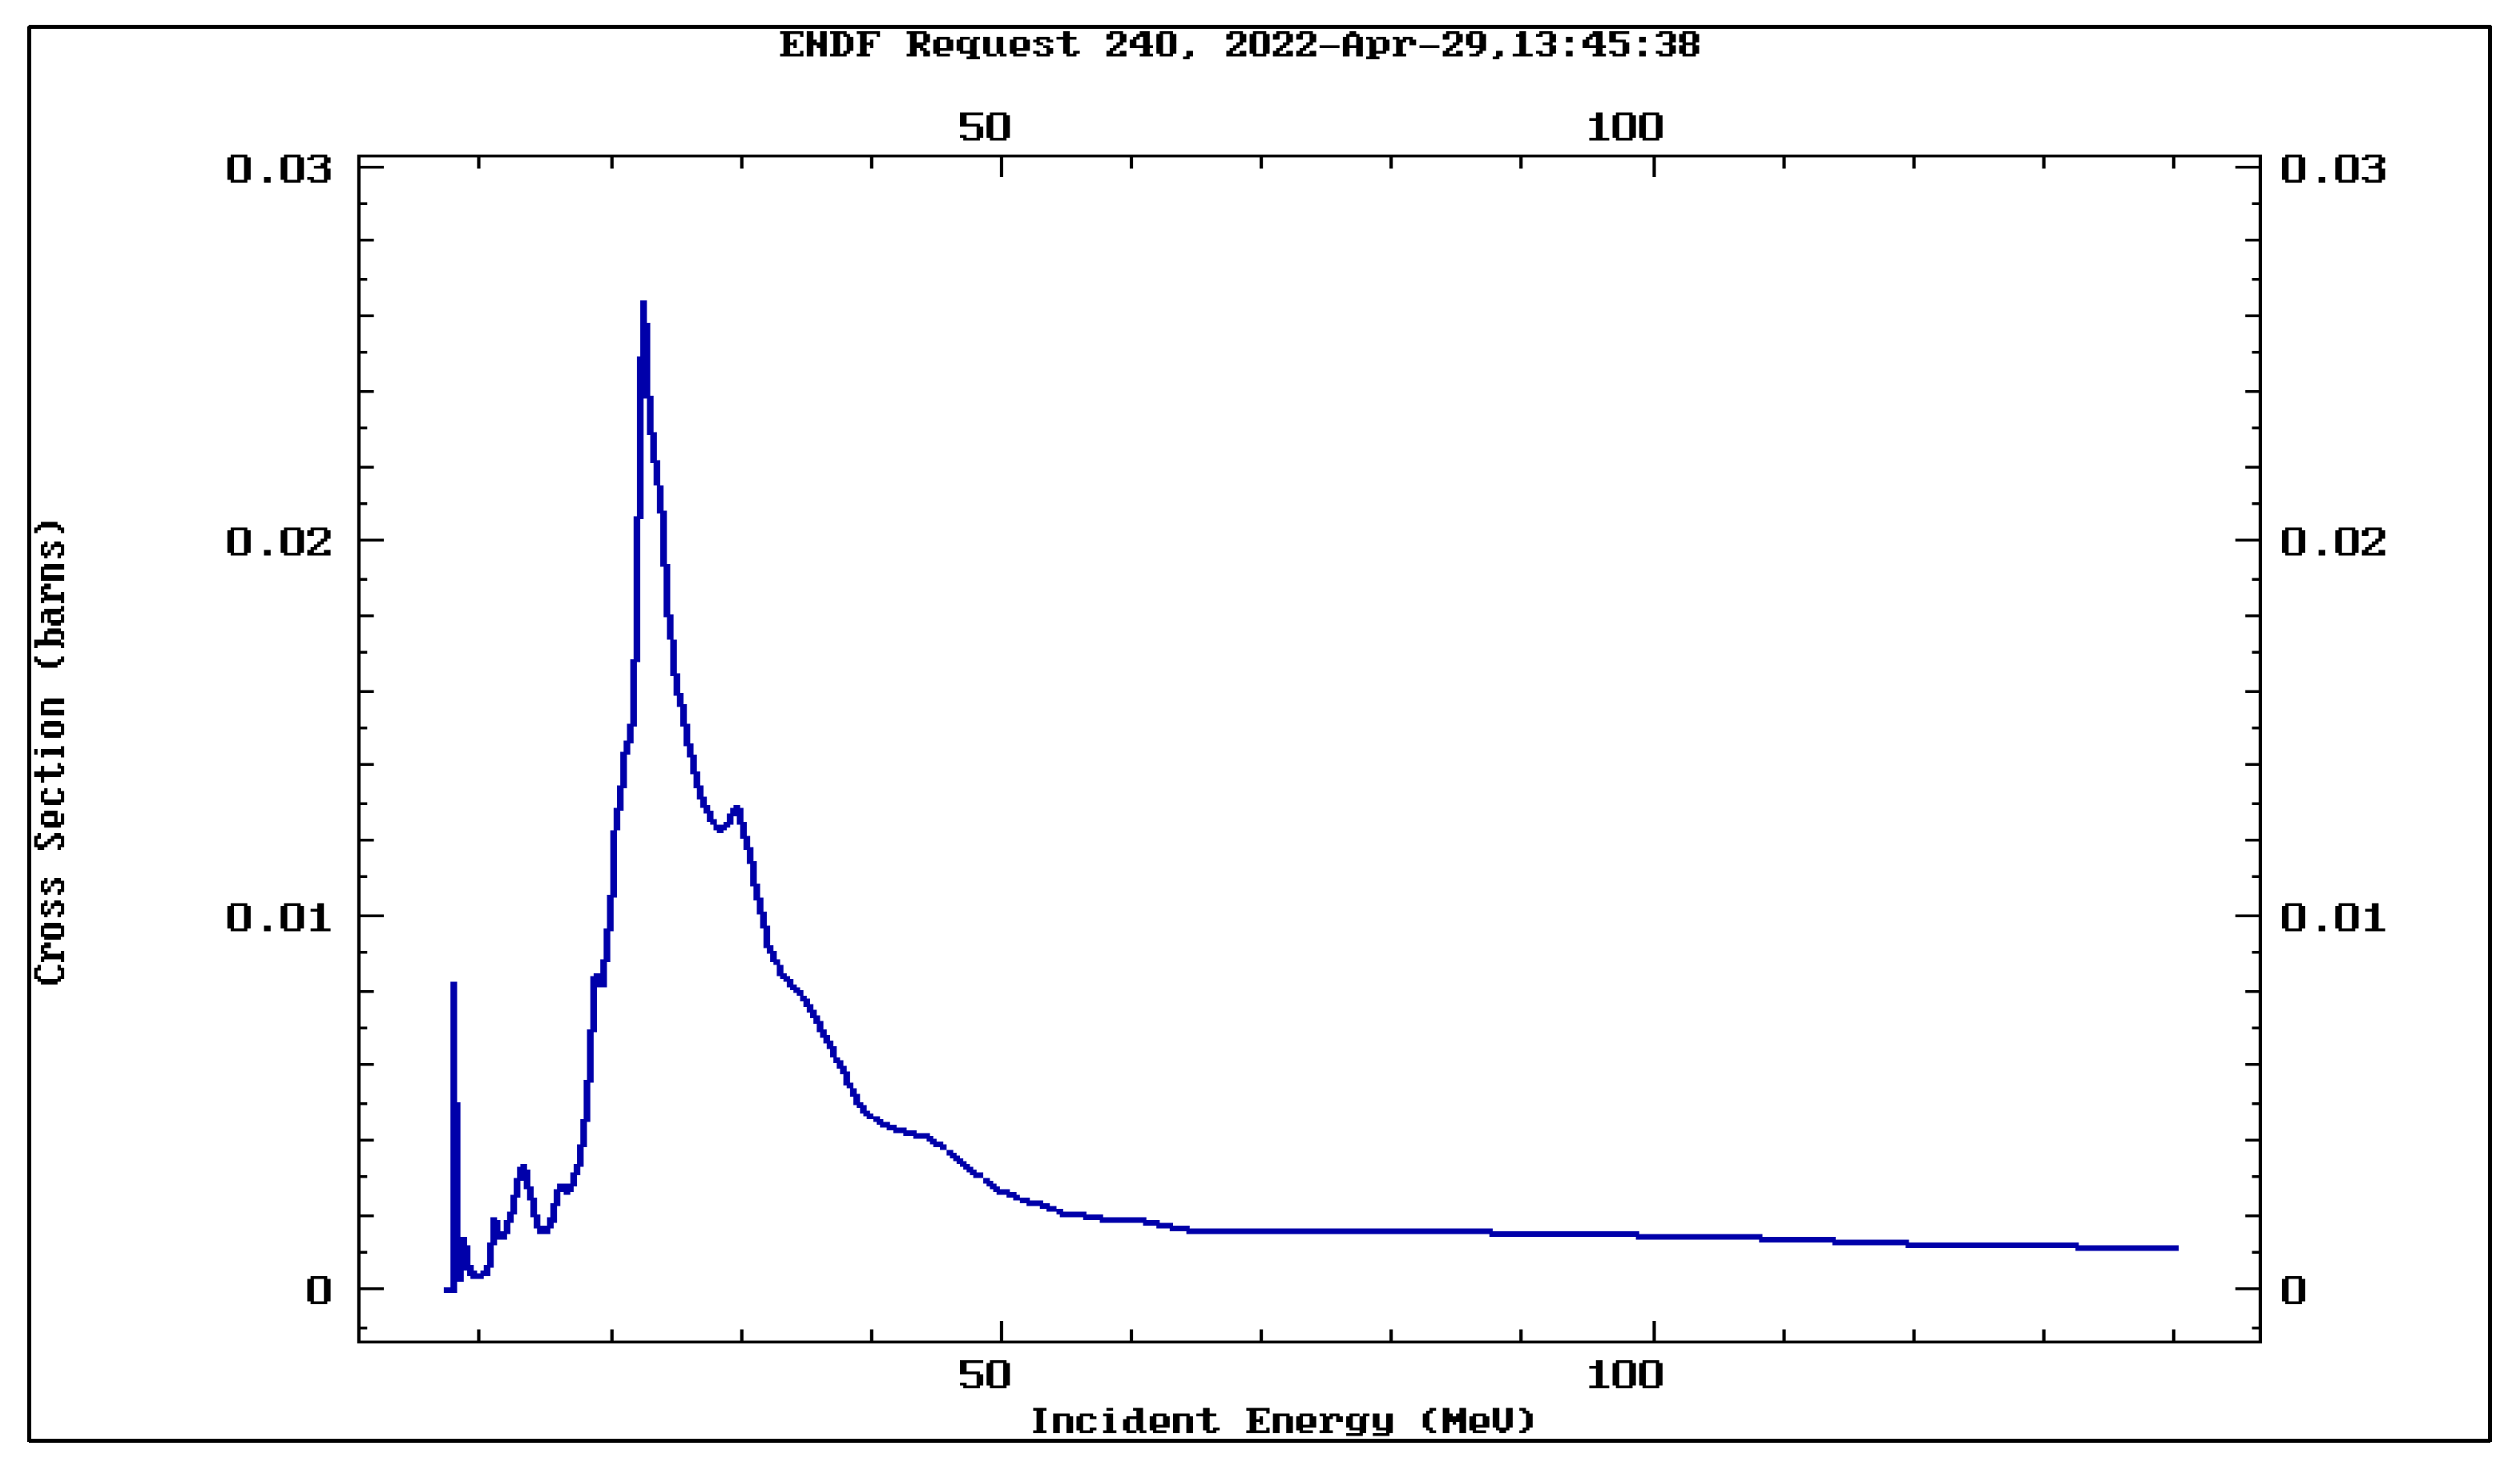
Figure 4.
The photonuclear total cross section versus the photon energy in 16O, plotted from ENDF library data.
Figure 4.
The photonuclear total cross section versus the photon energy in 16O, plotted from ENDF library data.
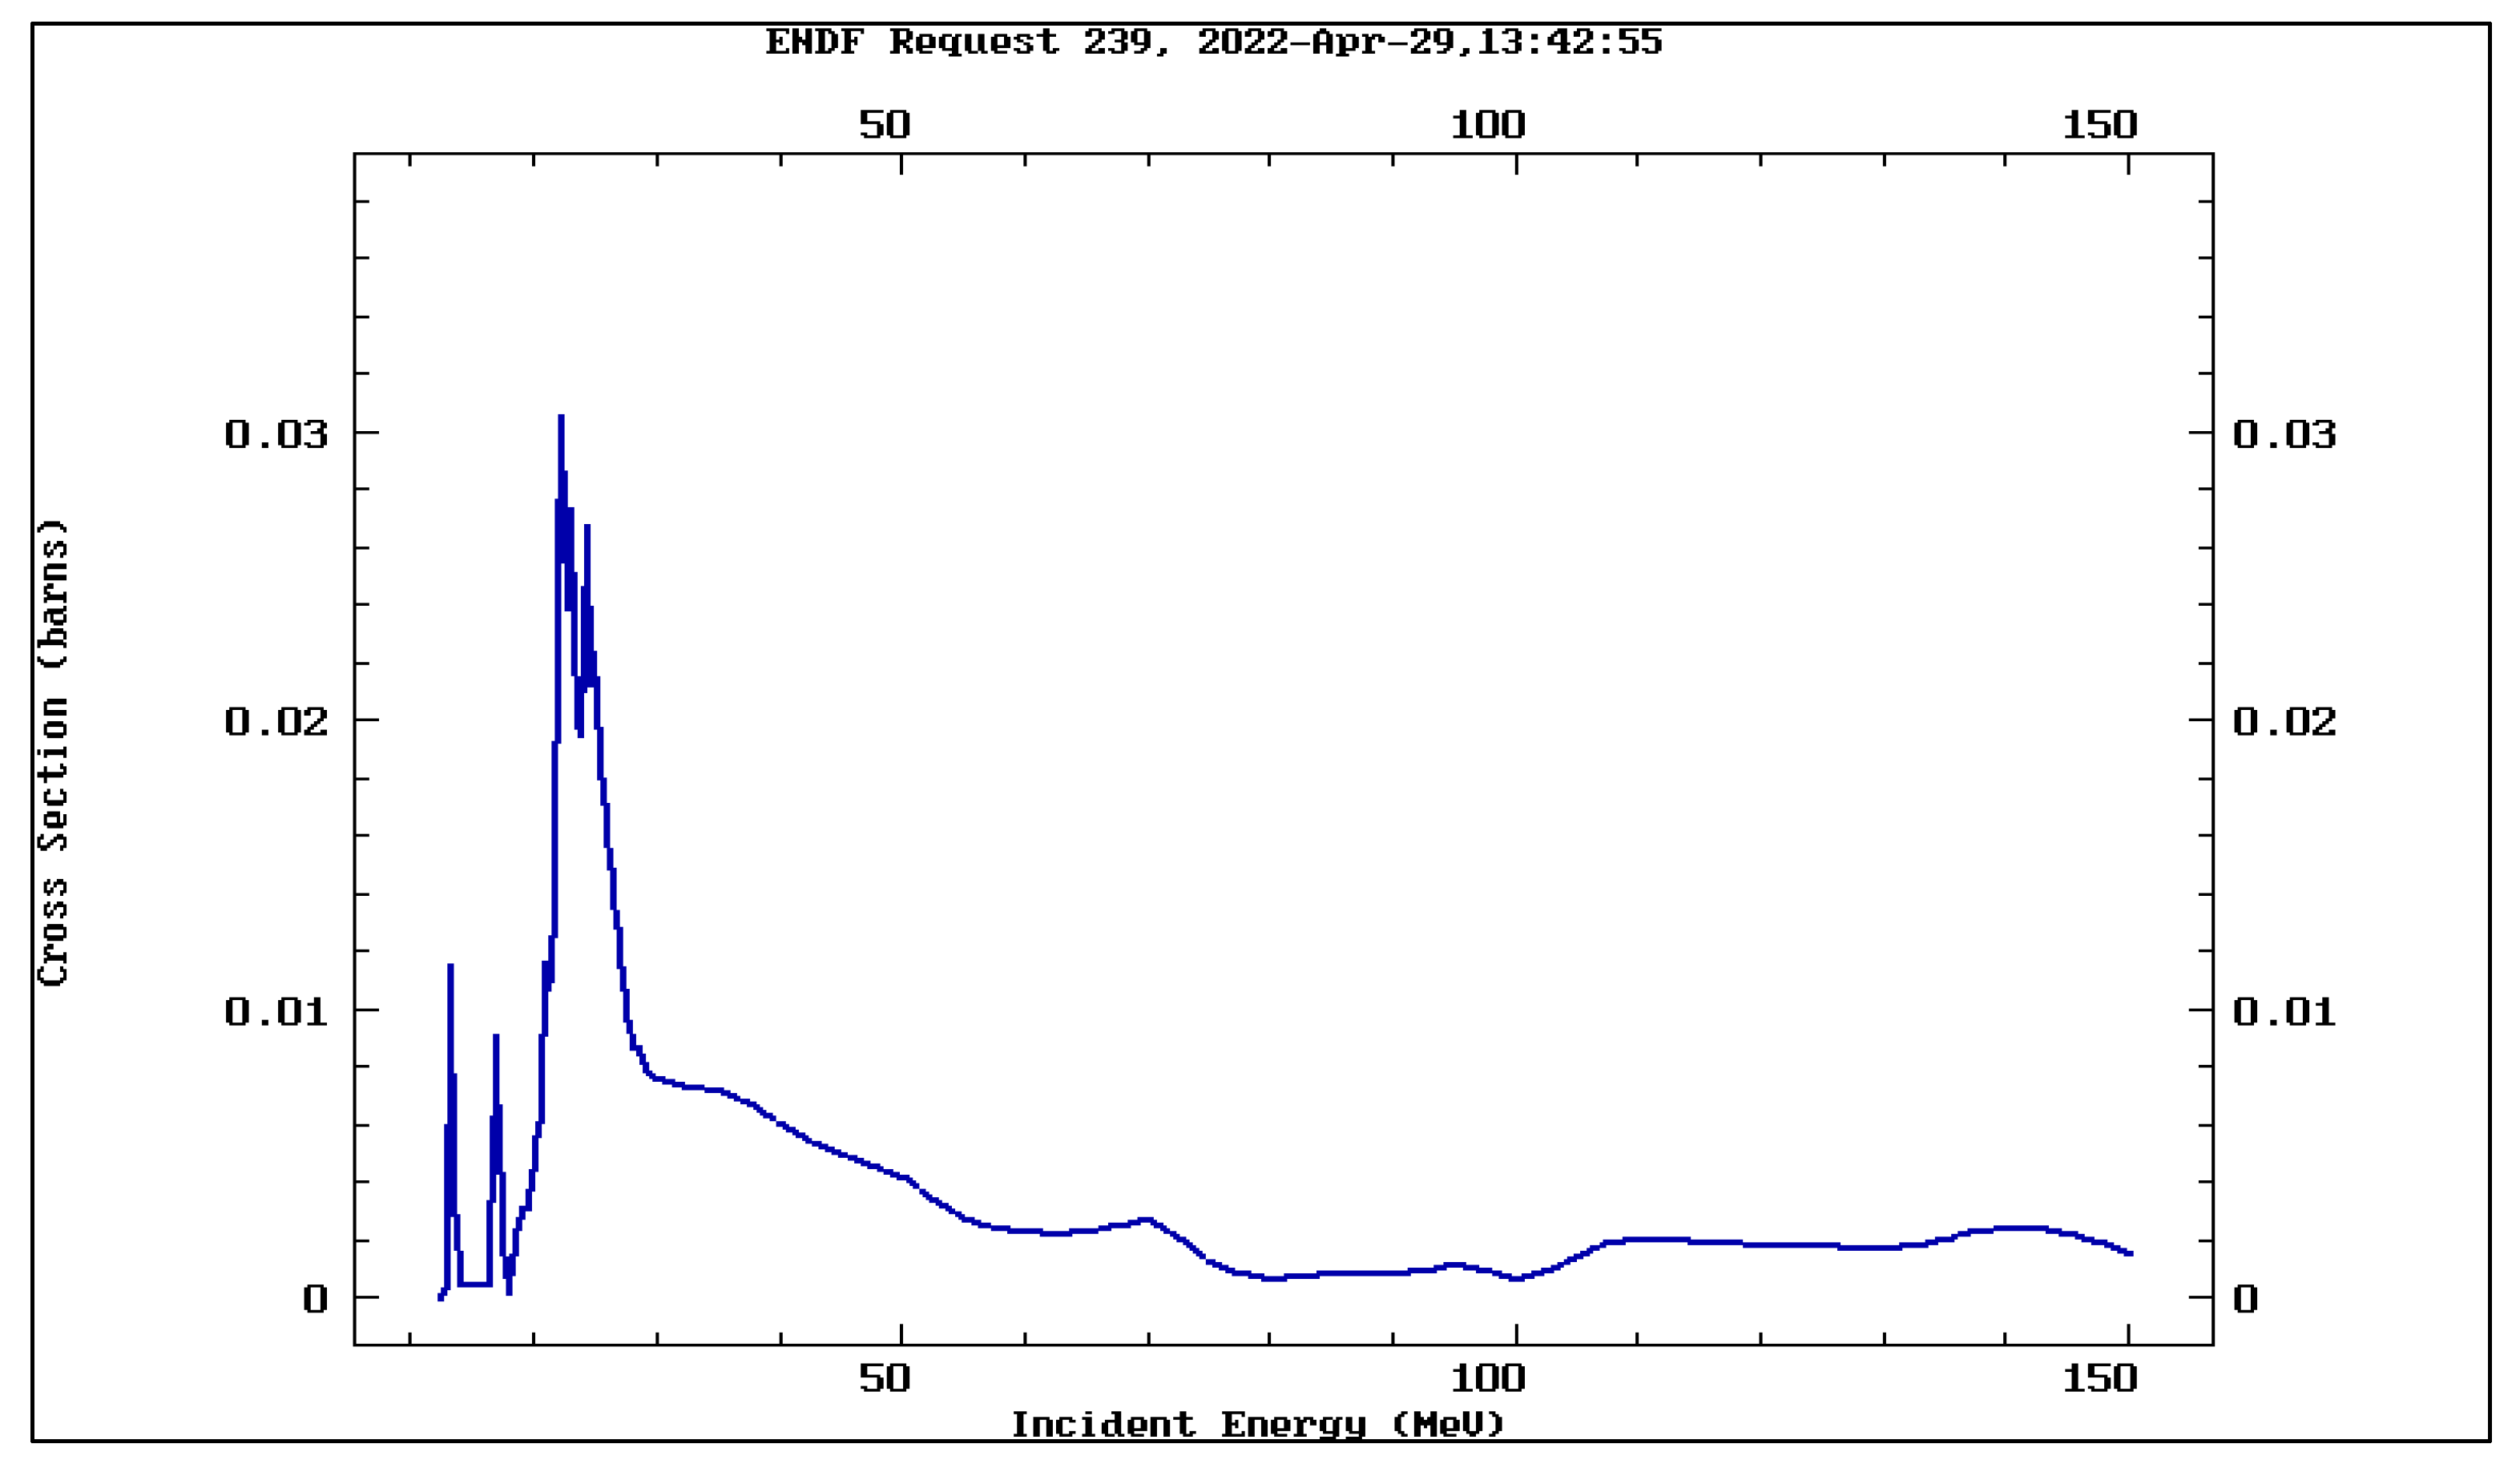
Figure 5.
2D views of neutron, electron, photon and proton fluxes per each source particle in an air-filled fracture when the source particle is proton with (a) Eh = 20 MeV and (b) Eh = 9.38 MeV (for EQs with ML = 7.67 and 5.79, respectively).
Figure 5.
2D views of neutron, electron, photon and proton fluxes per each source particle in an air-filled fracture when the source particle is proton with (a) Eh = 20 MeV and (b) Eh = 9.38 MeV (for EQs with ML = 7.67 and 5.79, respectively).
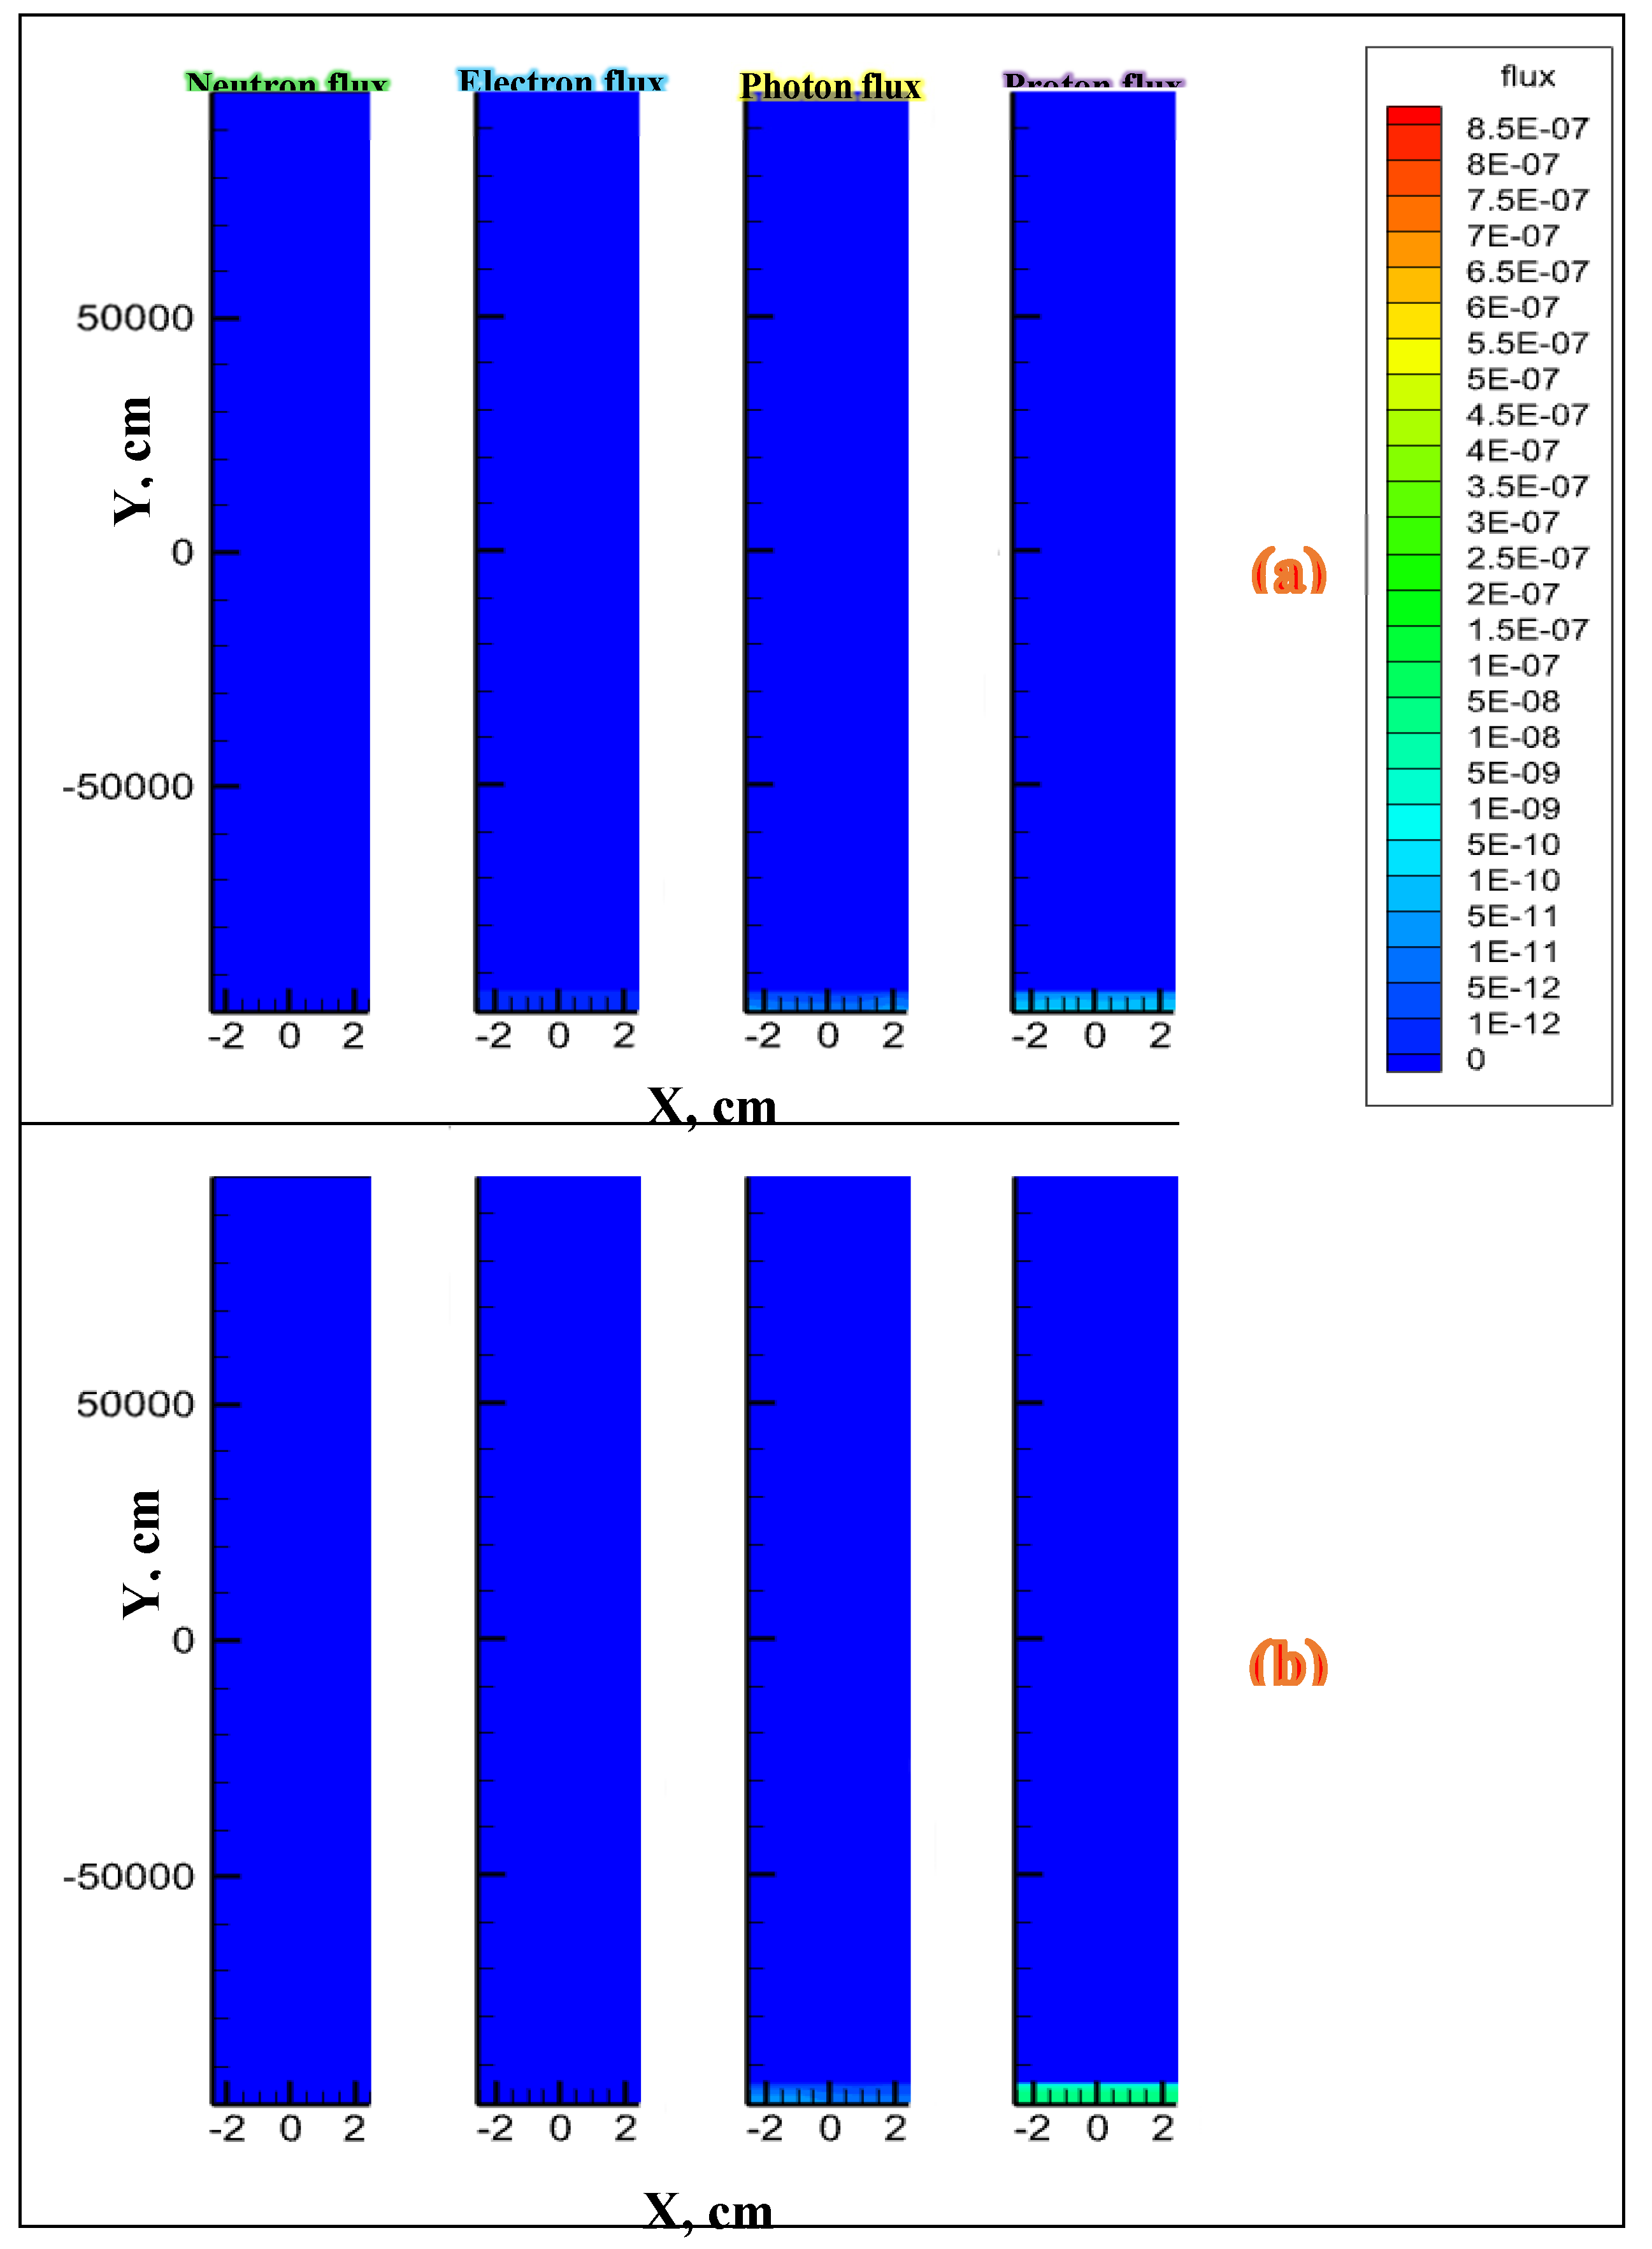
Figure 6.
2D views of different particle fluxes per each source particle in a water-filled fracture when the source particle is (a) neutron with E= 24.6 MeV, (b) photon with E= 3.05 MeV and (c) proton with E= 20 MeV (all for EQ with ML = 7.67).
Figure 6.
2D views of different particle fluxes per each source particle in a water-filled fracture when the source particle is (a) neutron with E= 24.6 MeV, (b) photon with E= 3.05 MeV and (c) proton with E= 20 MeV (all for EQ with ML = 7.67).
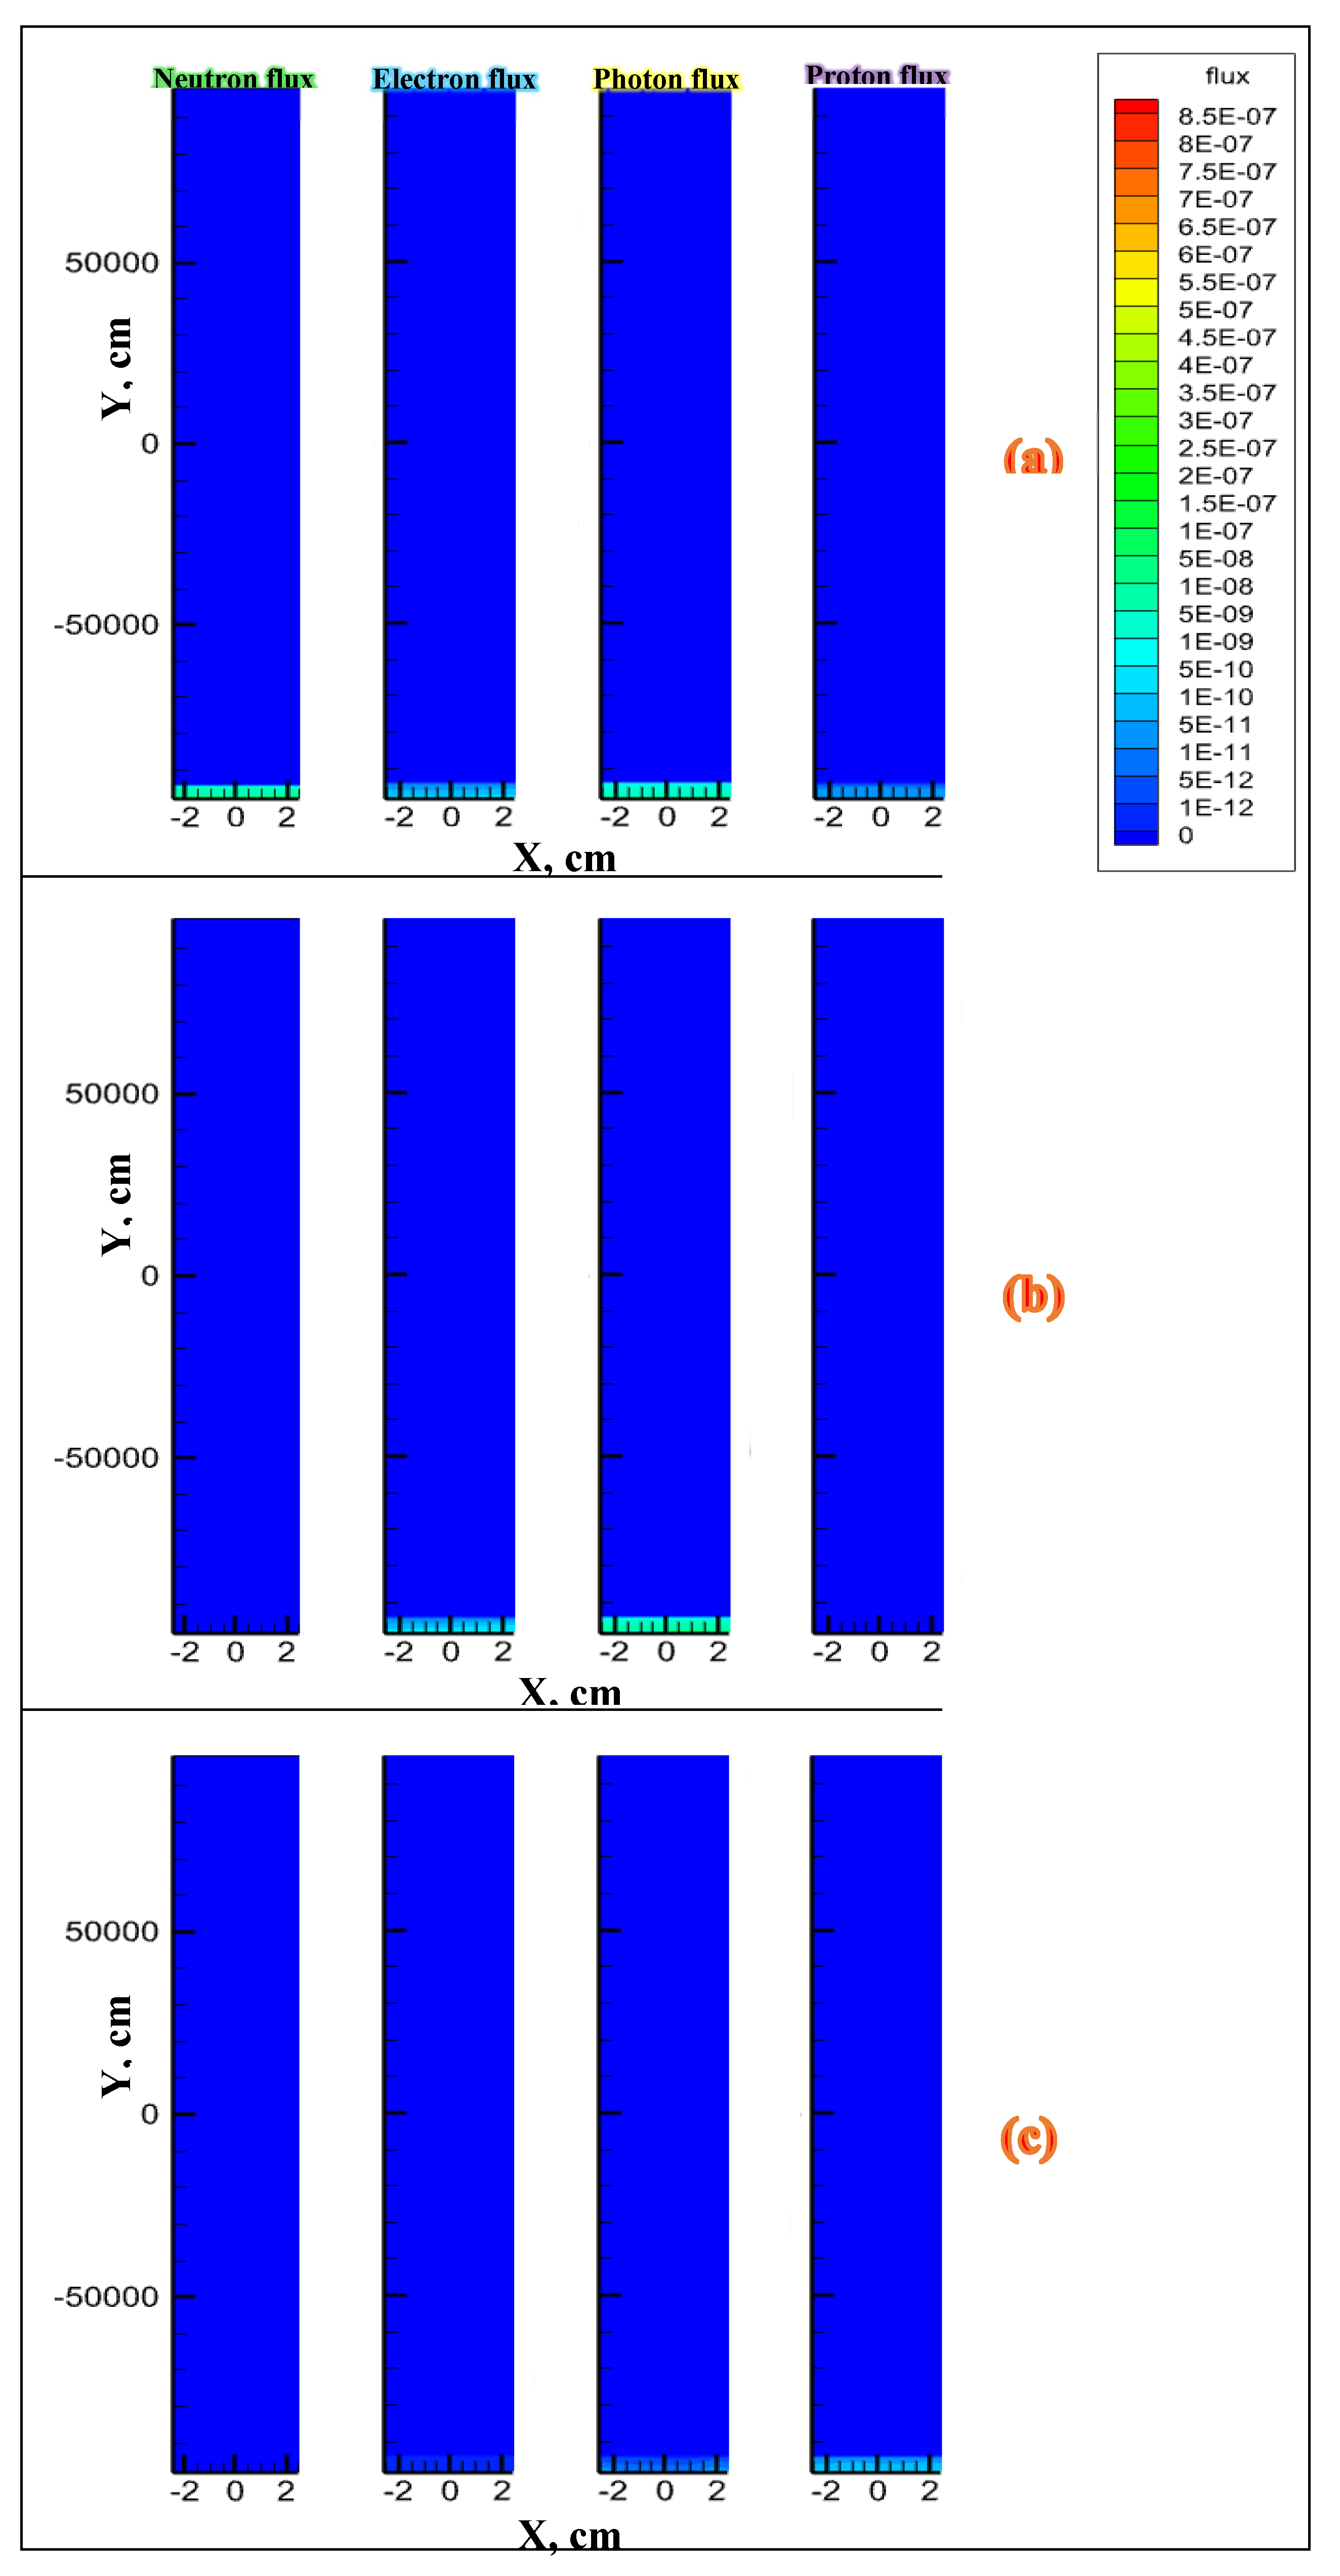
Figure 7.
2D views of neutron, electron, photon and proton fluxes per each source particle in a CO2-filled fracture when the source particle is neutron with Eγ = 3.05 MeV (for EQ with ML = 7.67) and the density of CO2 is (a) 1.870 kg/m3 and (b) 61.31 kg/m3, respectively.
Figure 7.
2D views of neutron, electron, photon and proton fluxes per each source particle in a CO2-filled fracture when the source particle is neutron with Eγ = 3.05 MeV (for EQ with ML = 7.67) and the density of CO2 is (a) 1.870 kg/m3 and (b) 61.31 kg/m3, respectively.
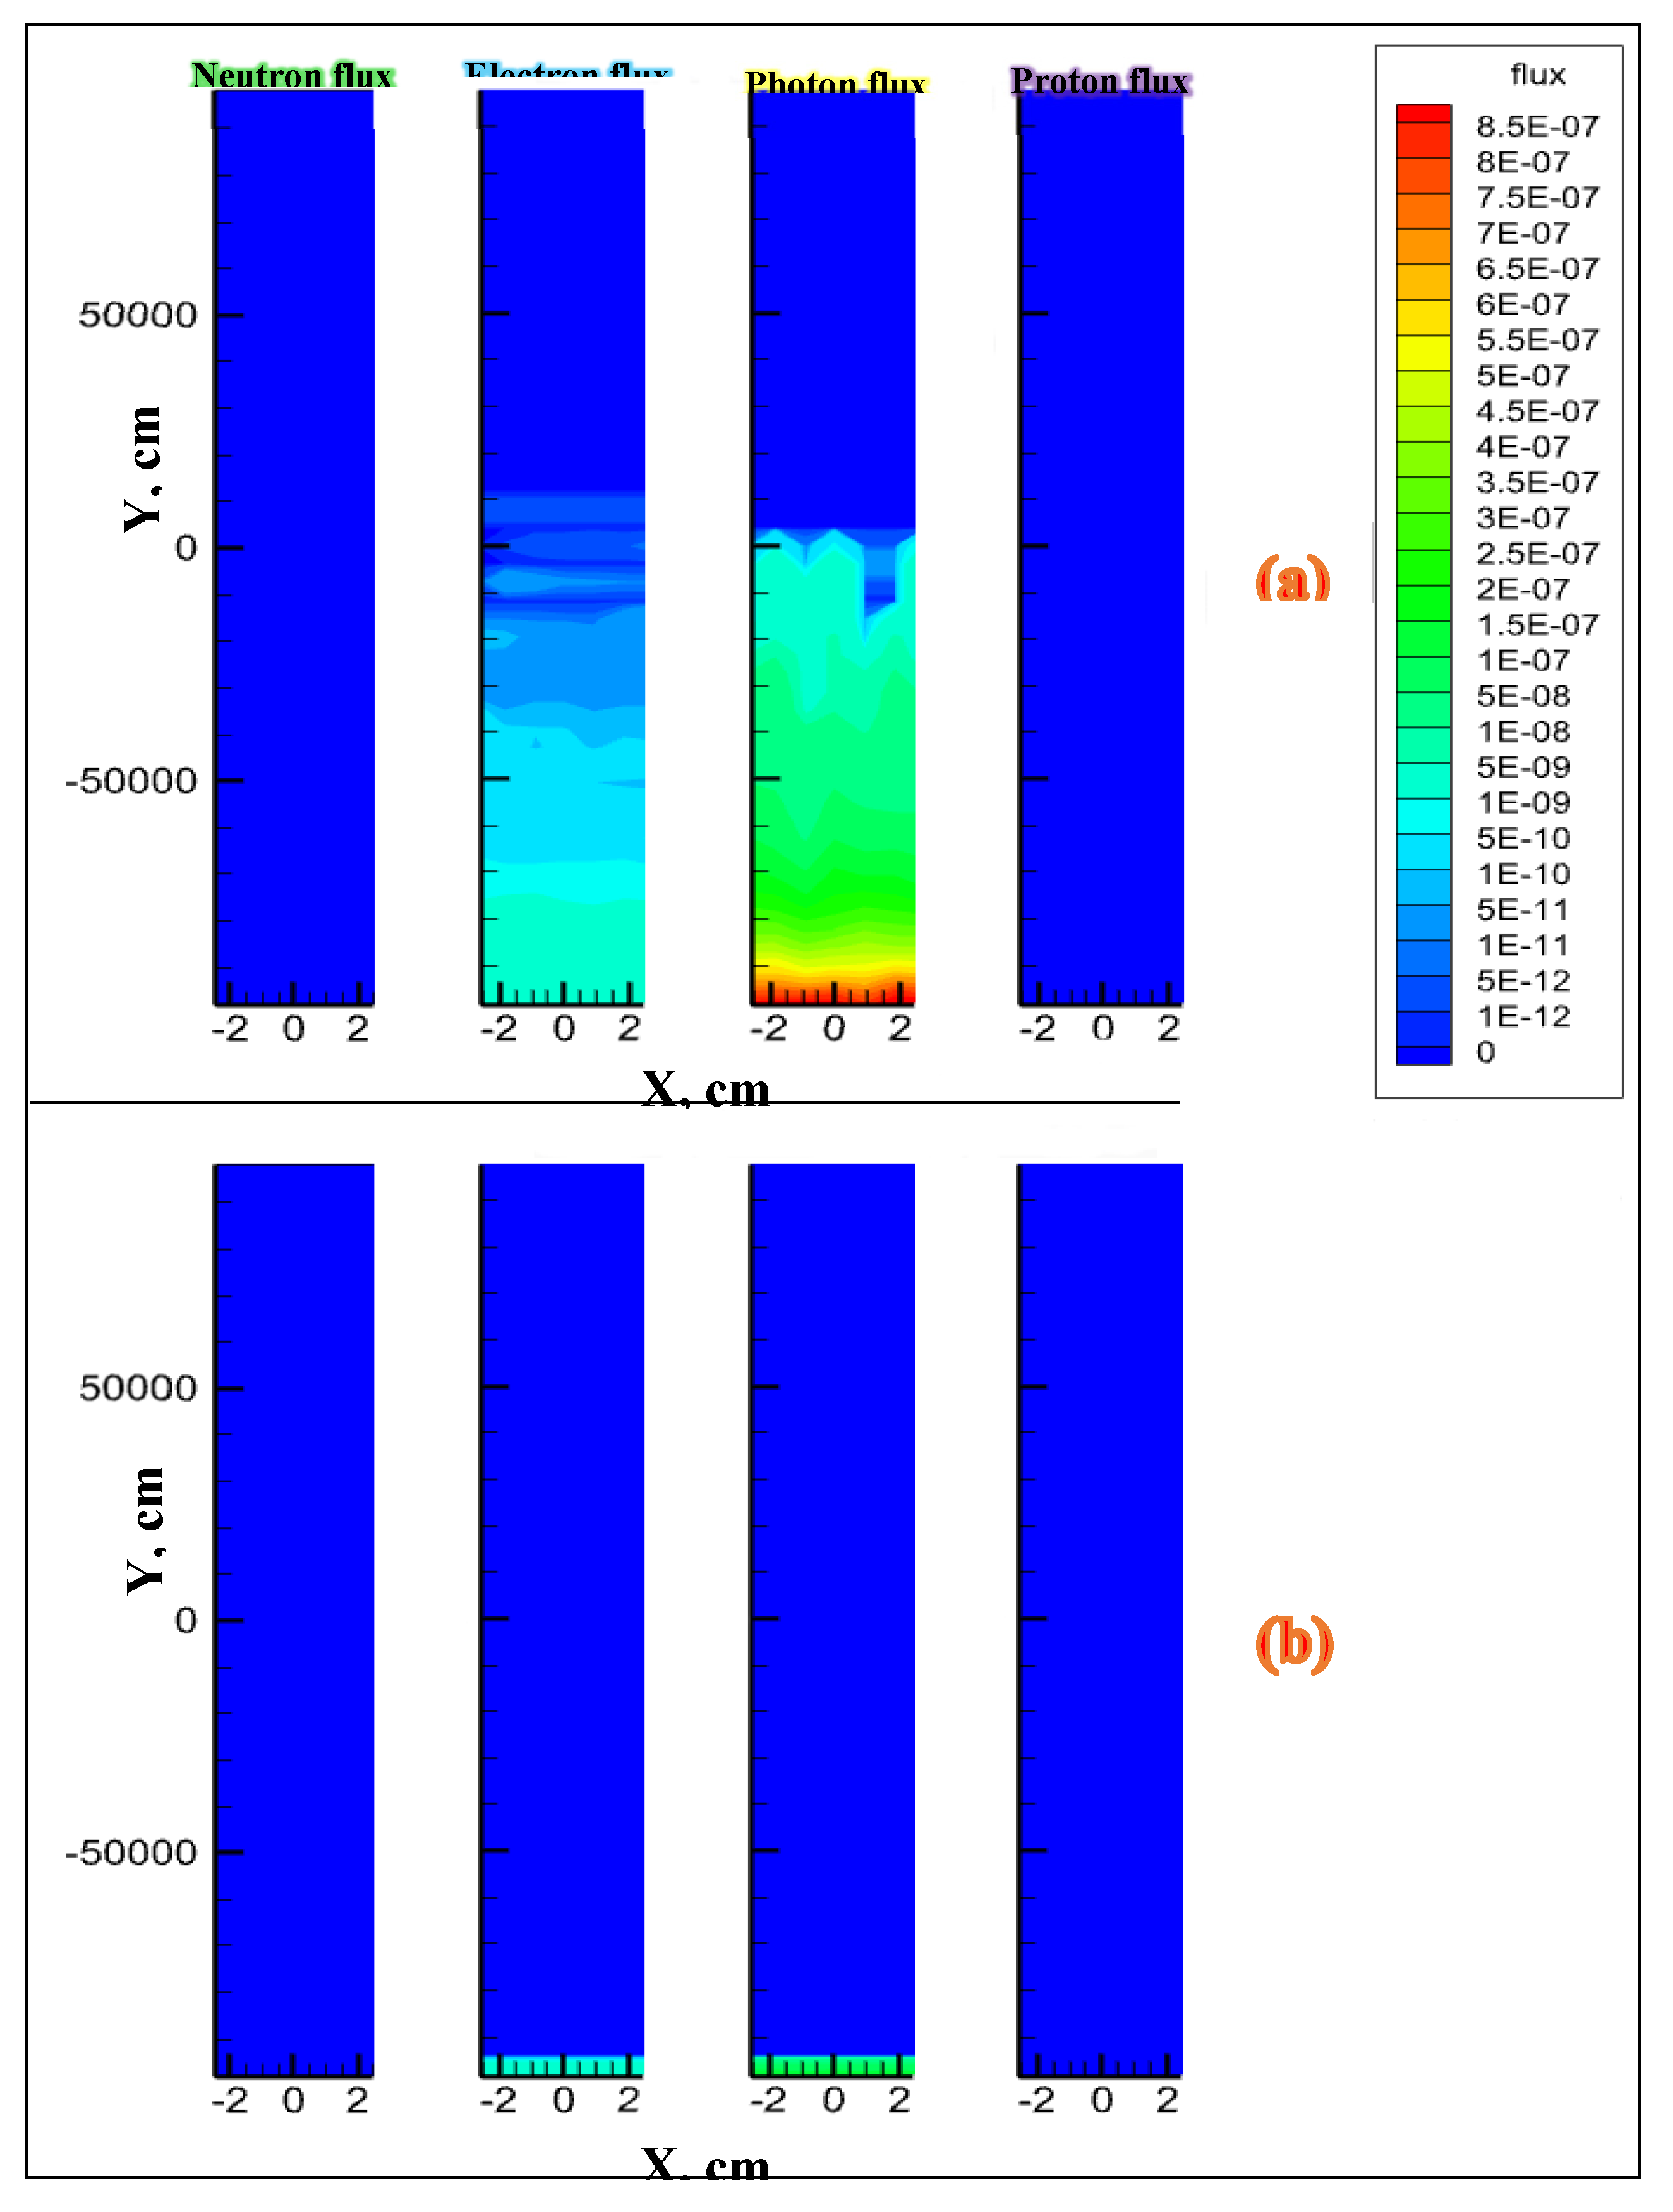

Table 1.
elemental percentage of the granite, based in its chemical composition as illustrated in the Table 1.
Table 1.
elemental percentage of the granite, based in its chemical composition as illustrated in the Table 1.
| Elements | O | Si | Al | K | Na | Ca | Fe | Total |
|---|---|---|---|---|---|---|---|---|
| Percentage, % | 62 | 22.5 | 9 | 3 | 2 | 0.5 | 1 | 100 |
Table 2.
Computed initial energy of the runaway electrons and the estimated average energy of the created particles inside the granite rock tissue, achieved from the simulation outputs in NPS electron= 1000 for two ML [15].
Table 2.
Computed initial energy of the runaway electrons and the estimated average energy of the created particles inside the granite rock tissue, achieved from the simulation outputs in NPS electron= 1000 for two ML [15].
| Block dimensions,m3 | ML | Initial runaway electrons’ energy, MeV | Average energy of the created particles, MeV | |||
|---|---|---|---|---|---|---|
| Neutrons | Photons | Electrons | Protons | |||
| 4003 | 5.79 | 885 | 10.4 | 1.81 | 0.03 | 9.38 |
| 40003 | 7.67 | 8858 | 24.6 | 3.05 | 0.04 | 20 |
Table 3.
Input parameters for simulation of the neutron propagation inside an air-filled fracture when an EQ with ML= 7.67 is occurred inside a granite block.
Table 3.
Input parameters for simulation of the neutron propagation inside an air-filled fracture when an EQ with ML= 7.67 is occurred inside a granite block.
| ML | Material | Fracture dimensions, m3 | Source particle | Average Energy (MeV) | Source position | Source direction | No. of particles (NPS) |
|---|---|---|---|---|---|---|---|
| 7.67 | Air | 2000×1000×0.1 | n | 24.6 | bottom surface | From bottom to top surface | 100’000 |
Table 4.
The simulation results for some of the created particles’ characteristics, in an air-filled fracture when the source particle is neutron, photon and proton with NPS=100’000 and the energies equivalent to ML= 7.67 and 5.79 MeV, respectively.
Table 4.
The simulation results for some of the created particles’ characteristics, in an air-filled fracture when the source particle is neutron, photon and proton with NPS=100’000 and the energies equivalent to ML= 7.67 and 5.79 MeV, respectively.
| NPS=100’000 | Created particles’ characteristics | |||||||
|---|---|---|---|---|---|---|---|---|
| Fracture filling material | ML | Source particle | Source particle’s Energy, MeV | Particles | No. | Average energy, MeV | Mean free path (mfp), cm | Average time of capture or escape, s |
| Air | 7.67 | Neutron | 24.6 | Neutron | 112686 | 2.31E+01 | 1.33E+04 | 2.68E-04 |
| Electron | 94389550 | 1.59E-02 | 2.05E+01 | ….. | ||||
| Photon | 1207243 | 9.24E-01 | 1.58E+04 | 1.87E-04 | ||||
| Proton | 42362 | 5.07E+00 | 3.65E+00 | ….. | ||||
| Air | 7.67 | Photon | 3.05 | Neutron | 0 | 0.00E+00 | 0.00E+00 | 0 |
| Electron | 27029959 | 1.56E-02 | 2.45E+01 | ….. | ||||
| Photon | 329562 | 9.49E-01 | 2.34E+04 | 7.60E-07 | ||||
| Proton | 0 | 0.00E+00 | 0.00E+00 | …. | ||||
| Air | 7.67 | Proton | 20 | Neutron | 31 | 3.49E+00 | 8.34E+03 | 3.35E-04 |
| Electron | 250243 | 1.59E-02 | 9.24E+00 | ….. | ||||
| Photon | 3098 | 9.53E-01 | 1.86E+04 | 3.48E-05 | ||||
| Proton | 100783 | 1.99E+01 | 1.26E+01 | ….. | ||||
| Air | 5.79 | Neutron | 10.4 | Neutron | 100000 | 1.04E+01 | 1.41E+04 | 2.21E-04 |
| Electron | 75862285 | 1.60E-02 | 2.10E+01 | ….. | ||||
| Photon | 965231 | 9.31E-01 | 1.81E+04 | 1.90E-04 | ||||
| Proton | 6366 | 3.49E+00 | 6.94E-01 | ….. | ||||
| Air | 5.79 | Photon | 1.81 | Neutron | 0 | 0.00E+00 | 0.00E+00 | 0 |
| Electron | 16646303 | 1.47E-02 | 1.36E+01 | ….. | ||||
| Photon | 132001 | 7.88E-01 | 1.77E+04 | 5.75E-07 | ||||
| Proton | 0 | 0.00E+00 | 0.00E+00 | …. | ||||
| Air | 5.79 | Proton | 9.38 | Neutron | 0 | 0.00E+00 | 0.00E+00 | 0.00E+00 |
| Electron | 30057 | 1.53E-02 | 6.09E+00 | ….. | ||||
| Photon | 386 | 8.89E-01 | 1.58E+04 | 1.22E-08 | ||||
| Proton | 105 | 9.37E+00 | 2.88E+00 | ….. | ||||
Table 5.
Input parameters for simulation of the neutron propagation inside a water-filled fracture when an EQ with ML= 7.67 is happened inside a granite block.
Table 5.
Input parameters for simulation of the neutron propagation inside a water-filled fracture when an EQ with ML= 7.67 is happened inside a granite block.
| ML | Material | Fracture dimensions, m3 | Source particle | Average Energy (MeV) | Source position | Source direction | No. of particles (NPS) |
|---|---|---|---|---|---|---|---|
| 7.67 | Water | 2000×1000×0.1 | N | 24.6 | bottom surface | From bottom to top surface | 100’000 |
Disclaimer/Publisher’s Note: The statements, opinions and data contained in all publications are solely those of the individual author(s) and contributor(s) and not of MDPI and/or the editor(s). MDPI and/or the editor(s) disclaim responsibility for any injury to people or property resulting from any ideas, methods, instructions or products referred to in the content. |
© 2023 by the authors. Licensee MDPI, Basel, Switzerland. This article is an open access article distributed under the terms and conditions of the Creative Commons Attribution (CC BY) license (http://creativecommons.org/licenses/by/4.0/).
Copyright: This open access article is published under a Creative Commons CC BY 4.0 license, which permit the free download, distribution, and reuse, provided that the author and preprint are cited in any reuse.


