
Submitted:
23 January 2023
Posted:
26 January 2023
You are already at the latest version
Abstract
Introduction: Hemostatic dysfunction during extracorporeal membrane oxygenation (ECMO) due to blood-circuit interaction and the consequences of shear stress by flow rates lead to rapid activation of the coagulation cascade and thrombus formation in the ECMO system and blood vessels. In this study, we aimed to identify the incidence and risk factors for cannula-associated arterial thrombosis (CaAT) post-decannulation. Methods: A retrospective study of patients undergoing arterial cannula removal following ECMO. We evaluated the incidence of CaAT and compared clinical characteristics, pre-ECMO severity, and daily hemostasis parameters in patients with and without CaAT. Multivariate analysis revealed the risk factors for CaAT. Results: Forty-seven patients requiring venoarterial ECMO or hybrid methods were recruited to be screened for thrombosis. The median SOFA score was 11 (8-13). CaAT occurred in 29 patients (61.7%), with thrombosis in the superficial femoral artery accounting for 51.7%. Limb ischemia complications in the group with CaAT was 17.2%. In multivariate analysis, an ECMO flow rate of 100 mL/min was determined to be the independent factor for CaAT with an OR of 0.84 (95% CI, 0.73–0.95, p=0.008). Conclusion: In patients successfully weaned from ECMO, the incidence of CaAT was 61.7%. Our study found that a low-flow rate of ECMO was an independent risk factor for CaAT.
Keywords:
extracorporeal membrane oxygenation
; cannula-associated arterial thrombosis
; flow rate
1. Introduction
Venoarterial extracorporeal membrane oxygenation (VA-ECMO) is increasingly being used to support patients with cardiogenic shock refractory to conventional therapies [1]. Hemostatic dysfunction during ECMO due to direct exposure of the patient's blood to the nonbiomaterials of the ECMO system activates endogenous and exogenous coagulation cascades, platelets, leukocytes and complement, and the consequences of shear stress may lead to the formation of thrombi, especially at low blood flow positions [2,3]. Moreover, stages of extracorporeal circulation have also been known to increase the risk of thrombosis in critically ill patients with multiple disease-related thrombotic risk factors [2].
Limb ischemia complications with multifactorial etiologies can develop at any stage of ECMO support, including during cannulation, during support, and after the decannulation stage, resulting in the increased morbidity and mortality [4,5,6]. The rate of limb ischemia complications during ECMO support stages has been reported to be high by many studies with the main risk factors being female sex, younger age, peripheral vascular disease, and the use of large cannulas due to flow obstruction [5,6,7,8]. However, limb ischemia due to thrombosis could be high even after decannulation. Arterial thrombosis formation in VA-ECMO is potentially higher in the low-flow space segment because of the low blood flow between the arterial cannula and the distal perfusion cannula [4,9,10] (Figure 1). The consequence of arterial lumen occlusion, if left unnoticed and inappropriately managed, could result in acute limb ischemia [4].
Venous thromboembolism after cannula removal has been investigated, and risk factors for venous thrombosis formation have been well reported [11,12,13,14], while cannula-associated arterial thrombosis (CaAT) after decannulation has been underestimated. A CaAT incidence of 5- 41% in patients with VA-ECMO after decannulation has been reported in different centers, and there are very few studies exploring CaAT in Asian countries [15,16,17,18]. To the best of our knowledge, no studies have demonstrated the risk factors for CaAT after ECMO decannulation [15]. Therefore, we conducted this study to determine the incidence of CaAT and to identify the risk factors associated with CaAT in patients requiring VA-ECMO.
2. Materials and Methods
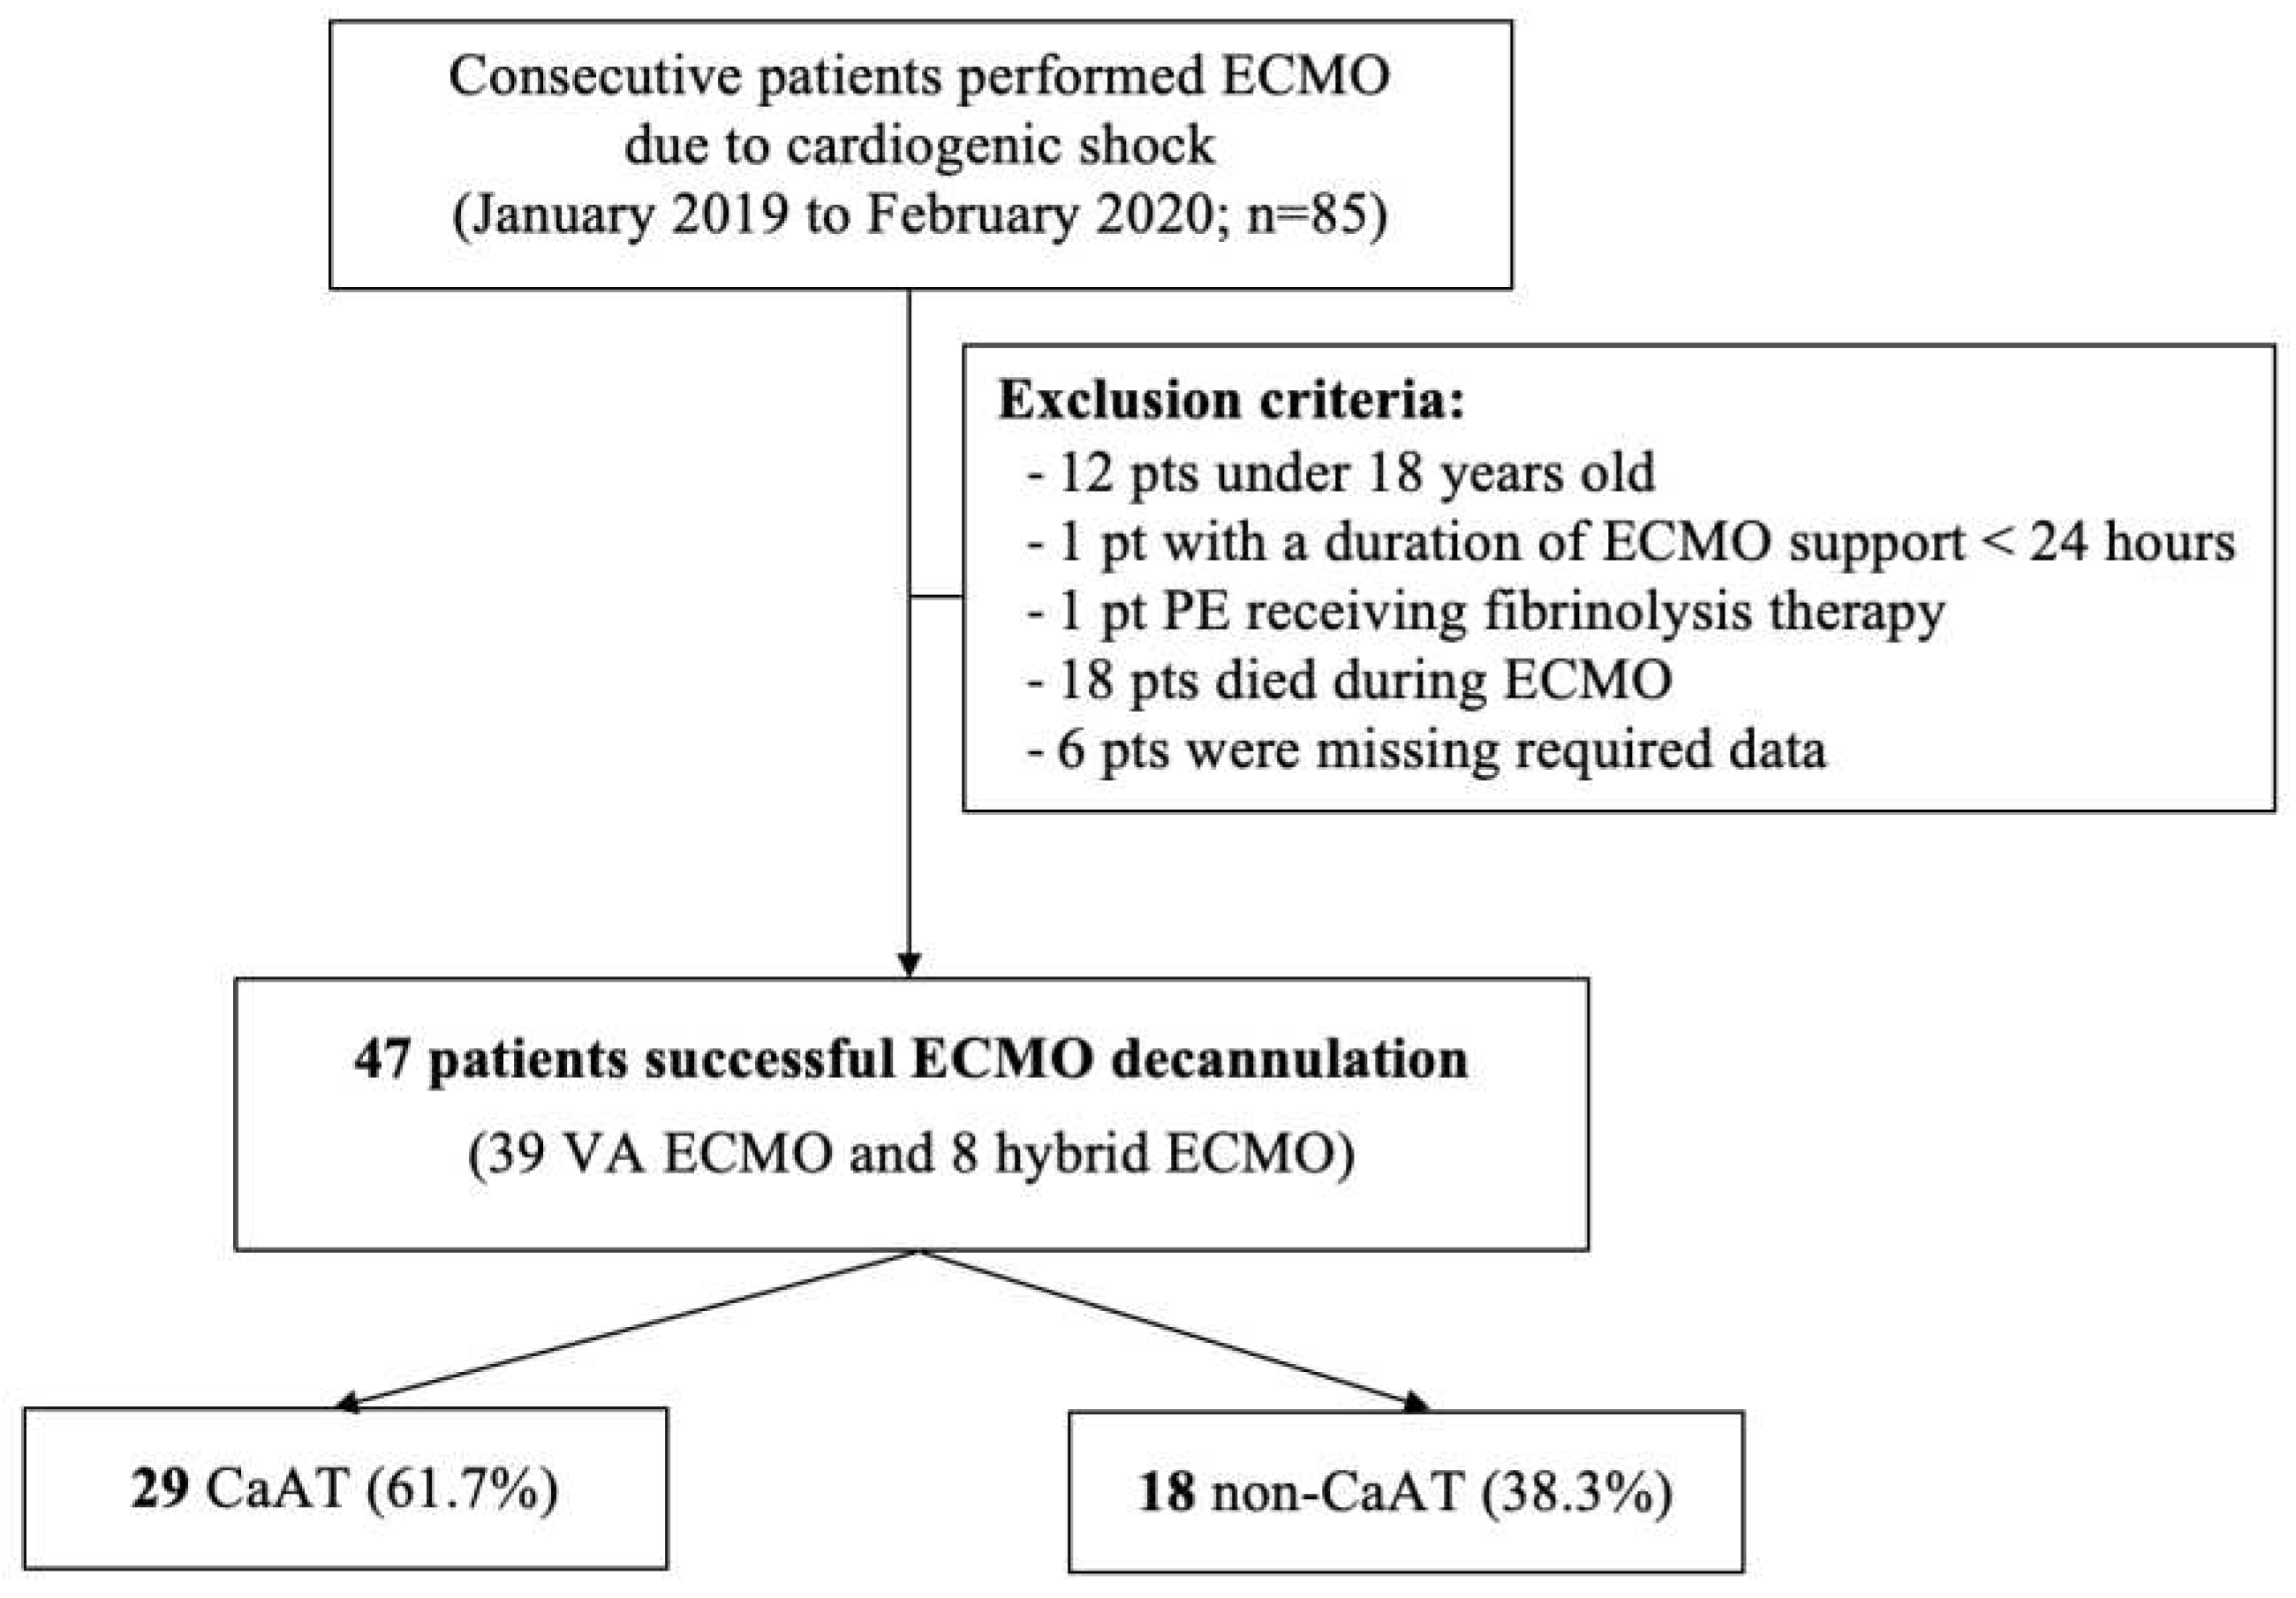
This was a retrospective observational study. Consecutive patients requiring VA-ECMO at the intensive care unit (ICU) of Cho Ray Hospital (CRH) were enrolled from January 2019 to February 2020. CRH is a 2,300-bed tertiary hospital, serving as the last health care frontier in Southern Vietnam. Our ICU is an ECMO center and provides ECMO support for more than 100 patients per year. Exclusion criteria included patients under 18 years old, patients with a duration of ECMO support of less than 24 hours, pulmonary embolism patients receiving fibrinolytic therapy, patients who were not screened for thrombosis after cannula removal, patients who died during ECMO, and patients who were missing required data.
Data collection
We collected patient characteristics, including age, sex, diagnoses, comorbidities, pre-ECMO severity scores, including SOFA (Sequential Organ Failure Assessment), APACHE II (Acute Physiology and Chronic Health Evaluation II) and VIS (Vasoactive-inotropic score) scores, and daily hemostatic parameters, including platelet count, PT, aPTT, fibrinogen, anti-Xa, antithrombin-III activity, ECMO machine parameters, and anticoagulation dose. The primary outcome was an arterial thromboembolic event after cannula removal, and the secondary outcomes included limb ischemia complications, ICU length of stay, hospital length of stay, and hospital mortality.
Definitions
Cannula-associated arterial thrombosis
Cannula-associated arterial thrombosis was diagnosed when (1) an arterial thrombus was recorded in the documentation of surgical vascular closure performed by vascular surgeons and/or (2) a thrombus was detected by bedside vascular ultrasound performed after decannulation and within 24 h of percutaneous vascular closure. Bedside vascular ultrasound was performed by sonographers, and thrombosis was confirmed by at least 2 sonographers.
Limb ischemia complications
Lower extremity ischemia complications after cannula removal were diagnosed by near-infrared spectroscopy (NIRS) and ultrasound.
ECMO data
The ECMO system in our ICU comprised a Rotaflow console, a PLS membrane, and cannulas from Maquet, Getinge Group. The cannula size ranged from 15 to 17 Fr for arterial cannulas, from 5 to 7 Fr Super Arrow-flex sheath for distal perfusion cannulas, and from 21 to 25 Fr for venous cannulas. The ECMO circuit was implemented in the ICU, and cannulas were placed at the bedside by trained intensivists using the percutaneous Seldinger technique under ultrasound guidance.
Anticoagulation strategies and ECMO weaning
After a loading dose, unfractionated heparin (UFH) was titrated to target an aPTTr of 1.5-2.5 or an anti-Xa of 0.3-0.7 UI/ml during ECMO support. To wean a patient from ECMO, the ECMO blood flow was gradually decreased by 0.5 l/min, while the patient’s hemodynamic status, including blood pressure, rhythm, and bedside cardiac output measurement, was simultaneously evaluated. Low-flow rates may trigger coagulation in the ECMO system; therefore, once the ECMO flow rate was reduced to 1.0 L/min, bolus unfractionated heparin or an increase in intravenous heparin dose was needed. Once the decision was made to withdraw the cannula, the ECMO blood flow was increased back to >2.5 l/min, and heparin was stopped during preparation for decannulation. The arterial cannula was removed either by a percutaneous vascular closure technique using Proglide devices (Abbott) at the bedside or by surgical vascular closure in the operating room. After decannulation, dosing UFH or enoxaparin was at the attending physician’s discretion based on the consideration of the risk of bleeding and thrombosis.
Statistical analysis
Statistical analysis was performed using R Statistical Software (version 3.6.2). Categorical variables are presented as numerical data and percentages and were analyzed using Fisher’s exact test. Continuous variables were first tested for normality using the Shapiro–Wilk test. Variables with and without a normal distribution are reported as the mean ± standard deviation (SD) and median (25th–75th percentile), respectively. Comparisons of continuous variables between 2 groups with and without CaAT were conducted using Student’s t test and the Mann–Whitney U test when appropriate. Univariate and multivariate logistic regression were employed to estimate the odds ratio (OR) with a 95% confidence interval (CI) to investigate risk factors for CaAT. Receiver operating characteristic (ROC) curve analysis was performed to evaluate the discrimination of CaAT. The cutoff values were determined based on Youden’s index. For all statistical tests, a two-sided p value of <0.05 was considered statistically significant.
Medical ethics
The study was approved by the Ethics Committee in Biomedical Research of the University of Medicine and Pharmacy at Ho Chi Minh City (No. 122/HDĐ-ĐHYD) on February 26, 2022.
3. Results
Baseline characteristics of the patients
Among the 85 patients who were supported by VA-ECMO from January 2019 to February 2020, 38 patients met the exclusion criteria (Figure 2), and 47 patients (39 receiving VA-ECMO and 8 receiving hybrid ECMO) were included in the final analysis. The median age was 33 (26-45.5) years. There were fewer male patients (16 patients, 34%) than female patients. Acute myocarditis accounted for 68.1% of the main indications for ECMO. The median SOFA, APACHE II, and VIS scores were 11 (8-13), 18 (12.5-25), and 66 points, respectively. The ECMO system characteristics, patients’ baseline characteristics and outcomes between the CaAT and non-CaAT groups are presented in Table 1.
CaAT and outcomes
In our study, forty-seven patients with arterial cannulas were successfully weaned from ECMO. Cannula-associated arterial thrombosis occurred in 29 patients (61.7%); among them, superficial femoral artery thrombosis was reported in 15 patients (51.7%), and common femoral artery thrombosis was reported in 5 patients (20.6%). The distribution of patients with CaAT is shown in Figure 3. Additionally, 21/47 patients (44.7%) underwent surgical vascular closure in the operating room and 55.3% of patients underwent percutaneous vascular closure at the bedside. After cannula removal, 41 patients (87.2%) were administered UFH or enoxaparin for the prevention or treatment of thromboembolism.
In our study, limb ischemia occurred in 5 out of 29 patients with CaAT (17.2%). The hospital mortality rate in the CaAT group was not different from that in the non-CaAT group.
Risk factors for CaAT
There were no significant differences in age or sex between the two groups. Arterial cannula and distal perfusion cannula sizes were not significantly different between the two groups. The number of blood products transfused during ECMO was higher in the CaAT group, but the difference was not statistically significant. The duration of ECMO support was similar in the groups with and without CaAT (6 days (4-8) vs. 6 days (4-7), p = 0.991, respectively). The ICU length of stay was 9.0 days (7.0-12.0) vs. 9.50 days (8.0-21.2) (p=0.582), respectively. Risk factors regarding the characteristics of patients and ECMO systems are presented in Table 1.

Table 1.
Results of the blood coagulation parameters.
| Characteristics | All (N=47) |
Cannula-associated arterial thrombosis | p value | |
|---|---|---|---|---|
| Yes | No | |||
| Age (year), median (IQR) | 33.0 [26-45.5] | 33.0 [26.0-39.0] | 37.5 [27.8-52.0] | 0.185 |
| Male sex, n (%) | 16 (34) | 7 (24.1) | 9 (50) | 0.068 |
| BMI (kg/m2 ), median (IQR) | 21.3 [19.5-22.7] | 20.8 [19.5-22.2] | 22.0 [20.8-23.4] | 0.100 |
| Comorbidities | ||||
| Hypertension, n (%) | 3 (6.4) | 2 (6.9) | 1 (5.6) | 0.680 |
| Diabetes, n (%) | 3 (6.4) | 2 (6.9) | 1 (5.6) | 0.680 |
| ≥ 2 Comorbidities, n (%) | 5 (10.6) | 3 (20.3) | 2 (11.1) | 0.644 |
| Severity scores on ICU admission | ||||
| SOFA score, median (IQR) | 11 [8-13] | 10.0 [7.0-13.0] | 11.0 [9.0-13.8] | 0.397 |
| APACHE II score, median (IQR) | 18[12.5-25] | 18.0 [11.0-21.0] | 17.5 [13.8-25.2] | 0.661 |
| VIS score, median (IQR) | 66 [37.5-141.5] | 96 [35.0-153] | 63.5 [43.2-95.2] | 0.686 |
| Reason for ECMO | ||||
| Myocarditis, n (%) | 32 (68.1) | 21 (72.4) | 11 (61.1) | 0.419 |
| Myocardial infarction, n (%) | 3 (6.4) | 2 (6.9) | 1 (5.6) | 0.680 |
| Other, n (%) | 12 (25.5) | 6 (20.7) | 6 (33.3) | 0.265 |
| Blood products transfusion during ECMO | ||||
| Red blood cells (unit), median (IQR) | 2.0 [2.0-6.0] | 3.0 [2.0-6.0] | 4.5 [4.0-5.75] | 0.285 |
| Fresh Frozen Plasma (unit), median (IQR) | 1.0 [0-5.5] | 2.0 [0-6.0] | 2.5 [0-4.0] | 0.660 |
| Cryoprecipitate (unit), median (IQR) | 0 [0-0] | 0 [0-0] | 0 [0-0] | 0.621 |
| Platelets (unit), median (IQR) | 0 [0–0] | 1 [0-3.25] | 2 [0.25–4.5] | 0.565 |
| Arterial cannula diameter | ||||
| 15 Fr, n (%) | 27 (57.4) | 19 (65.5) | 8 (44.4) | 0.429 |
| 17 Fr, n (%) | 16 (34.1) | 8 (27.6) | 8 (44.4) | |
| 19 Fr, n (%) | 4 (8.5) | 2 (6.9) | 2 (11.1) | |
| Distal perfusion cannula diameter | ||||
| 5 Fr, n (%) | 12 (26.1) | 9 (31.1) | 3 (17.6) | 0.203 |
| 6 Fr, n (%) | 31 (67.4) | 17 (58.6) | 15 (83.3) | |
| 7 Fr, n (%) | 3 (6.5) | 3 (10.3) | 0 (0) | |
| Cannulation technique | ||||
| Surgery, n (%) | 3 (6.4) | 3 (10.3) | 0 (0) | 0.275 |
| Seldinger, n (%) | 44 (93.6) | 26 (89.7) | 18 (100) | |
| Infection before the start of ECMO, n (%) | 11 (51.1) | 6 (51.7) | 5 (50.0) | 0.456 |
| Pulmonary, n (%) | 7 (63.6) | 5 (83.3) | 2 (40) | |
| Other, n (%) | 4 (36.3) | 1 (16.6) | 3 (60) | |
| Infection during ECMO, n (%) | 22 (36.2) | 11 (34.5) | 12 (38.9) | 0.270 |
| Pulmonary, n (%) | 18 (81.1) | 11 (100) | 7 (58.3) | |
| Other, n (%) | 5 (22.7) | 0 (0) | 5 (41.7) | |
| Hybrid, n (%) | 8 (17.0) | 5 (17.2) | 3 (16.7) | 0.642 |
| IABP, n (%) | 7 (14.9) | 5 (17.2) | 2 (11.1) | 0.449 |
| Pacing, n (%) | 18 (38.3) | 14 (48.3) | 4 (22.2) | 0.07 |
| ECPR, n (%) | 7 (14.9) | 4 (13.8) | 3 (16.7) | 0.550 |
| Rotations of ECMO (Rotations/min), median (IQR) | 2800 [2701-2895] | 2800 [2720-2865] | 2793 [2632-2999] | 0.895 |
| Flow rate of ECMO (100 ml/min), median (IQR) | 26.8 [22.8-31.5] | 25.5 [22.4–29.4] | 31.4 [26.9–38.8] | 0.006 |
| Mean dose UFH (100 IU/h), median (IQR) | 6.09 [4.01–7.15] | 6.26 [4.03–7.73] | 5.96 [3.91–6.90] | 0.662 |
| Outcomes | ||||
| Major bleeding, n (%) | 11 (23.4) | 5 (17.2) | 6 (33.3) | 0.18 |
| Limb ischemia complication, n (%) | 5 (10.6) | 5 (17.2) | 0 (0) | 0.141 |
| Limb ischemia requiring thrombectomy, n (%) | 1 (2.1) | 1 (3.4) | 0 (0) | 0.617 |
| ECMO support, days, median (IQR) | 6 [4-7.5] | 6 [4-8] | 6 [4-7] | 0.991 |
| ICU length of stay, days, median (IQR) | 9.0 [8-13] | 9.0 [7.0-12.0] | 9.50 [8.0-21.2] | 0.582 |
| Hospital length of stay, days, median (IQR) | 16 [12.0–24.5] | 16.0 [12.0-22.0] | 15.5 [12.0-29.5] | 0.709 |
| Hospital mortality, n (%) | 5 (10.6) | 1 (3.4) | 4 (22.2) | 0.063 |
Data are presented as n (%) for categorical variables and the median (interquartile range) for nonparametric variables. APACHE-II, Acute Physiologic Assessment and Chronic Health Evaluation-II; BMI, body mass index; ECPR, Extracorporeal cardiopulmonary resuscitation; ECMO, Extracorporeal membrane oxygenation; SOFA, Sequential Organ Failure Assessment; VIS, Vasoactive-inotropic score; UFH, Unfractionated Heparin.
The hemostasis parameters are presented in Table 2. We found that the minimum and maximum fibrinogen concentrations were significantly lower in the group with CaAT (p < 0.05). In addition, the number of days with platelets < 150 G/L as the highest platelet count was also significantly different between the 2 groups (p < 0.05).
Univariate logistic regression showed that the maximum fibrinogen concentration, number of days with fibrinogen > 4 g/dL, and mean ECMO flow rate were associated with CaAT. A multivariable logistic regression model for CaAT prediction revealed that only the mean ECMO flow rate was an independent risk factor for CaAT, with an OR of 0.84 (95% CI 0.73–0.95; p = 0.008) (Table 3). The ROC curve of ECMO flow rates provided the optimal cutoff value of 30.7 (100 ml/min) for predicting CaAT, with a sensitivity of 66.7% and a specificity of 82.8% (Figure 4).
Figure 3.
The distribution of cannula-associated arterial thrombosis.
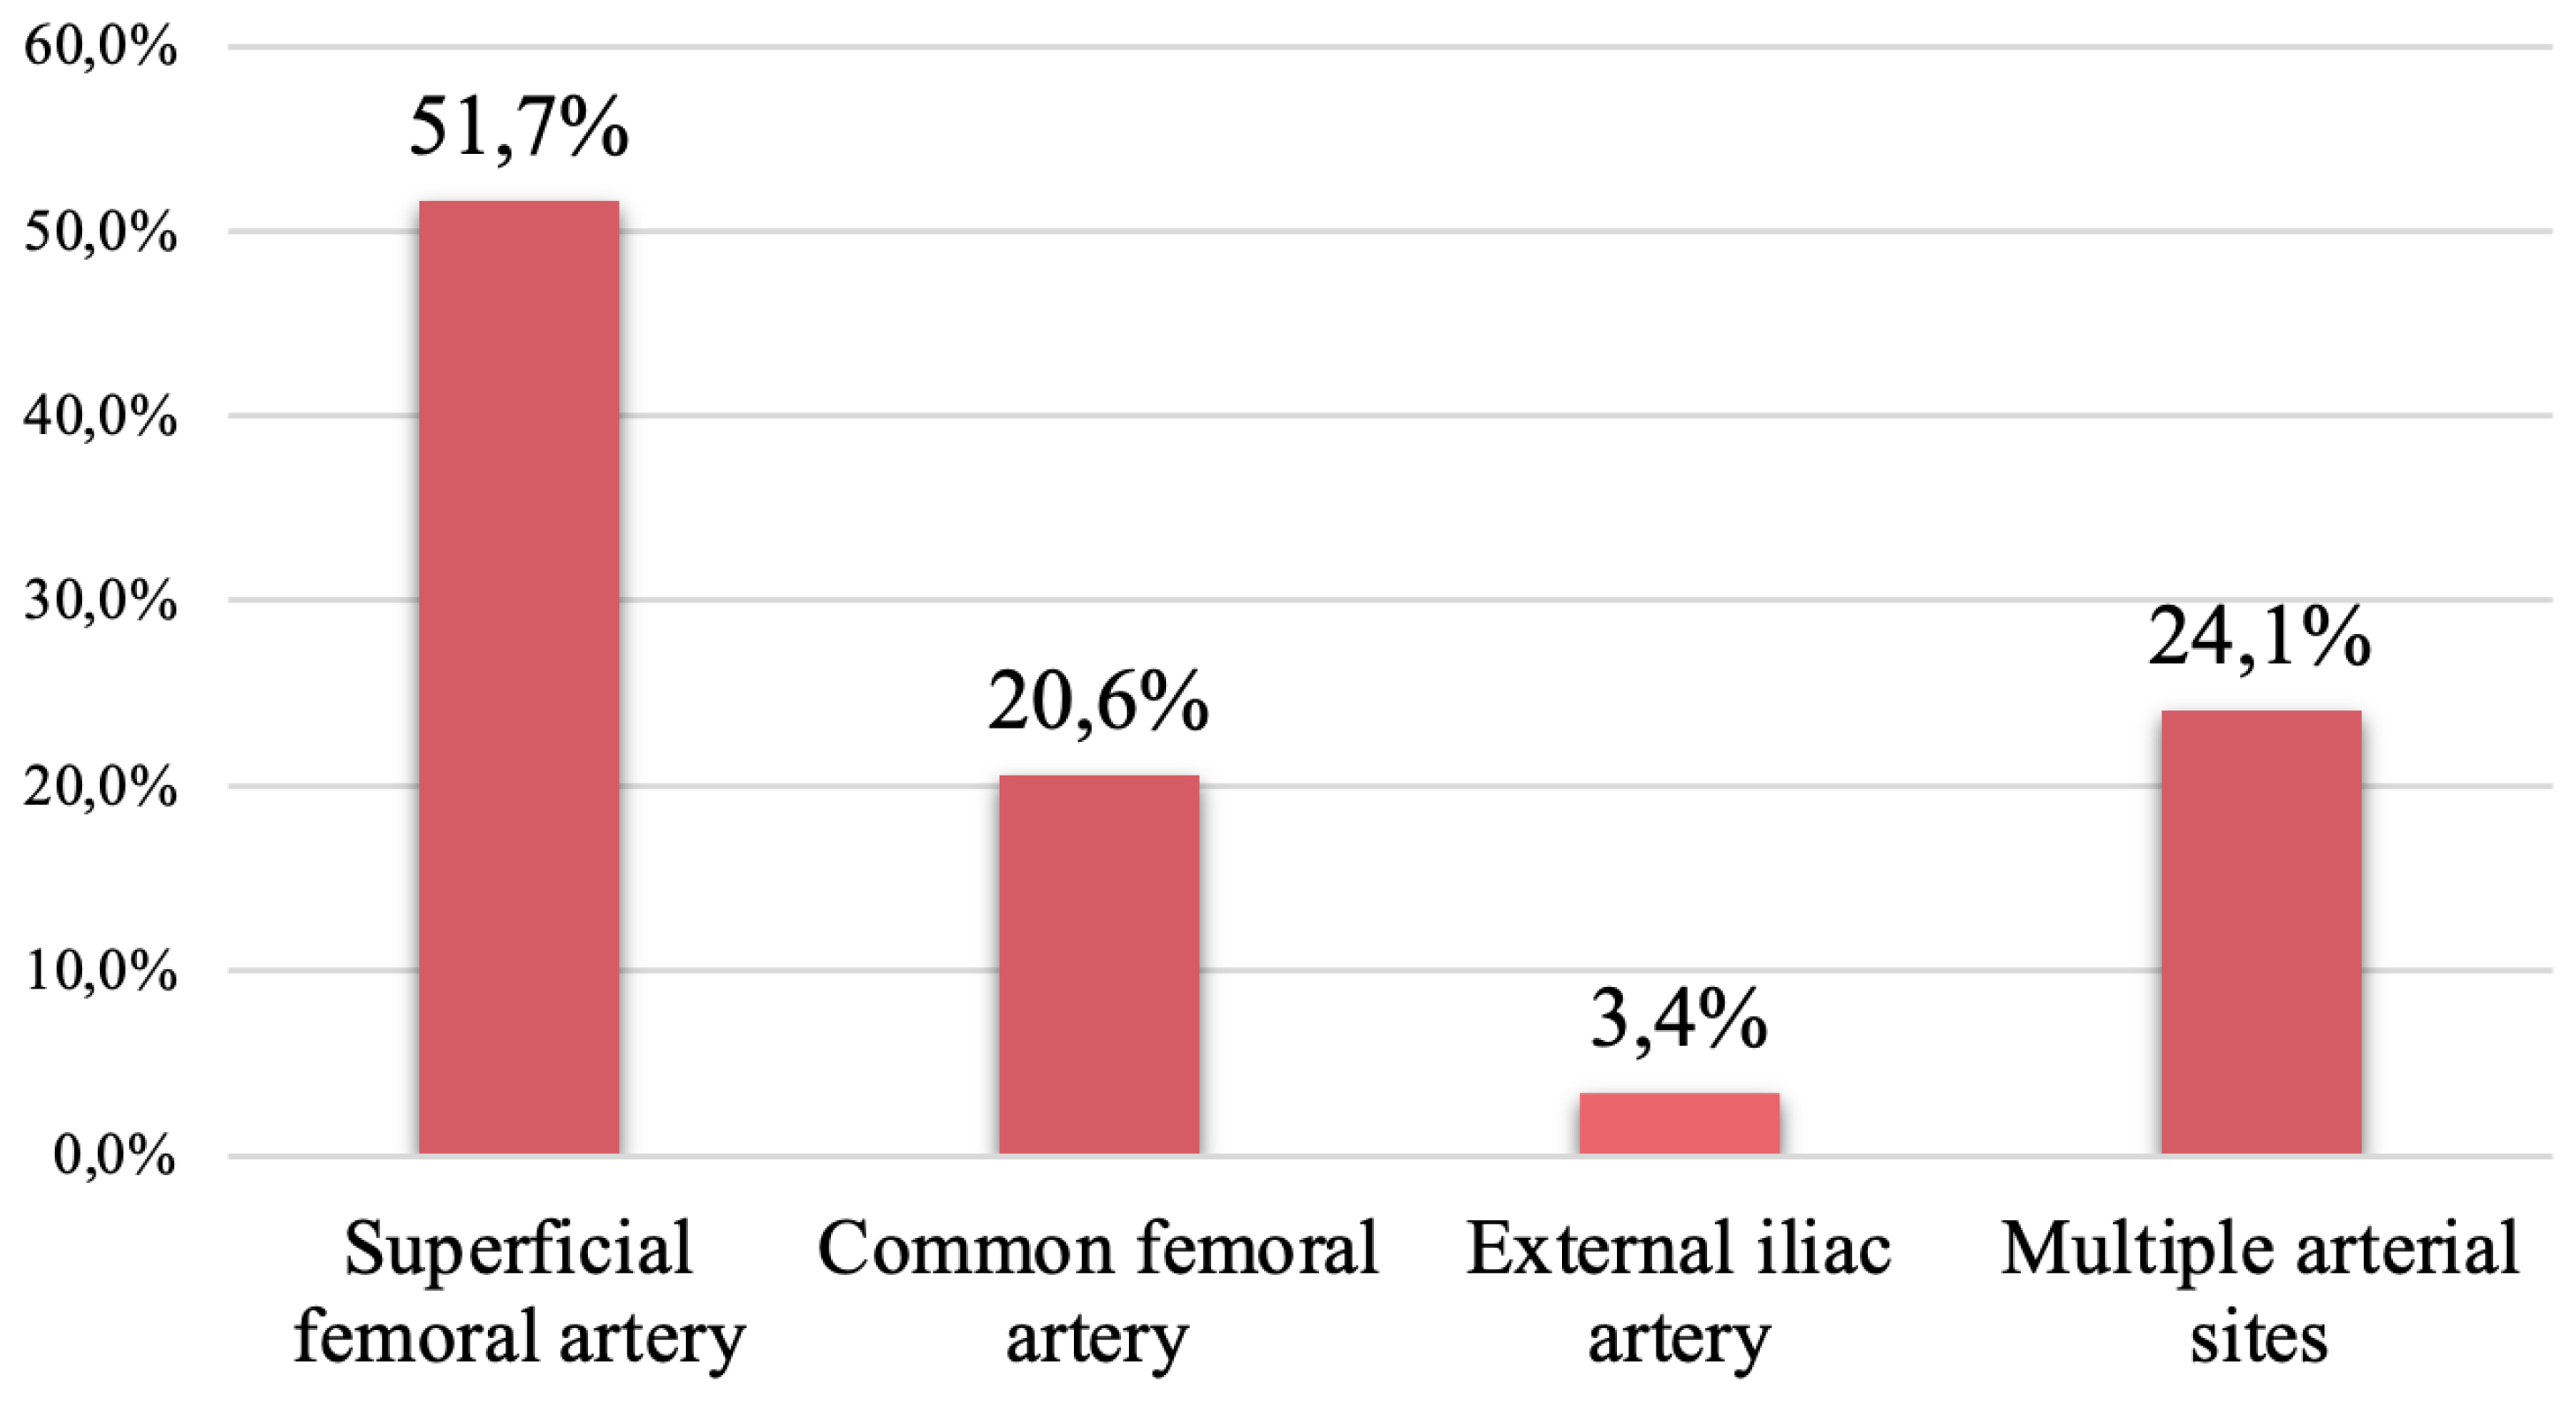
Figure 4.
A ROC curve of the mean ECMO flow rate for predicting CaAT. The mean flow rate had a good discriminative ability, with an AUC of 0.742. The cutoff of 30.7 (100 ml/min) predicted CaAT with a sensitivity of 66.7% and a specificity of 82.8%. AUC, area under the receiver operating characteristic curve; ROC, receiver operating characteristic; CaAT, cannula-associated arterial thrombosis.
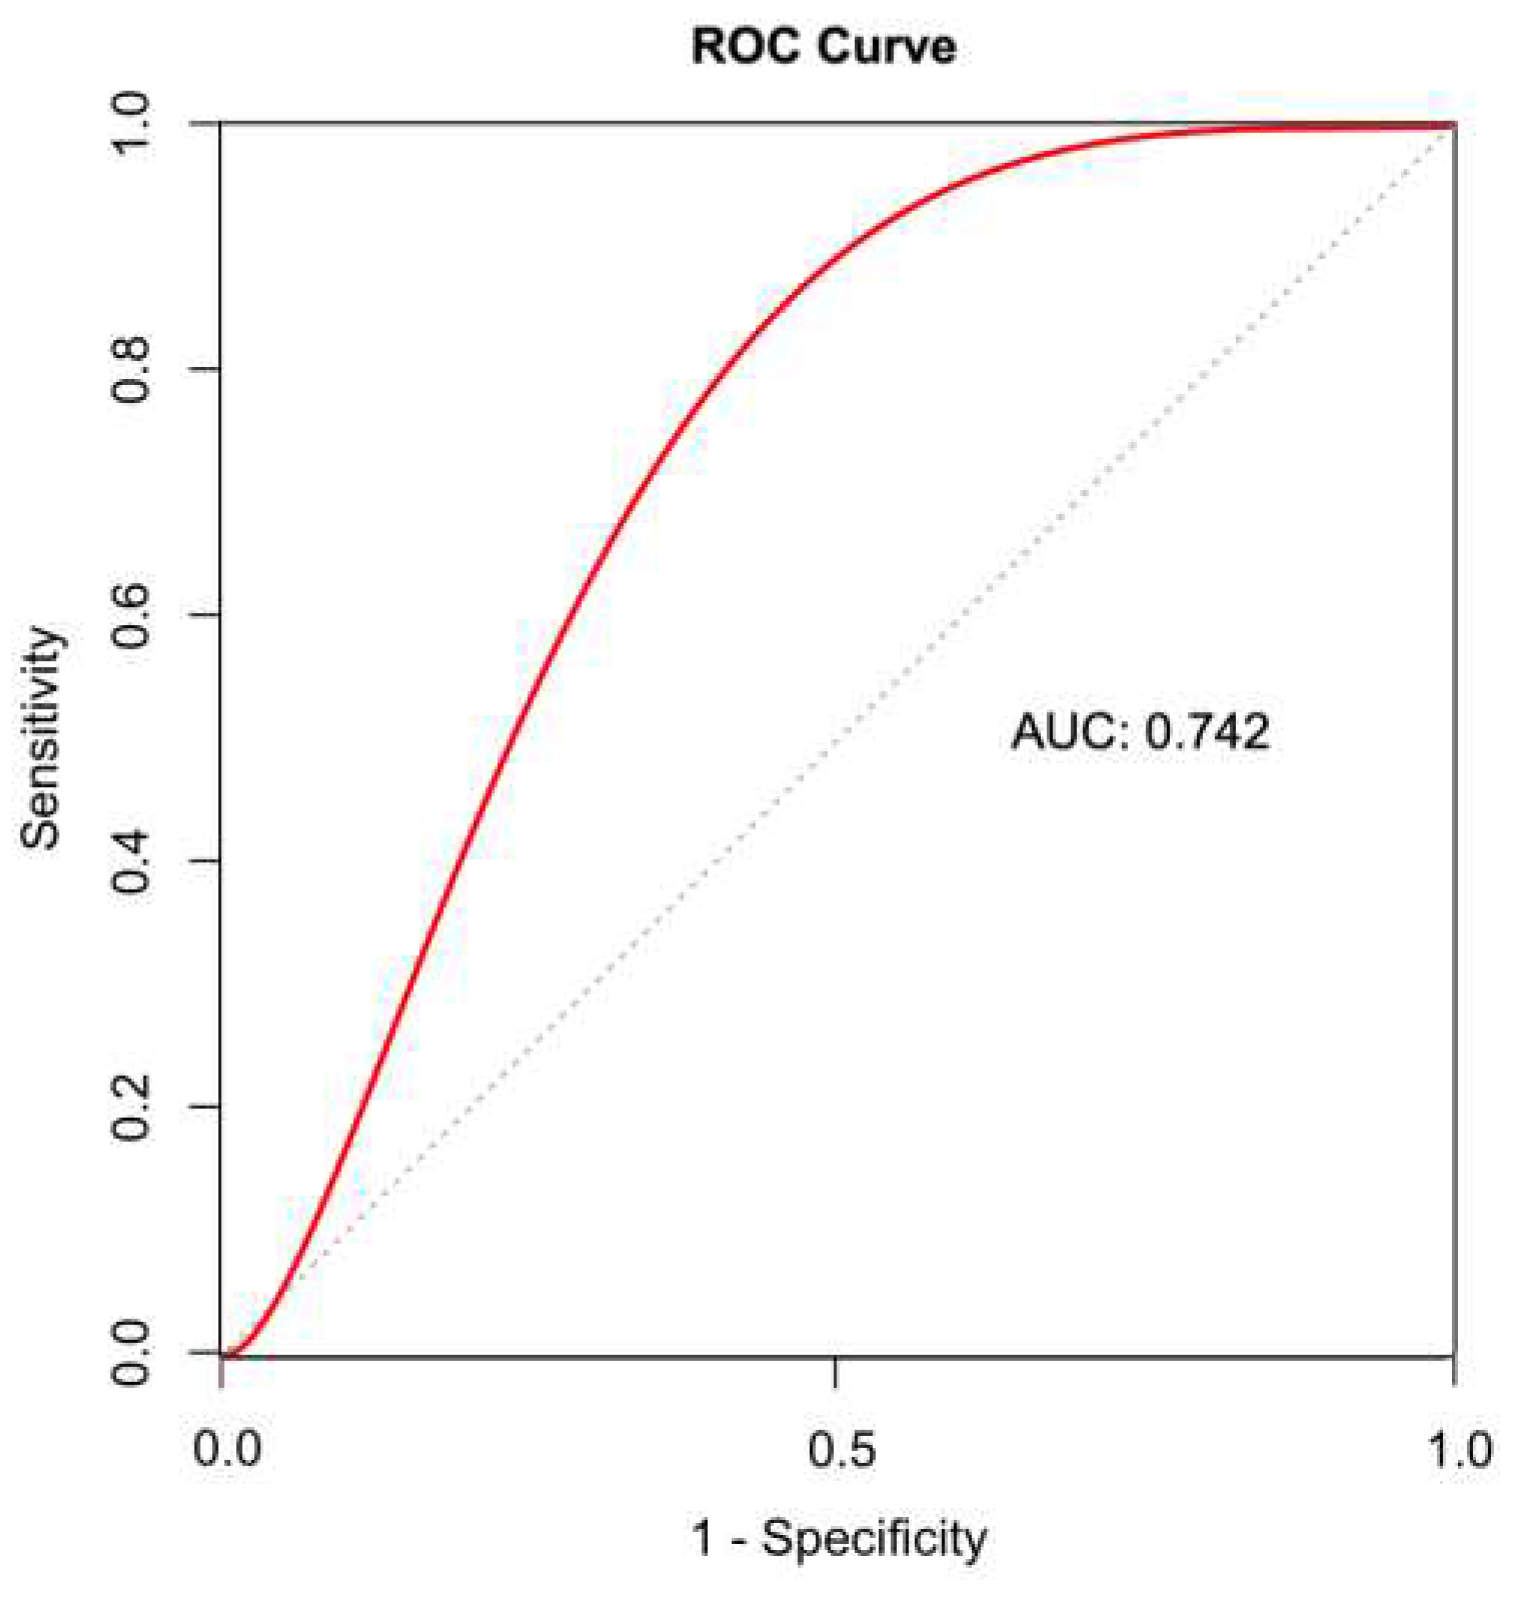
Table 2.
Results of the blood coagulation parameters.
| Characteristics | All (N=47) |
Cannula-associated arterial thrombosis | p value | |
|---|---|---|---|---|
| Yes | No | |||
| aPTT ratio | ||||
| Median aPTTr | 1.49 [1.36-1.73] | 1.59 [1.35-1.80] | 1.44 [1.38-1.68] | 0.393 |
| Days with aPTTr < 1.2 (%) | 0.17 [0-0.25] | 0.20 [0-0.25] | 0.13 [0-0.31] | 0.614 |
| Days with aPTTr ≥ 1.2 and < 1.5 (%) | 0.28 [0.13-0.50] | 0.25 [0.12-0.33] | 0.33 [0.25-0.50] | 0.142 |
| Days with aPTTr ≥ 1.5 and <2 (%) | 0.33 [0.14-0.42] | 0.33 [0.12-0.38] | 0.29 [0.20-0.46] | 0.667 |
| Days with aPTTr ≥2 (%) | 0.2 [0-0.33] | 0.25 [0-0.38] | 0.17 [0.03-0.20] | 0.194 |
| Anti-Xa activity | ||||
| Days with anti-Xa activity <0.2 UI/ml. (%) | 0 [0-0.13] | 0 [0-0.12] | 0.10 [0-0.16] | 0.224 |
| Days with anti-Xa activity ≥0.2 and < 0.5 UI/ml. (%) | 0.10 [0-0.29] | 0.10 [0-0.25] | 0.13 [0-0.36] | 0.654 |
| Days with anti-Xa activity ≥0.5 UI/ml. (%) | 0 [0-0] | 0 [0-0] | 0 [0-0] | 0.403 |
| Fibrinogen (g/L) | ||||
| Lowest fibrinogen level | 2.47 [1.74-3.1] | 2.02 [1.44-2.60] | 2.96 [2.44-3.35] | 0.006 |
| Highest fibrinogen level | 4.52 [3.88-6.01] | 4.01 [3.60-4.99] | 5.64 [4.52-6.47] | 0.011 |
| Days with fibrinogen < 2 g/L (%) | 0 [0-0.13] | 0 [0-0.25] | 0 [0 - 0.1] | 0.018 |
| Days with fibrinogen ≥ 2 and < 4 g/L (%) | 0.63 [0.37-0.86] | 0.75 [0.50-0.88] | 0.50 [0.27-0.67] | 0.051 |
| Days with fibrinogen ≥4 g/L (%) | 0.17 [0-0.58] | 0.11 [0-0.25] | 0.50 [0.33-0.67] | 0.005 |
| Platelets (Giga/Liter) | ||||
| Lowest platelet count | 82 [56.5-110] | 85 [60-132] | 80 [52-93] | 0.158 |
| Highest platelet count | 189 [159.5-258] | 226 [172-258] | 164 [131-231] | 0.048 |
| Days with platelets <150 (%) | 0.8 [0.58-0.88] | 0.75 [0.33-0.87] | 0.83 [0.71-1.00] | 0.039 |
| Days with platelets ≥ 150 và < 400 (%) | 0.2 [0.12-0.42] | 0.25 [0.12-0.67] | 0.17 [0.10-0.29] | 0.036 |
| Days with platelets ≥ 400(%) | 0 [0-0] | 0 [0-0] | 0 [0-0] | 0.707 |
Data are presented as the median (interquartile range) for nonparametric variables. aPTTr, ratio aPTT.
Table 3.
Multivariable analysis of factors associated with CaAT.
| Variable | aOR (95% CI) | p value |
|---|---|---|
| Highest fibrinogen level (every g/L) | 0.73 (0.39–1.35) | 0.317 |
| Days with fibrinogen ≥ 4 g/L (%) | 0.27 (0.01–7,02) | 0.434 |
| Flow rate of ECMO (100 ml/min) | 0.84 (0.73-0.95) | 0.008* |
CaAT, cannula-associated arterial thrombosis; g/L, gram/liter; ECMO, extracorporeal membrane oxygenation; aOR, adjusted odds ratio.
4. Discussion
Incidence of CaAT
The use of VA-ECMO for refractory cardiogenic shock has markedly increased over the last decade, but hemostatic dysfunction in ECMO supported patients remains a challenge for clinicians [9,19]. In particular, thrombosis complications after ECMO decannulation are still underdiagnosed [20]. The cannula-associated deep vein thrombosis (CaDVT) rate following ECMO cannula removal ranges from 18 to 85%, and risk factors for CaDVT have been reported [11,12,13,14]. However, the incidence of CaAT after VA-ECMO decannulation has not been clearly defined. Recent studies have shown that the incidence of CaAT ranges from 5% to 41.0% [15,16,18]. The different incidence rates of CaAT among studies depend on two main causes: (1) the difference in diagnostic techniques among studies, including Doppler vascular ultrasound, vascular CT scan, clinically demonstrated hypoperfusion, and surgical protocol records at the time of ECMO cannula removal, and (2) the different rate of thrombosis screening post-ECMO weaning among centers. Some centers investigate CaAT upon the suggestive clinical signs of limb hypoperfusion after cannula removal. Thrombosis is identified less frequently by Doppler vascular ultrasound or clinical signs of hypoperfusion than by surgical/autopsied visualization, and the underestimation of arterial thromboembolic events can occur in more than 25% of patients [9,20]. In recent reports, Doppler vascular ultrasound or CT scan of blood vessels was used to screen for CaAT when symptoms and signs of limb ischemia appeared, leading to a relatively low rate of CaAT of 5-12.5% [18,21]. In contrast, Cartwright et al. reported that routine arterial thrombosis screening by Doppler vascular ultrasound can detect CaAT in up to 41% of patients after cannula removal [16]. In this study, a higher rate of CaAT (61.7%) was found compared to other studies [15,16,17,18]. Surgical vascular closure was performed in the operating room for up to 44.6% of patients undergoing cannula removal. Vascular surgeons routinely used a Fogarty catheter to screen for thrombosis during the operation, which may explain the higher rate of thrombosis detection. All patients whose cannulas were removed by percutaneous vascular closure with Proglide devices (Abbott Vascular) were routinely screened by vascular Doppler ultrasound for thrombosis, which also explains the high rate of CaAT in this study. Furthermore, a distal perfusion cannula, which is a common place for thrombus formation, was routinely inserted in our ECMO center.
The arterial cannula inserted from the common femoral artery and the distal perfusion cannula inserted from the superficial femoral artery create a low-flow or absent flow space between them (Figure 1). Low-flow or absent flow at this space of the femoral artery leads to an extremely high risk of thrombus formation. This may explain why some clinicians favor surgical decannulation over percutaneous decannulation to remove thrombi [9]. In our center, a distal perfusion cannula is routinely inserted for patients supported by VA-ECMO. Therefore, the most common sites of CaAT were the superficial and common femoral arteries, with thrombosis rates of 51.7% and 20.6%, respectively. Although the incidence of CaAT was high, only 17.2% of patients in this group had limb ischemia complications. The routine use of a Fogarty catheter at surgical vascular closure, daily Doppler vascular ultrasound and appropriate heparin dosing after decannulation can explain the low incidence of limb ischemia. Furthermore, based on the principle of "less is more", our center tends to choose arterial cannulas with a small size of 15-17 Fr (92.5%) to minimize vascular wall damage and thrombus formation [5,6].
Risk factors for CaAT
VA-ECMO patients are subject to multiple complications that occur at various stages of ECMO support, and complications after decannulation are underdiagnosed [9,20]. Bidar et al. reported a rate of CaAT of 14% in patients with VA-ECMO postdecannulation who were screened by Doppler vascular ultrasound, although no risk factors were found [15]. To the best of our knowledge, the current literature suggests that no risk factor for CaAT has been reported [15,16,18]. We analyzed risk factors for CaAT to minimize the possibility of thrombosis formation. Univariate logistic regression analysis showed that the maximum fibrinogen concentration, number of days of fibrinogen > 4 g/dL, and ECMO flow rate were associated with CaAT. In multivariate logistic regression analysis, the ECMO flow rate was the only independent risk factor for CaAT. The ECMO flow rate is the velocity at which the ECMO system pumps blood into the patient's circulation through the arterial cannula. The higher the ECMO flow rate is set, the higher the blood flow through the low-flow space between the arterial cannula and the distal perfusion cannula, decreasing the possibility of blood clots. Moreover, the lower the ECMO flow rate is set, the more slowly the blood is pumped through the arterial cannula, resulting in reduced shear pressure and longer residence time around the artery cannula, leading to increased platelet adhesion and thrombus formation [2,22,23]. These changes may explain the increased cannula arterial thrombus formation in the low-flow state and warrant adequate anticoagulation during phases of low ECMO flow rates and weaning trials.
Several limitations of our study should be noted. First, our study was a retrospective study in a single center with a relatively small sample size. Second, some anti-Xa data were missing, so the complete assessment of anticoagulation during ECMO may not have been accurate. Third, arterial cannulas were removed either by the percutaneous vascular closure technique using Proglide devices (Abbott) at the bedside or by surgical vascular closure in the operating room. We did not have selection criteria for these procedures, and the decision depended on the skill of the attending doctor; therefore, the rate of arterial thrombosis could be underestimated in the percutaneous vascular closure group because of the lower sensitivity of vascular ultrasound in evaluating the femoral to iliac artery segment.
5. Conclusions
The incidence of cannula-associated arterial thrombosis after VA-ECMO support was 61.7%. Limb ischemia complications were common after decannulation and occurred in 17.2% of the patients with CaAT. Our study showed that a low ECMO flow rate was an independent risk factor for CaAT.
Author Contributions
Conceptualization, N.H.K.T., T.T.N.P., and X.T.P.; methodology, N.H.K.T., and Q.Q.M.D.; software, N.H.K.T, and T.M.N.; validation, N.H.K.T., L.T.T, and D.Q.H.; formal analysis, N.H.K.T., D.Q.H and T.A.M.;investigation, N.H.K.T., and L.T.T.; resources, T.T.N.P., and X.T.P.; data curation, N.HK.T.; writing—original draft preparation, N.HK.T., L.T.T, T.A.M., H.M.P., X.T.P., and T.T.N.P.; writing—review and editing, N.HK.T., B.X.N., H.M.P., T.A.M., X.T.P, and T.T.N.P; visualization, T.M.N., and L.T.T.; supervision, Q.Q.M.D.; project administration, T.M.N.; funding acquisition, B.X.N, and L.T.T. All authors have read and agreed to the published version of the manuscript.
Funding
This research received no external funding.
Institutional Review Board Statement
The study was conducted in accordance with the Declaration of Helsinki, and approved by the in Biomedical Research of the University of Medicine and Pharmacy at Ho Chi Minh City (No. 122/HDĐ-ĐHYD) on February 26, 2022.
Informed Consent Statement
Because this was a retrospective study, informed consent from the subjects was not mandated.
Data Availability Statement
The datasets used and/or analyzed during the current study are available from the corresponding author on reasonable request.
Acknowledgments
In this section, you can acknowledge any support given which is not covered by the author contribution or funding sections. This may include administrative and technical support, or donations in kind (e.g., materials used for experiments).
Conflicts of Interest
The authors declare no conflict of interest.
References
- Pineton de Chambrun M, Brechot N, Combes A. Venoarterial extracorporeal membrane oxygenation in cardiogenic shock: indications, mode of operation, and current evidence. Curr Opin Crit Care. Aug 2019;25(4):397-402. [CrossRef]
- Doyle AJ, Hunt BJ. Current understanding of how extracorporeal membrane oxygenators activate haemostasis and other blood components. Frontiers in medicine. 2018;5:352.
- Esper SA, Levy JH, Waters JH, et al. Extracorporeal membrane oxygenation in the adult: a review of anticoagulation monitoring and transfusion. Anesth Analg. Apr 2014;118(4):731-43. [CrossRef]
- Bonicolini E, Martucci G, Simons J, et al. Limb ischemia in peripheral veno-arterial extracorporeal membrane oxygenation: a narrative review of incidence, prevention, monitoring, and treatment. Critical Care. 2019;23(1):1-17.
- Bisdas T, Beutel G, Warnecke G, et al. Vascular complications in patients undergoing femoral cannulation for extracorporeal membrane oxygenation support. Ann Thorac Surg. Aug 2011;92(2):626-31. [CrossRef]
- Kim J, Cho YH, Sung K, et al. Impact of Cannula Size on Clinical Outcomes in Peripheral Venoarterial Extracorporeal Membrane Oxygenation. ASAIO J. Aug 2019;65(6):573-579. [CrossRef]
- Tanaka D, Hirose H, Cavarocchi N, et al. The Impact of Vascular Complications on Survival of Patients on Venoarterial Extracorporeal Membrane Oxygenation. Ann Thorac Surg. May 2016;101(5):1729-34. [CrossRef]
- Yen CC, Kao CH, Tsai CS, et al. Identifying the Risk Factor and Prevention of Limb Ischemia in Extracorporeal Membrane Oxygenation with Femoral Artery Cannulation. Heart Surg Forum. Jan 16 2018;21(1):E018-E022. [CrossRef]
- Lorusso R, Shekar K, MacLaren G, et al. ELSO interim guidelines for venoarterial extracorporeal membrane oxygenation in adult cardiac patients. Asaio Journal. 2021;67(8):827-844.
- Sulimov DS, Markuske M, Desch S, et al. Management of dead space thrombosis during decannulation of peripherally inserted venoarterial extracorporeal membrane oxygenation. Catheterization and Cardiovascular Interventions. 2021;98(1):E122-E123.
- Cooper E, Burns J, Retter A, et al. Prevalence of Venous Thrombosis Following Venovenous Extracorporeal Membrane Oxygenation in Patients With Severe Respiratory Failure. Crit Care Med. Dec 2015;43(12):e581-4. [CrossRef]
- Fisser C, Reichenbacher C, Muller T, et al. Incidence and Risk Factors for Cannula-Related Venous Thrombosis After Venovenous Extracorporeal Membrane Oxygenation in Adult Patients With Acute Respiratory Failure. Crit Care Med. Apr 2019;47(4):e332-e339. [CrossRef]
- Menaker J, Tabatabai A, Rector R, et al. Incidence of Cannula-Associated Deep Vein Thrombosis After Veno-Venous Extracorporeal Membrane Oxygenation. ASAIO J. Sep/Oct 2017;63(5):588-591. [CrossRef]
- Parzy G, Daviet F, Persico N, et al. Prevalence and risk factors for thrombotic complications following venovenous extracorporeal membrane oxygenation: a CT scan study. Critical Care Medicine. 2020;48(2):192-199.
- Bidar F, Lancelot A, Lebreton G, et al. Venous or arterial thromboses after venoarterial extracorporeal membrane oxygenation support: Frequency and risk factors. J Heart Lung Transplant. Apr 2021;40(4):307-315. [CrossRef]
- Cartwright B, Bruce HM, Kershaw G, et al. Hemostasis, coagulation and thrombin in venoarterial and venovenous extracorporeal membrane oxygenation: the HECTIC study. Sci Rep. Apr 12 2021;11(1):7975. [CrossRef]
- Kohs TCL, Liu P, Raghunathan V, et al. Severe thrombocytopenia in adults undergoing extracorporeal membrane oxygenation is predictive of thrombosis. Platelets. May 19 2022;33(4):570-576. [CrossRef]
- Lamarche Y, Chow B, Bedard A, et al. Thromboembolic events in patients on extracorporeal membrane oxygenation without anticoagulation. Innovations (Phila). Nov 2010;5(6):424-9. [CrossRef]
- Thiagarajan RR, Barbaro RP, Rycus PT, et al. Extracorporeal life support organization registry international report 2016. ASAIO journal. 2017;63(1):60-67.
- Rastan A, Lachmann N, Walther T, et al. Autopsy findings in patients on postcardiotomy extracorporeal membrane oxygenation (ECMO). The International journal of artificial organs. 2006;29(12):1121-1131.
- Sertic F, Chavez L, Diagne D, et al. Predictors of in-hospital mortality and midterm outcomes of patients successfully weaned from venoarterial extracorporeal membrane oxygenation. J Thorac Cardiovasc Surg. Feb 2021;161(2):666-678 e3. [CrossRef]
- Fuchs G, Berg N, Eriksson A, et al. Detection of Thrombosis in the Extracorporeal Membrane Oxygenation Circuit by Infrasound: Proof of Concept. Artif Organs. Jun 2017;41(6):573-579. [CrossRef]
- Fraser KH, Zhang T, Taskin ME, et al. Computational fluid dynamics analysis of thrombosis potential in left ventricular assist device drainage cannulae. ASAIO J. May-Jun 2010;56(3):157-63. [CrossRef]
Figure 1.
Position of thrombus formation in the low-flow space.
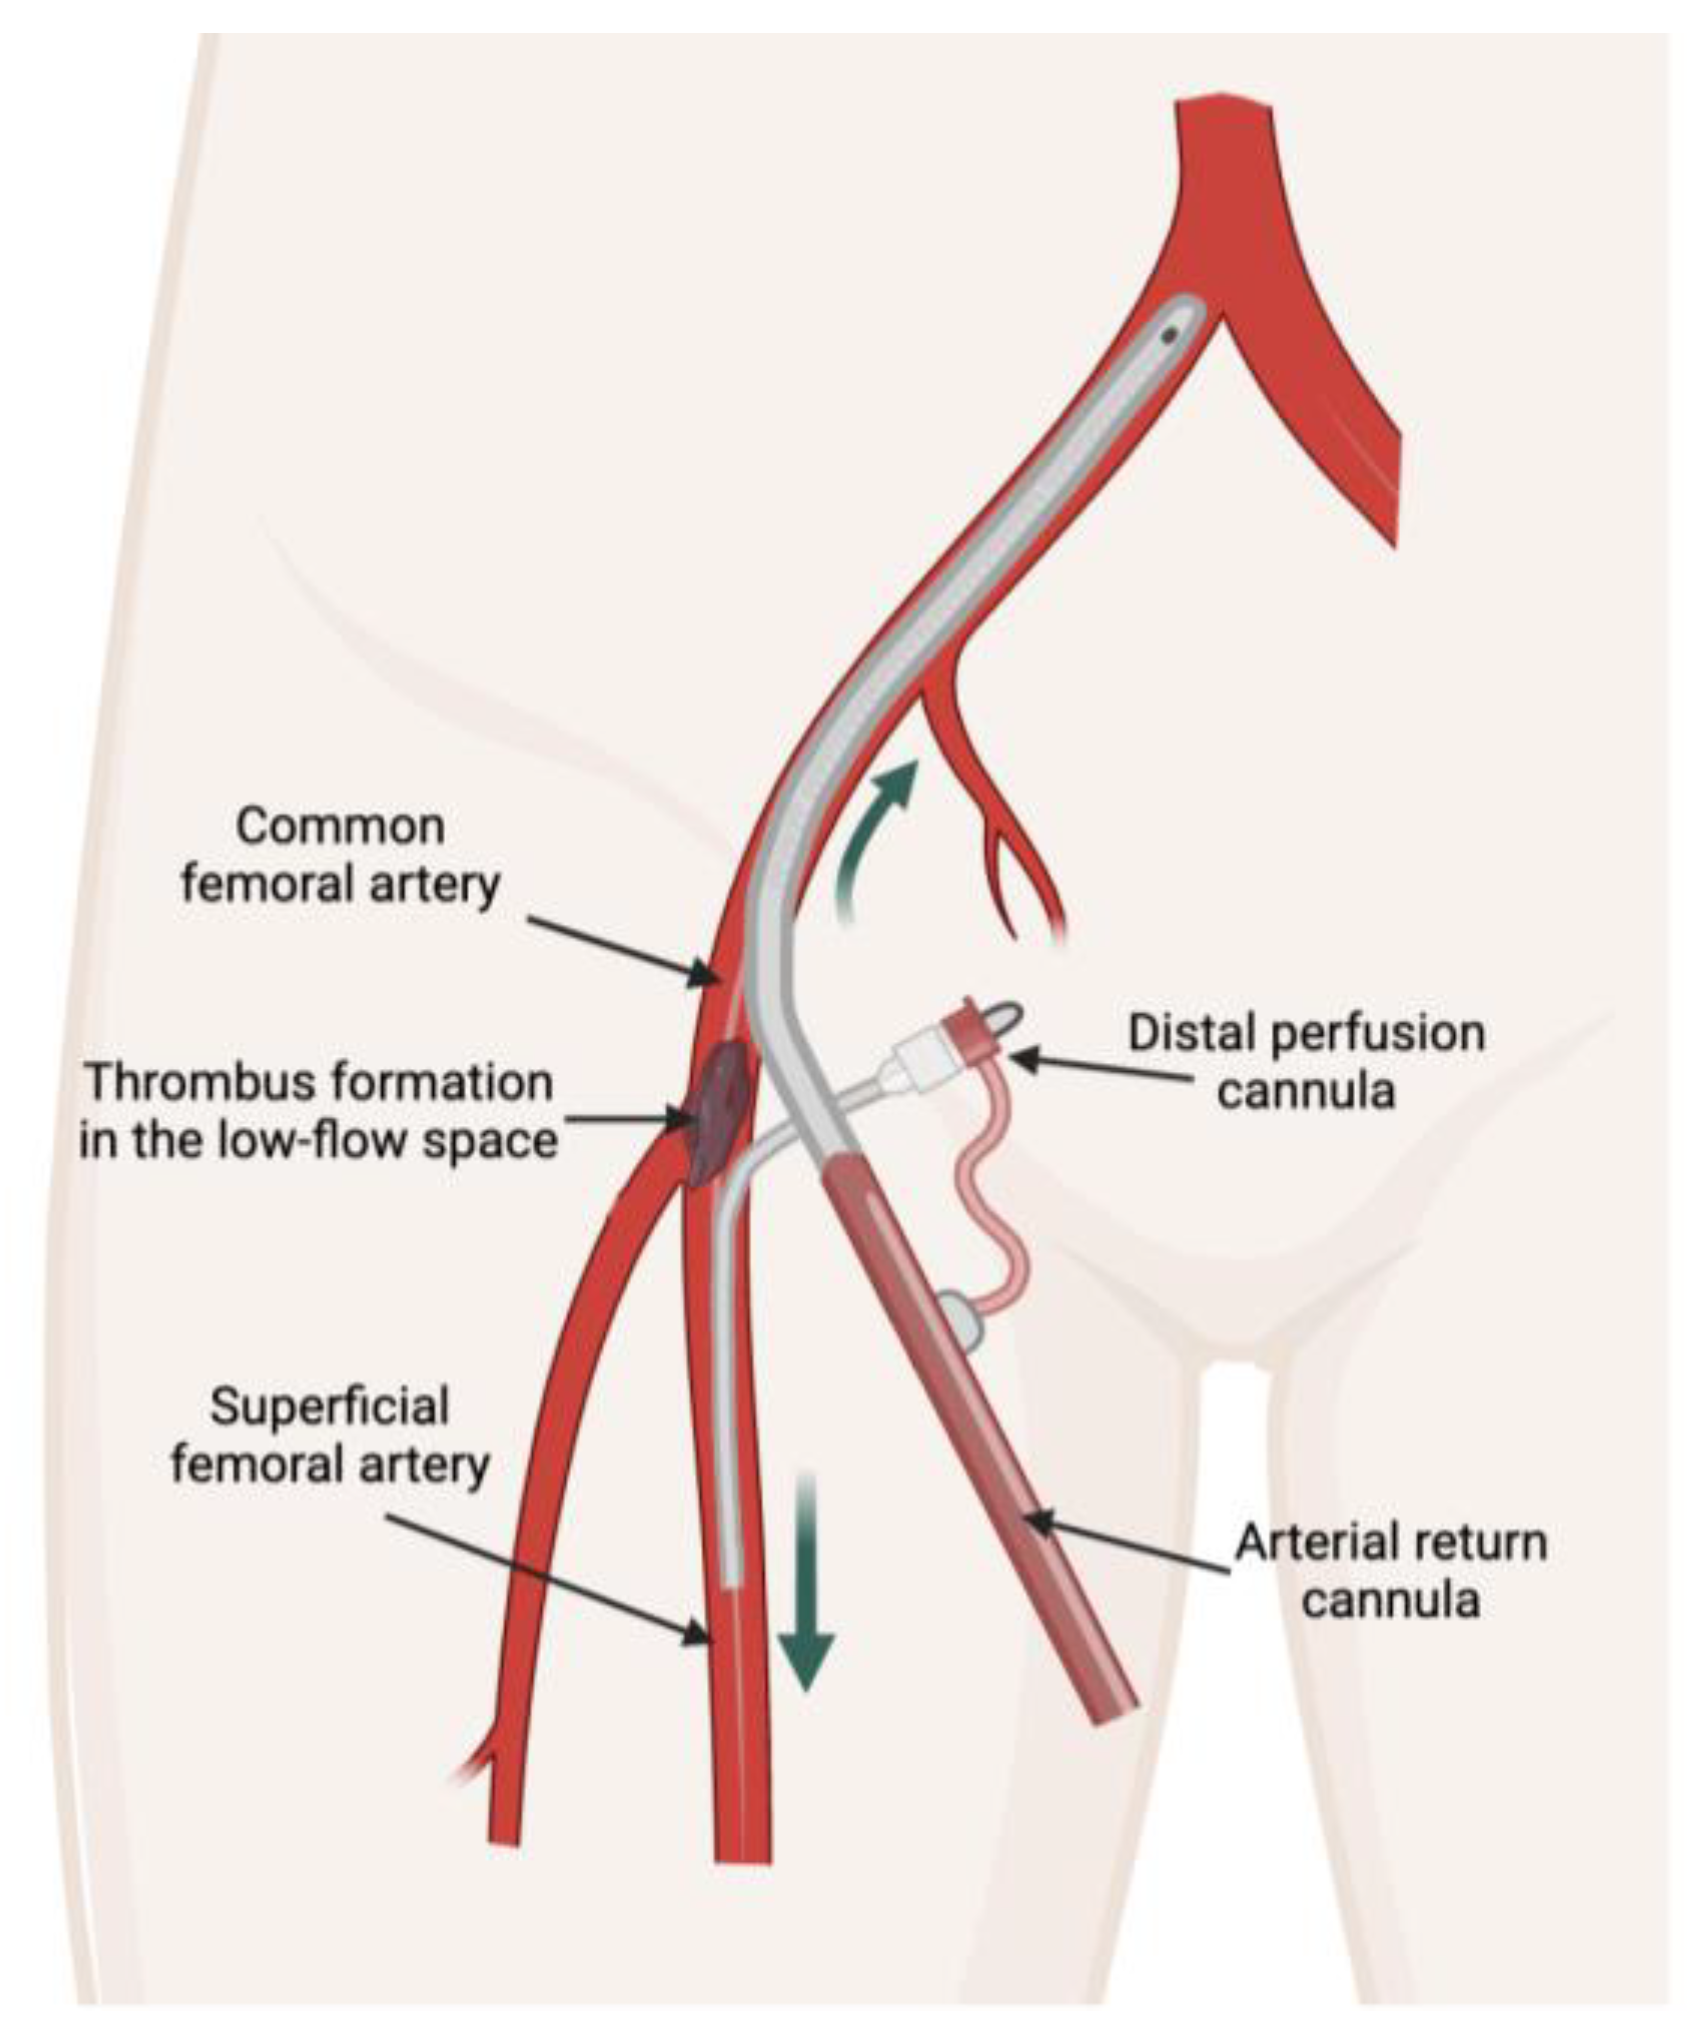
Figure 2.
Flowchart of patient inclusion. VA, arteriovenous; ECMO, extracorporeal membrane oxygenation; CaAT, cannula-associated arterial thrombosis.
Figure 2.
Flowchart of patient inclusion. VA, arteriovenous; ECMO, extracorporeal membrane oxygenation; CaAT, cannula-associated arterial thrombosis.
Disclaimer/Publisher’s Note: The statements, opinions and data contained in all publications are solely those of the individual author(s) and contributor(s) and not of MDPI and/or the editor(s). MDPI and/or the editor(s) disclaim responsibility for any injury to people or property resulting from any ideas, methods, instructions or products referred to in the content. |
© 2023 by the authors. Licensee MDPI, Basel, Switzerland. This article is an open access article distributed under the terms and conditions of the Creative Commons Attribution (CC BY) license (http://creativecommons.org/licenses/by/4.0/).
Copyright: This open access article is published under a Creative Commons CC BY 4.0 license, which permit the free download, distribution, and reuse, provided that the author and preprint are cited in any reuse.


