Submitted:
07 January 2023
Posted:
09 January 2023
You are already at the latest version
Abstract
This paper presents a simple drone survey and image processing approach to identifying St. John's wort (Hypericum perforatum) on grazing land in the Hunter Valley NSW, Australia. St John’s wort is an invasive species (weed) that competes with pasture, poisons livestock, can downgrade wool with ‘vegetable fault’, and decreases property values. Identifying the locations of St John wort from the ground can be difficult due to topography, limited access, and/or larger land areas of mixed vegetation. In this study, a drone was used to survey a 174-ha grazing property in the Hunter Valley NSW (Australia). The images were stitched together using commercially available software. A unique Visual Atmospheric Resistance Index (VARI) attribute was identified and used to highlight the presence of St John’s wort in the survey area. These sub-areas were then digitised onto high resolution maps for future planning use by land managers.
Keywords:
drone surveys
; weed management
; weed mapping
; VARI
; St John’s wort
1. Introduction
St John’s wort, shown in Figure 1, is an invasive species (weed) that competes with pasture, poisons livestock, can downgrade wool with ‘vegetable fault’, and decreases property values [1].
Management of St John’s wort relies on knowing where it is and preparing a suitable eradication approach. Current approaches to detecting St John’s wort typically rely on manual observations and ‘ground-truthing’, which can be labour intensive and time consuming, particularly over difficult topography, areas with limited traffic access, and/or large areas with mixed vegetation (forest, pasture, etc).
Previous studies have used small drones for weed mapping purposes, including in oat fields in Croatia [2], for mapping weeds (Alopecurus myosuroides) at field scales [3], undertaking spatial distribution assessments of the invasive alien species Amorpha fruticosa L. in Serbia [4], estimating maize seedling numbers [5] as well as broader review articles on drone technology in agriculture [6] and use of drones for remote sensing of river corridors [7].
In this study, a small, relatively inexpensive drone (DJI Mavic 2 Pro) was used to survey an area with the aim of identifying St John’s wort. Camera sensor technology, such as multispectral and LIDAR, can be expensive, so this study used the proprietary red-green-blue (RGB) camera that comes with the DJI Mavic 2 Pro. The survey undertaken in the Hunter Valley NSW (near Muswellbrook) used a flight plan which was established using a commercial software application (DroneDeploy), as this provided an autonomous flight path at a given altitude, with suitable image overlap to produce a high-resolution image. Figure 2 provides the location of the site surveyed for this study.
The Visual Atmospheric Resistance Index (VARI) is just one of the many vegetation indices widely applied for monitoring vegetation dynamics at regional and global scales [8,9,10]. The VARI is produced entirely in the visible region of the spectrum using the three visible channels of red (R, 564–580 nm), green (G, 534–545 nm), and blue (B, 420–440 nm) using the algorithm [11]:
(𝐆reen−𝐑ed)/(𝐆reen+𝐑ed−𝐁lue)
This study applied VARI to a field-scale situation and hypothesised that the “yellow colour” of the flowering St John’s wort would provide a differential attribute that could be considered unique and representative of the target species. A unique VARI attribute was identified in the orthomosaic image and was used to highlight the presence of St John’s wort in the survey area. Areas identified as St John’s wort were then digitised onto high resolution maps for future planning use by land managers.
2. Materials and Methods
The survey was undertaken using a Mavic 2 Pro (https://www.dji.com/au/mavic-2/info#specs) and the flight used the commercial software (as an app) DroneDeploy. The flight path is shown in Figure 3. Each image in the survey had a 75% front-overlap and a 65% side-overlap with the adjacent images to produce the final orthomosaic map. The flight was undertaken in early December 2022 on a day with scattered cloud. Flight altitude was 400 ft (120 m) which provided an image resolution of 2.7 cm/pixel.
Once the survey was complete, over 1,300 images were uploaded to DroneDeploy for processing. This included stitching all images together to create one orthomosaic image. This image was further processed using VARI algorithms contained in DroneDeploy. Final image outputs included a high-resolution orthomosaic image, a raw VARI image from the original orthomosaic image, and a VARI image configured to highlight St John’s wort.
3. Results
3.1. Orthomosaic image
The orthomosaic image is shown in Figure 4 and the inset is shown in Figure 5. Figure 4 shows the 174-ha surveyed, and in some areas the St John’s wort can be seen as yellow clusters with the naked eye. However, delineating these areas is difficult, and likely unreliable, at this map scale. Figure 5 shows a smaller area (panned-in inset) that reveals greater detail and where smaller clusters of St John’s wort can also be identified by eye.
3.2. Raw VARI image from original orthomosaic image
Figure 6 shows the VARI which ranged from -0.49 to 0. The inset is shown in Figure 7. In Figure 7, the dark red areas contain St John’s wort amongst other grasses, shrubs and small trees. Significant background ‘noise’ (as scatter of blue light) masks the actual locations of St John’s wort, therefore further image processing is required.
3.3. VARI image configured to highlight St John’s wort
Figure 6 was configured by narrowing the VARI to between -0.46 and -0.43 and this is shown in Figure 8. Narrowing the VARI significantly reduced the scatter of blue light and provided a much-improved map of the areas with St John’s wort. The inset is shown in Figure 9.
Figure 10 shows the final map submitted to be used by the land managers of this site. The high-resolution orthomosaic image (Figure 4) was utilised to ground-truth the configured VARI image shown in Figure 10. Note that all maps and annotations can be exported from DroneDeploy in many formats for use in a range of GIS platforms.
4. Discussion
This study summarises a simple approach to detecting St John’s wort using a relatively inexpensive drone with RGB camera and using VARI to highlight significant clusters. This could potentially be an effective approach for many rural landholders and land managers who don’t have access to expensive satellite images/data, multi-spectral cameras, and/or LIDAR.
The approach undertaken in this paper was similar to that described in many similar studies [2,3,6,11] where images are obtained (by drone), creation of an orthomosaic image is undertaken (various commercial software available), a vegetation index applied to obtain relative reflectance within that image, and then interpreted based on the known attributes (shape, colour, height, etc) to highlight the extent/change in vegetation.
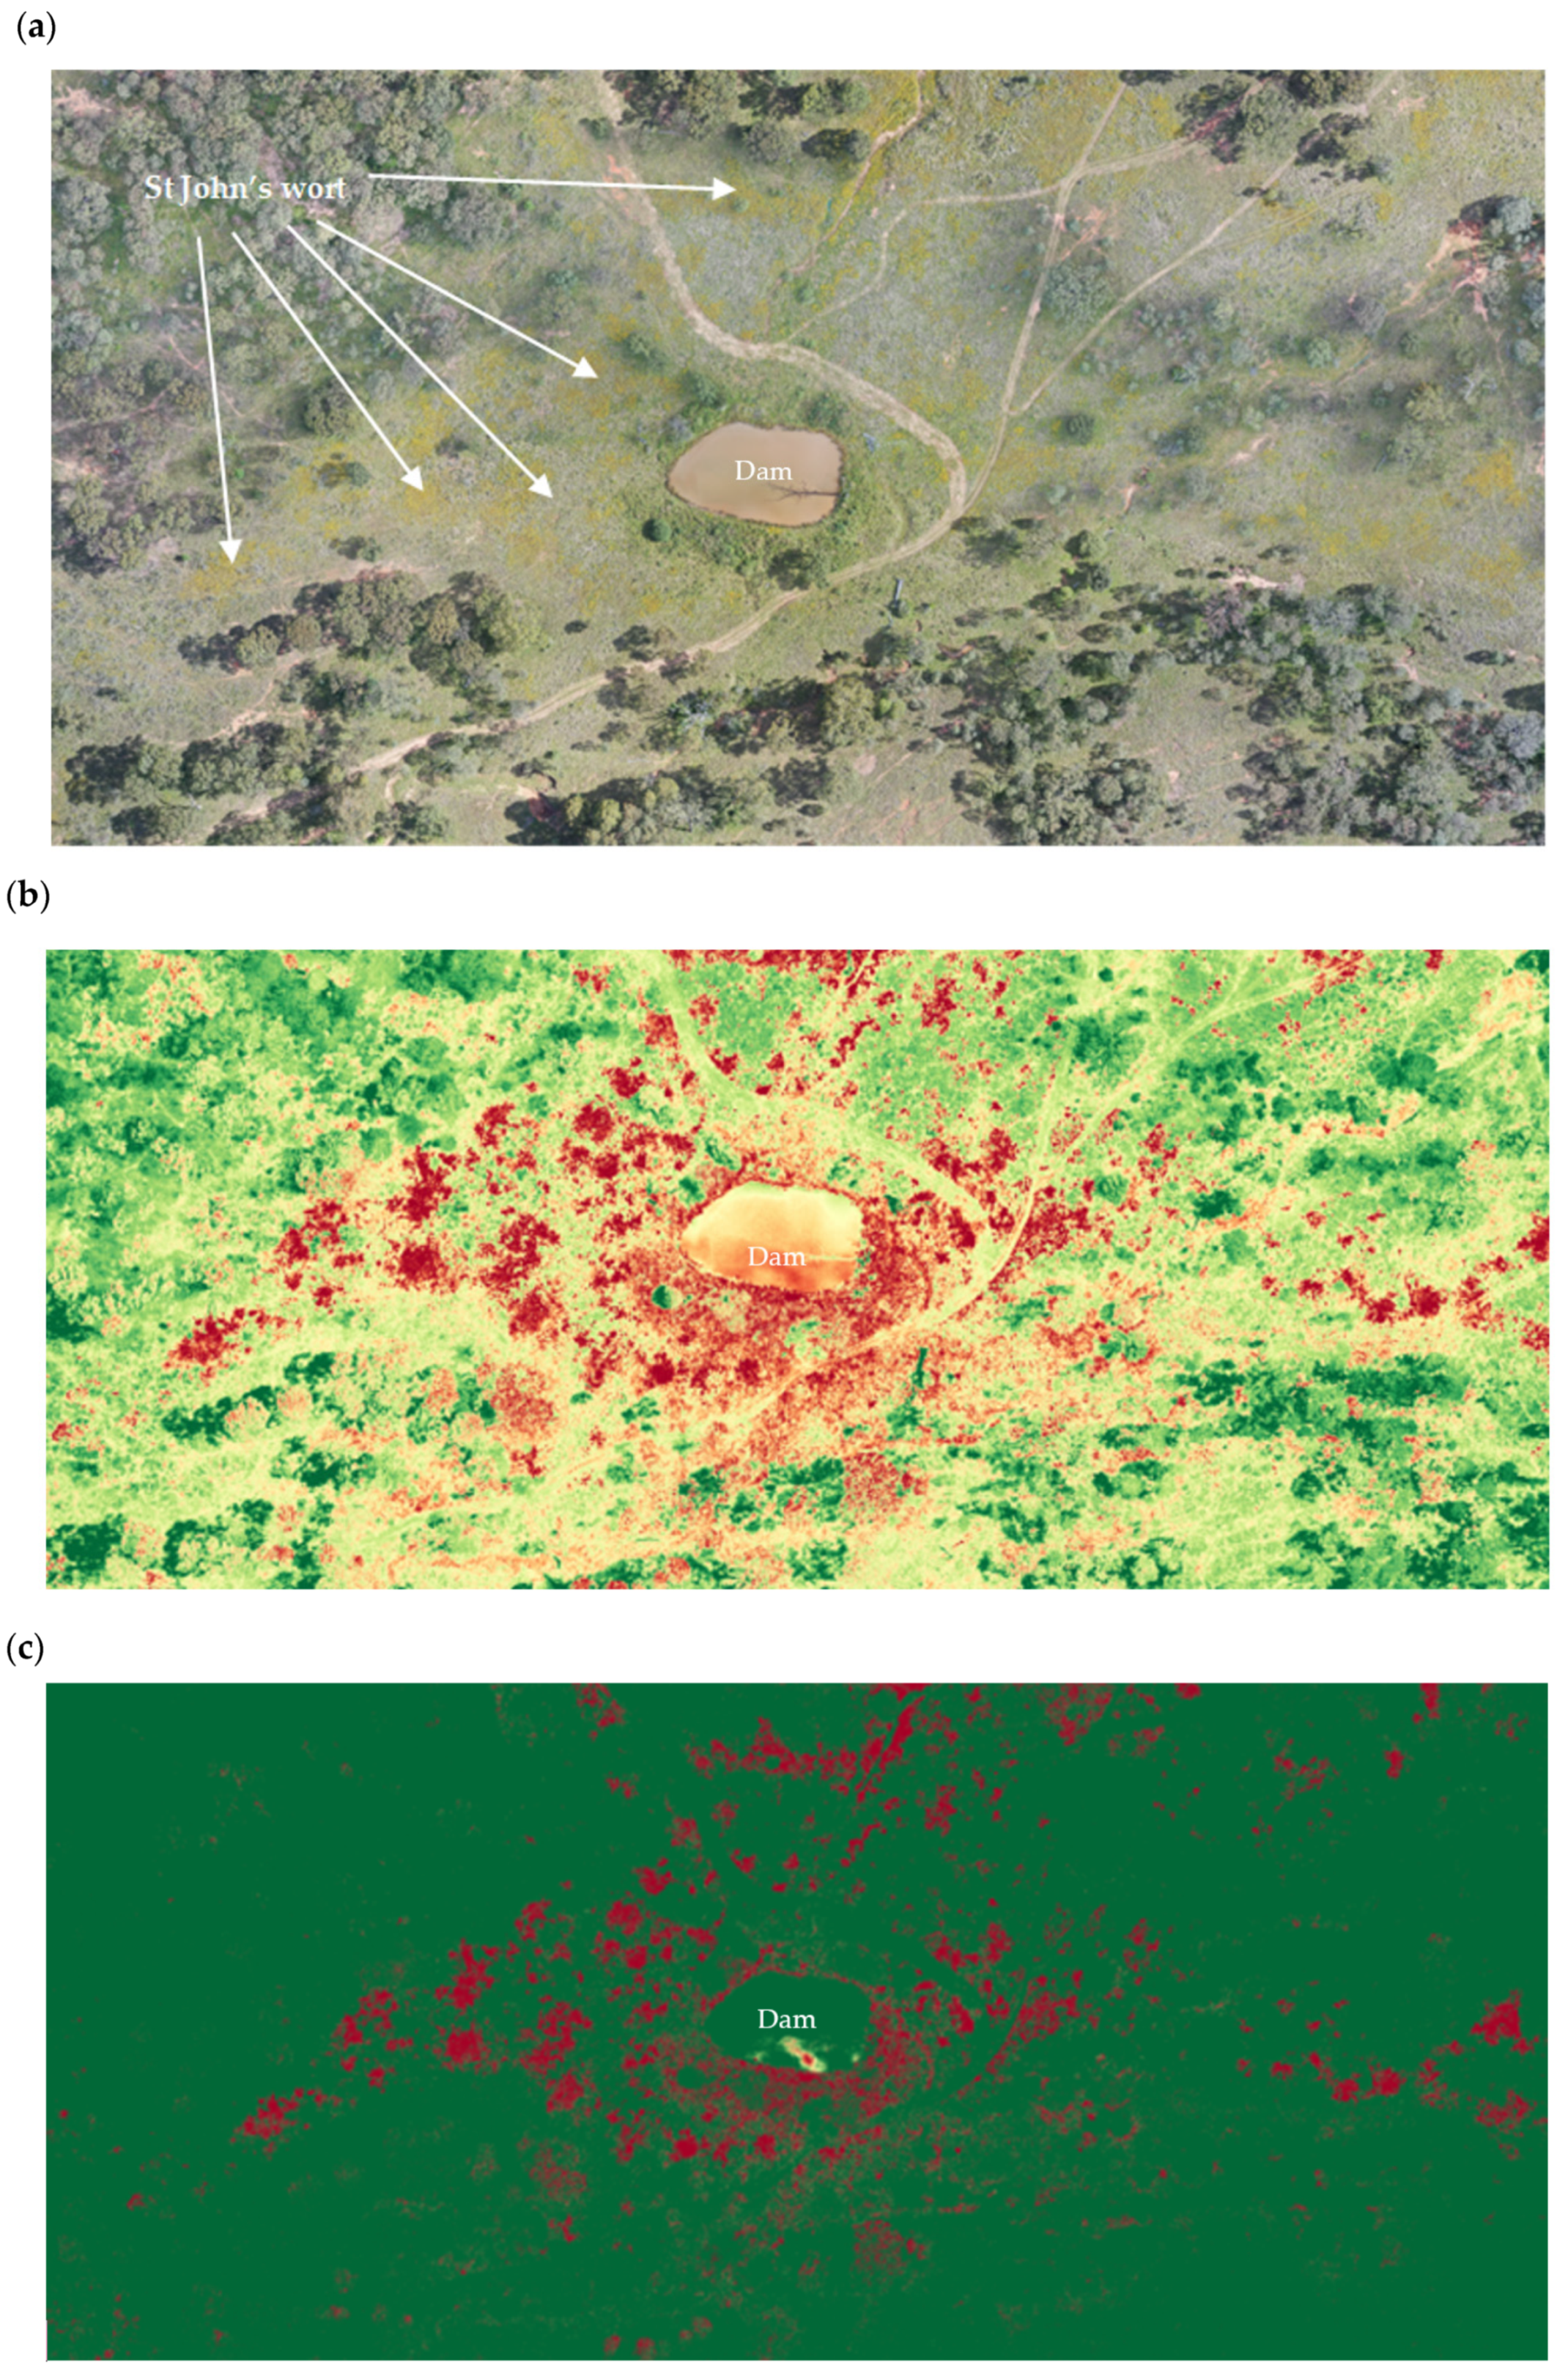
The reliability of the simple approach from this study is best shown in the comparison of Figure 5, Figure 7, and Figure 9, shown below in Figure 11. Figure 11a shows the visible St John’s wort (yellow colour). The VARI shows a contrast between relative ‘greeness’ in Figure 11b, as the red areas contain St John’s wort (but other grasses, trees, shrubs too). Figure 11c provides an improved interpretation by highlighting predominantly St. John’s wort based on narrowing the VARI between -0.46 and -0.43.
While the high-resolution images (2.7 cm/pixel) obtained from the drone survey provide images that were not designed for the VARI, it has been demonstrated that if the target species (St John’s wort) can be easily identified by colour with a relatively unique index, then the configured VARI image can reliably identify the extent of the target species from a high-resolution image.
The drone survey was undertaken in early summer when St John’s wort was in flower and the yellow colour proved to be an attribute that differentiated between other vegetation. From a distance, St John’s wort appears yellow from November to January; dark green, brown, and yellow from February to April; and brownish-red in winter [1]. The dependence on the yellow colour suggests that November to January is the best time to survey and identify St John’s wort.
Future research direction will look to develop a ‘library’ of target species with respect to vegetation indices, which will improve image processing and vegetation mapping approaches over a range of smaller scale land uses.
Author Contributions
The author undertook all aspects of this study and the writing of this communication.
Funding
This research was externally funded by Mach Energy (Mt Pleasant Operations).
Data Availability Statement
Data is contained within the article or supplementary materialThe data presented in this study is available by contacting the author.
Acknowledgments
The author acknowledges Richard Ali and Sandy Lettice from Mach Energy who provided boundary maps, information of existing drone operations, site information, and general access.
Conflicts of Interest
The author declares no conflict of interest. The funders had no role in the design of the study (apart from providing the site); in the collection, analyses, or interpretation of data; in the writing of the manuscript; or in the decision to publish the results.
References
- DPI, NSW Weed Wise, 2023. Available online: https://weeds.dpi.nsw.gov.au/weeds/details/135.
- Gašparovića, M.; Zrinjskib, M.; Barkovićc, D.; Radočajd, D. An automatic method for weed mapping in oat fields based on UAV imagery. Comp and Electronics Ag. 2020, 173. [Google Scholar] [CrossRef]
- Lambert, J.P.T.; Hicks, H.L.; Childs, D.Z.; Freckleton, R.P. Evaluating the potential of Unmanned Aerial Systems for mapping weeds at field scales: a case study with Alopecurus myosuroides. Weed Research 2017. [Google Scholar] [CrossRef] [PubMed]
- Grabić, J.; Benka, P.; Ljevnaić-Mašić, B. ; et al. Spatial distribution assessment of invasive alien species Amorpha fruticosa L. by UAV-based on remote sensing in the Special Nature Reserve Obedska Bara, Serbia. Environ Monit, Assess, 2022; 194, 599, https://doi-org.ezproxy.newcastle.edu.au/10.1007/s10661-022-10273-8. [Google Scholar]
- Liu, S.; Yin, D.; Feng, H. ; et al. Estimating maize seedling number with UAV RGB images and advanced image processing methods. Precision Agric, 2022; 23, 1604–1632, https://doi-org.ezproxy.newcastle.edu.au/10.1007/s11119-022-09899-y. [Google Scholar]
- Zhang, C.; Kovacs, J.M. The application of small unmanned aerial systems for precision agriculture: a review. Precision Agriculture 2012, 13, 694–712. [Google Scholar] [CrossRef]
- Tomsett, C.; Leyland, J. Remote sensing of river corridors: A review of current trends and future directions. River Res Applic. 2019, 35, 779–803. [Google Scholar] [CrossRef]
- Muhsoni, F.F.; Sambah, A.B. Mahmudi, M.; Wiadnya, D.G.R.; Comparison of Different Vegetation Indices For Assessing Mangrove Density Using Sentinel-2 Imagery. International Journal of GEOMATE 2018, 14, 42–51. [Google Scholar] [CrossRef]
- Choubin, B.; Soleimani, F.; Pirnia, A.; Sajedi-Hosseini, F.; Alilou, H.; Rahmati, O.; Melesse, A.M.; Singh, V.P.; Shahabi, H. Chapter 17 - Effects of drought on vegetative cover changes: Investigating spatiotemporal patterns, Assefa, M. Melesse, Wossenu, Abtew, Gabriel, Senay, Eds.; Extreme Hydrology and Climate Variability; Elsevier,2019; pp. 213–222, ISBN 9780128159989.
- Jayakumar Drisya, J. Sathish Kumar D, Roshni, T. Chapter 27 - Spatiotemporal Variability of Soil Moisture and Drought Estimation Using a Distributed Hydrological Model. Samui, P., Kim, D., Ghosh, C., Eds.; Integrating Disaster Science and Management; Elsevier, 2018; pp. 451–460, ISBN 9780128120569.
- Megat Mohamed Nazir, M.N.; Terhem, R.; Norhisham, A.R.; Mohd Razali, S.; Meder, R. Early Monitoring of Health Status of Plantation-Grown Eucalyptus pellita at Large Spatial Scale via Visible Spectrum Imaging of Canopy Foliage Using Unmanned Aerial Vehicles. Forests. 2021, 12, 1393. [Google Scholar] [CrossRef]
Figure 1.
St John’s wort plant with yellow flowers and small green leaves.
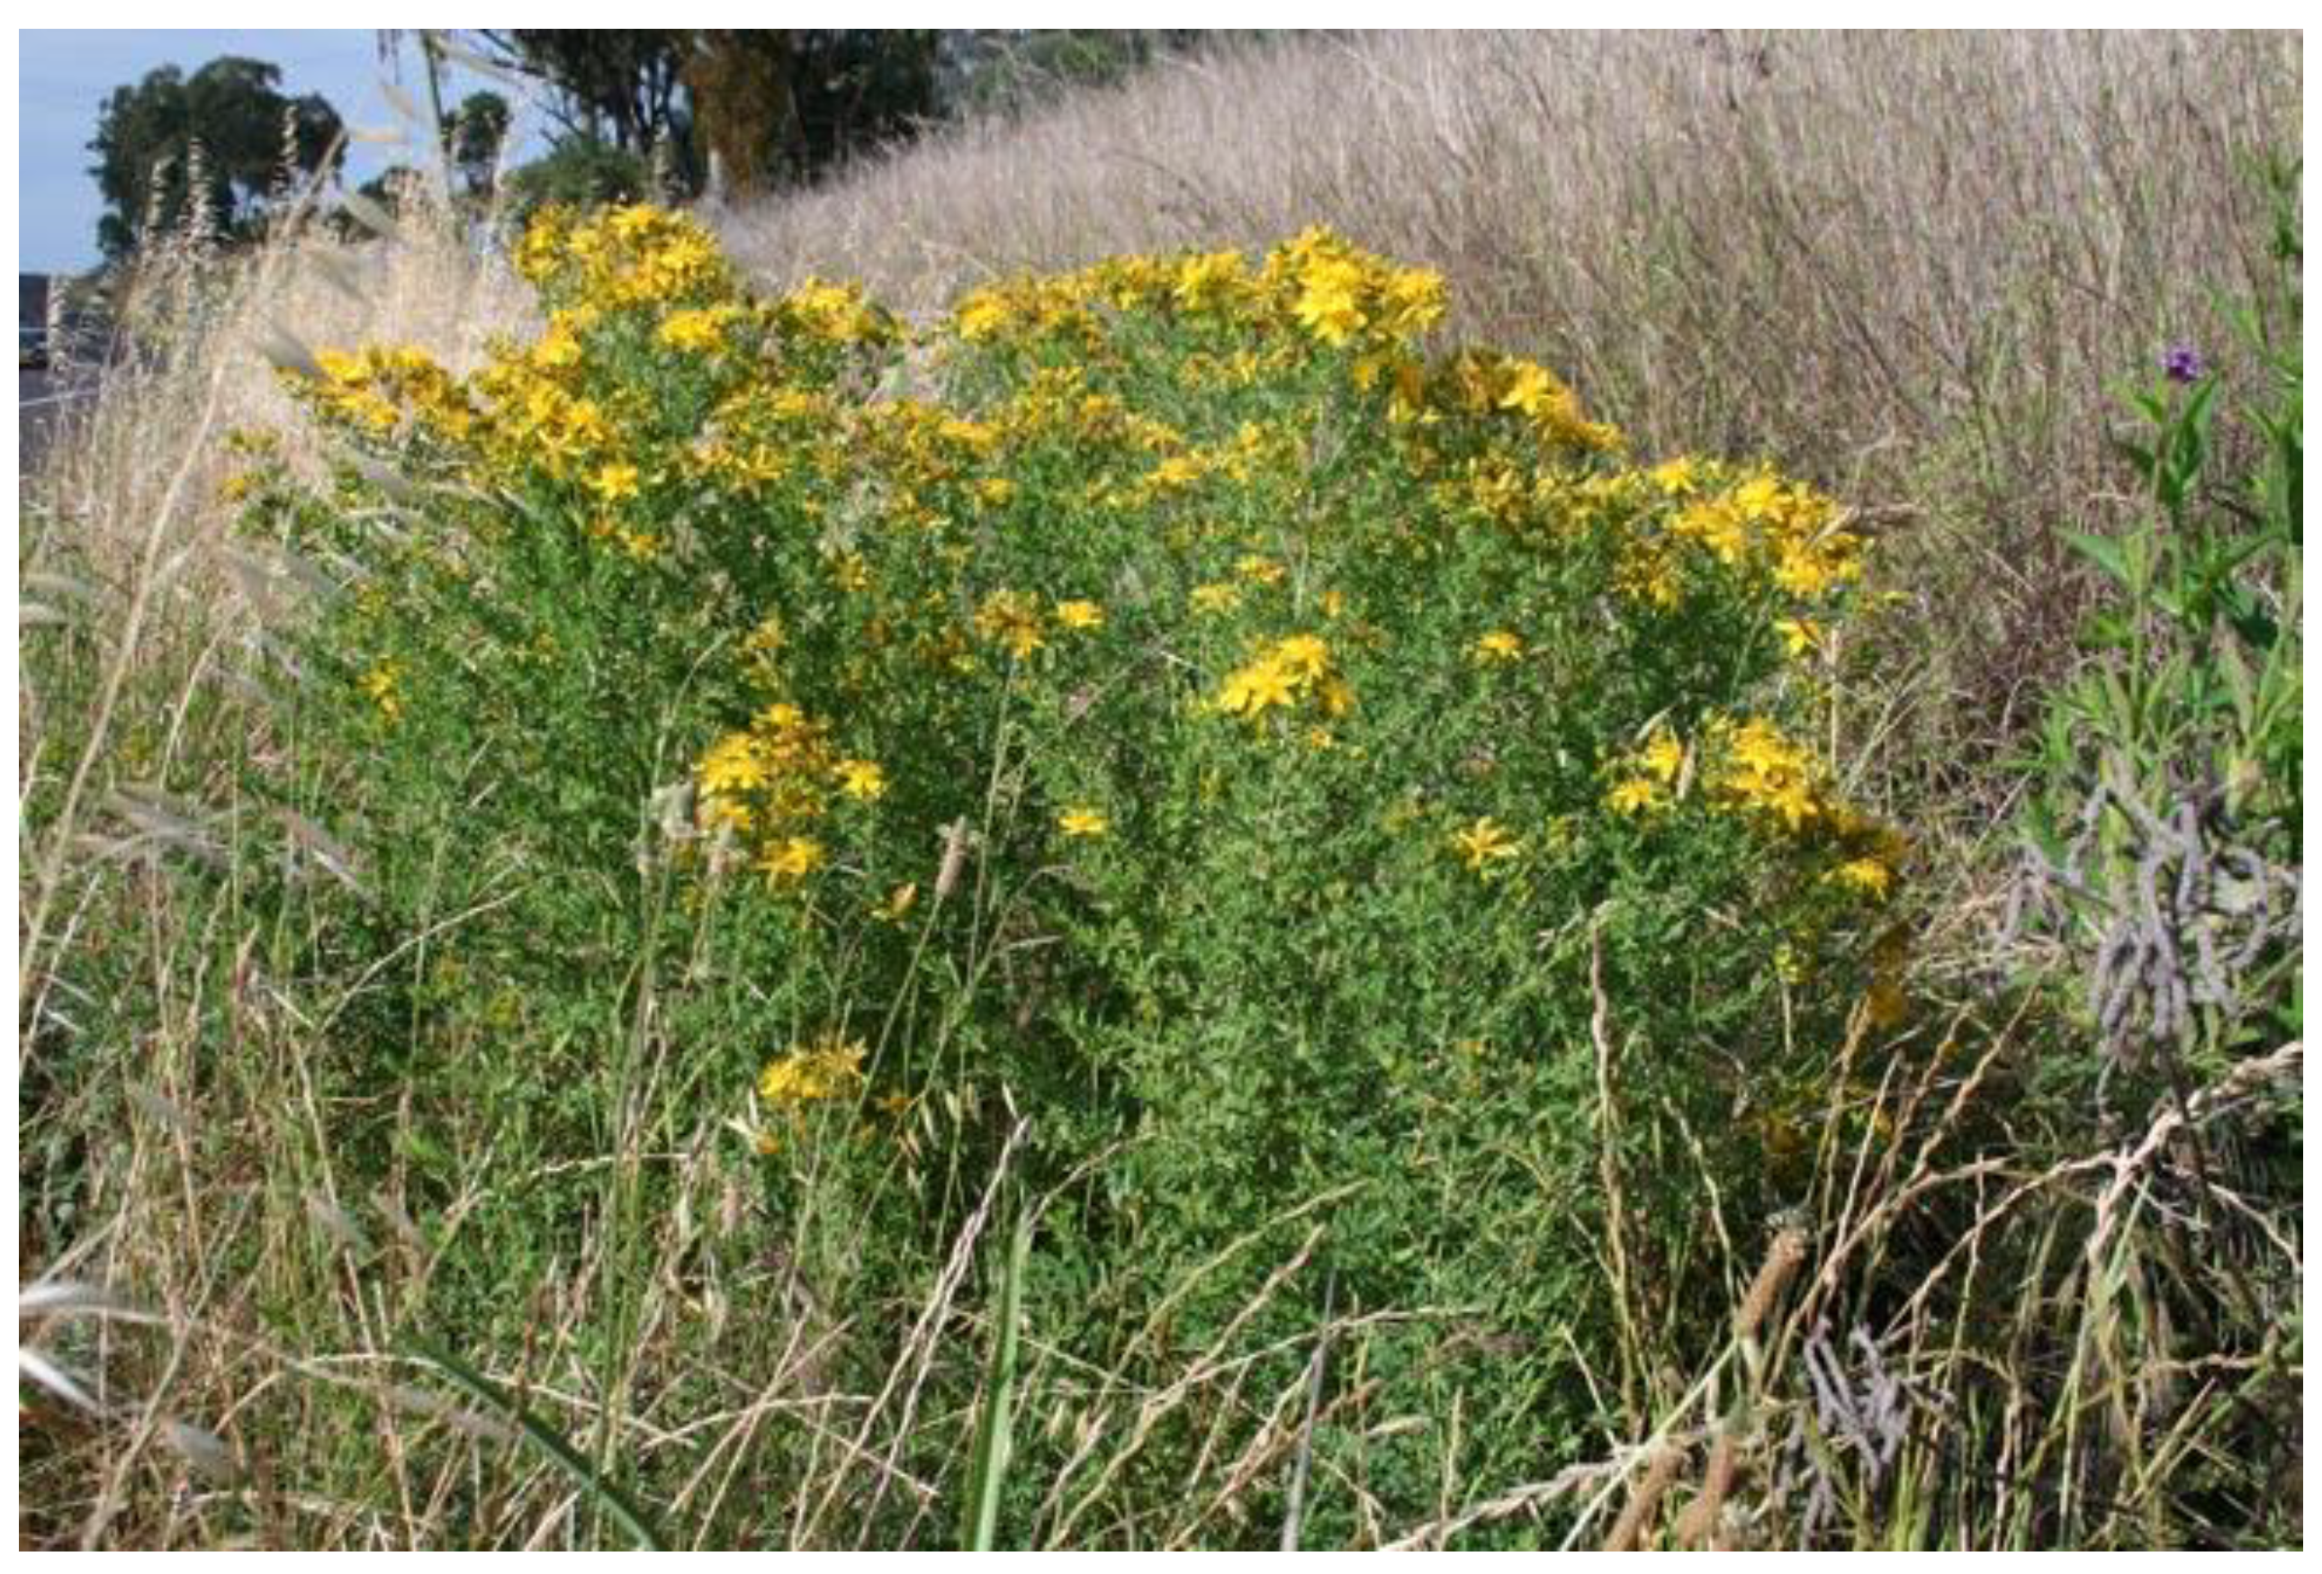
Figure 2.
Location of survey site (NSW, Australia).
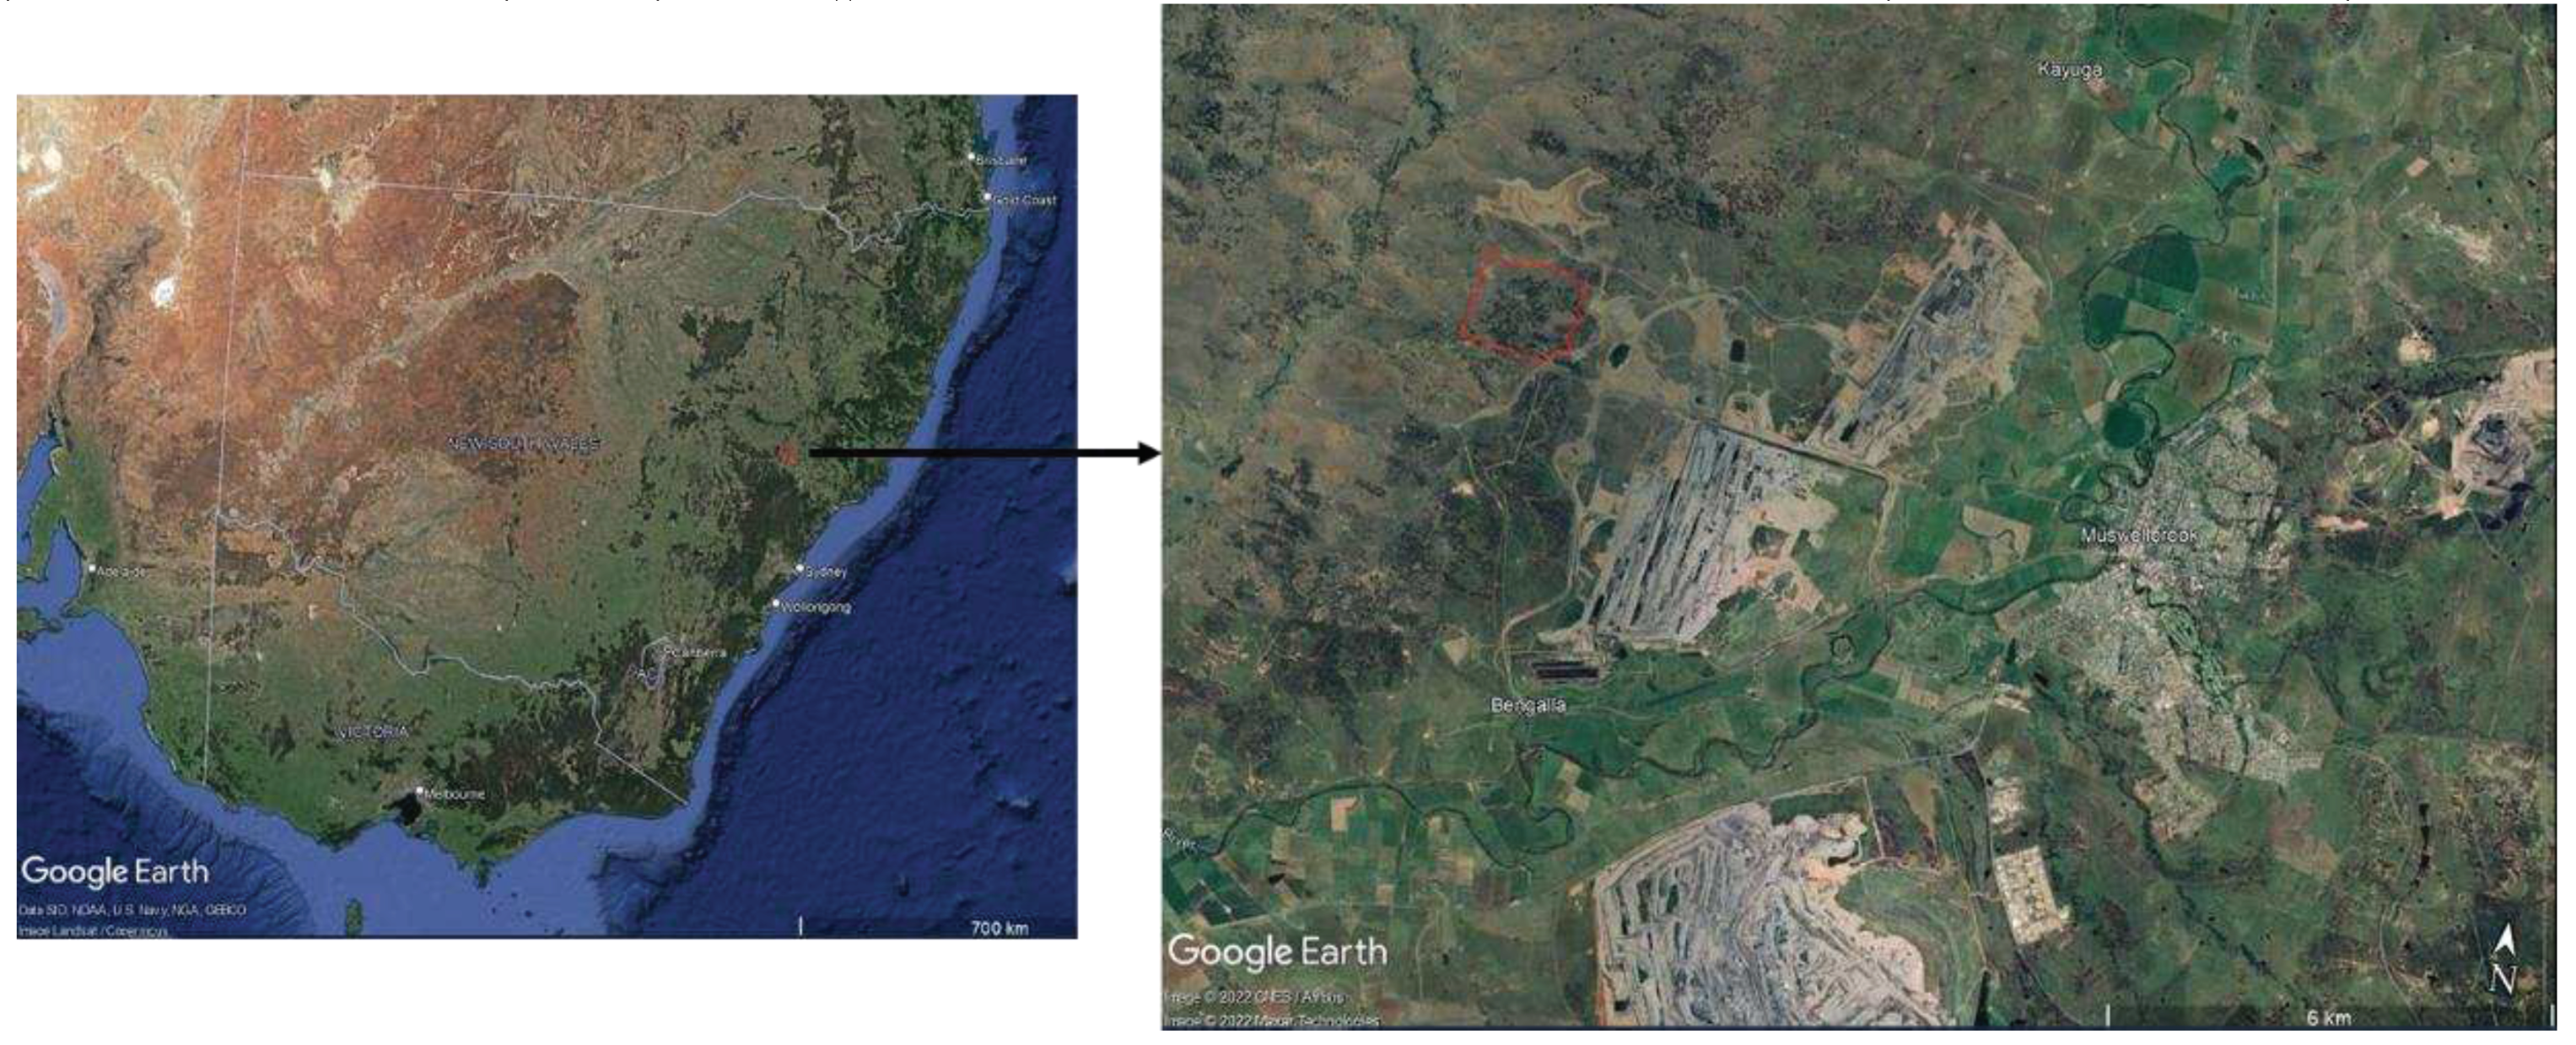
Figure 3.
Flight plan details configured in DroneDeploy.
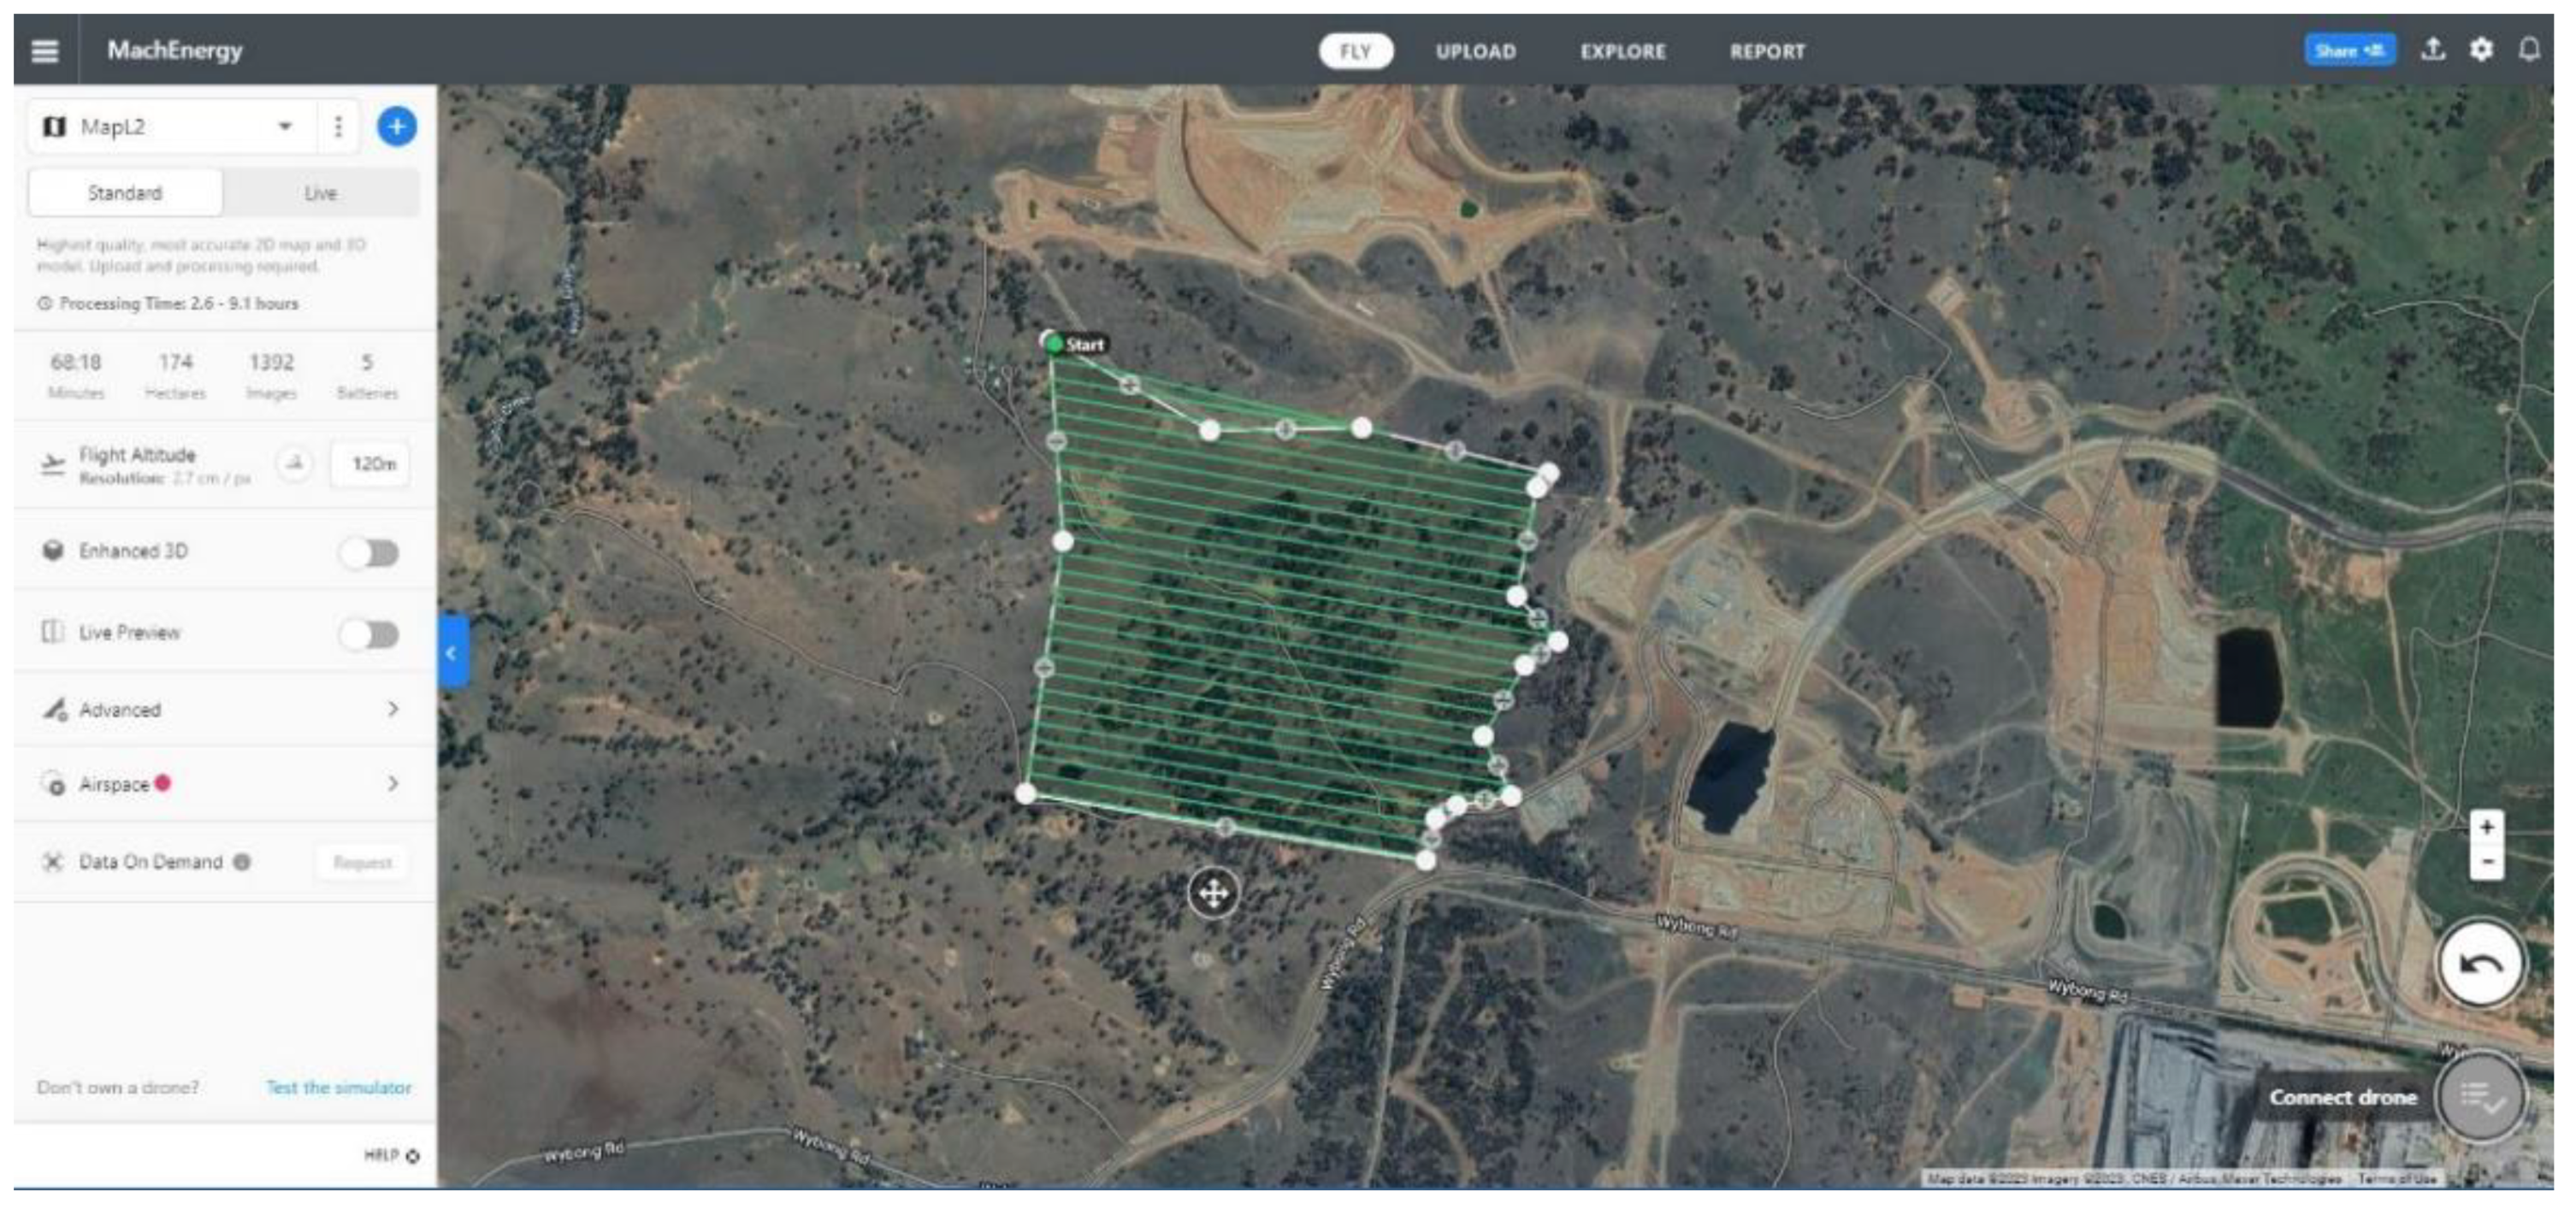
Figure 4.
Orthomosaic image.
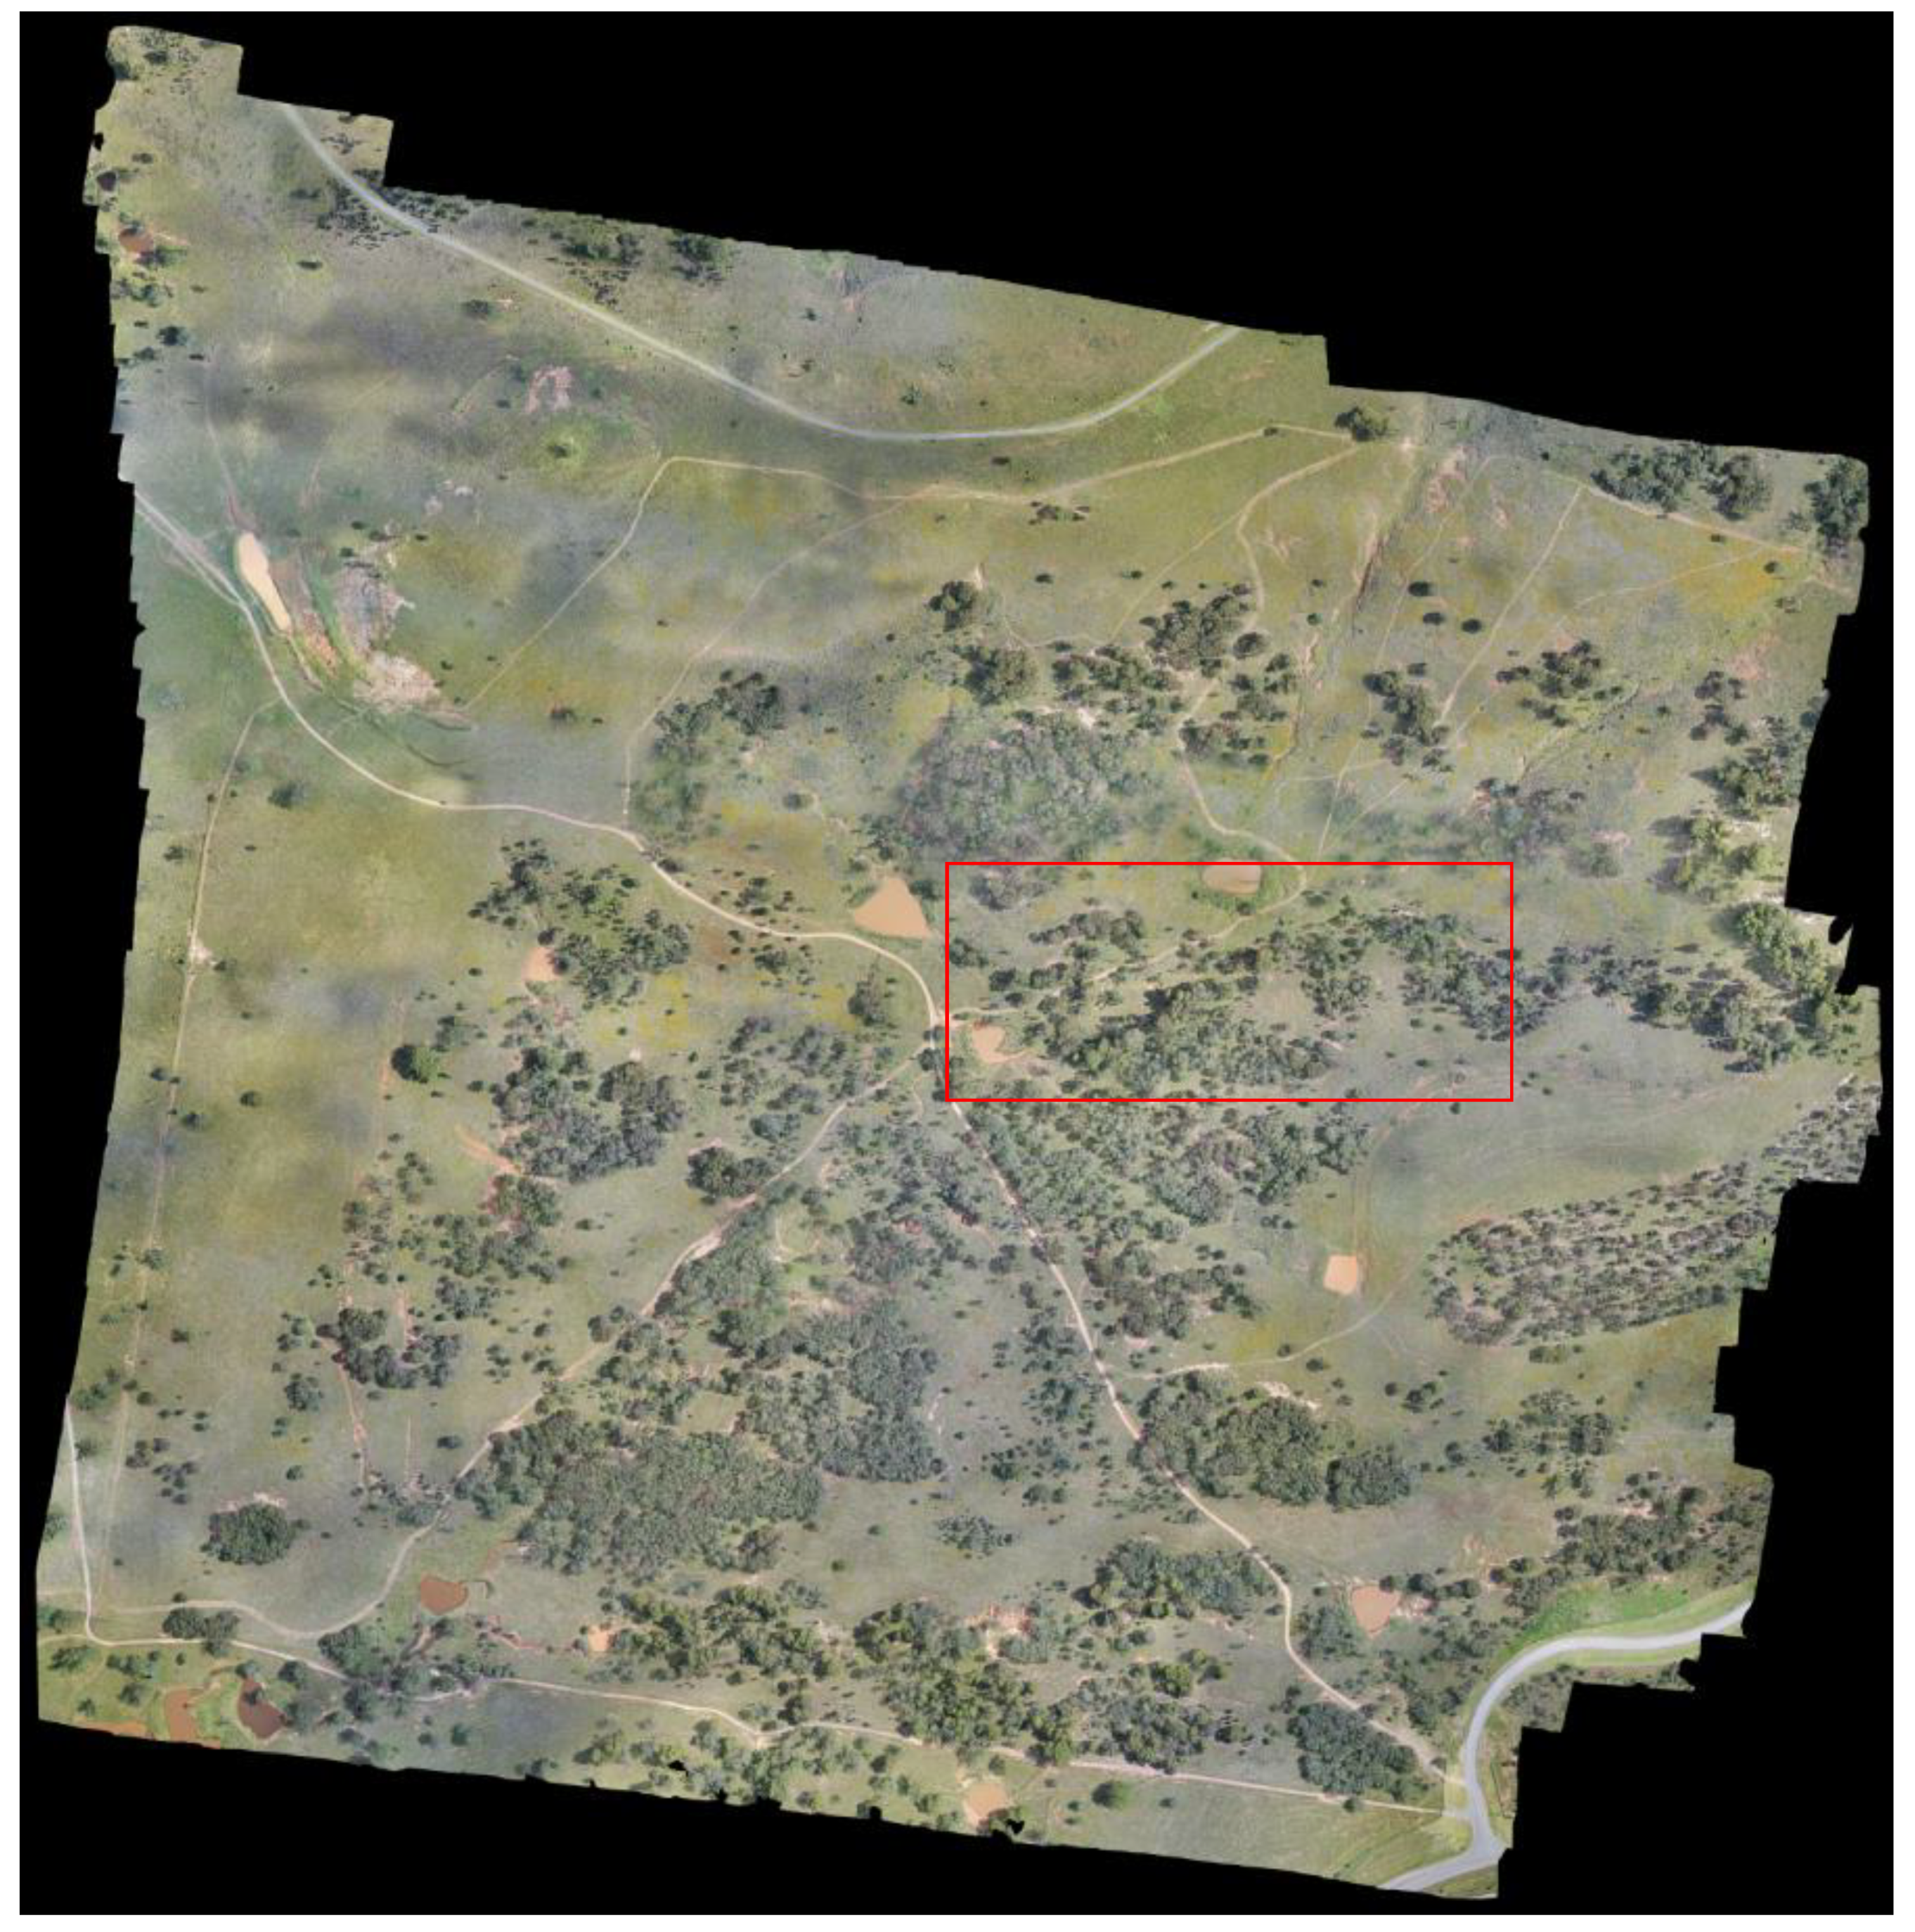
Figure 5.
Orthomosaic image (inset from Figure 4).
Figure 5.
Orthomosaic image (inset from Figure 4).
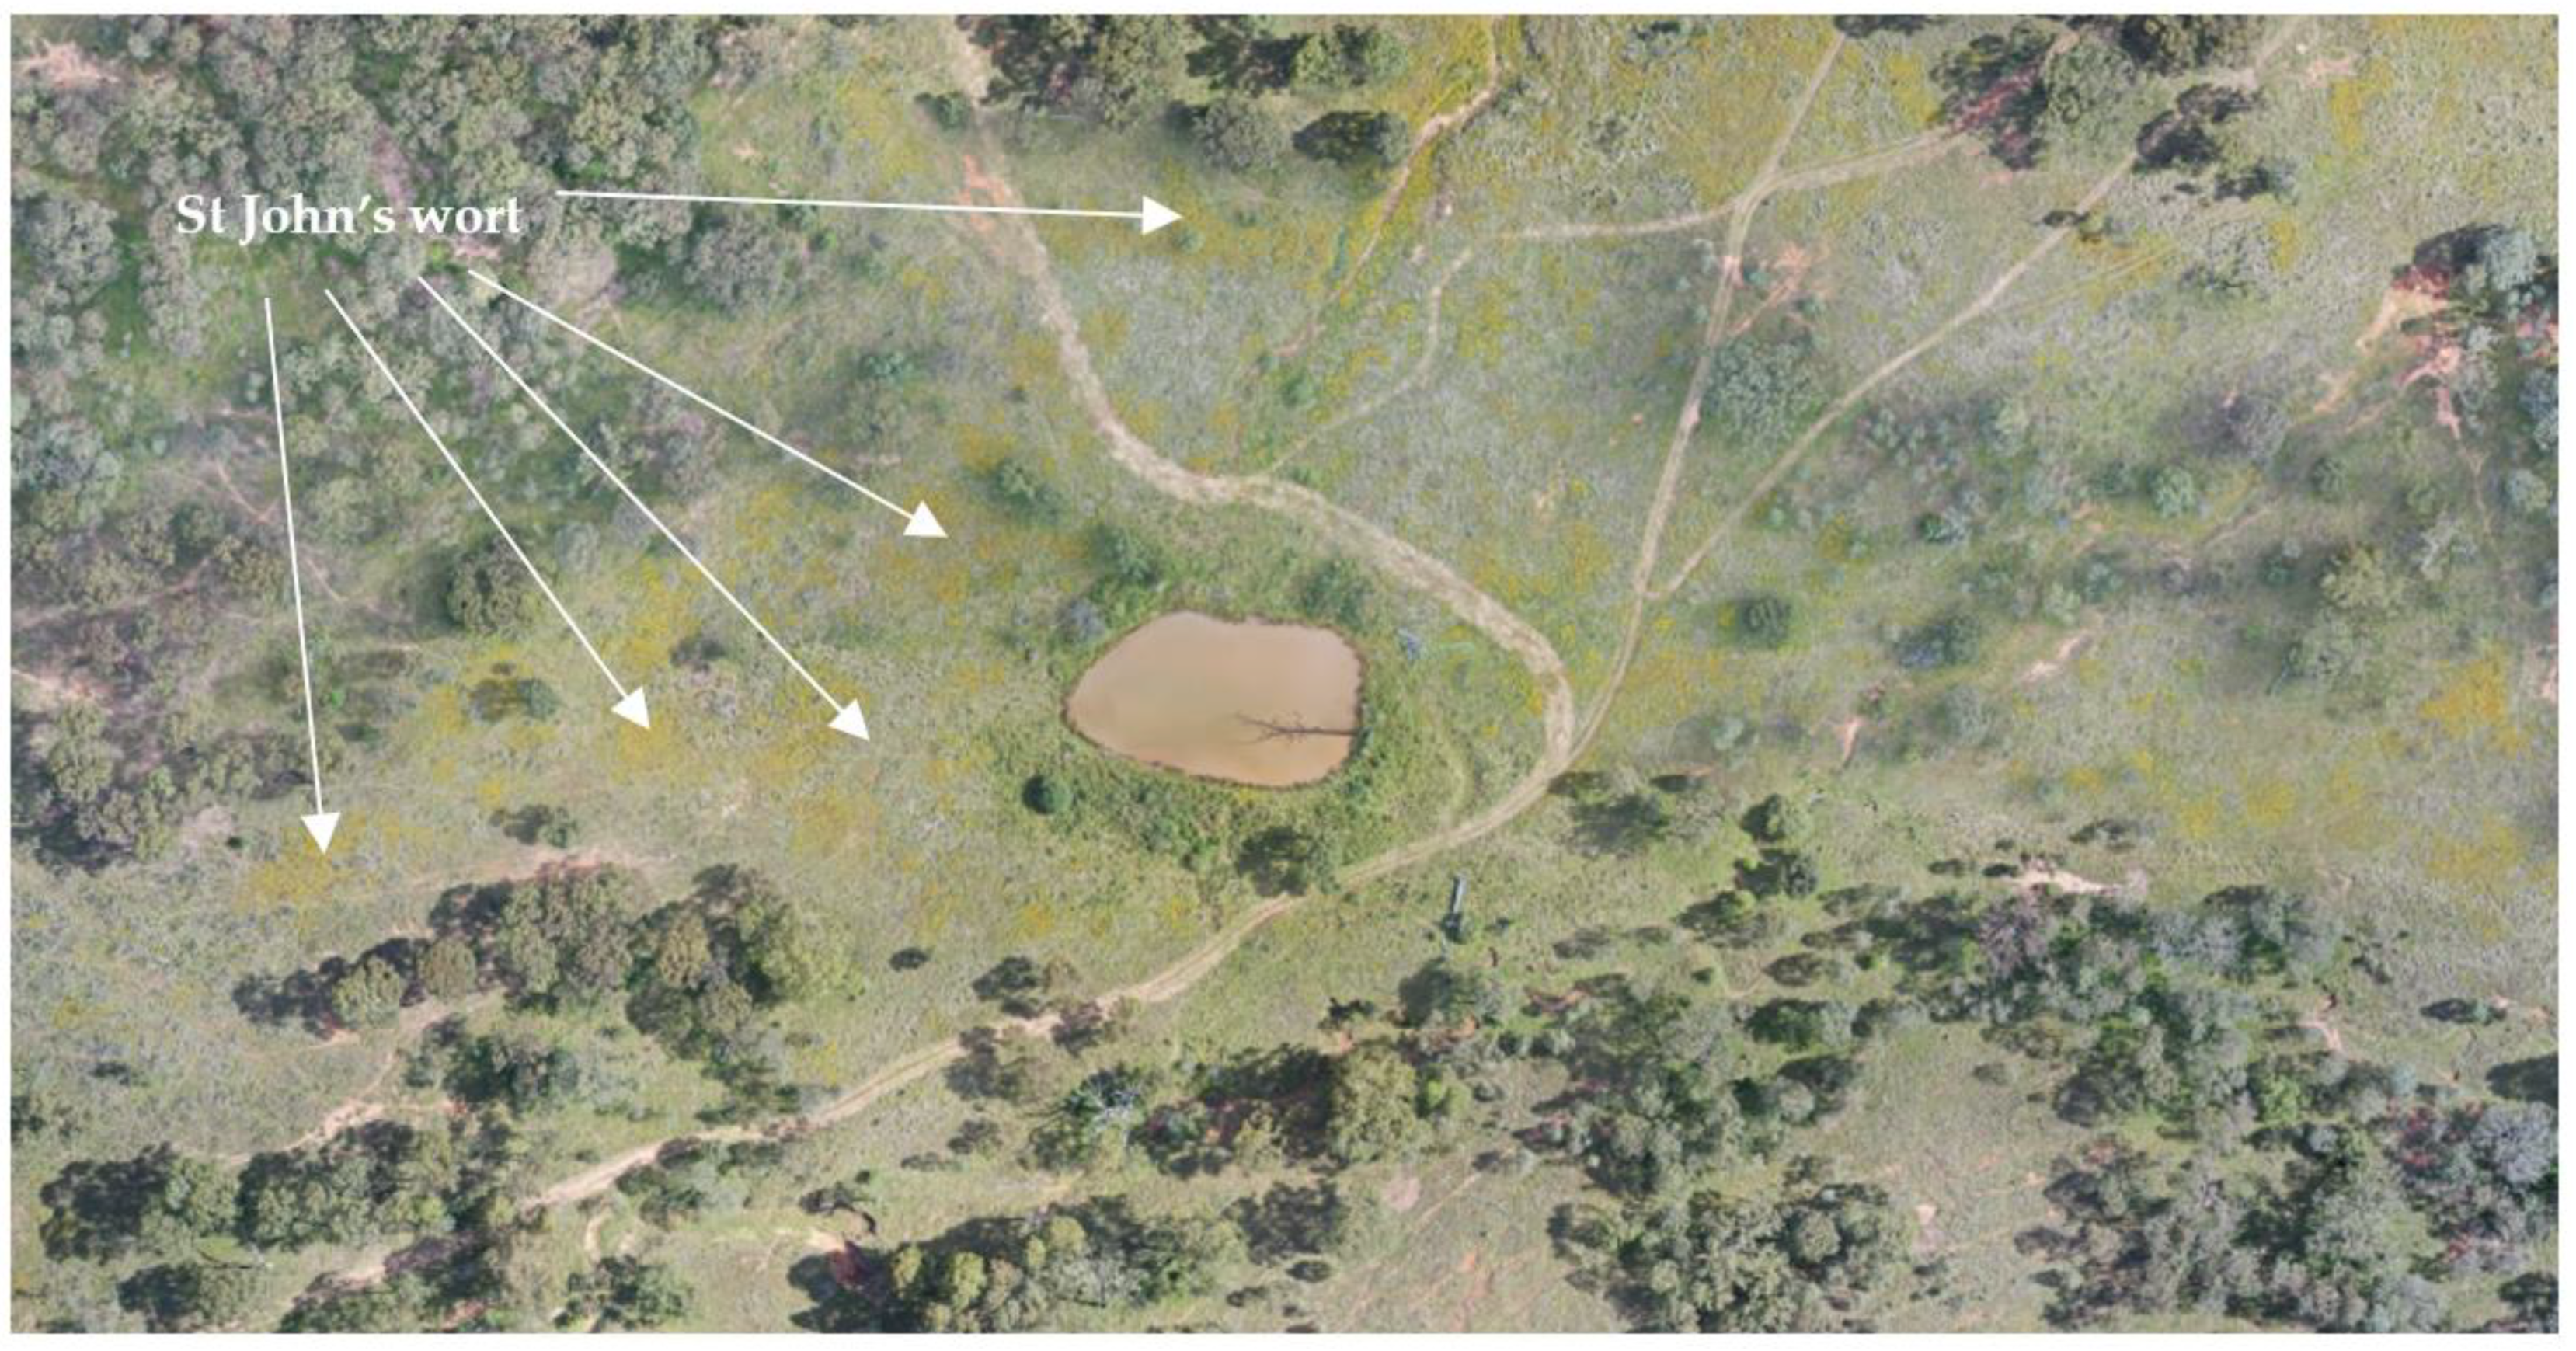
Figure 6.
Raw VARI image from original orthomosaic image. (Index Range = -0.49 – 0).
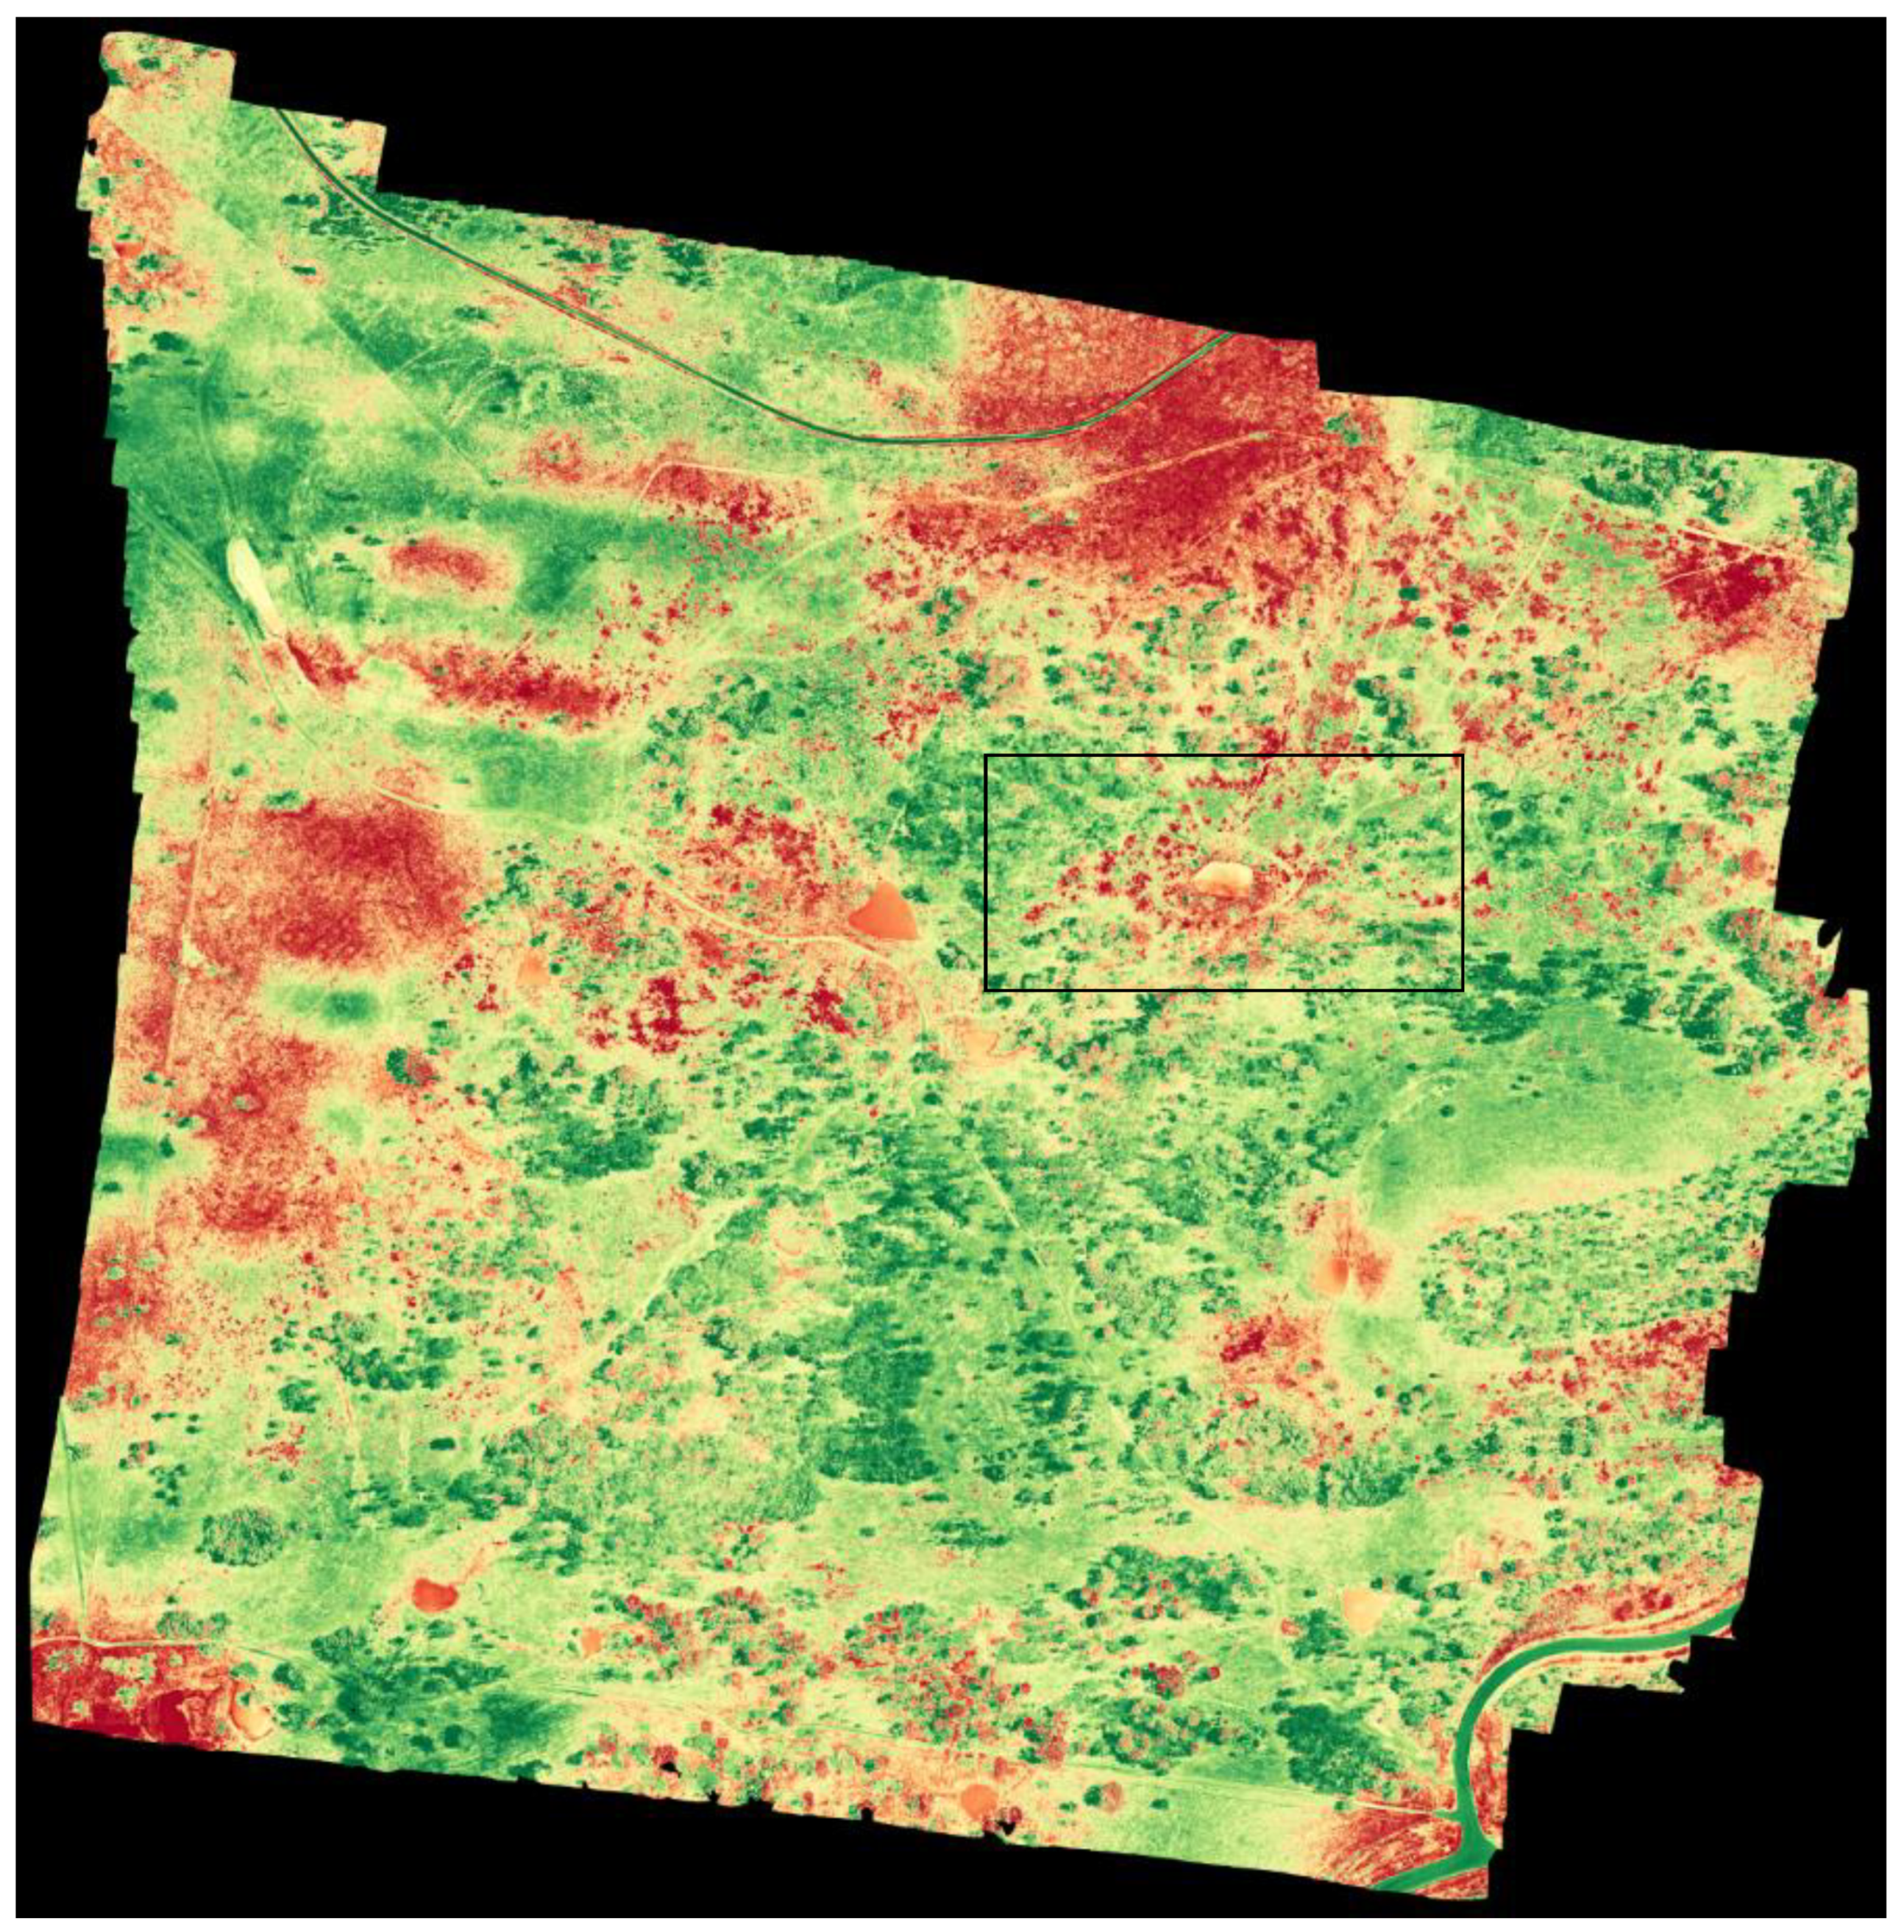
Figure 7.
Inset from Figure 6.
Figure 7.
Inset from Figure 6.
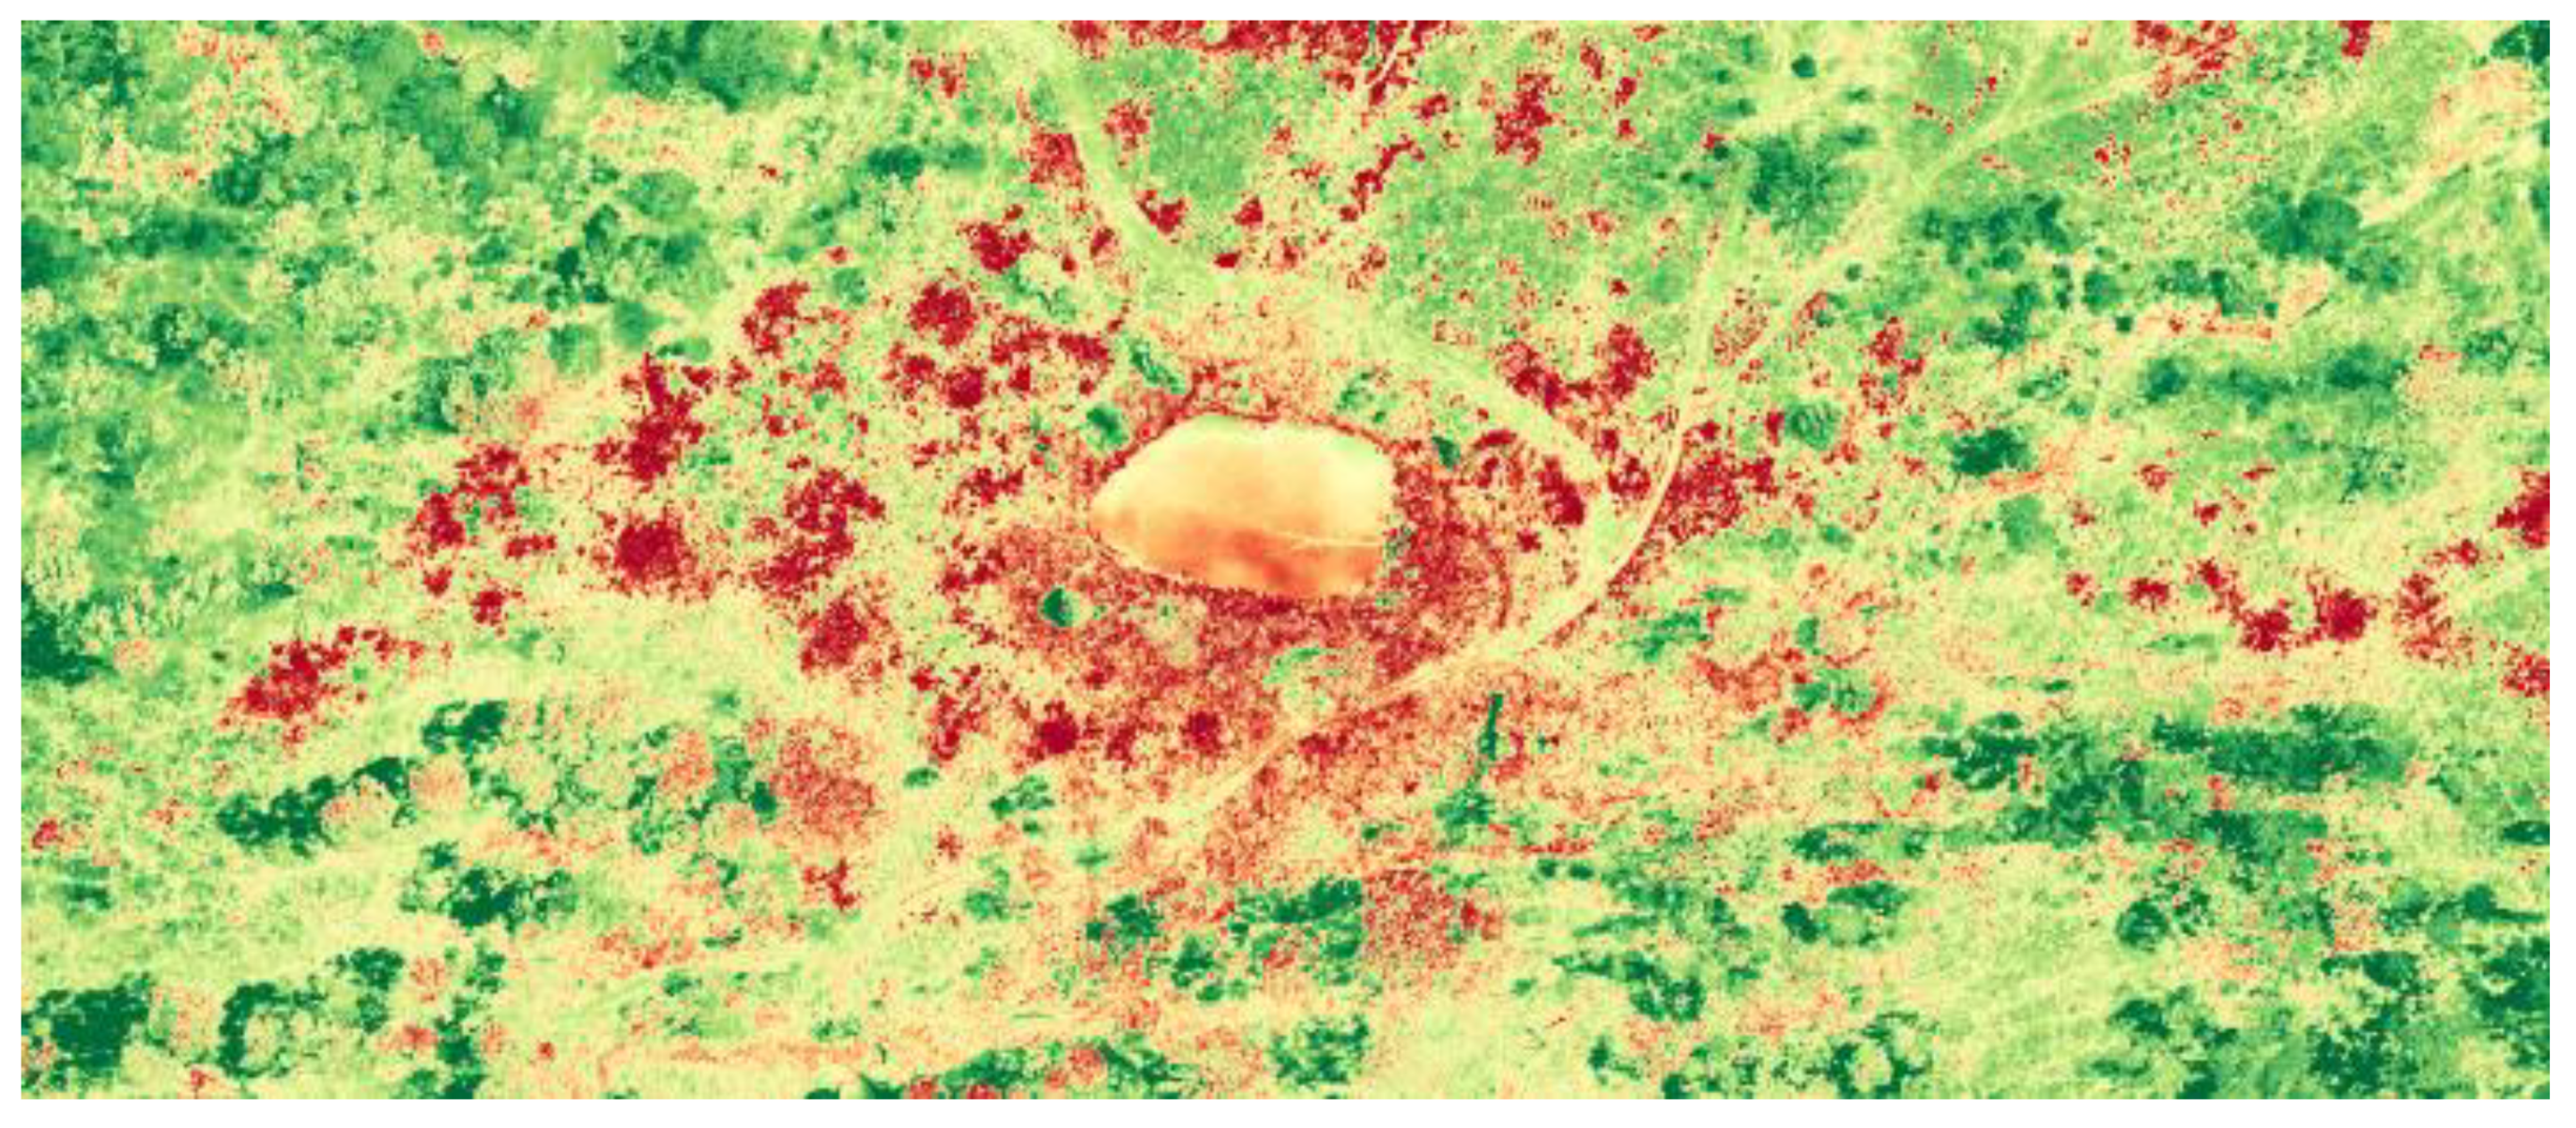
Figure 8.
VARI image configured to highlight St John’s wort. (Index Range narrowed to between -0.46 and -0.43).
Figure 8.
VARI image configured to highlight St John’s wort. (Index Range narrowed to between -0.46 and -0.43).
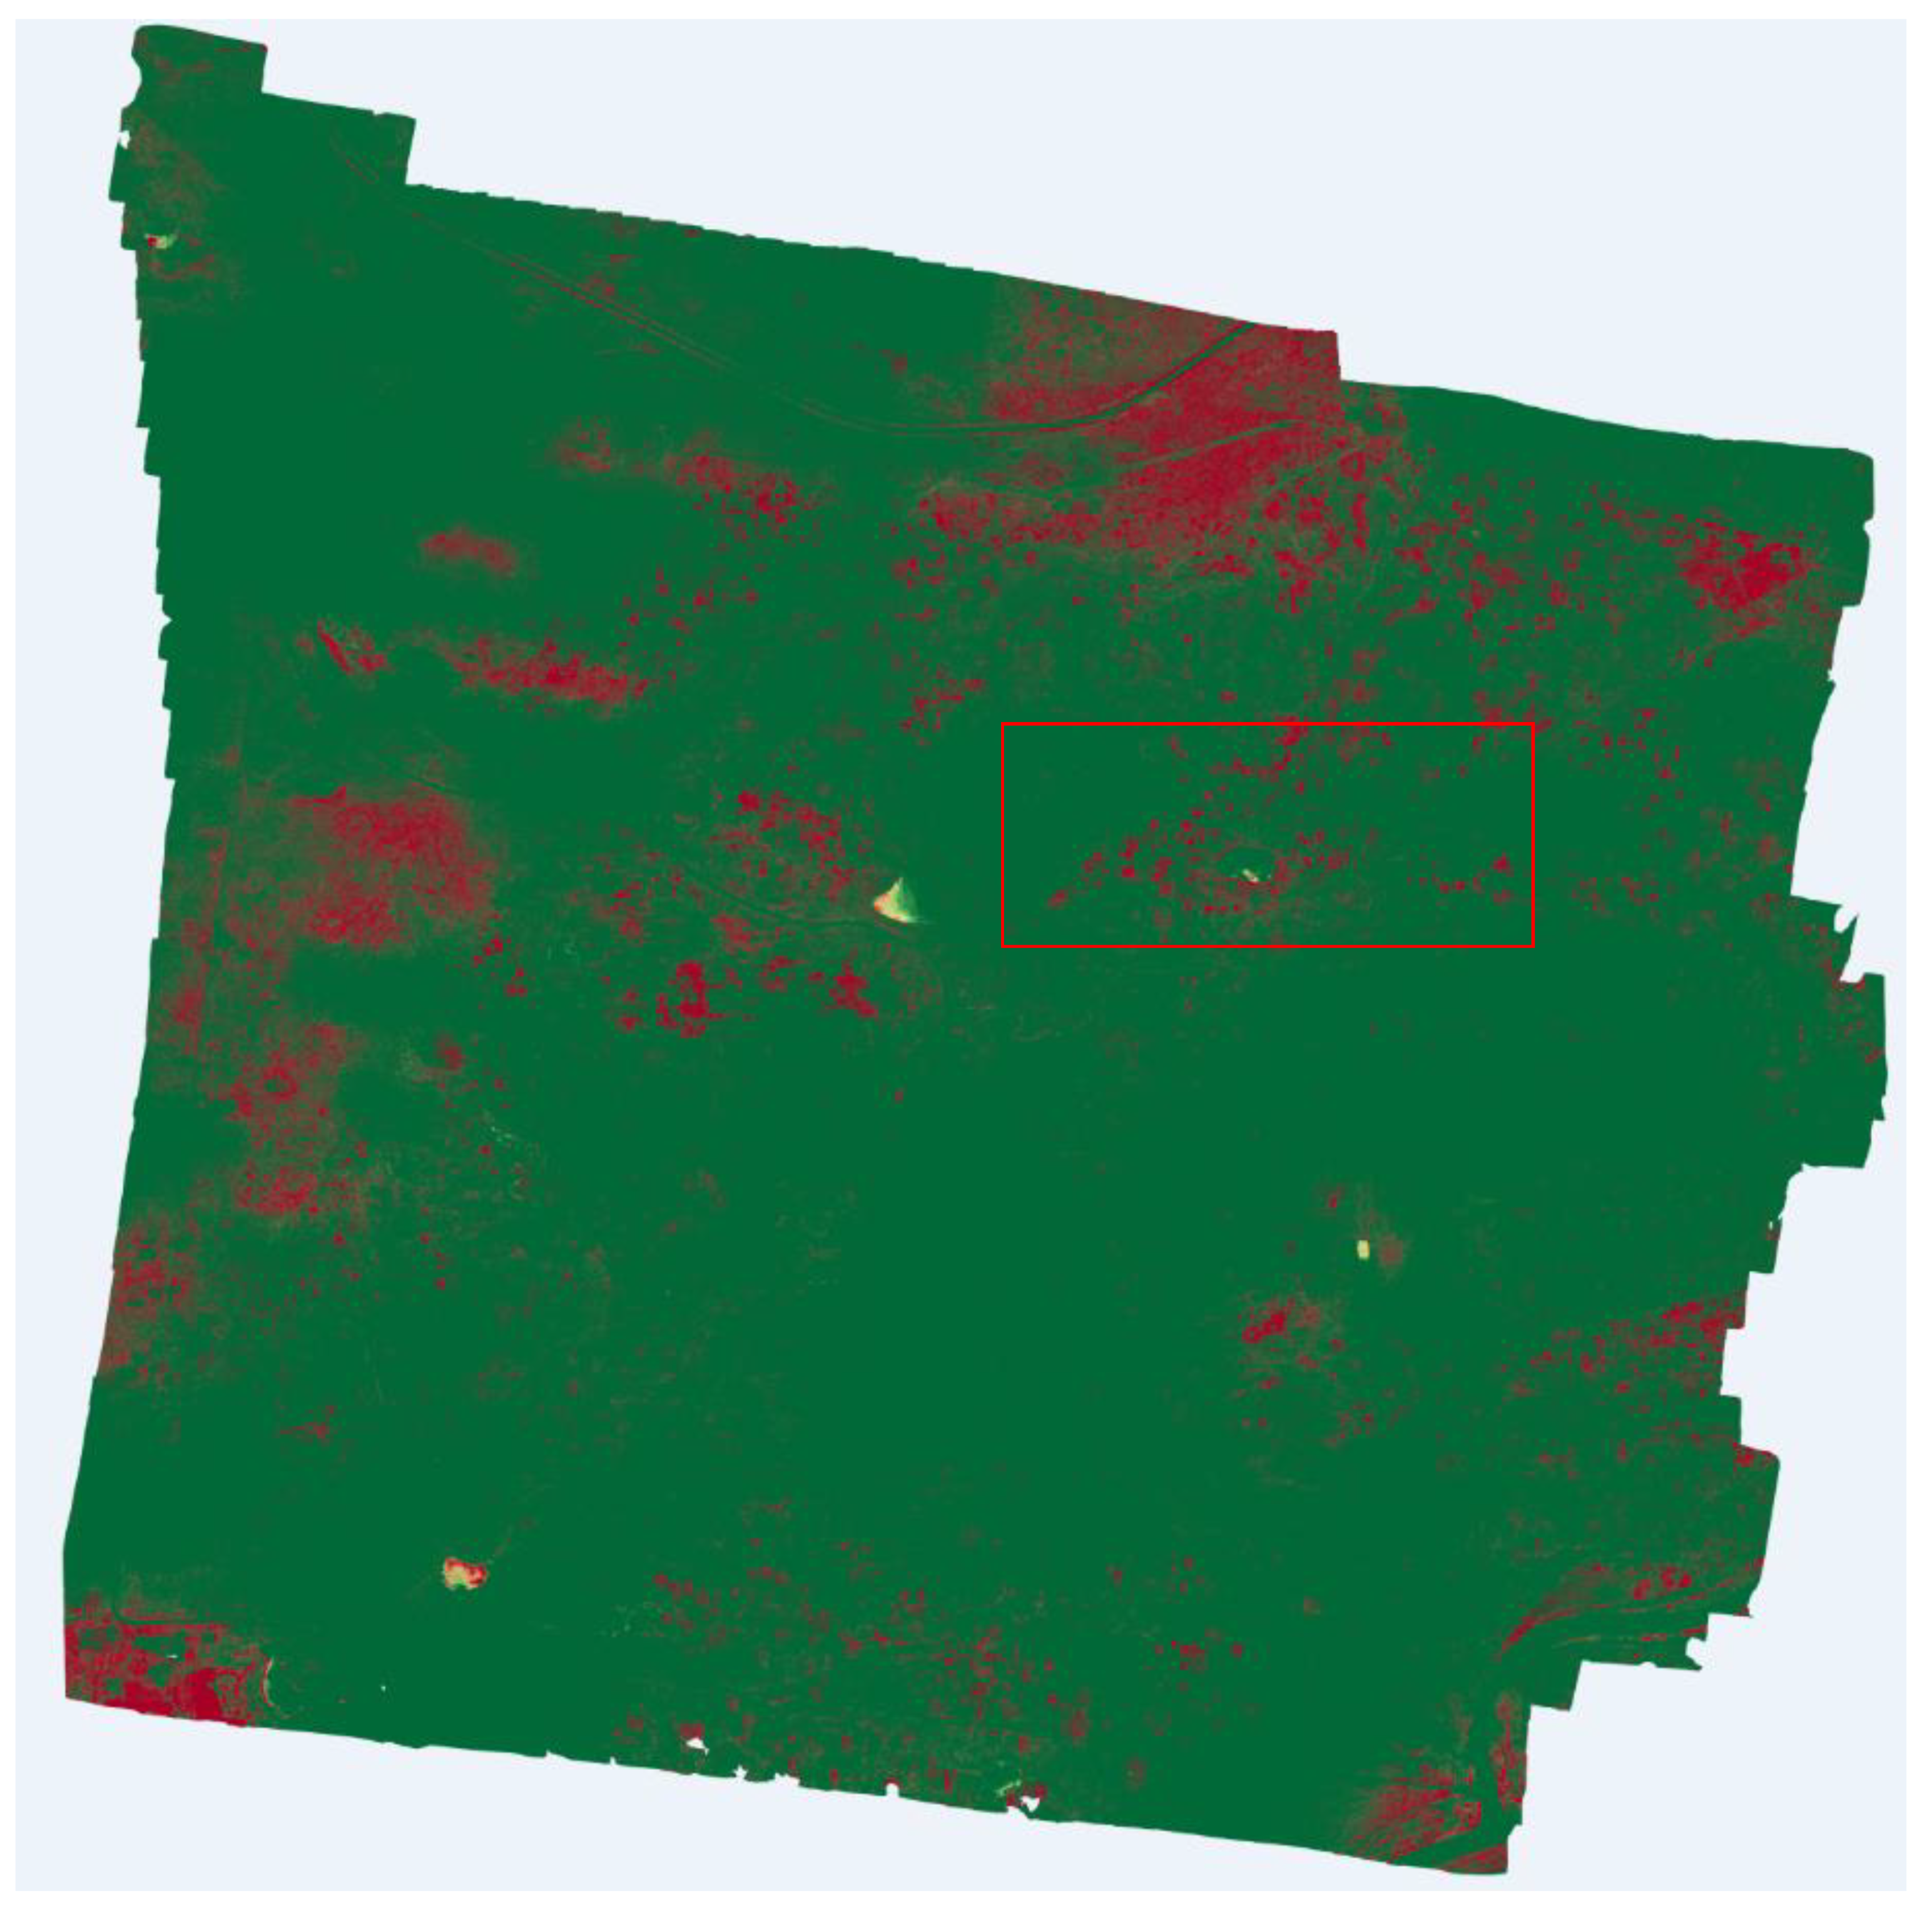
Figure 9.
Inset from Figure 8.
Figure 9.
Inset from Figure 8.
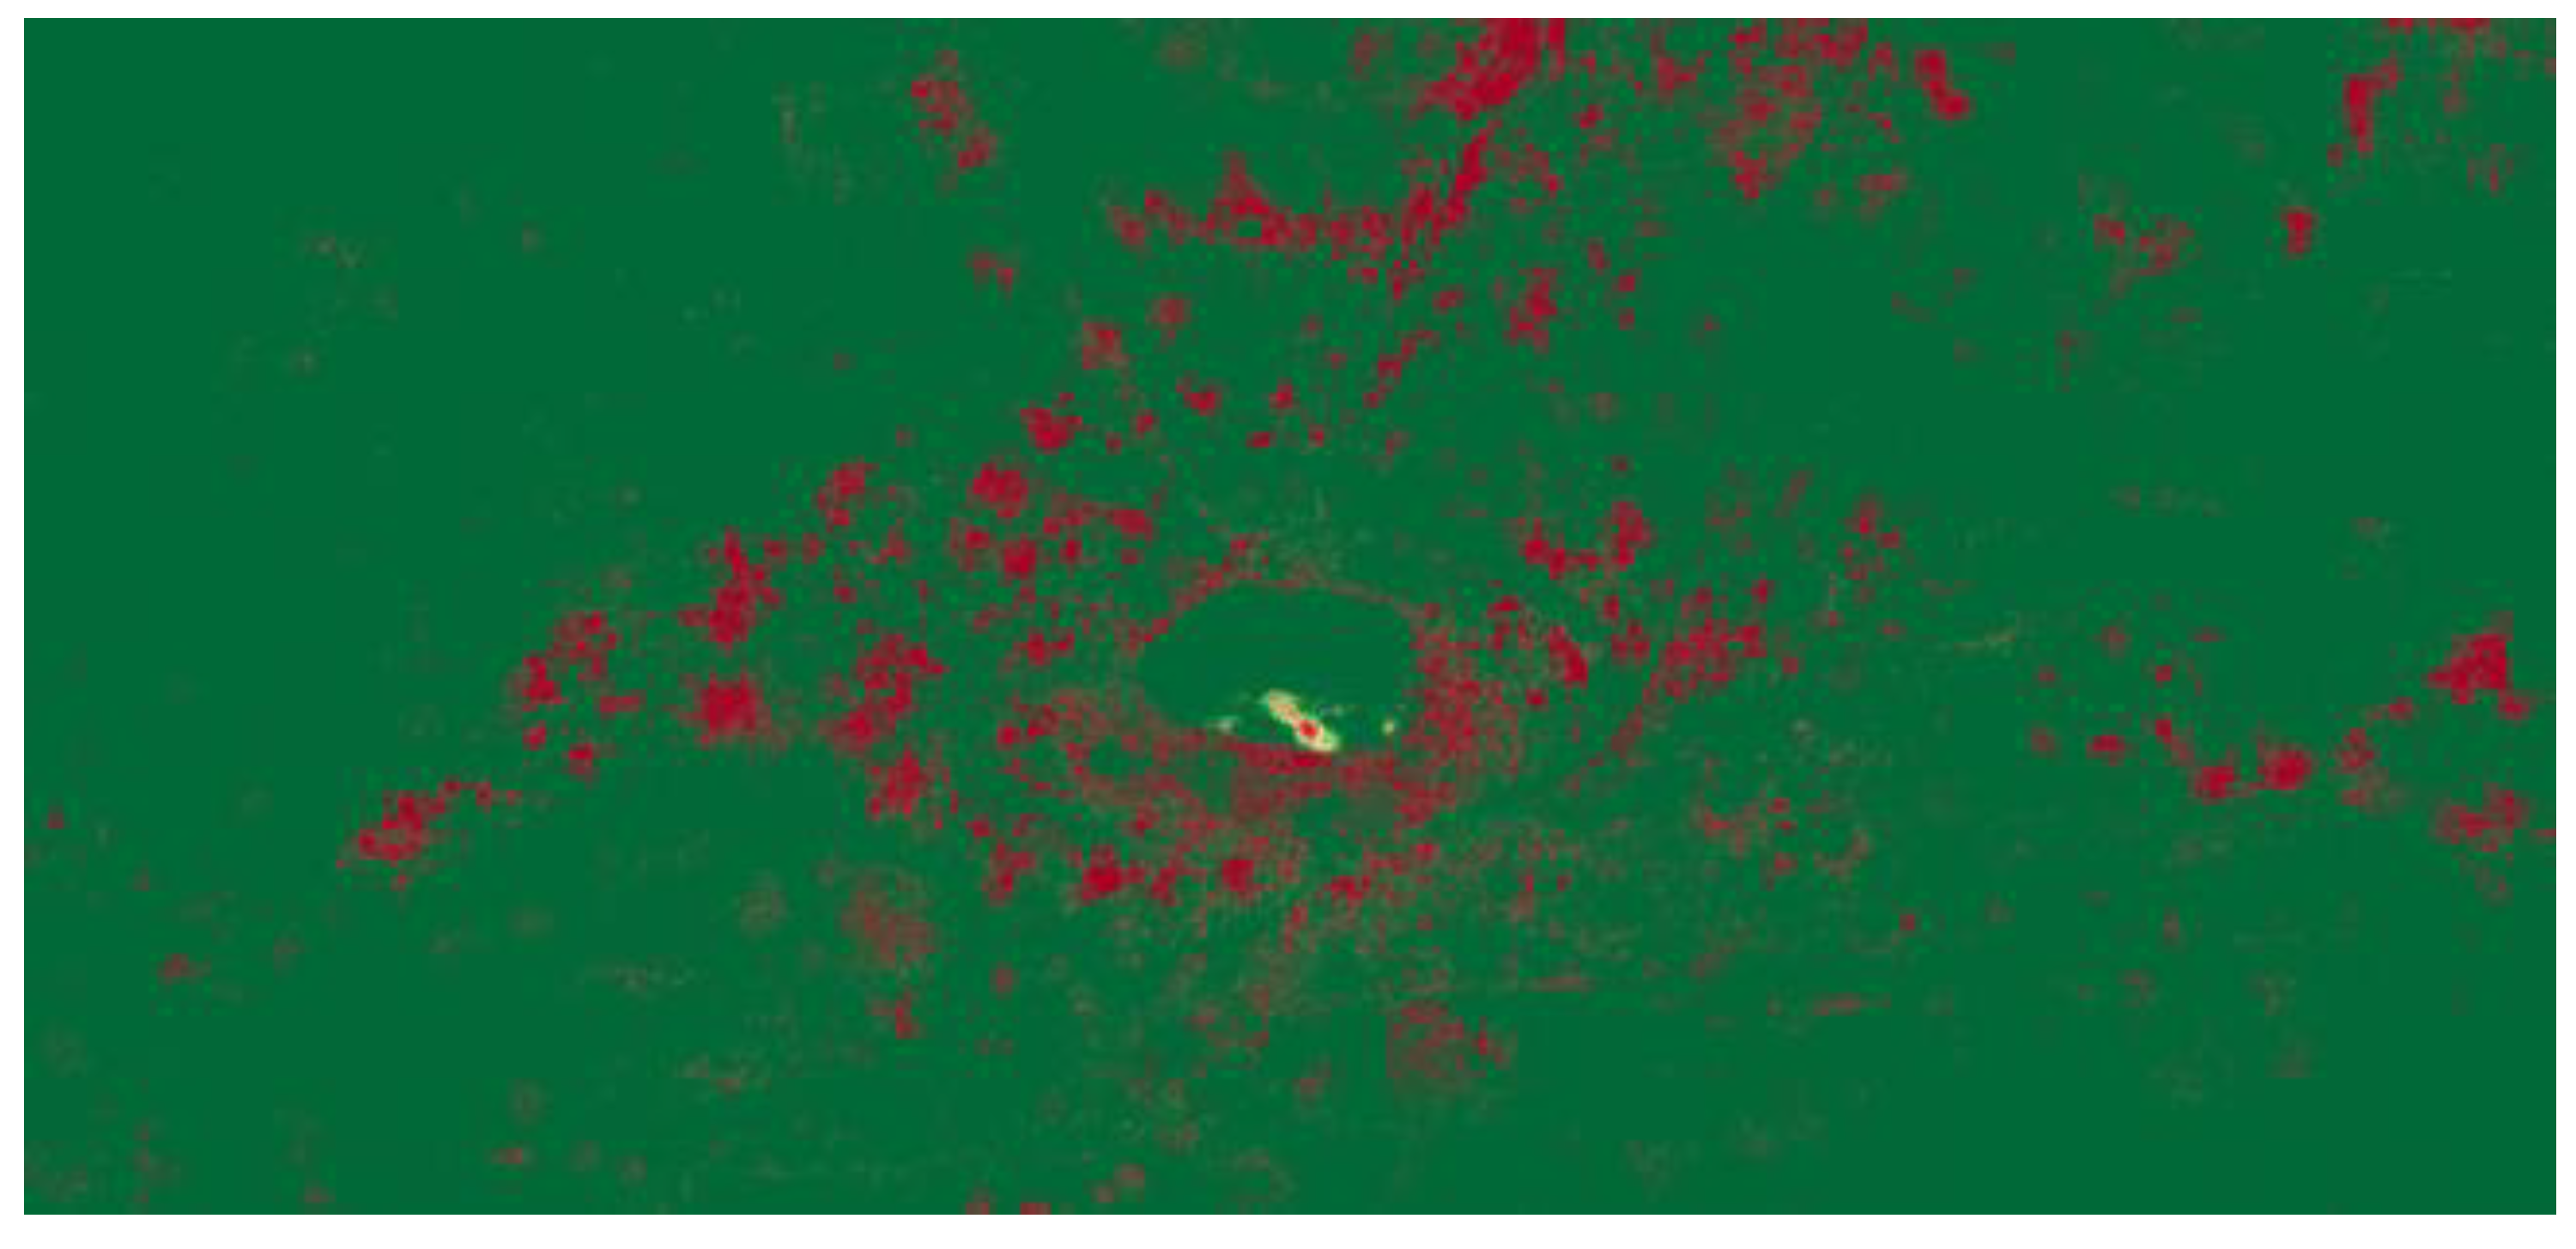
Figure 10.
Final map showing areas of St John’s wort.
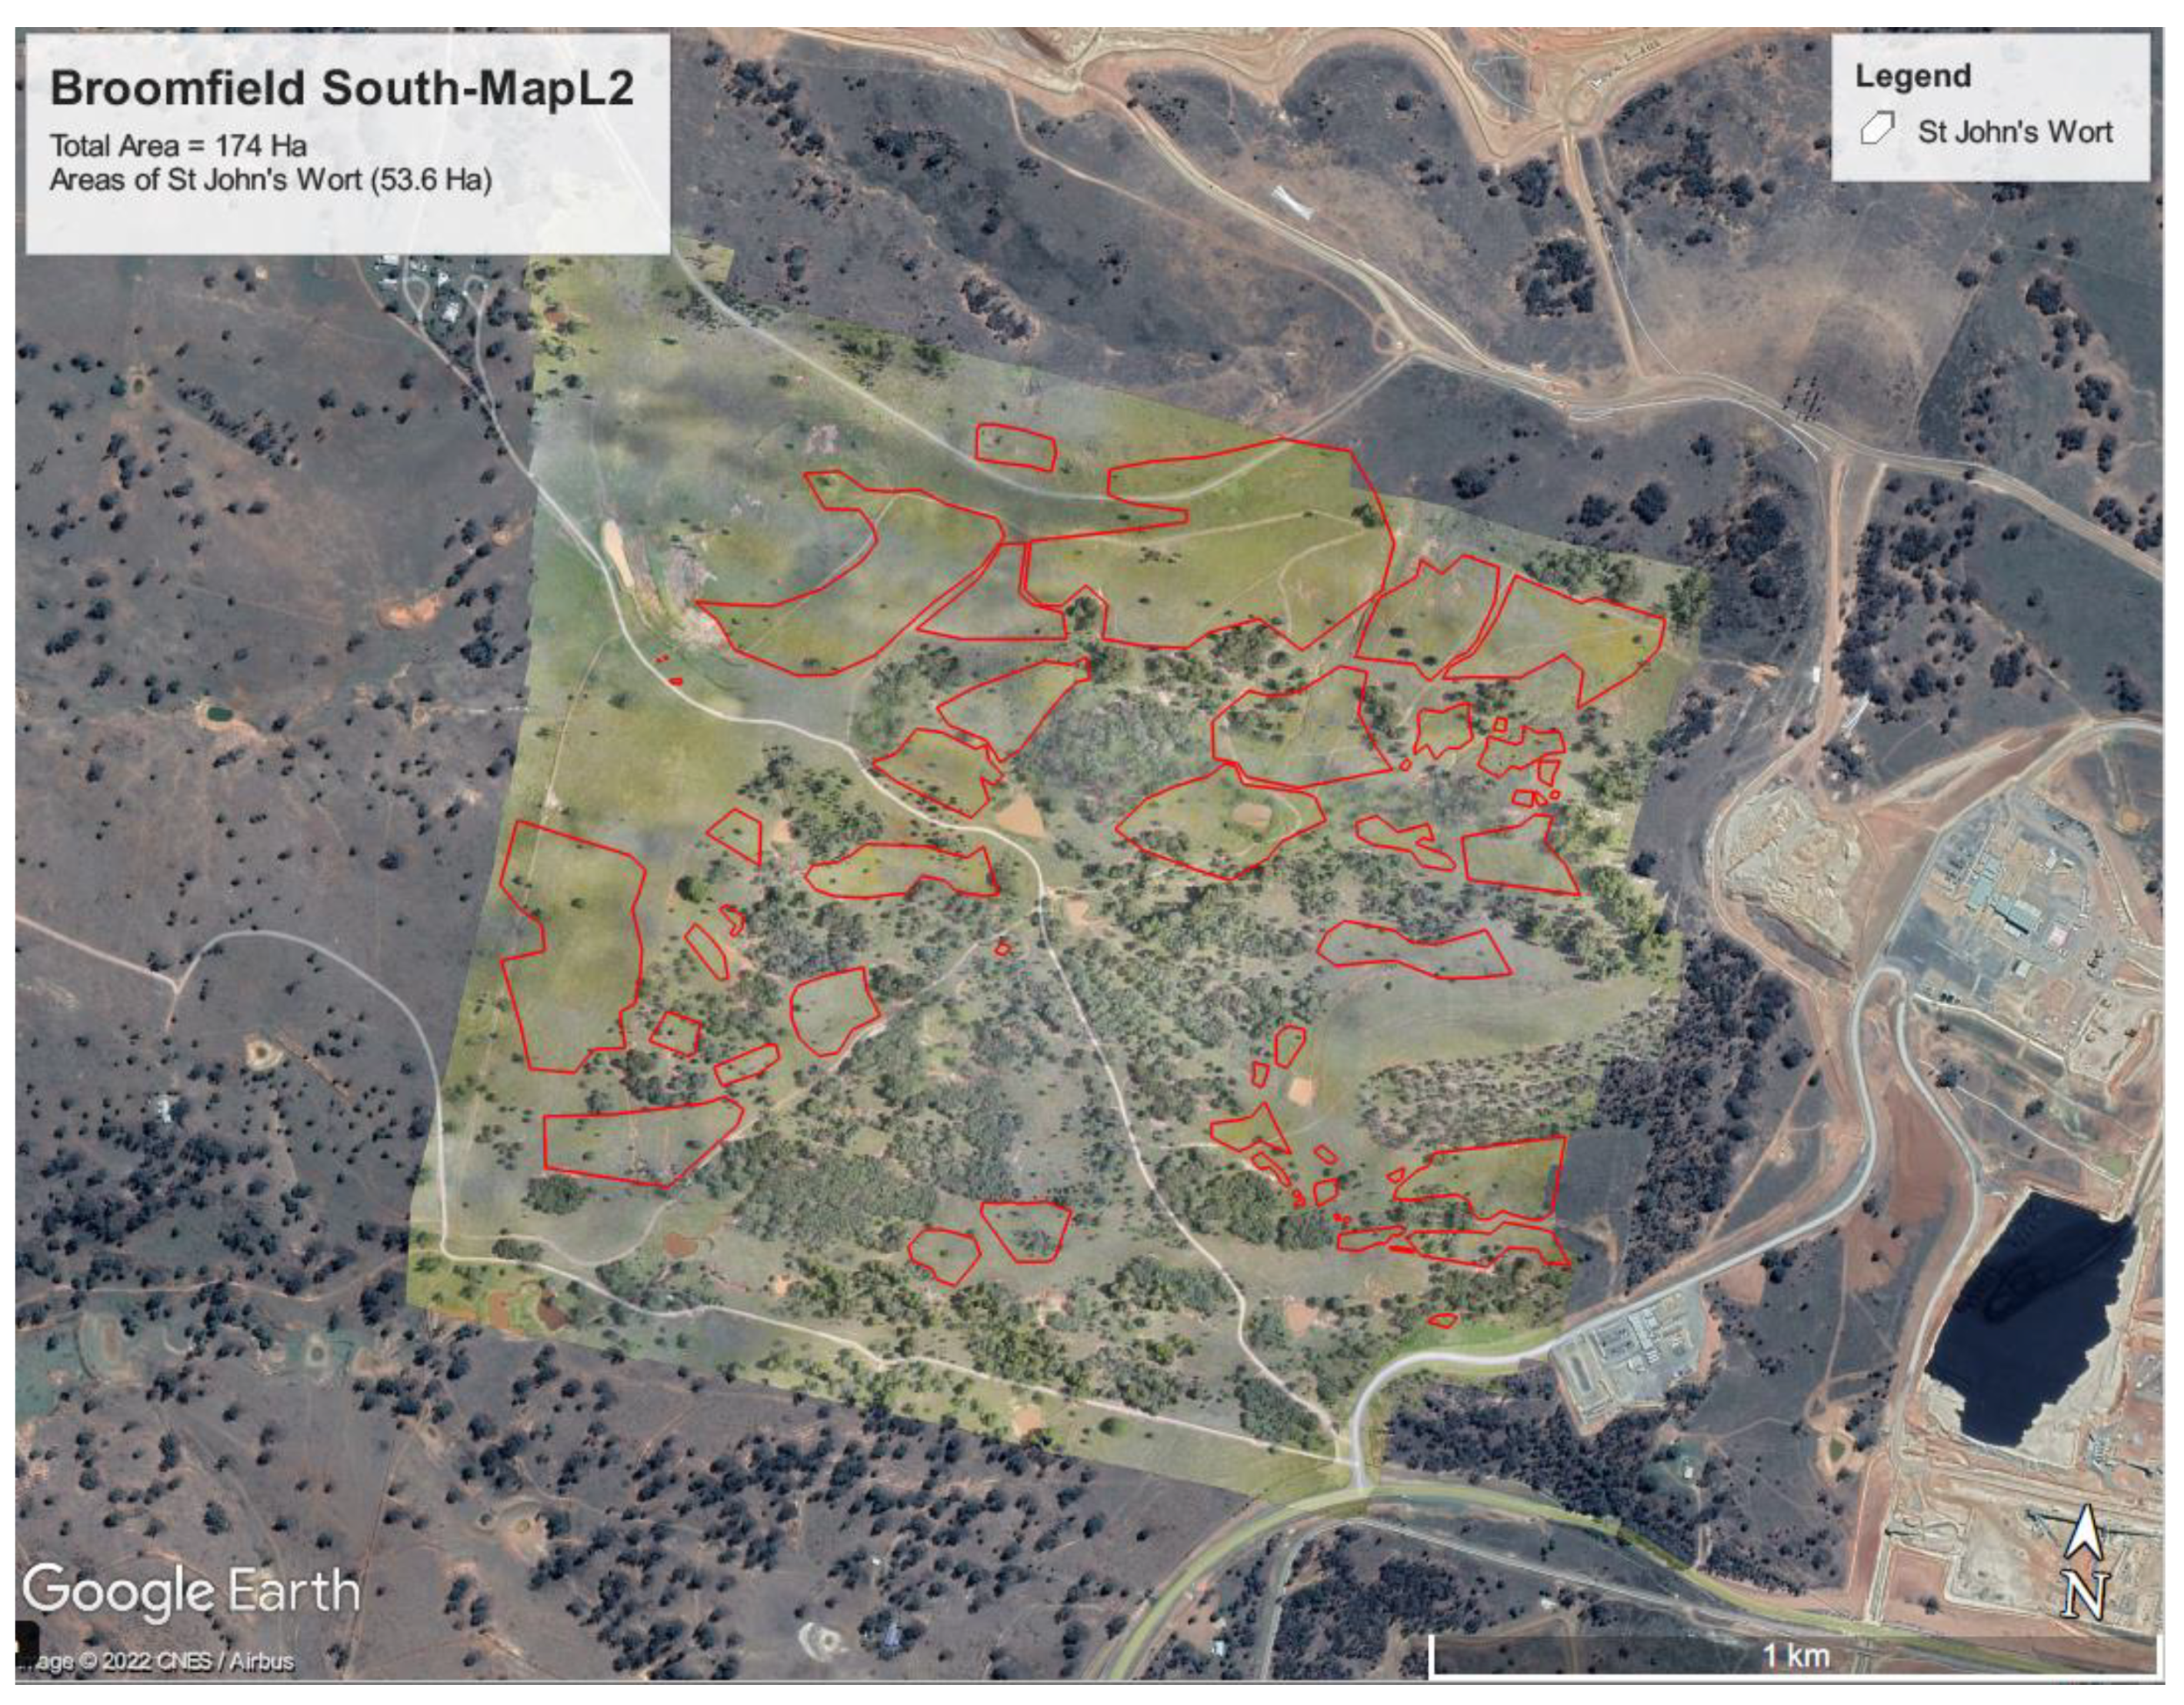
Figure 11.
(a) Orthomosaic image showing ‘yellow’ St John’s wort; (b) Raw VARI image (index ranged from -0.49 to 0), and (c) Configured VARI image (index narrowed to -0.46 to -0.43).
Figure 11.
(a) Orthomosaic image showing ‘yellow’ St John’s wort; (b) Raw VARI image (index ranged from -0.49 to 0), and (c) Configured VARI image (index narrowed to -0.46 to -0.43).
Disclaimer/Publisher’s Note: The statements, opinions and data contained in all publications are solely those of the individual author(s) and contributor(s) and not of MDPI and/or the editor(s). MDPI and/or the editor(s) disclaim responsibility for any injury to people or property resulting from any ideas, methods, instructions or products referred to in the content. |
© 2023 by the authors. Licensee MDPI, Basel, Switzerland. This article is an open access article distributed under the terms and conditions of the Creative Commons Attribution (CC BY) license (http://creativecommons.org/licenses/by/4.0/).
Copyright: This open access article is published under a Creative Commons CC BY 4.0 license, which permit the free download, distribution, and reuse, provided that the author and preprint are cited in any reuse.


