Submitted:
31 December 2022
Posted:
06 January 2023
You are already at the latest version
Abstract
The global transport sector of the world economy contributes about 15% of the Greenhouse Gas (GHGs) emissions in the world today. The University of Saskatchewan has pursued the green energy transition over the years. They have spearheaded diverse sustainability projects and agendas, due to the importance of curbing climate change and advancing sustainability. The transport system in the university campus is one area of focus where the Sustainability Office plans to introduce some innovations, as a way of curbing GHG emissions while also advancing sustainability practice in the university campus. The study carried out an economic benefit analysis on the campus fleet (consisting of 91 ICE vehicles) to determine if it is economically or financially feasible to transition from Internal Combustion Engine (ICE) or PVs (Petrol Vehicles) to Electric Vehicles (EVs). The analysis used RETScreen Expert software for analyzing renewable energy technology projects. The variables of Payback Period (PBP), cash flow projections, savings made from transitioning (fuel cost savings and energy cost savings), Benefit-Cost-ratio, GHG emission reduction potential, etc. were analyzed. The findings revealed that the GHG emission from the campus fleet will be reduced by 100% (this will result in the removal of about 298.1 tCO₂ from the environment). Also, the fleet manager will save approximately $129,049 (88.9%) in fuel costs. Apart from these, the return on investment will be achieved in year 5 (all things being equal), but can be reduced to year 2 if the vehicles are put into constant and active use (eliminating most idle times. Also, the Sustainability Office will be making a GHG reduction revenue of $14,906.
Keywords:
sustainability
; transportation
; fleet management
; campus
; university
; renewable energy
; energy transition
; economic analysis
; risk management
; modelling
; ghg emissions reduction
1. Introduction
The transport sector of the economy remains one of the critical sectors that has received attention over the years. In 2010 for example, 14% of the global GHG emission came from the transport sector of the global economy [1]. As of 2017, 23% of the global GHG emission came from transport [2]. This is understandable, knowing that 95% of the world’s energy for transport comes from fossil fuels (mainly gasoline and diesel) [1]. In 2019, Canada contributed 1.5% of the global emission, of which 30% of Canada’s total emission came from transport [3]. Seeing how critical the transport sector (mostly road transport) is, as it concerns GHG emission, it is now evident that sustainable solutions are needed to cut down the negative impact of these emissions and advance the sustainability of the environment, while also enhancing climate change mitigation. Lots of efforts are already being put into decarbonizing the road transport sector, even as scientists, researchers, and investors are all working together to make meaningful impacts. Major investments are already being made towards supporting sustainable road transport (the use of vehicles or automobiles in moving people, objects, and services from one place to another). One important innovation in decarbonizing road transport is the introduction of electric vehicles or simply called smart mobility in general terms.
The World Bank projects that the global market for smart mobility may hit over $150 billion within the next 5 years [4]. This actually aligns with the fact that automakers (like Tesla, Nissan, Volkswagen, and even several Chinese automakers- mostly start-ups) are in a tight race of developing the most affordable, safe, green, and efficient electric vehicles (EVs) within the coming years. Automakers such as Tesla, Nissan, GM, Mercedes, etc., are in stiff competition, and a few years from now, mind-blowing innovations and technological disruptions (as it concerns the design and production of EVs) are expected to occur in this sector. General Motors (GM) for example is committed to ending the production of diesel and gasoline cars by 2034, while budgeting about $27 billion dollars for the transition project [5]. All these may also be attributed to the projections that in the coming years, the demand for transport will grow exponentially, while the required financing will reach about $50 trillion by 2040 [6]. This explains what the future holds for sustainable transport and EVs, and why EVs are the vehicles of the future, being that they promote sustainability and help to reduce GHG emissions. Figure 1 explains the market size for smart mobility across the various regions of the world.
In the light of all these efforts, investments, and innovations, communities, cities, organizations, and nations are also working towards the full adoption of EVs. For instance, in June 2020, California enacted Advanced Clean Trucks (ACT) regulations, that is directed towards ensuring that manufacturers of trucks only sell zero-emission truck in an increasing rate (per annual sales), between 2024 to 2035 [7]. California by executive order expects that by 2035, only zero-emission compliant new passenger cars and light trucks will be sold in California [8]. Countries like Norway, Germany, France, Taiwan, India, United Kingdom, etc. have made commitments towards phasing out internal combustion engine (ICE) vehicles, even as cities such as Paris, Athens, Mexico City, Copenhagen, etc. have followed suit [9]. Businesses are not left out: over 600 companies with a total market cap of over $13 trillion dollars have signed on to the United Nations’ Business Ambition for 1.5°C (a global coalition of United Nations agencies, businesses, and industry leaders that are committed to hitting the net-zero emission target by 2050) [10]. It is interesting to know that institutions such as universities across the globe are also at the forefront of combating climate change and advancing sustainability. Basically, universities play critical roles in championing sustainability through diverse means such as research and innovation, through their daily operations and diverse services [11].
Typical universities embody knowledge, innovation, and research, and are championing lots of initiatives geared towards advancing the cause of meeting the various decarbonization targets set globally. Thus, universities are setting up structures, projects, programs, and platforms that embody the concept of local actions that birth global impacts. They are also typical examples of organizations that are channeling different innovations and actions towards decarbonizing the environment.
Furthermore, university campuses are at the grassroots of innovation, research, and advancements, and as such, they are also championing diverse initiatives towards achieving global sustainability [12]. Therefore, the Sustainability Office of the University of Saskatchewan is a typical example of how universities set up structures to enhance sustainability and encourage innovation and research that is focused on climate change mitigation, while also creating platforms for discussions and actions that are focused on environmental sustainability and GHG mitigation.
The University of Saskatchewan – Dimensioning its decarbonization opportunities, challenges, and advantages.
Universities are knowledge centers for research, innovation, learning, and advancement of knowledge. They serve as incubation centers for most ideas that have changed the world. Over the years, most universities have triggered changes in their environment and around the world. This explains the importance of the role the universities play in championing global issues such as environmental sustainability, decarbonization of the environment, and sustainable energy and transport transitions. Universities are expected to play leadership roles in providing solutions to some of the issues facing societies today. Their strategy is hinged on the use of knowledge, innovations and, creativity to influence society, even as they help to birth new paradigms that enhance human lives and the advancement of society. A typical example is the Electric Vehicle Research Centre at the University of Toronto which was launched in 2016, where ground-breaking research into electric vehicles and batteries is being carried out [13]
It is also identified that there are some certain conditions or factors that help universities play their leadership role in the green revolution agenda. These factors help universities to scale up actions and impact at higher speed and effectiveness. Such factors include effective policy environment, adoption of the right strategies, raising and encouraging environmental advocates and ambassadors, creating awareness among staff and students as it concerns the importance of sustainability in preserving the future, and integrating sustainability practices into its daily operations (for example in its transportation system) [11]. Some of these factors are likely to distinguish a university campus in its sustainability drive.
University campuses represent the idea of local actions that produce global impact. Universities can act as living laboratories in developing ideas and innovations that trigger a paradigm shift in society and the economy. Typically, university campuses are usually communities that have buildings, laboratories, vehicles, energy supply systems, medical facilities, sports facilities, research centers, and the likes. All these represent what exists in the larger societies, hence, university campuses can leverage these operations and activities to demonstrate knowledge, rev up ideas and cause changes as it concerns climate change mitigation. In demonstrating this strategy, In 2020, the government of Canada through Natural Resource Canada gave $100,000 funding to the University of Guelph to install 20 EV chargers on campus, as a way of supporting Canada’s ambition of achieving 100% passenger EV sales by 2040 in Canada [14] This further reinforces the role of universities in advancing decarbonization and climate change mitigation. Some of these actions have been demonstrated across the globe.
Across the world, several university campuses have championed sustainability initiatives (sustainable energy and transport transitions initiatives as well), and overall decarbonization of the environment. A typical example is the University of California, which has set itself as a leader and a shining example for others to follow, as it concerns climate change mitigation, environmental sustainability, and environmental policy and law [15]. The university has deployed diverse tools, projects, strategies, and programs toward bending the GHG emission curve and decarbonizing its campuses across its diverse operations [15].
For the University of Saskatchewan campus, the Sustainability Office is saddled to develop strategies and frameworks, while enhancing collaborative research on sustainability. They serve as platforms for interdisciplinary collaborations in research into diverse issues surrounding climate change, climate change mitigation, environmental sustainability, etc. Just like other campuses across Canada and North America, the Sustainability Office champions diverse programs, projects, and initiatives that tend to advance sustainability; while also coordinating various partnership initiatives (with government, research bodies, other organizations, and the private sector) that are focused on advancing sustainability in the university campus.
Over the years, the University of Saskatchewan has instituted diverse efforts to advance sustainability on the campus. The university is a signatory to the Climate Charter of Canadian Universities; a document that reinforces the commitment of Canadian universities to support the United Nations’ 2050 net-zero emission target [16]. This shows the commitment and seriousness of the university towards curtailing or mitigating GHG emissions on campus, as part of its local actions. Also, the university initiated a strategic plan termed, The World the University Needs, a seven-year strategic plan that embodies diverse areas that require strategic improvements. Although the Strategic Plan does not embody sustainability as one of its five pillars, the goals and aspirations of the plan embody the principles of sustainability advancement, such as collaborations, boldness, innovations/curiosity, etc. [17]. It also plans to promote energy and environmental sustainability through its global citizenship and international community service agenda [17]. All these are plans and efforts of the University of Saskatchewan in achieving a zero-emission target on campus.
Furthermore, the university developed the 2019 GHG Emission Inventory, where it dimensioned how GHG is emitted and its diverse sources on the campus. From Figure 2 below, the fleet contributes 0.6% of GHG emissions on the university campus. It may seem little, but also significant when we consider the fact that it is categorized under direct emission, and the university has direct control over it. Therefore, the right action can help eliminate this. This is so important because the impact that such can create in the environment, mostly as it concerns public health may be too harmful in the long run.
The report suggests some remedies that can help to curb GHG emissions. One of such is fleet renewal. Hence, it is important to switch to more sustainable transport such as full adoption of EVs in the campus fleet. In the light of all these, it is obvious that the university has a good understanding of the challenges and therefore, is committed to resolving them, as we can see in the plan and the solution. The only visible gap is the right action in the right direction.
Figure 3 shows some recommended solutions/strategies for curtailing GHG emission in the university campus. The recommendation is that the university should consider fleet renewal as solution for GHG emission mitigation.
However, regarding green transportation on the campus, in 2013, AASHE (the Association for the Advancement for Sustainability in Higher Education) through its sustainability scoring/grading initiative termed STARS (Sustainability Tracking, Assessment and Rating System) program rated the University of Saskatchewan very low as it concerns the advancement of sustainable transport system: campus fleet, student commute modal split, and employee commute modal split. The report showed that only one vehicle out of 88 vehicles in the campus fleet was a full electric vehicle [18]. Comparing with the recent fleet data from the Sustainability Office, it’s evident that little or no improvement has occurred in this area, hence, the urgent need to begin to implement sustainable transport initiatives (mostly as it concerns the adoption of EVs in the campus fleet) in the university campus. The impact of this will be far-reaching, not just in bagging good ratings but also in advancing sustainability practices in the campus and beyond.
The importance of EV adoption on campus cannot be overemphasized. Hence, this calls for quick actions.
Reasons for a green transport system on campus:
Cost of maintenance
Regarding the cost of maintenance, it is believed that EVs are cheaper to maintain. Most parts of EVs are not movable, which helps to avoid wear and tear when compared with most ICE [19]. Also, there is no oil change, and the most vital parts such as the battery, motor, electronics, brakes (EVs have regenerative breaks, and may not require frequent repairs when compared with that of ICEs), don’t require frequent servicing or change [19]. These are some of the economic and financial benefits of switching to an EV. Though a few people have argued that the maintenance cost in the real world may be high since EVs are relatively new and evolving [20].
Environmental and Public Health Significance
One of the ways of measuring the extent of the impact of GHG (expressed in dollars) is the Social Cost of Carbon (SCC); it measures the impact of one tonne of carbon in a given year and expressed in dollars [21]. SCC expresses in dollar terms what the world will be losing if quick action is not taken regarding the sustainability of the earth, while it also helps policymakers to have a clear picture of impending danger that may arise in the future [22]. One of the major challenges with ICEs is that they emit GHG and dangerous pollutants that affect the environment (health, biodiversity, air quality, etc.). This is a major concern and a strong case for the advocates of the green transport revolution. GHG is also a major culprit in global warming and climate change. Some of these emissions come with significant public health impacts.
Some of these health /medical challenges can be caused by carbon and pollutants from automobile exhaust pipes: cancer, respiratory diseases such as asthma, cardiovascular harm such as heart attack, as well as reproductive and developmental harm, and early death, etc. [19]. Children are most likely to be affected by the deleterious impact of pollution and GHG emission from fossil fuels [23]. Some of the observable effects of climate change/GHG emission in children are heat-related illnesses, mental ill-health, physical trauma, malnutrition, infectious diseases, asthma, etc. [23].
Agriculture and Biodiversity Conservation
GHG emission and climate change can reduce crop yields, resulting in huge loss of billions of dollars, and causing food insecurity in the world. Warmer climates may affect crops and livestock, increase the susceptibility of crops to pathogens, and increase the chances of natural disasters to destroy so many farms and farm settlements [24]. This also affects biodiversity conservation.
Biodiversity conservation is also another concern when the issues of climate change prop up. The existence of many species of plants and animals is constantly being threatened as global temperatures increase and more GHG is emitted [25]. Therefore, an agriculture-dependent economy like that of Saskatchewan (a natural resource-rich province) cannot afford not to act; and in the long run, is expected to immensely benefit from climate change mitigation programs and actions. This can be achieved by pursuing a green revolution agenda, policies, and by deliberately reducing GHG emissions through its actions and laws as this will ultimately enhance sustainable food production in the region and help conserve and preserve species of plants and animals in the region.
Energy Security
The global oil market is a volatile one, and with the constant rising and falling of oil prices, it’s risky to depend on oil for energy. In 2020, the world witnessed a strange event when the price of oil futures hit zero, and further went into a negative price zone for the first time in decades [26]. At this level, the revenue from sales of crude could not cover the production cost [27]. With this level of volatility, no nation should bank on oil for its continuous revenue flow (nations that largely rely on oil and gas revenues are worst exposed to the shocks in the global energy market).
In all, energy has become an essential part of daily living for institutions and communities. Hence, communities and institutions must plan to secure or shield themselves from the uncertainties or volatilities of the global energy market. Adopting EVs will help shield or protect the University of Saskatchewan from the vagaries of unstable oil and gas prices or shocks, while also helping the institution to save cost in terms of money spent in fueling and servicing (oiling).
Social Perspectives (Social Justice)
Considering the health and economic implications of transitioning to EVs, and how GHG emission causes harm to public health and the environment, one can say that GHG emission and climate change pose a serious risk to human life, and if it is the right of humans to have access to good health, life, and quality standard of living- a life that is free from any form of harm, torture or any form of stress or discomfort in the environment, then, there is need to approach climate change from the principles of social justice [28]. With this, it means that when nations, individuals, communities, and institutions take positive efforts towards curbing climate change and reducing GHG emission, they are preserving the rights of the people, and this will, in turn, increase the quality or standard of living not just in that particular environment, but also in the entire world (since climate change is a global issue).
2. Materials and Methods
2.1. Research Method
2.1.1. Data Collection and Data Cleaning
Fleet data (secondary data source) was supplied by the partner organization (the University of Saskatchewan) and was further worked on to suit the analysis and the analytical tool. Table 1 represents the clean dataset for the campus fleet: 91 ICEs exist in the fleet. 2 vehicles in the fleet use diesel as fuel, while 89 use gasoline.
From the number of liters supplied, the average kilometer traveled in a year was calculated using the fuel consumption rating expressed in Liter/100Kilometers.
The data on fuel consumption rating was derived from the government of Canada website [29]
Liter of fuel used or issued = L (expressed in liters)
Fuel consumption rating of the ICE = Y (expressed in liter/100Km). This is unique for each vehicle model or spec.
Number of kilometers covered by the ICE (expressed in kilometers) = Z
Hence Z (number of kilometers covered by a particular vehicle in the fleet) = L*100/Y = Average kilometer traveled by a particular vehicle in the fleet.
Note that this is based on the assumption that the vehicles have not lost their minimum efficiency as of the time of calculation.
2.2. Modelling using RETScreen Expert
The RETScreen® Clean Energy Management Software is a renewable energy technology software developed by the government of Canada for modeling diverse renewable energy projects. The software is effective for planning, implementation, monitoring, and reporting renewable energy projects of diverse scales [30]. The premium version of this software is called, RETScreen Expert. This version was deployed during the course of this project.
2.2.1. Brief Description of RETScreen Expert
RETScreen Expert has some interesting features that make it unique for renewable energy feasibility analysis while considering location, cost (financial and economic factors), risk, technology, and other important factors or variables that may be useful in renewable energy technology (RET) assessment or study.
Diverse projects can be analyzed using the RETScreen Expert software. Such projects are centered on these modules:
- Power Plants
- Power, Heating, Cooling
- Industrial
- Commercial/Institutional
- Residential
- Agriculture
- Individual Measure
- Transportation
- User-Defined.
Our analysis was centered on the Transport Module. A feasibility analysis was centered on Location, Energy, Cost, and Finance, within the transportation module.
In analyzing energy under the transportation module, diverse variables such as vehicle type, distance covered, fuel type, fuel consumption, the amount saved on transitioning to the renewable energy transport system, efficiency, and cost are considered. With this, one can easily infer/predict performance and also have an idea of the feasibility of the project.
Location: with the help of satellite data, RETScreen can pick global locations and pick up the weather data and all essential data for such locations.
In terms of finance and economics, the cost is quite an important factor or variable. Majorly because it determines how feasible the project may be, and how investors, banks, and the users will perceive the viability of the project.
3. Results
This model has captured some key parameters that determine the viability of a project like this. One of such is the cash flow. Granted, it’s observed that despite the huge capital outlay (initial cost of purchase) required for this project, a positive cash flow of $72,054 was realized in year 1 of the project. This shows the strong viability of this project. Although, when the cumulative cash flow is considered, the project seems to yield positive cash flow in year 5, which is also a good one for a project of this type.
A very interesting parameter to be considered again in this project is the payback period. The simple payback period will be achieved within 4.6 years, and an equity payback period will be realized within 4.7 years. This is also a good result for this type of project. It means that the project can pay back its initial cost within 5 years. Although, this is expected to be lesser if the EVs are put into active use (minimizing idle times as much as possible).
Considering the IRR (internal rate of return), this typifies the growth rate that a project or investment is expected to generate in a year, or simply put the investment returns. The higher the IRR, the more viable the project. With an IRR of over 30%, this project is expected to be a viable one. Also, considering the NPV (net present value), which expresses, the time value of money (TVM), it can be seen that the NPV of the project is positive. As such a positive NPV means a viable project.
Another interesting parameter is the total annual savings and revenue. For this project, it stands at $160,140. This represents huge savings for the University of Saskatchewan. This savings results from fuel cost savings of $145,234, and GHG reduction revenue of $14,906 (this may be higher if the proposed policy of carbon price of $170/tCO₂ is considered (this policy is expected to come into effect by 2030) [31]. In all, this project will reduce energy consumption by 85.7%, and fuel cost by 88.9%. This is huge when you consider the impact it will create on the financials/savings of the fleet manager.
Furthermore, a great consideration as it concerns the significant impact of the projects is that this project will take out 298 tCO₂/year from the campus. And in 12 years it will take out 3,577 tCO₂ of carbon from the campus. Considering the effect of CO₂ in the environment (public health impact), as well as its contribution to climate change and global warming, it is so clear that the impact of this project will be enormous.
In all, looking at the Benefit-Cost- Ratio (BCR) of the project, which is 3.7, it clearly shows that the benefit of this project is much bigger than the cost: a BCR value of more than one (1) is a clear indication that that project is viable, and its benefit is bigger than the cost of the project.
Therefore, looking at all these key parameters, it can be concluded that the project is viable.
Highlights of Key Parameters/Variables
Fuel Cost Savings: considering the average retail gas price in Saskatoon to be CAD 1.2 [32] switching to EVs will save the fleet manager $129,049 in total savings (please see attached RETScreen report).
GHG Reduction Credit: this has been set at $20 for 2019, and to annually increase by $10/annum till it reaches $50/t/kgCO2 by 2022 [33]. The Prime Minister of Canada, Justin Trudeau, also plans to hike carbon price to C$170 per metric ton by 2030, which may bring gas price to more than 38 Canadian cents within the next 10 years [31]. Hence, when we further insert this hike in carbon levy into our model, we could have a payback period reduced to 2 years, and the university earning more from the GHG reduction credit. Overall, in the long run, when we put all these variables into consideration, the project stands out as a viable project with great prospects.
Road-Use Fee: considering that Saskatchewan Province will be charging $150 as the road-use fee on all EVs (this is expected to kick in by October 2021), this is one of the cost elements considered in the model [34]. This fee is charged as cost of highway maintenance by the Saskatchewan government. This results in a total cost of $12,750
Federal Incentives: also, a $5,000 federal government incentive on EV purchase was considered as a credit [35]. This produces total incentives and grants of $425,000.
Initial Cost: considering all these, an initial cost of $2,867,750 is required to switch to EVs, and this sum is expected to be financed at 3 %/annum. There is a possibility of getting zero-interest financing in Canada. For instance, the Canadian government has budgeted C$15 billion for green projects/initiatives that enhance decarbonization, and this is being channeled through the Canada Infrastructure Bank [31]. This project can be financed through such an arrangement, or even through a blended finance structure (a mix of corporate debt and subsidized credit from development finance institutions (DFIs) or grants).
Fuel Escalation Rate:
Fuel escalation rate is a measure of the changes in the cost of fuel in Saskatchewan. Escalation rate measures the degree of change in the price of a particular good or service. It is calculated by subtracting the initial cost from the present cost, divided by the initial cost, and multiplied by 100.
For Saskatchewan in 2020 [32] it was calculated thus:
Starting price as of January 2020 = 1.261
Closing price as of December 2020 = 1.32
Hence, escalation price is 1.32-1.211/1.211 = 0.059*100 = 9%
Inflation Rate: taking the 2020 average inflation rate in Saskatchewan to be 0.62% [36]. This value is used to model this project as it concerns inflation.
O&M Savings: the total savings as it concerns O&M (Operating and Maintenance) cost when switching to an EV over the lifecycle (which varies and depends on the EV type as well as other factors) of that EV is $4,600 [37].
Debt Interest Rate: the debt interest rate is set at 3%; though the average debt rate in Canada is between 3% and 6% for someone who has a good credit rating, and there are possibilities of having a 0% discount, mostly for manufacturers who want to attract more buyers [38].
Debt Term: this is the duration for servicing the debt before total pay down. This is stated as 4 years (which is usually the conventional debt term for vehicle finance lease)
Debt Ratio: this entails and implies the percentage (60%) of the total debt that the financier will be contributing, while the University of Saskatchewan will finance 40%.
Cash Flow: Figure 4 shows that positive cash flows are observable from year 5, though cumulative cash flow comes to positive from year 1
Simple Payback Period (PBP)
The simple payback period is at 5.3 years. Although for an EV, the ideal payback period is between 2 to 3 years, this is more realizable for EVs that are high-mileage driven (active usage for Bolt and Lyft services for example) [39]. So, the fleet manager can achieve quick PBP if he plans to put the EVs in more active use. This means that few vehicles can be purchased so that the available vehicles can be put into maximum/more active use.
Note that these are variables that can be changed/altered to suit a particular scenario or model.
4. Discussion
From the analysis, we can see that it is a profitable investment/venture, seeing that our financial ratios are looking good, and the project should be ‘’in the money’’ within 5 years. For instance, the cumulative cash flow became positive in the first year. Also, the PBP kicked in within 5 years. The Benefit-Cost- Ratio (BCR) is 3.7 being higher than one, which signifies that the project has a positive net present value- NPV. This shows that the benefit of the project far outweighs its cost implications. Also, the IRR (internal rate of return) represents the returns that the investment should make in a year. An IRR of 30.9% is a good one. This, therefore, proves that the project is a profitable one. The NPV for this project is positive, and as such, the project is profitable. Annual lifecycle savings is $312,498. Also, GHG reduction revenue is $14,906 in 4 years.
With these parameters pointing northwards, the Sustainability Office, the campus, and the entire university community will benefit immensely from this project, and as such, this project should be vigorously pursued.
Regarding the huge initial cost, which could be a major challenge, it is recommended that engaging a credit provider or financier that can finance the entire project with the Sustainability Office not having to make any equity contribution will be most ideal. This will reduce the initial burden of contributing so much equity. Also, it will be most profitable and appropriate to source for financiers who offer zero interest rates. This will further increase the profitability of the project.
One important consideration that should also be made regarding the huge initial capital outlay and the cost of the initial project capital, is leveraging cheap funds from the government, as well as grants. Since the government has made available diverse grants and cheap funds for green projects, the Sustainability Office should consider these cheap sources of funds before thinking of corporate loans or credits, which are usually costlier. This will help reduce the burden of paying back the loans, reducing the payback period, increasing cash flow, and generally enhancing the profitability of the project and the BCR of the project. A typical fund to be considered is that being offered by the federal government through the Canada Infrastructure Bank [31].
One key recommendation is that the vehicles in the fleet should be put into more active use (covering higher mileage), as this will help reduce the payback period to 2 years, thereby creating more benefits for the project [39].
Looking at the money saved from fuel, and the money earned from carbon credits, as well as the quantity of carbon, this project will remove global carbon emissions (298 tonnes),which indicates that this project is feasible and viable, and thus, should be implemented.
Funding
This research received no external funding.
Data Availability Statement
via University of Saskatchewan.
Acknowledgments
Support from the Sustainability Office at the University of Saskatchewan.
Conflicts of Interest
The authors declare no conflict of interest. The funders had no role in the design of the study; in the collection, analyses, or interpretation of data; in the writing of the manuscript; or in the decision to publish the results.
References
- R. Sims and e. al., "Contribution of Working Group III to the Fifth Assessment Report of the Intergovernmental Panel on Climate Change.," in Climate Change 2014: Mitigation of Climate Change., Cambridge University Press., 2014.
- X. Li, P. Chen and X. Wang, "Impacts of renewables and socioeconomic factors on electric vehicle demands – Panel data studies across 14 countries.," Energy Policy, Vols. (Vol. 109, pp. 473–478)., 2017.
- "National Inventory Report 1990 –2019: Greenhouse Gas Sources and Sinks in Canada: Canada’s Submission to the United Nations Framework Convention on Climate Change.," Environment and Climate Change Canada., 2021. [Online]. Available: https://publications.gc.ca/collections/collection_2021/eccc/En81-4-1-2019-eng.pdf.
- Oteh, N. Vandycke and M. Duarte, "Transition towards sustainable mobility – Where is the financing?," World Bank, 2021. [Online]. Available: https://blogs.worldbank.org/transport/transition-towardssustainable-mobility-where-financing.
- "GM Plans To Phase Out Gas And Diesel Cars By 2035 - Forbes Wheels.," Forbes, 2021. [Online]. Available: https://www.forbes.com/wheels/news/gm-phase-out-gas-diesel-cars-2035/.
- "Global Infrastructure Outlook - A G20 INITIATIVE.," 30 June 2021. [Online]. Available: https://outlook.gihub.org/.
- C. A. R. Board, "Advanced Clean Trucks Fact Sheet, California Air Resources Board.," 2020. [Online]. Available: https://ww2.arb.ca.gov/resources/fact-sheets/advanced-clean-trucks-fact-sheet.
- "Growing momentum: Global overview of government targets for phasing out sales of new internal combustion engine vehicles," International Council on Clean Transportation., 2020. [Online]. Available: https://theicct.org/blog/staff/global-ice-phaseout-nov2020.
- M. Coren, "Nine countries say they’ll ban internal combustion engines — Quartz.," Quartz., 2018. [Online]. Available: https://qz.com/1341155/nine-countries-say-they-will-ban-internal-combustion-engines-none-have-a-law-to-do-so/.
- "Business Ambition for 1.5°C - Science Based Targets.," 3 July 2021. [Online]. Available: https://sciencebasedtargets.org/business-ambition-for-1-5c.
- M. Ralph and W. Stubbs, "Integrating environmental sustainability into universities.," Higher Education, vol. 67, no. 1, p. 71–90, 2014.
- L. Sharp, "Higher education: the quest for the sustainable campus," Sustainability: Science, Practice and Policy, vol. 5, no. 1, pp. 1-8, 2009.
- University of Toronto Electric Vehicle (UTEV) Research Centre, Electrical & Computer Engineering.
- University of Guelph, "New Electric Vehicle Chargers Coming to the University of Guelph," 2020. [Online]. Available: Canada.Ca. Victor, 2018.
- University Of Saskatchewan, "University Of Saskatchewan Greenhouse Gas Emissions Inventory.," [Online]. Available: https://sustainability.usask.ca/about-us/2019-greenhouse-gas-inventory-report-final---pages.pdf. [Accessed 17 July 2021].
- University of Saskatchewan, "International Plan - University Plan 2025," University of Saskatchewan, . [Online]. Available: https://plan.usask.ca/international/.
- University of Saskatchewan, OP-14: Campus Fleet | University of Saskatchewan | Scorecard | Institutions | STARS Reports., 17 July 2021 2013. [Online]. Available: https://reports.aashe.org/institutions/university-of-saskatchewan-sk/report/2013-01-18/OP/transportation/OP-14/.
- Malmgren, "EVS29 International Battery, Hybrid and Fuel Cell Electric Vehicle Symposium Quantifying the Societal Benefits of Electric Vehicles.," World Electric Vehicle Journal, vol. 8, p. 996–1007, 2016.
- C. Harto, "Electric Vehicle Ownership Costs: Chapter 2-Maintenance.," 2020. [Online]. Available: https://theicct.org/sites/default/files/publications/EV_cost_2020_2030_20190401.pdf.
- EPA, "Social Cost of Carbon," Epa Fact Sheet., 2016. [Online]. Available: https://www.whitehouse.gov/omb/oira/social-cost-of-carbon.
- Backman, "Professors explain the social cost of carbon | Stanford News.," Stanford., 2021. [Online]. Available: https://news.stanford.edu/2021/06/07/professors-explain-social-cost-carbon/.
- F. P. Perera, "Multiple threats to child health from fossil fuel combustion: Impacts of air pollution and climate change.," Environmental Health Perspectives, vol. 125, no. 2, p. 141–148, 2017.
- "How climate change threatens public health ," Yale Climate Connections., 20 July 2021. [Online]. Available: https://yaleclimateconnections.org/2019/08/how-climate-change-threatens-public-health/.
- N. Shahbol, T. Lovejoy and H. Lee, "2017," Climate Change and Biodiversity: Conservation | Request PDF. ReserachGate., [Online]. Available: https://www.researchgate.net/publication/317927439_Climate_Change_and_Biodiversity_Conservation.
- U.S. Energy Information Administration (EIA), "Crude oil prices briefly traded below $0 in spring 2020 but have since been mostly flat - Today in Energy," 2021. [Online]. Available: https://www.eia.gov/todayinenergy/detail.php?id=46336.
- T. &. A. N. Gould, "The global oil industry is experiencing a shock like no other in its history – Analysis - IEA.," IEA, 2020. [Online]. Available: https://www.iea.org/articles/the-global-oil-industry-is-experiencing-shock-like-no-other-in-its-history.
- M. Wewerinke, V. Paolo and Y. Iii, "Addressing Climate Change Through Sustainable Development and the Promotion of Human Rights.," South Centre, 2010.
- Government of Canada, "Fuel Consumption Ratings - Open Government Portal," 2020. [Online]. Available: www.canada.ca.
- RETScreen, RETScreen, 21 July 2021. [Online]. Available: https://www.nrcan.gc.ca/maps-tools-and-publications/tools/modelling-tools/retscreen/7465.
- T. Argitis, "Trudeau Hikes Carbon Tax in Bid to Reach 2030 Climate Goal - Bloomberg.," Bloomberg, 2020. [Online]. Available: https://www.bloomberg.com/news/articles/2020-12-11/trudeau-hikes-carbon-tax-positions-canada-to-hit-climate-goal.
- "Average Retail Price for Premium Unleaded Gasoline at Self Service Filling Stations. Saskatoon, SK," 22 July 2021. [Online]. Available: https://ycharts.com/indicators/saskatoon_sk_average_retail_price_for_premium_unleaded_gasoline_at_self_service_filling_stations.
- "Canada Gazette Part I," Canada Gazette Part I, 2020. [Online]. Available: https://canadagazette.gc.ca/rp-pr/p1/2021/2021-03-06/pdf/g1-15510.pdf#page=110.
- Government of Saskatchewan, "New Annual Fee Of $150 On Electric Vehicles," News and Media, 2021. [Online]. Available: https://www.saskatchewan.ca/government/news-and-media/2021/april/20/new-annual-fee-of-$150-on-electric-vehicles.
- "CER," CER – Market Snapshot: Growing electric vehicle incentives in Canada., 16 July 2021. [Online]. Available: https://www.cer-rec.gc.ca/en/data-analysis/energy-markets/market-snapshots/2018/market-snapshot-growing-electric-vehicle-incentives-in-canada.html.
- InflationCalculator, "CPI and Inflation Rates for Saskatchewan | Inflation Calculator. (n.d.).," 2020. [Online]. Available: https://inflationcalculator.ca/2020-cpi-and-inflation-rates-for-saskatchewan/.
- B. Preston, Pay Less for Vehicle Maintenance With an EV - Consumer Reports., 2020. [Online]. Available: https://www.consumerreports.org/car-repair-maintenance/pay-less-for-vehicle-maintenance-with-an-ev/.
- R. MacDonnell, " What Kind of Interest Rates Should You Expect? Car Reviews Canada, New & Used Automotive News and Tips," Go Auto, 2019. [Online]. Available: https://www.goauto.ca/blog/credit-score-interest-rates-canada.
- McKinsey, "Improving electric vehicle economics," 2019. [Online]. Available: https://www.mckinsey.com/industries/automotive-and-assembly/our-insights/making-electric-vehicles-profitable.
- Saskatchewan, University of, Climate Action - Office of Sustainability, 17 July 2021. [Online]. Available: https://sustainability.usask.ca/footprint/climate-action.php#RelevantLinks.
- Government of Canada, "New Electric Vehicle Chargers Coming to the University of Guelph - Canada.ca.," University of Guelph - Canada.ca, 2020. [Online]. Available: https://www.canada.ca/en/natural-resources-canada/news/2020/10/new-electric-vehicle-chargers-coming-to-the-university-of-guelph.html.
- University of Toronto Electric Vehicle (UTEV) Research Centre | Electrical & Computer Engineering. (n.d.)., [Online]. Available: https://www.ece.utoronto.ca/research/centres/university-toronto-electric-vehicle-utev-research-centre/. [Accessed 16 July 2021].
Figure 1.
Smart Transportation Market, by region (in USD billion). Source: [4].
Figure 1.
Smart Transportation Market, by region (in USD billion). Source: [4].
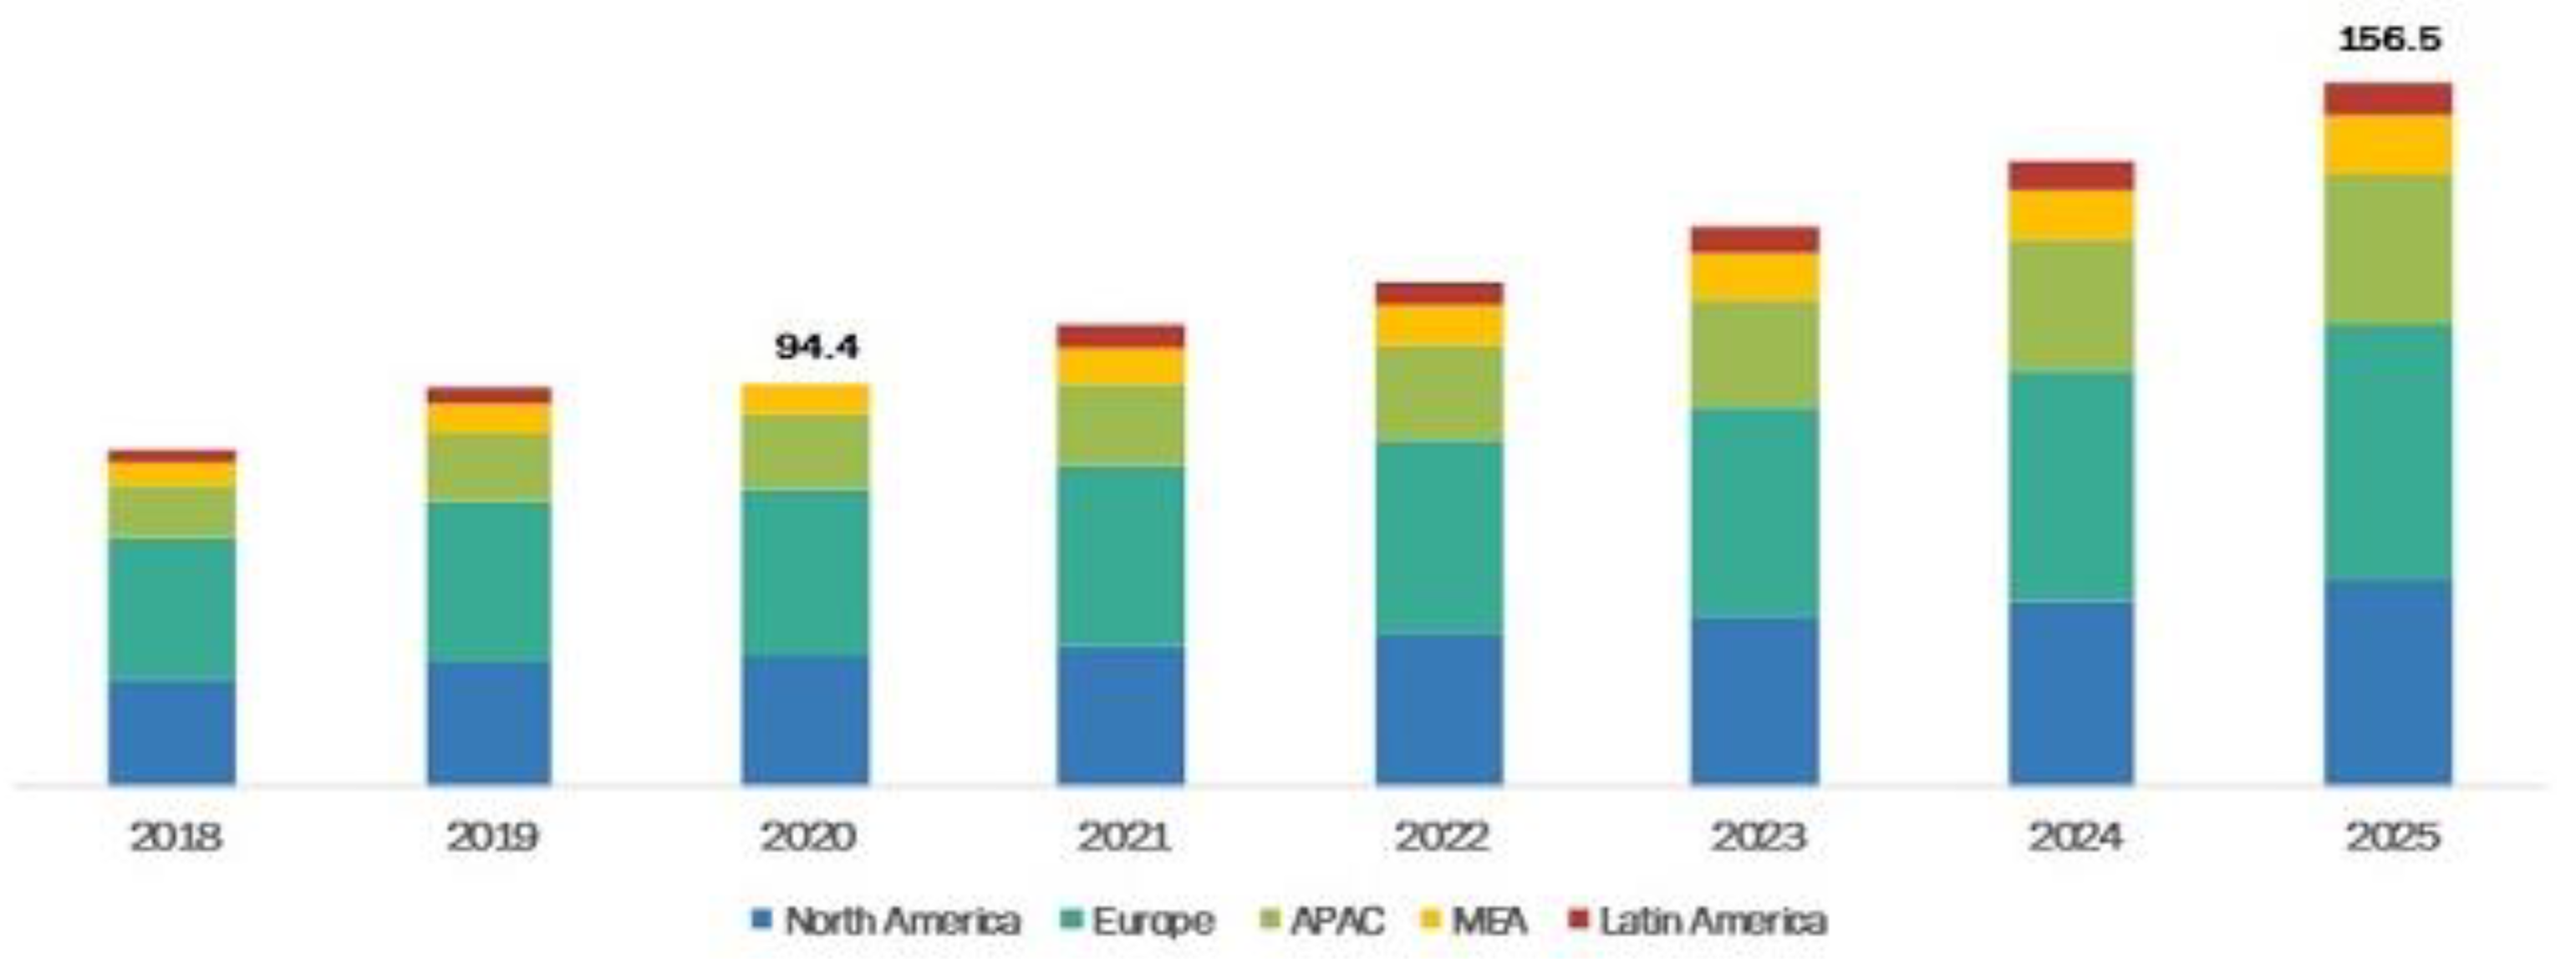
Figure 2.
GHG emission by scope at the campus of the University of Saskatchewan. Source: [16].
Figure 2.
GHG emission by scope at the campus of the University of Saskatchewan. Source: [16].
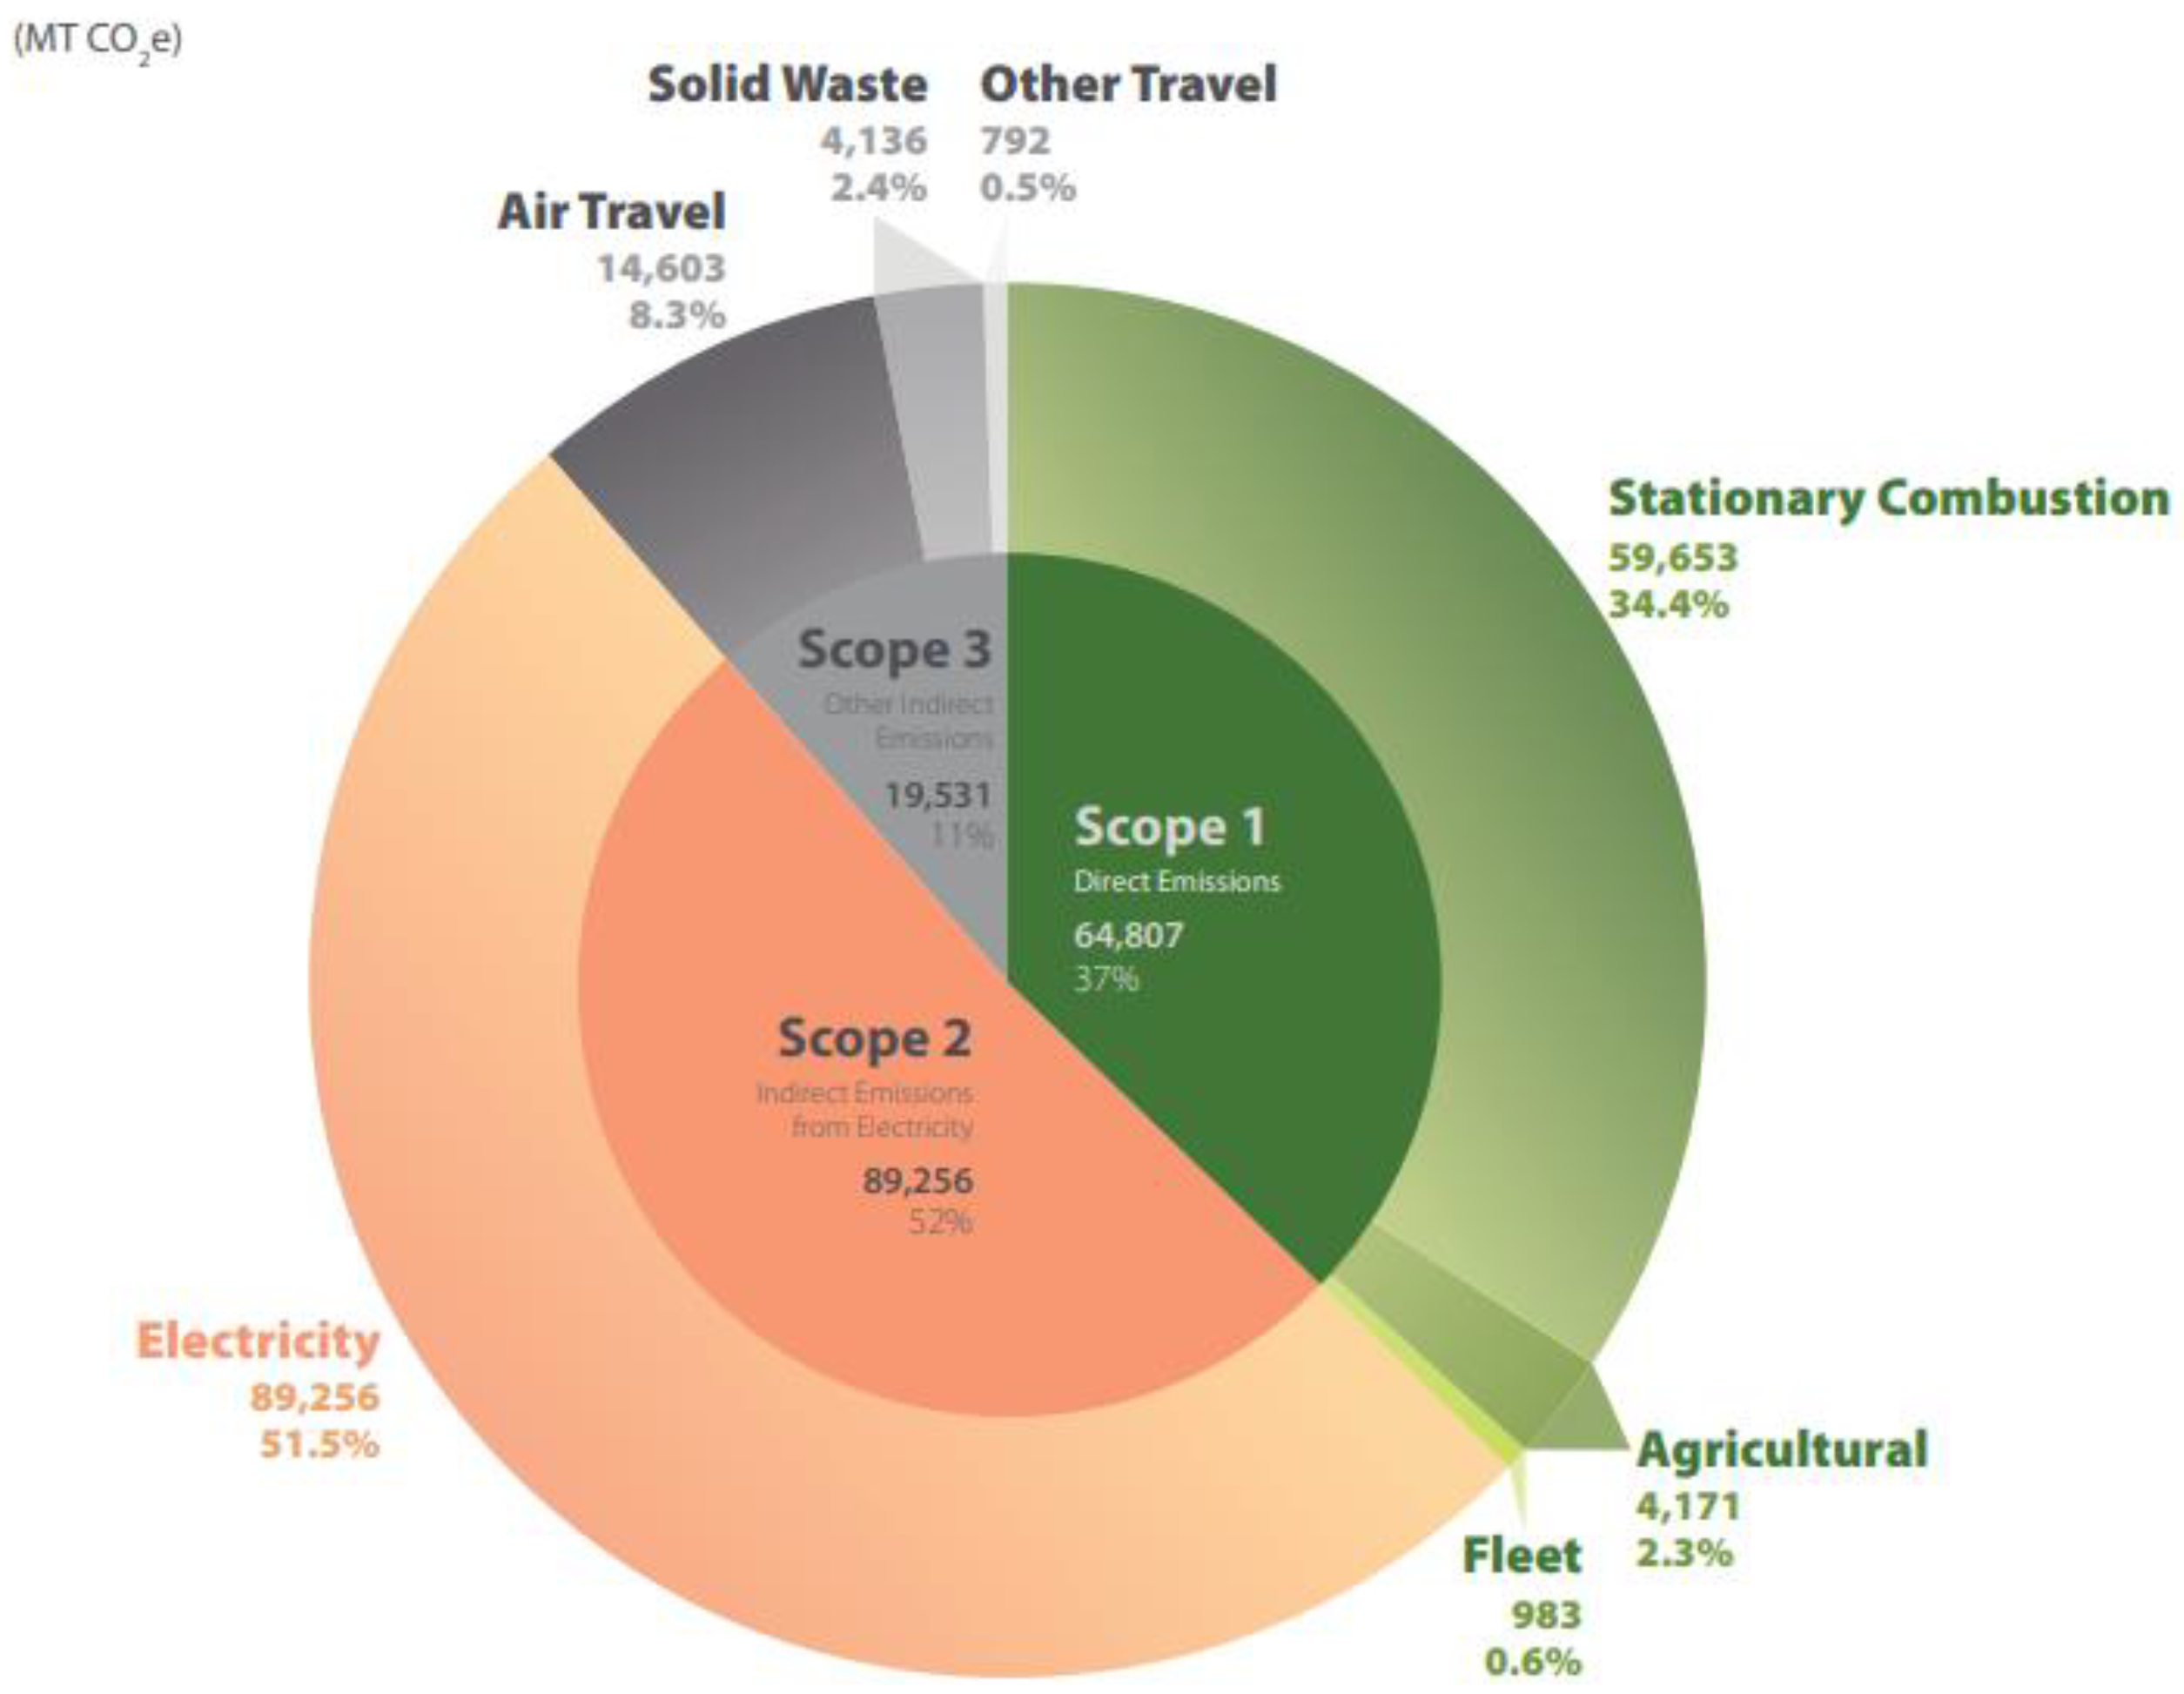
Figure 3.
Climate Action Plan Strategies and Initiatives recommended for the University of Saskatchewan, towards achieving GHG mitigation. Source: [16].
Figure 3.
Climate Action Plan Strategies and Initiatives recommended for the University of Saskatchewan, towards achieving GHG mitigation. Source: [16].
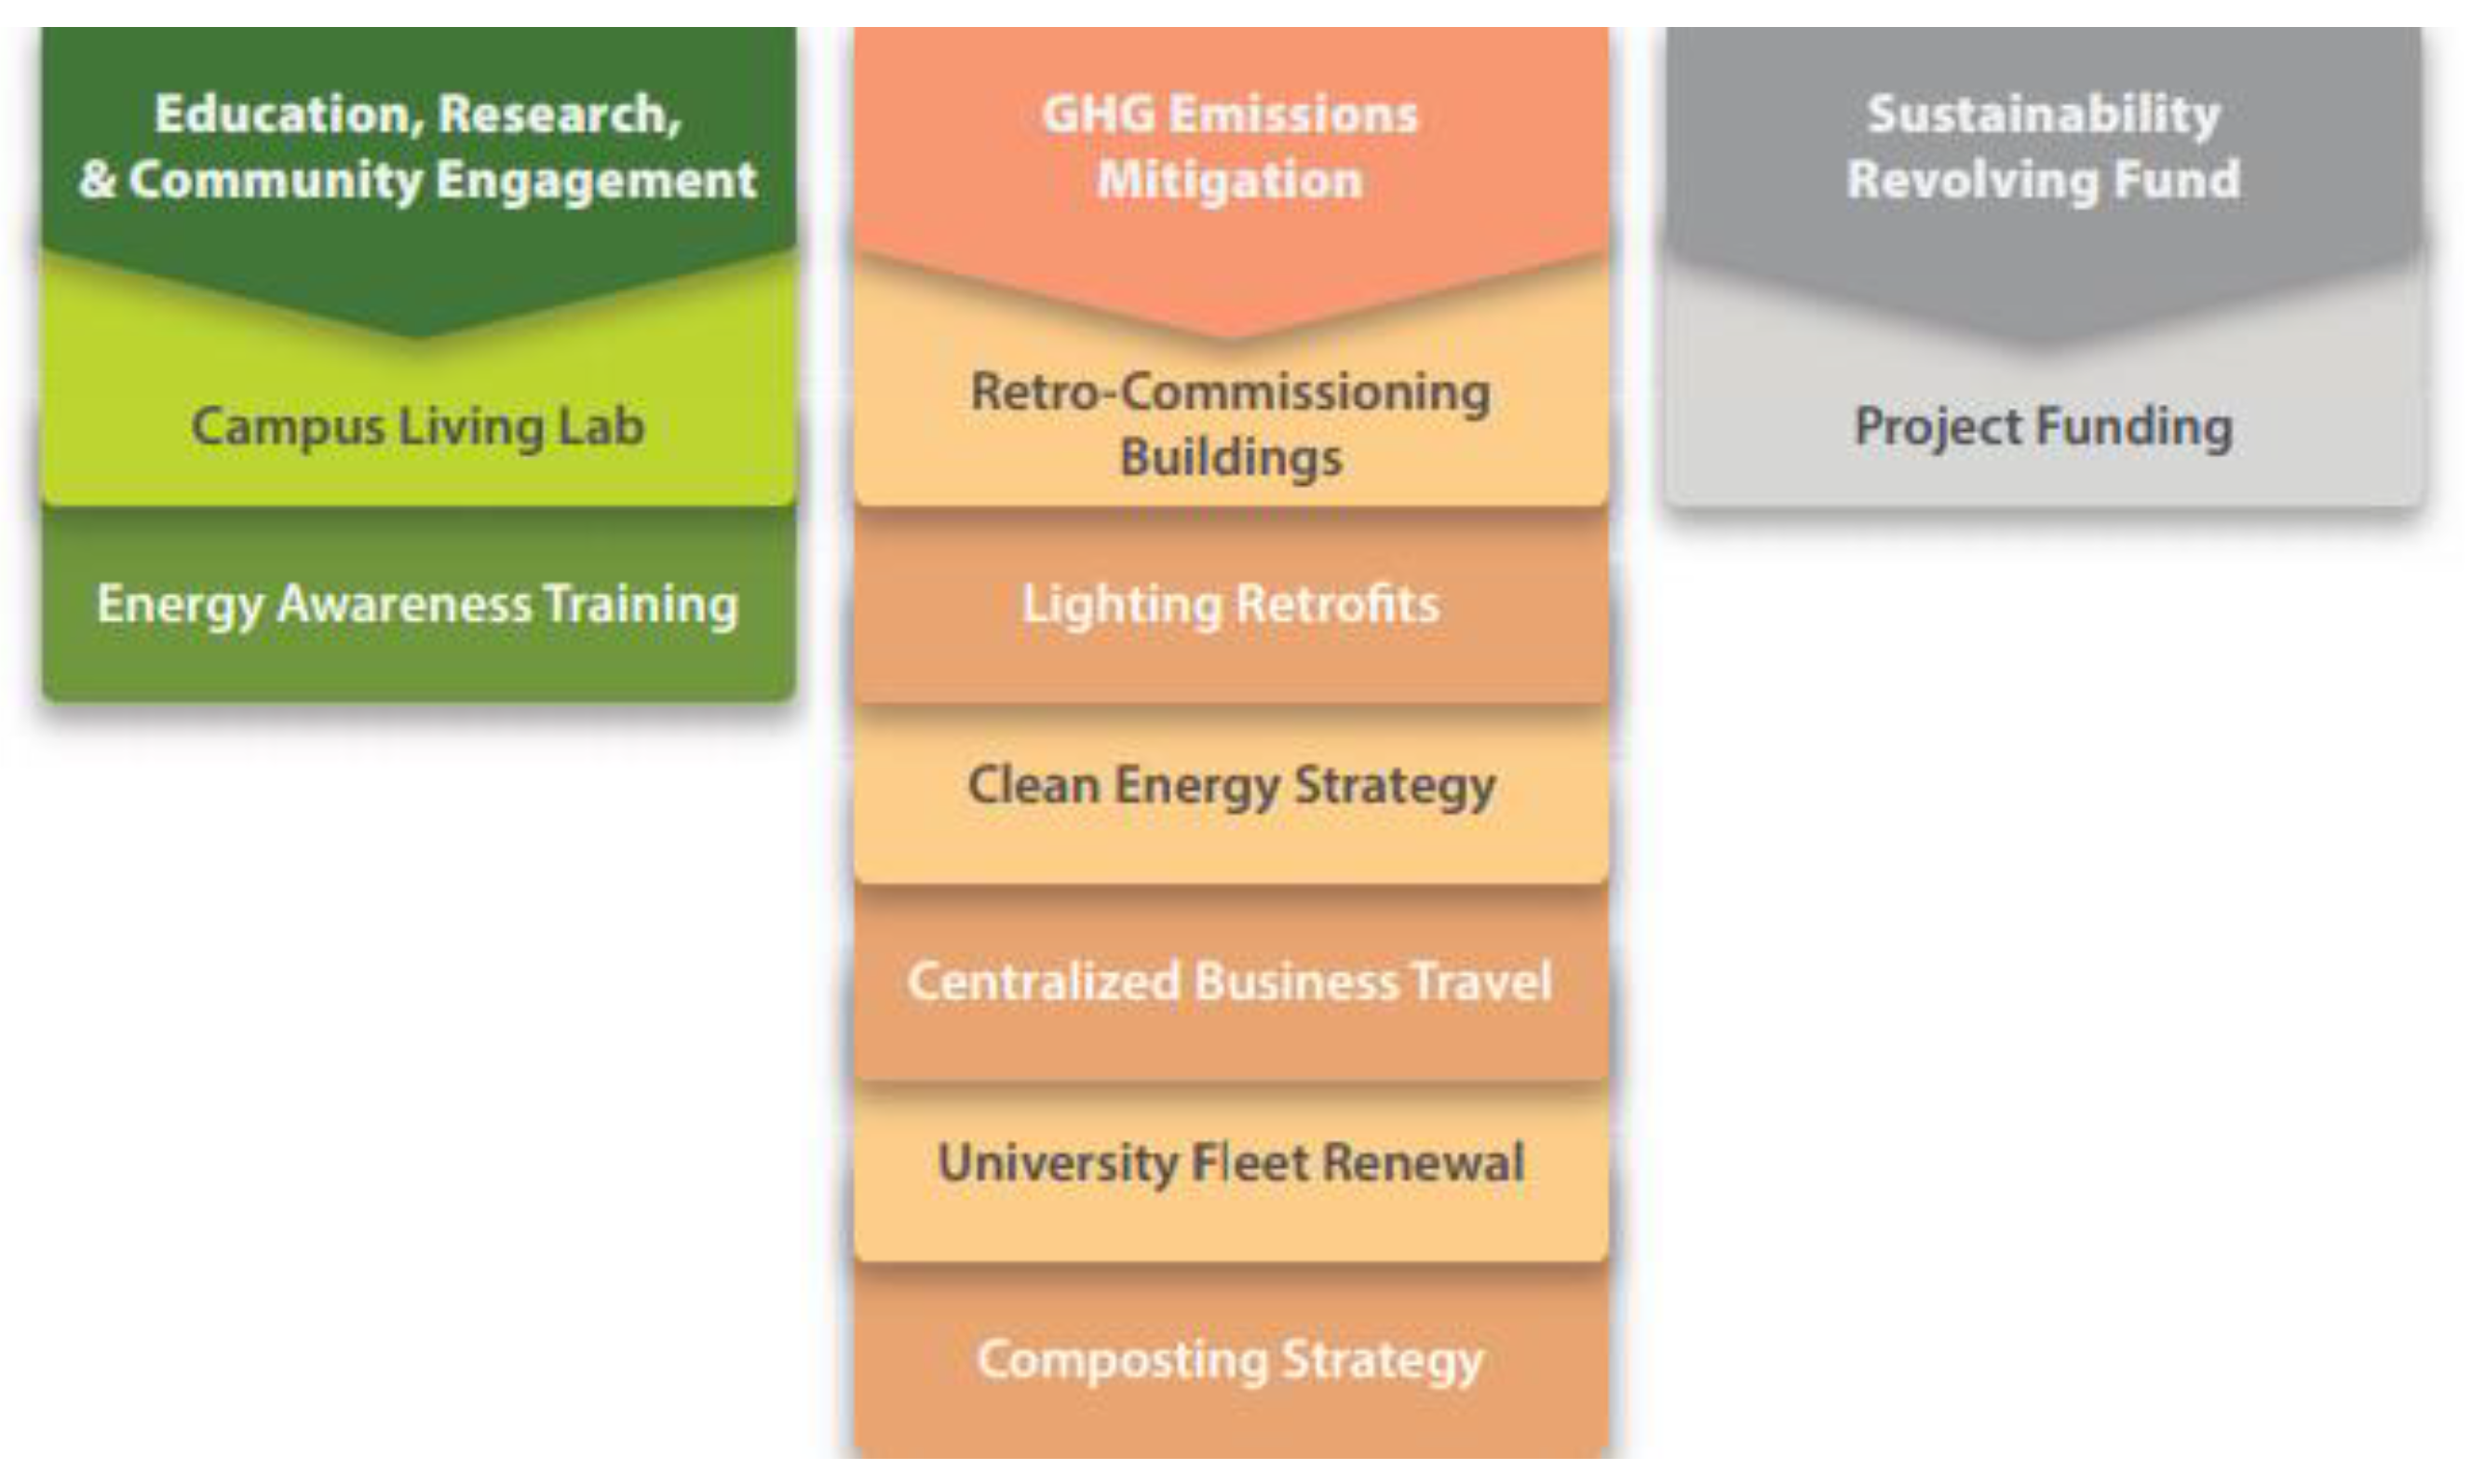
Figure 4.
a graphical representation of cash flow model for the project.
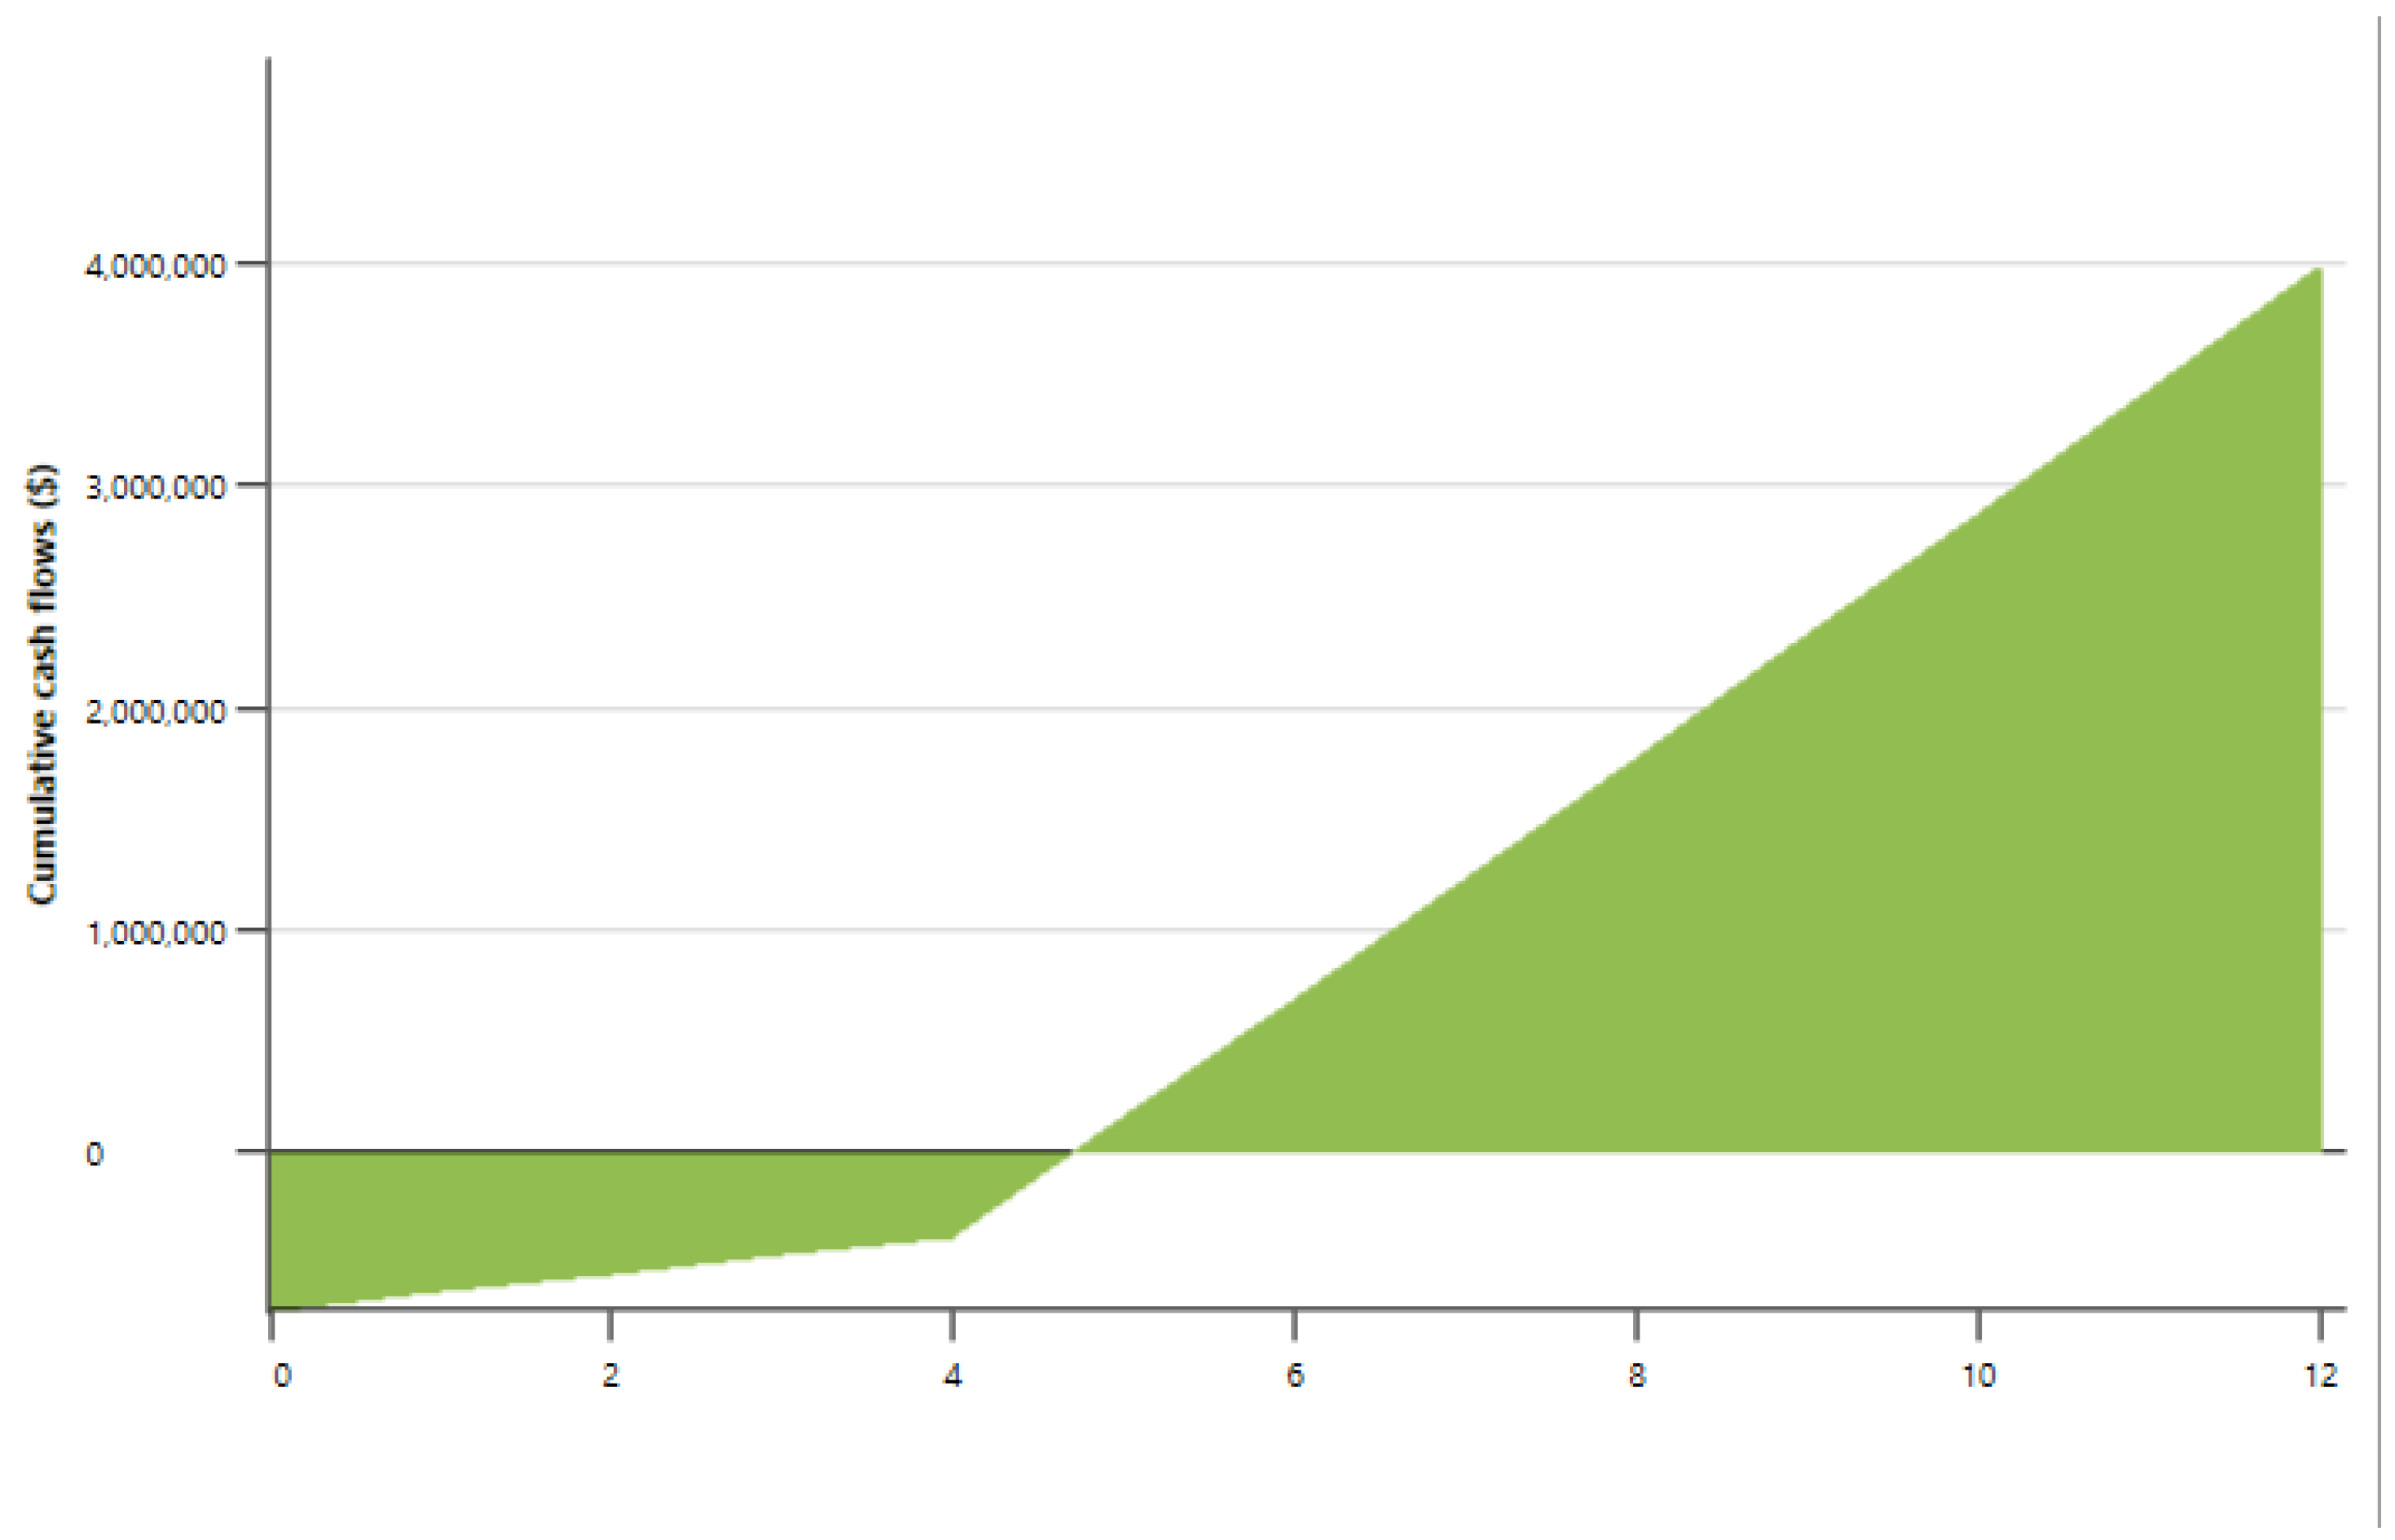

Table 1.
Dataset for the University of Saskatchewan campus fleet. Source: the Sustainability Office of the University of Saskatchewan.
Table 1.
Dataset for the University of Saskatchewan campus fleet. Source: the Sustainability Office of the University of Saskatchewan.
| Vehicle Type | FLEET | TYPE | STATE | FUEL | Litre | Avg km travelled | kW/h | Litre/ 100Km |
|---|---|---|---|---|---|---|---|---|
| 2001 CHEVROLET S-10 1/4 TON TRUCK | FLEET | TRUCK | ACTIVE | Gasoline | 342 | 2,407 | 3184.94 | 14.2 |
| 2002 DODGE ST2500 4X2 QUAD CAB WITH VAN BODY | FLEET | TRUCK | ACTIVE | Gasoline | 942 | 4,400 | 8772.55 | 21.4 |
| 2002 FORD E150 1/2 TON CARGO VAN | FLEET | VAN | ACTIVE | Gasoline | 328 | 1,795 | 3054.56 | 18.3 |
| 2002 FORD E152 CARGO VAN PACKAGE | FLEET | VAN | ACTIVE | Gasoline | 419 | 2,291 | 3902.02 | 18.3 |
| 2002 FORD E152 CARGO VAN PACKAGE | FLEET | VAN | ACTIVE | Gasoline | 298 | 1,627 | 2775.18 | 18.3 |
| 2002 FORD E152 CARGO VAN PACKAGE | FLEET | VAN | ACTIVE | Gasoline | 290 | 1,583 | 2700.68 | 18.3 |
| 2002 FORD E152 CARGO VAN PACKAGE | FLEET | VAN | ACTIVE | Gasoline | 305 | 1,669 | 2840.37 | 18.3 |
| 2002 FORD SUPER DUTY F-450 REGULAR CHASSIS CAB 4 X | FLEET | TRUCK | ACTIVE | Gasoline | 735 | 7,002 | 6844.83 | 10.5 |
| 2003 FORD E152 CARGO VAN | FLEET | VAN | ACTIVE | Gasoline | 382 | 2,034 | 3557.45 | 18.8 |
| 2003 FORD E152 CARGO VAN | FLEET | VAN | ACTIVE | Gasoline | 521 | 2,770 | 4851.91 | 18.8 |
| 2003 FORD E152 CARGO VAN | FLEET | VAN | ACTIVE | Gasoline | 418 | 2,225 | 3892.7 | 18.8 |
| 2003 FORD E152 CARGO VAN | FLEET | VAN | ACTIVE | Gasoline | 582 | 3,094 | 5419.98 | 18.8 |
| 2004 FORD E150 CARGO VAN | FLEET | VAN | ACTIVE | Gasoline | 254 | 1,458 | 2365.42 | 17.4 |
| 2004 FORD E150 VAN | FLEET | VAN | ACTIVE | Gasoline | 170 | 974 | 1583.16 | 17.4 |
| 2004 FORD E150 VAN | FLEET | VAN | ACTIVE | Gasoline | 258 | 1,483 | 2402.67 | 17.4 |
| 2004 GMC EXPRESS COMMERCIAL CUTAWAY VAN | FLEET | VAN | ACTIVE | Gasoline | 440 | 2,416 | 4097.58 | 18.2 |
| 2005 CHEV HD SILVERADO 3/4 TON TRUCK | FLEET | TRUCK | ACTIVE | Gasoline | 613 | 3,294 | 5708.68 | 18.6 |
| 2005 CHEV SILVERADO 1 TON TRUCK | FLEET | TRUCK | ACTIVE | Gasoline | 614 | 3,303 | 5717.99 | 18.6 |
| 2006 CHEV EXPRESS CARGO 1/2 TON VAN | FLEET | VAN | ACTIVE | Gasoline | 287 | 1,579 | 2672.74 | 18.2 |
| 2006 CHEV EXPRESS CARGO 1/2 TON VAN | FLEET | VAN | ACTIVE | Gasoline | 690 | 3,790 | 6425.76 | 18.2 |
| 2006 DODGE DAKOTA CLUB CAB TRUCK | FLEET | TRUCK | ACTIVE | Gasoline | 240 | 1,570 | 2235.05 | 15.3 |
| 2006 FORD E150 CARGO VAN | FLEET | VAN | ACTIVE | Gasoline | 264 | 1,500 | 2458.55 | 17.6 |
| 2007 DODGE CARAVAN CARGO VAN | FLEET | VAN | ACTIVE | Gasoline | 468 | 3,418 | 4358.34 | 13.7 |
| 2007 FORD E150 1/2 TON VAN | FLEET | VAN | ACTIVE | Gasoline | 219 | 1,182 | 2039.48 | 18.5 |
| 2007 FORD FREESTAR VAN | FLEET | VAN | ACTIVE | Gasoline | 80 | 512 | 745.012 | 15.6 |
| 2007 STERLING ACTERRA 3 TON DUMP TRUCK | FLEET | TRUCK | ACTIVE | Diesel | 1,373 | 4,429 | 31.8 | |
| 2008 CHEV EXPRESS 1/2 TON CARGO VAN | FLEET | VAN | ACTIVE | Gasoline | 293 | 1,863 | 2728.62 | 15.7 |
| 2008 CHEV EXPRESS 1/2 TON CARGO VAN | FLEET | VAN | ACTIVE | Gasoline | 511 | 3,255 | 4758.78 | 15.7 |
| 2008 CHEV EXPRESS 1/2 TON CARGO VAN | FLEET | VAN | ACTIVE | Gasoline | 637 | 4,058 | 5932.18 | 15.7 |
| 2008 CHEV EXPRESS 1/2 TON CARGO VAN | FLEET | VAN | ACTIVE | Gasoline | 106 | 675 | 987.145 | 15.7 |
| k2008 CHEV UPLANDER | FLEET | VAN | ACTIVE | Gasoline | 61 | 414 | 568.07 | 14.7 |
| 2008 FORD 1/4 TON RANGER XL TRUCK | FLEET | TRUCK | ACTIVE | Gasoline | 627 | 4,934 | 5839.06 | 12.7 |
| 2008 STERLINE 360 COE30 CAB & CHASSIS | FLEET | TRUCK | ACTIVE | Diesel | 929 | 2,921 | 31.8 | |
| 2009 CHEV EXPRESS 1500 1/2 TON CARGO VAN | FLEET | VAN | ACTIVE | Gasoline | 656 | 4,175 | 6109.12 | 15.7 |
| 2009 CHEV EXPRESS 1500 1/2 TON CARGO VAN | FLEET | VAN | ACTIVE | Gasoline | 199 | 1,269 | 1853.23 | 15.7 |
| 2009 CHEV EXPRESS 1500 1/2 TON CARGO VAN | FLEET | VAN | ACTIVE | Gasoline | 485 | 3,089 | 4516.65 | 15.7 |
| 2009 CHEV EXPRESS 1500 1/2 TON PASSENGER VAN | FLEET | VAN | ACTIVE | Gasoline | 185 | 1,175 | 1722.85 | 15.7 |
| 2009 CHEV SILVERADO 3500HD 1-TON TRUCK (SANDER) | FLEET | TRUCK | ACTIVE | Gasoline | 1,048 | 6,675 | 9759.69 | 15.7 |
| 2009 CHEV UPLANDER | FLEET | VAN | ACTIVE | Gasoline | 465 | 3,165 | 4330.4 | 14.7 |
| 2009 CHEV UPLANDER | FLEET | VAN | ACTIVE | Gasoline | 56 | 379 | 521.51 | 14.7 |
| 2009 CHEV UPLANDER | FLEET | VAN | ACTIVE | Gasoline | 118 | 802 | 1098.89 | 14.7 |
| 2009 JOHN DEERE 4X4 GATOR | FLEET | UTILITY | ACTIVE | Gasoline | 135 | 378 | 1257.21 | 35.7 |
| 2010 CHEV EXPRESS 1500 CARGO VAN | FLEET | VAN | ACTIVE | Gasoline | 809 | 5,154 | 7533.96 | 15.7 |
| 2010 CHEV EXPRESS 1500 CARGO VAN | FLEET | VAN | ACTIVE | Gasoline | 335 | 2,132 | 3119.75 | 15.7 |
| 2010 CHEV EXPRESS 1500 CARGO VAN | FLEET | VAN | ACTIVE | Gasoline | 427 | 2,722 | 3976.52 | 15.7 |
| 2010 CHEV EXPRESS 1500 CARGO VAN | FLEET | VAN | ACTIVE | Gasoline | 351 | 2,236 | 3268.75 | 15.7 |
| 2010 CHEV EXPRESS 1500 CARGO VAN | FLEET | VAN | ACTIVE | Gasoline | 168 | 1,070 | 1564.53 | 15.7 |
| 2010 CHEV EXPRESS 1500 CARGO VAN | FLEET | VAN | ACTIVE | Gasoline | 86 | 546 | 800.89 | 15.7 |
| 2010 CHEV EXPRESS 1500 CARGO VAN | FLEET | VAN | ACTIVE | Gasoline | 1,658 | 10,561 | 15440.4 | 15.7 |
| 2010 CHEV EXPRESS 1500 CARGO VAN | FLEET | VAN | ACTIVE | Gasoline | 344 | 2,188 | 3203.57 | 15.7 |
| 2010 CHEV EXPRESS 1500 CARGO VAN | FLEET | VAN | ACTIVE | Gasoline | 398 | 2,532 | 3706.45 | 15.7 |
| 2010 CHEV SILVERADO 3500HD 1 TON FLAT DECK TRUCK | FLEET | TRUCK | ACTIVE | Gasoline | 1,717 | 10,935 | 15989.9 | 15.7 |
| 2010 DODGE GRAND CARAVAN | FLEET | VAN | ACTIVE | Gasoline | 1,158 | 8,452 | 10784.1 | 13.7 |
| 2011 CHEV EXPRESS 1500 CARGO VAN | FLEET | VAN | ACTIVE | Gasoline | 608 | 3,873 | 5662.11 | 15.7 |
| 2011 CHEV SILVERADO 2500HD | FLEET | TRUCK | ACTIVE | Gasoline | 771 | 4,912 | 7180.08 | 15.7 |
| 2011 DODGE GRAND CARAVAN | FLEET | VAN | ACTIVE | Gasoline | 186 | 1,358 | 1732.16 | 13.7 |
| 2011 DODGE GRAND CARAVAN | FLEET | VAN | ACTIVE | Gasoline | 209 | 1,524 | 1946.35 | 13.7 |
| 2011 JOHN DEERE HPX GATOR | FLEET | UTILITY | ACTIVE | Gasoline | 158 | 443 | 1471.4 | 35.7 |
| 2011 JOHN DEERE HPX GATOR | FLEET | UTILITY | ACTIVE | Gasoline | 291 | 815 | 2709.99 | 35.7 |
| 2012 CHEV EXPRESS 1500 CARGO VAN | FLEET | VAN | ACTIVE | Gasoline | 379 | 2,417 | 3529.51 | 15.7 |
| 2012 DODGE GRAND CARAVAN | FLEET | VAN | ACTIVE | Gasoline | 407 | 2,968 | 3790.26 | 13.7 |
| 2012 DODGE GRAND CARAVAN | FLEET | VAN | ACTIVE | Gasoline | 366 | 2,674 | 3408.44 | 13.7 |
| 2012 FORD TRANSIT CONNECT | FLEET | VAN | ACTIVE | Gasoline | 519 | 4,432 | 4833.29 | 11.7 |
| 2013 FORD E 150 CARGO VAN | FLEET | VAN | ACTIVE | Gasoline | 517 | 2,889 | 4814.66 | 17.9 |
| 2013 FORD E 150 CARGO VAN | FLEET | VAN | ACTIVE | Gasoline | 287 | 1,603 | 2672.74 | 17.9 |
| 2013 FORD E 150 CARGO VAN | FLEET | VAN | ACTIVE | Gasoline | 614 | 3,428 | 5717.99 | 17.9 |
| 2013 FORD F550 XL (BUCKET TRUCK) | FLEET | TRUCK | ACTIVE | Gasoline | 1,024 | 5,222 | 9536.19 | 19.6 |
| 2014 CHEV EXPRESS 1500 CARGO VAN | FLEET | VAN | ACTIVE | Gasoline | 567 | 3,318 | 5280.29 | 17.1 |
| 2014 CHEV EXPRESS 1500 CARGO VAN | FLEET | VAN | ACTIVE | Gasoline | 205 | 1,199 | 1909.1 | 17.1 |
| 2014 CHEV EXPRESS 1500 CARGO VAN | FLEET | VAN | ACTIVE | Gasoline | 521 | 3,048 | 4851.91 | 17.1 |
| 2014 CHEV EXPRESS 1500 CARGO VAN | FLEET | VAN | ACTIVE | Gasoline | 797 | 4,663 | 7422.21 | 17.1 |
| 2014 DODGE GRAND CARAVAN | FLEET | VAN | ACTIVE | Gasoline | 334 | 2,441 | 3110.44 | 13.7 |
| 2014 DODGE GRAND CARAVAN | FLEET | VAN | ACTIVE | Gasoline | 218 | 1,591 | 1992.92 | 13.7 |
| 2014 FORD E150 CARGO VAN | FLEET | VAN | ACTIVE | Gasoline | 441 | 2,490 | 4106.89 | 17.7 |
| 2014 FORD E150 CARGO VAN | FLEET | VAN | ACTIVE | Gasoline | 201 | 1,134 | 1871.85 | 17.7 |
| 2014 FORD TRANSIT CONNECT CARGO VAN | FLEET | VAN | ACTIVE | Gasoline | 264 | 2,446 | 2458.55 | 10.8 |
| 2015 DODGE GRAND CARAVAN | FLEET | VAN | ACTIVE | Gasoline | 242 | 1,763 | 2253.67 | 13.7 |
| 2015 JOHN DEERE 4 X 2 GATOR (TEST LM0025 SEPT 30/15) | FLEET | UTILITY | ACTIVE | Gasoline | 11 | 34 | 102.44 | 32 |
| 2016 CHEV EXPRESS 1500 CARGO VAN | FLEET | VAN | ACTIVE | Gasoline | 1,817 | 8,261 | 16921.2 | 22 |
| 2016 CHEVROLET COLORADO CREW CAB | FLEET | TRUCK | ACTIVE | Gasoline | 769 | 6,463 | 7161.46 | 11.9 |
| 2016 CHEVROLET COLORADO CREW CAB | FLEET | TRUCK | ACTIVE | Gasoline | 1,130 | 9,498 | 10523.3 | 11.9 |
| 2016 DODGE GRAND CARAVAN | FLEET | VAN | ACTIVE | Gasoline | 15 | 110 | 139.69 | 13.7 |
| 2016 DODGE GRAND CARAVAN | FLEET | VAN | ACTIVE | Gasoline | 319 | 2,331 | 2970.75 | 13.7 |
| 2016 DODGE GRAND CARAVAN | FLEET | VAN | ACTIVE | Gasoline | 78 | 566 | 726.39 | 13.7 |
| 2016 DODGE GRAND CARAVAN | FLEET | VAN | ACTIVE | Gasoline | 1,113 | 8,122 | 13.7 | 13.7 |
| 2016 DODGE GRAND CARAVAN | FLEET | VAN | ACTIVE | Gasoline | 357 | 2,604 | 3324.63 | 13.7 |
| 2017 Chev Express 2500 Cargo Van | FLEET | VAN | ACTIVE | Gasoline | 313 | 1,435 | 2914.87 | 21.8 |
| 2017 Chev Silverado 1500 | FLEET | TRUCK | ACTIVE | Gasoline | 704 | 4,818 | 6556.13 | 14.6 |
| 2017 Ford F150 | FLEET | TRUCK | ACTIVE | Gasoline | 889 | 7,285 | 8278.98 | 12.2 |
| 2017 Ford Transit | FLEET | VAN | ACTIVE | Gasoline | 477 | 4,011 | 4442.15 | 11.9 |
| 2018 Chev Silverado 1500 | FLEET | TRUCK | ACTIVE | Gasoline | 866 | 5,934 | 8064.79 | 14.6 |
| Fuel Type | Total Fuel Usage in 2020,Liters | Number ofVehicles | ||||||
| Gasoline | 39,842 | 89 | ||||||
| Diesel | 2,302 | 2 | ||||||
Disclaimer/Publisher’s Note: The statements, opinions and data contained in all publications are solely those of the individual author(s) and contributor(s) and not of MDPI and/or the editor(s). MDPI and/or the editor(s) disclaim responsibility for any injury to people or property resulting from any ideas, methods, instructions or products referred to in the content. |
© 2023 by the authors. Licensee MDPI, Basel, Switzerland. This article is an open access article distributed under the terms and conditions of the Creative Commons Attribution (CC BY) license (http://creativecommons.org/licenses/by/4.0/).
Copyright: This open access article is published under a Creative Commons CC BY 4.0 license, which permit the free download, distribution, and reuse, provided that the author and preprint are cited in any reuse.


