1. Introduction
According to the United Nations’ 2018 estimate, 55.3 per cent of the world’s population has lived in urban areas, which will reach 60 per cent by 2030 [
1]. This rapid growth puts enormous pressure on urban developers and inhabitants, making everyday life harder for people who aspire to move to these densely populated areas.
Segregation, public safety, ease of transportation, travel and cohabitation are critical factors in city management. Up until the outbreak of the COVID-19 pandemic, city development plans have been relatively straightforward. Promoting and updating public transportation, building bypasses around residential areas, bicycle-friendly roads, and increasing walkability have been the centre of aim for urban developers to build human-friendly spaces.
However, early 2020 drastically changed day-to-day life in almost every aspect of urban residents. In the days when a simple daily commute has become a public health risk, it is an ever more important task we better understand human dynamics and mobility in urban areas. Between numerous challenges of adapting to the unprecedentedly fast and radical changes in our everyday life, we have to face the problems of social distancing, changing the ways of our transportation, how and when we shop and designing our home office. Frustration is a growing problem, and dynamic adaptive changes could help our transportation system, more competent logistics, and traffic control. For these outcomes, we need information on how an urban area and its residents function and what are their mobility habits and characteristics.
Since the dawn of the Global System for Mobile Communications (GSM) – in 1991, mobile communication system speeds reached the Gbit/s magnitude from the Kbit/s limits. With the evolution of 5G networks, we can observe Moore’s law in information and communications technology. Furthermore, the growing amount of available mobile network data and research shows excellent potential to uncover human mobility characteristics using location-enabled GSM data in epidemiology, sociology, and urban planning.
In the age of mobile telephones, when almost half of the world’s population has a smartphone in their pocket, there is great potential in the generated mobile network data. While most of these devices are already equipped with GPS, it is mostly inactive, with only a few applications logging mobile phone positions based on it. Smartphones have the ability to connect to the internet, yet the most widely used activity is still making cellular calls. The continuous communication between mobile phones and cell towers leaves the system operator with an abundance of network data, containing valuable and anonymous information on human mobility.
With nearly everyone carrying a cellphone, when thousands of people gather in the same place their presence is observable in the mobile network data. Large social events are often analysed via Call Detail Records [
2,
3,
4,
5,
6]. Fireworks is a spectacular, large-scale community event that many people enjoy visiting. St. Stephen’s Day is celebrated in Hungary on the 20th of August each year. Tens of thousands of people flock to the capital to take part in the festivities, which culminate in a spectacular 30-minute-long fireworks show. The main event spans three bridges and the two embankments along the Danube River, covering a distance of approximately three kilometres. Due to the stunning views from the Buda and Pest embankments and the Castle District, we can expect to see a significant increase in cellular activity in these areas.
This research seeks to explore ways of using mobile network data fused with mobile phone properties — first and foremost the price — to derive human mobility and socioeconomic status indicators, allowing us to characterise the viewpoints of the event’s attendees. The research question is whether the attendees of a large social event cluster based on socioeconomic status. The main event — the fireworks — can be watched from both sides of the river Danube. Is there any observable difference in socioeconomic status — based on cellphone prices — of the spectators between the Buda and the Pest side knowing that property prices in Buda are more expensive? Does the river have a separating effect during a social event, or the viewpoints are selected merely based on the “goodness” of the view?
In our earlier works, the cellphone prices were used to estimate the socioeconomic status [
6,
7], but the utilised cellphone price data was depreciated causing distortion in the results. In this paper, release prices of the mobile phones are gathered using Generative Pre-trained Transformer 3 (GPT-3) [
8] to resolve this issue.
The contributions of this study are briefly summarised as follows:
Utilising GPT-3 to gather mobile phone release prices on a large scale, which is used to estimate the socioeconomic status of the subscribers.
The socioeconomic status distribution of a large social event attendees is evaluated.
Mobile cells along the riverbank are clustered based on their attendees’ mobility indicators and socioeconomic status.
The work is structured as follows. In
Section 2, the fundamental applications of mobile network data analysis, important works and terminologies will be introduced.
Section 3 discusses the materials and methods used in this paper.
Section 4 presents the results, limitations and improvement potentials of the study.
Section 5 includes a summary of the findings.
2. Literature Review
For the last two decades, uncovering underlying information from mobile phone records has been a developing research field. Data scientists, spatial data analysts, physicists and applied mathematicians pay more and more attention to discovering cellular data. However, interpreting large amounts of call detail records into useful information requires numerous tools and expertise. In the last ten years, dozens of research groups have published several major research journals discussing different applications of mobile network data analysis.
The sudden and rapid development of information and communication technology led to the first research results on the topic from 2008 [
9,
10]. Characterising human mobility based on mobile network data is a relatively new research area. In this section, the analysis will introduce the most important works and results of the last 15 years as well as the commonly used mobility indicators used in the literature.
2.1. Call Detail Records
Using call detail records spanning over 52 weeks, accumulated over two-week-long periods, Gonzalez
et al. analysed 100,000 randomly selected individuals’ movements over half a year in Europe. They characterised basic human mobility patterns and discovered that most individuals travel only short distances and just a few moves over hundreds of kilometres and approximated the probability density function of travel distances with a truncated power-law [
10].
Candia
et al. carried out a comprehensive study on the mean collective behaviour of individuals and examined how space and time deviations can be described using known percolation theory tools. They also proved that the interevent time between consecutive calls is heavy-tailed, which agrees with previous studies on other human activities [
9].
Pappalardo
et al. reported the existence of two distinct profiles in human mobility: returners, which limit the majority of their movement to a few locations and explorers, whose mobility cannot be described in this way. They developed new models that capture their observational findings to support this theory. These results show a distinct role in phenomena spreading, which correlates with our dynamics and social interactions [
11].
From the early 2010s, visual analytics approaches for exploring spatiotemporal urban data have been popular methods [
12,
13,
14]. Senaratne
et al. introduced a novel concept for pattern exploration and matrix representations of cellular network data. By extracting movement trajectories from mobile internet usage data, similarity measurements between users’ spatial and temporal displacements, as well as home and work classifications, they described the urban dynamics of Santiago, Chile [
15]. Another typical application of CDR processing is the large social event detection and estimating the attendance during mass gatherings [
2,
6,
16,
17,
18].
2.2. Mobility Indicators
The literature reviewed in this research paper has identified several indicators that can be used to characterize human mobility patterns, such as radius of gyration, movement entropy, and travel distance. These indicators can be used to measure the travel distance, range of activity space, and heterogeneity of visitation patterns, which are three essential components of human mobility. Two of these — radius of gyration and entropy — are also used in this work as human mobility metrics of an urban population.
2.2.1. Radius of Gyration
Radius of gyration has been widely used to quantify the spatial dispersion of a person’s daily activities in previous studies [
10,
19]. Because we calculate it from raw data, it is referred to as a low-level mobility indicator. Given a device’s records as a list of location
and time
the radius of gyration
can be defined as seen in Equation
1, where
L is the set of locations,
is the centre of mass of these locations and
is the number of visits at the location.
In this calculation, after acquiring the corresponding locations of a user, the distance between these points and the centre of mass was determined using the haversine formula.
2.2.2. K-Radius of Gyration
Similar to
Section 2.2.1, the k-radius of gyration is calculated using only the
k most frequently visited locations of a user, defined in Equation
2, where
are the list of locations,
is the centre of mass calculated on these locations.
Thus,
represents the mobility range of a user, limited to the
k-th most frequently visited location. Pappalardo
et al. introduced the dichotomy of
k-returners and
k-explorers in human mobility [
11]. To understand the characterisation ability of k-radius of gyration, let us assume an individual’s
, then his overall travel pattern is dominated by the two most often visited positions; hence called a
k-returner. Contrariwise, if
is much smaller than the unconditional radius of gyration,
is not sufficient, and more locations must be considered to achieve accurate characterisation, and the user is labelled
k-explorer.
2.2.3. Entropy
In statistical mechanics, introduced in the 1870s by Ludwig Boltzmann, entropy measures the degree to which the probability of a system is spread out over different possible microstates. It is typically used in thermodynamics [
20] to measure the amount of energy that is unavailable to do work in a system. It can also be used to measure the amount of information in a system or the amount of uncertainty in a system.
In this context, it measures the diversity of a cell phone user’s mobility: a higher value means the user is more likely to make the next call at a different location. In Equation
3 L is the set of locations visited by the user,
is the probability of the individual being active at the location [
21].
H is also called the mobility diversity of an individual [
22].
2.3. Socioeconomic Status Analysis
The data set of the 2014 State Foundation Day has already been analysed [
23] in respect of the large social event. In contrast, in this work, the attendees’ socioeconomic status (SES) is primarily studied. Mobile phone release dates and prices are used as SES indicators — derived from mobile network data, using unique device identifications.
There are several ways of estimating SES for a large population. Traditional methods include household interviews conducted by national statistical institutes, online questionnaires and telephone surveys. These approaches require a large amount of funding and come with a delay in result delivery. More recent techniques have immediate results and very low maintenance costs; these include estimating from online social networks [
24,
25,
26,
27], mobile network data [
28,
29,
30,
31] and human mobility indicators [
19,
32,
33].
Using mobile phone prices as socioeconomic indicators have been proved to work well [
6,
34]. Sultan
et al. in identified areas where more expensive phones appear more often using indicators of accessibility to services, infrastructure, hygiene and communication. Their model performed with an absolute Pearson’s correlation coefficient
and p-value
. However, in [
34] only manually collected market prices were used.
Wijesinghe
et al. proposed a prediction model to classify each geographical region in Sri Lanka into a particular socioeconomic status group using anonymised call detail records [
35].
With respect to socioeconomic status analysis, Pintér
et al. evaluated football fans’ socioeconomic status indicators using their mobile phone details in Budapest during the 2016 UEFA European Football Championship. During data preprocessing, they eliminated CDRs from Subscriber Identity Modules (SIMs), which did not operate in mobile phones using Type Allocation Code (TAC) databases [
6]. In another work, they analysed subscribers’ wake-up times and explained how it correlates with their socioeconomic status [
7]. They also showed that the phone prices in the TAC database might have depreciated [
7].
In an earlier study, Pintér
et al. evaluated the connection between individuals’ financial status and their mobility customs. The authors used the radius of gyration, entropy and Euclidean distance between home and work locations as mobility indicators. They applied data fusion methods with average real estate prices to determine the influence of wealth on mobility customs [
36].
2.4. GPT-3
GPT-3 (Generative Pre-trained Transformer 3) is a large-scale language model developed by OpenAI, announced in May 2020. It is the successor to their previous language models GPT-1 and GPT-2. GPT-3 is a deep neural network-based language model that uses unsupervised learning to produce human-like text. It was trained on a dataset of 45 TB of text from sources including websites, books, and articles [
37].
GPT-3 has been used for a variety of tasks, including understanding incoming emails and generating responses [
38], medical dialogue [
39] and news summarisation [
40], or to produce pseudo data labels [
41].
In this research GPT-3 is used to gather original retail prices of a broad variety of mobile phones. In the literature, no similar use cases are available, when researchers use it to return semi-structured data to fill in missing or replace inaccurate information. OpenAI’s new language model performed well in this form of operation, the details are discussed in
Section 3.3.
2.5. Clustering
In recent years, the interest in machine learning has skyrocketed and resulted in hundreds of serviceable algorithms available through multiple programming languages. As a result, we can unveil properties and connections in large data sets that would not be possible with basic heuristics using advanced data analysis methods.
Unsupervised learning methods are used to discover underlying information in large data sets, where no labels are attached to the input for the processing algorithm. When it is assumed that the data set can be partitioned into groups on some available features, clustering techniques are used. A
cluster can roughly be defined as a set of observed objects that are more similar to each other than to objects in other groups. Choosing the suitable clustering algorithm depends on the features of the input data set, outliers and the data objects, as well as the desired cluster characteristics [
42].
The most common clustering algorithms [
43] used in mobile network data analysis are density-based [
44,
45,
46], hierarchical [
47,
48,
49] and partitional clustering [
35,
46,
50,
51]. Density-based clustering aims to construct groups based on low and high-density regions. As a result, this clustering method does not require the number of clusters to be specified. Hierarchical clustering uses a top-down or bottom-up approach to create a dendrogram, which describes the hierarchy of points. It is often necessary to determine the number of clusters in this case. Partitional clustering also requires a user-specified
k number of clusters to group objects in a non-overlapping way. In other words, every object must be sorted into only one cluster, and every cluster must include at least one object.
Clustering algorithms have been proven to work well in discovering underlying information in mobile network data. Al-Zuabi
et al. developed an end-to-end solution to predict the personal information of customers. They tested several classification methods for gender prediction and achieved an accuracy of
[
52].
Lenormand
et al. used mobile network data combined with entropy-based metrics to measure the attractiveness of areas that can be used as a proxy for complex socioeconomic indicators. They used k-means clustering algorithms to group locations based on their visitors’ average entropy, the radius of attraction and the ratio between the number of visitors divided by the population [
53].
Ghahramani
et al. proposed an approach to use an optimised self-organising feature map for revealing the underlying pattern structure of a mobile network data set. They tested density-based, hierarchical and partitional clustering methods for spatiotemporal data characterisation. They concluded that there is no universal definition of what is a suitable clustering method. Each algorithm has a different approach to solving spatiotemporal data clustering [
54].
Based on a study by Zhao
et al., another promising research field is the problem of predicting individual socioeconomic status based on mobile network data. They proposed different approaches to solving the task and presented a semi-supervised hypergraph-based solution [
55].
3. Materials and Methods
3.1. Data Sources
A CDR data set usually contains a caller identification (ID), the cell tower it is connected to, its location, and a timestamp. The data set used for this research was obtained from Vodafone Hungary Ltd. The number of active SIMs was 11,540,058 in Hungary, of which Vodafone had an estimated 24 per cent of the market share in 2014 [
56]. The mobile network data set contains anonymous logs of customers’ calls and text messages in Budapest and Pest County, Hungary, over approximately 1800 km
. This study focuses on Budapest, using its administrative boundaries with an area of 525.14 km
and a population of 1,744,665 as of the 1
st of January 2014 [
57].
The data set was collected between the 18th and 22nd of August 2014. A total amount of 191,528,883 records have been logged, between 8,890 cells. Three comma-separated value files have been acquired for analysis in this research. The first one contained call data records and the second and third are supplementary information about cells and devices.
The CDRs in this data set consist of a timestamp, a hashed device ID, a hashed cell ID and a type allocation code. TAC is the initial eight-digit segment of a device’s International Mobile Equipment Identity (IMEI), uniquely identifying a particular device. In this data set, CDRs are of active call record type, meaning a record was made when the user was making a call or sending/receiving a text message. Unfortunately, the data set does not contain information on cell switching, which would make more granulated data possible.
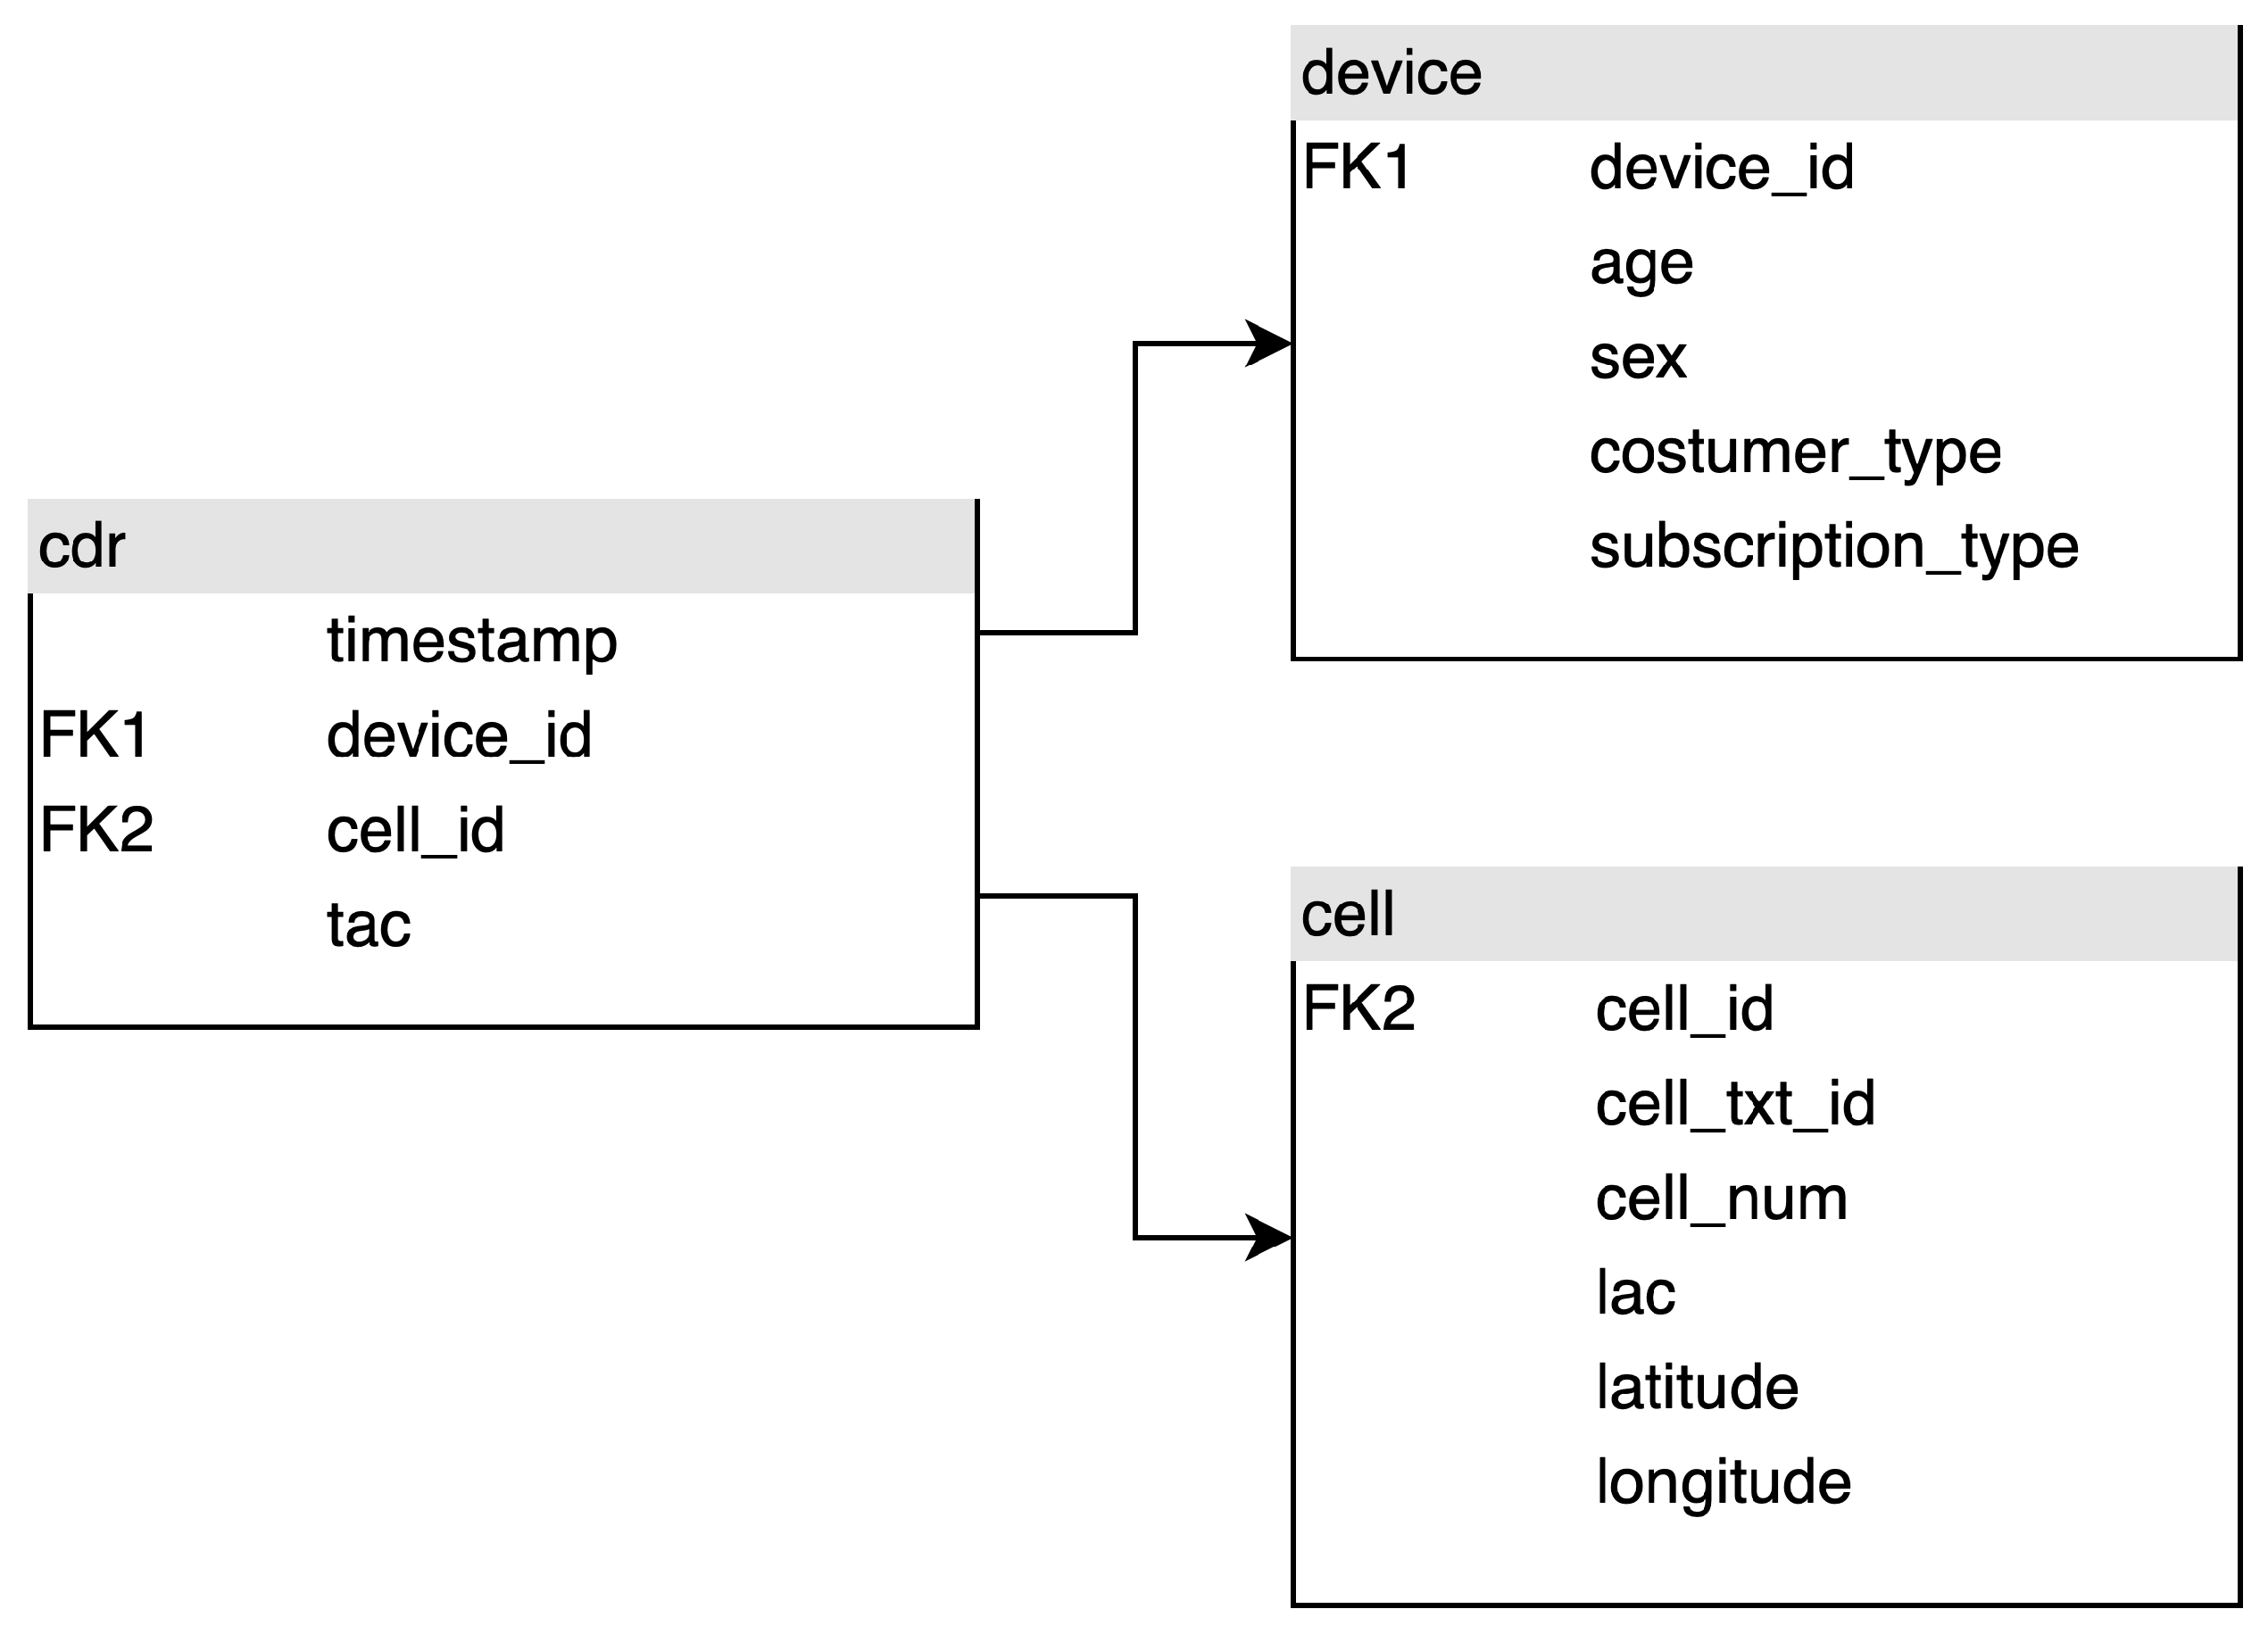
The supplementary cell lookup table contains cell IDs and positions as 2D coordinates in decimal degrees format. The device table contains a hashed device ID, the customer’s age, gender, whether it is an individual or a business and the subscription type (prepaid or postpaid). 350 cells are missing location information; consequently, these records and the corresponding CDRs are excluded from further analysis. Altogether 1,556,951 distinct devices were active during the observation period.
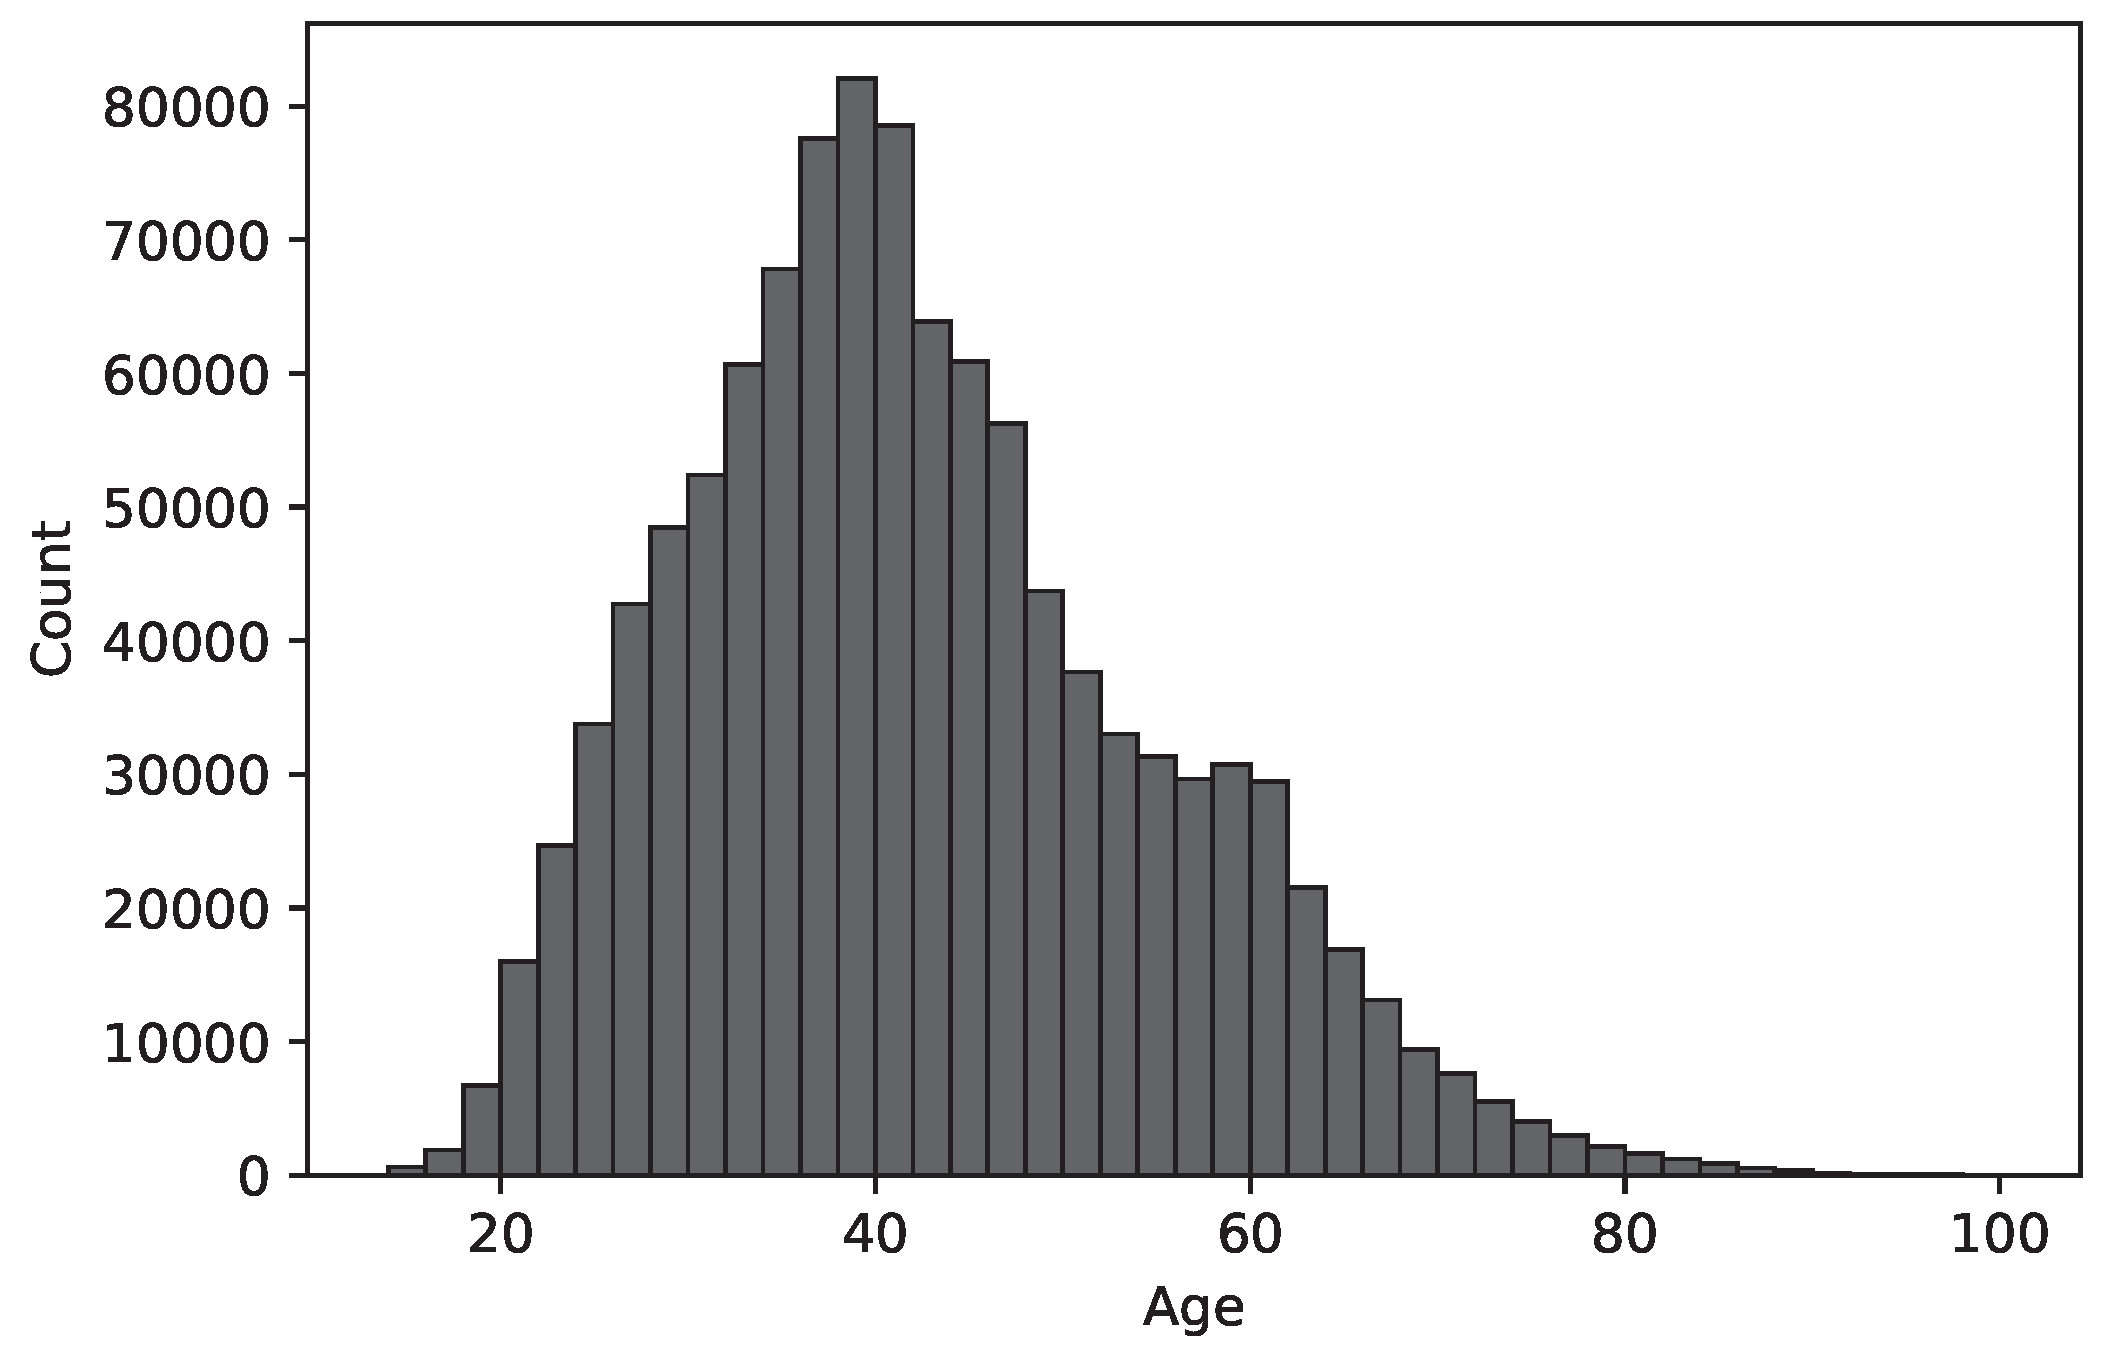
Figure 1 shows age distribution using available data. Age distribution looks more or less like standard, normally distributed data. In contrast, the known gender distribution is roughly equal, although there is a high amount of unknown age and gender information. This might explain the low amount of young (18-20 years old) customers, or they still have their contracts under their parents’ names.
Hungary is known to have a
Baby Boomer demographic cohort, which is visible in
Figure 1, an increasing pattern around the age of 60. On the other hand, users around the age of 40 own most devices.
As a socioeconomic status indicator, the analysis used relative mobile phone ages in months to the event (August 2014) and phone release prices in EUR. Information on resolving the TACs is from the data provided by 51Degrees fused [
6] with the GSMArena database. Out of the total amount of 991,663 TACs 654,347 (65.98%) could be resolved.
The original source includes mobile phones’ brand, model, release year, release month, logical value, whether it is a smartphone or feature phone, and price in EUR and TAC. It is necessary to mention that the mobile phone prices are depreciated [
7]. For example, the indicated price of the iPhone 3G is EUR 90, while the original retail price was USD 600 in the US and EUR 500 in the EU. This immense difference is due to the practice at GSMArena, where they mix and dynamically change initial launch prices paid upfront or on contract, and up-to-date prices of the models.
The analysis needed initial launch prices of mobile phones. Collecting this, often more than 10 years old information was done using OpenAI’s newest addition to their GPT-3 model family:
text-davinci-003 [
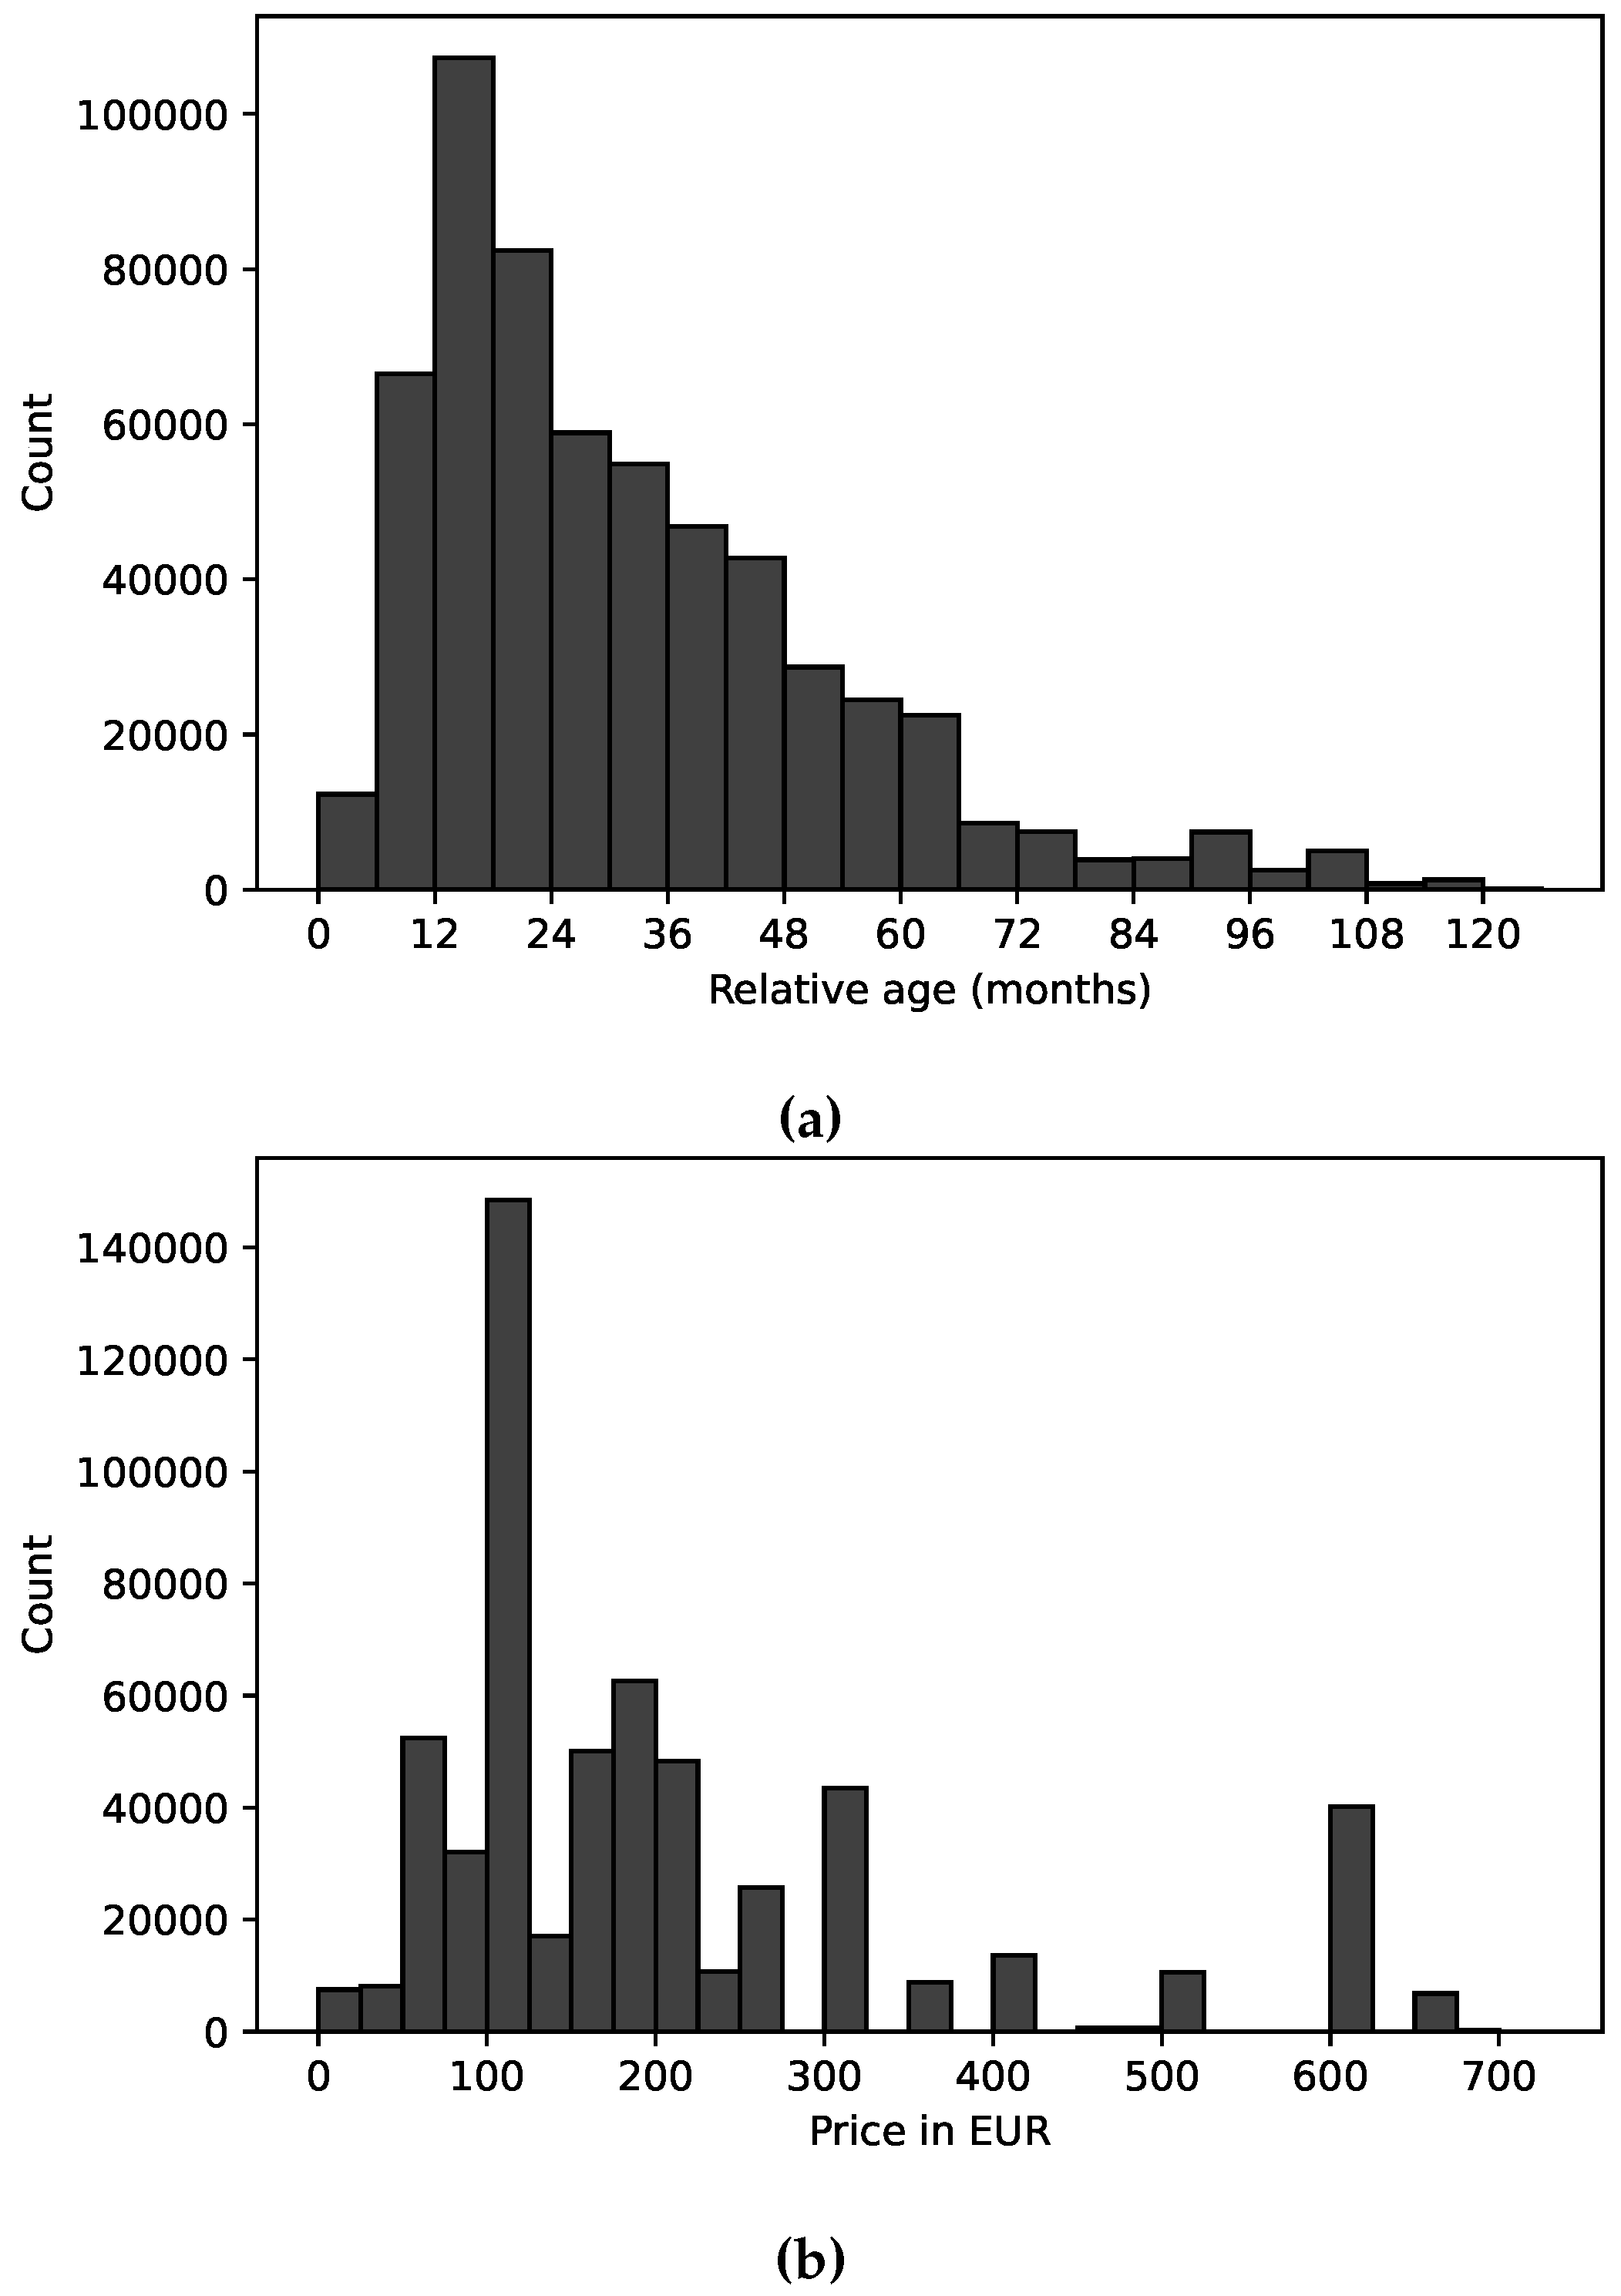
58]. A script was created to query the AI engine to return the original release price of the mobile phone in question. Then, the prices were extracted from the answer and added to the mobile phone property database. The results are shown in
Figure 2b.
The price and relative age distribution of the user’s mobile phones is seen in
Figure 2. In numerous cases, mobile phones are unknown — due to unknown TACs —, and this missing information reflects in the distribution. However, it is visible that the most common price category is around EUR 100. Also notable is that there are numerous phones in use up to ten years old, with over 20,000 at the age of five.
3.2. Data Preprocessing
The received data has already been cleaned and loaded into an SQLite database. The data preparation phases follow the author’s previous work as the data provider is the same. In [
36], the preprocessing steps of the Call Detail Records are introduced. In [
6], the resolution of the Type Allocation Codes using data acquired from
51Degrees.mobi Limited and the fusion with the mobile network data are detailed.
On the other hand, it is worth noting some differences. Although the mobile network data contained cell IDs, only the base station coordinates are provided for this data set. So, as a base station usually serve multiple cells, these cell IDs had to be merged based on the base station’s locations. This also means that after merging these cells, their IDs in CDRs must also be replaced with the new
base station ID. After the merge, 810 locations (sites) remained with known geographic locations. To approximate the area covered by these cell towers, Voronoi tessellation was performed — a common practice [
9,
22] utilised in CDR processing.
The database schema was not modified during the cell merge so that the original data source is compatible with the new one. Private — foreign key — connections have been created to show the relationship between the three tables as seen in
Figure 3.
3.3. Data Collection with OpenAI’s GPT-3
The depreciated mobile phone prices were replaced using the publicly available GPT-3 autoregressive language model. However, its primary purpose is to generate human-like text. It is a powerful language model that uses deep learning to generate text based on a prompt.
While the original mobile phone retail prices can be found online, it is tremendous work to find all the information one by one by web scraping. GPT-3 was found to be capable of answering simple questions, like
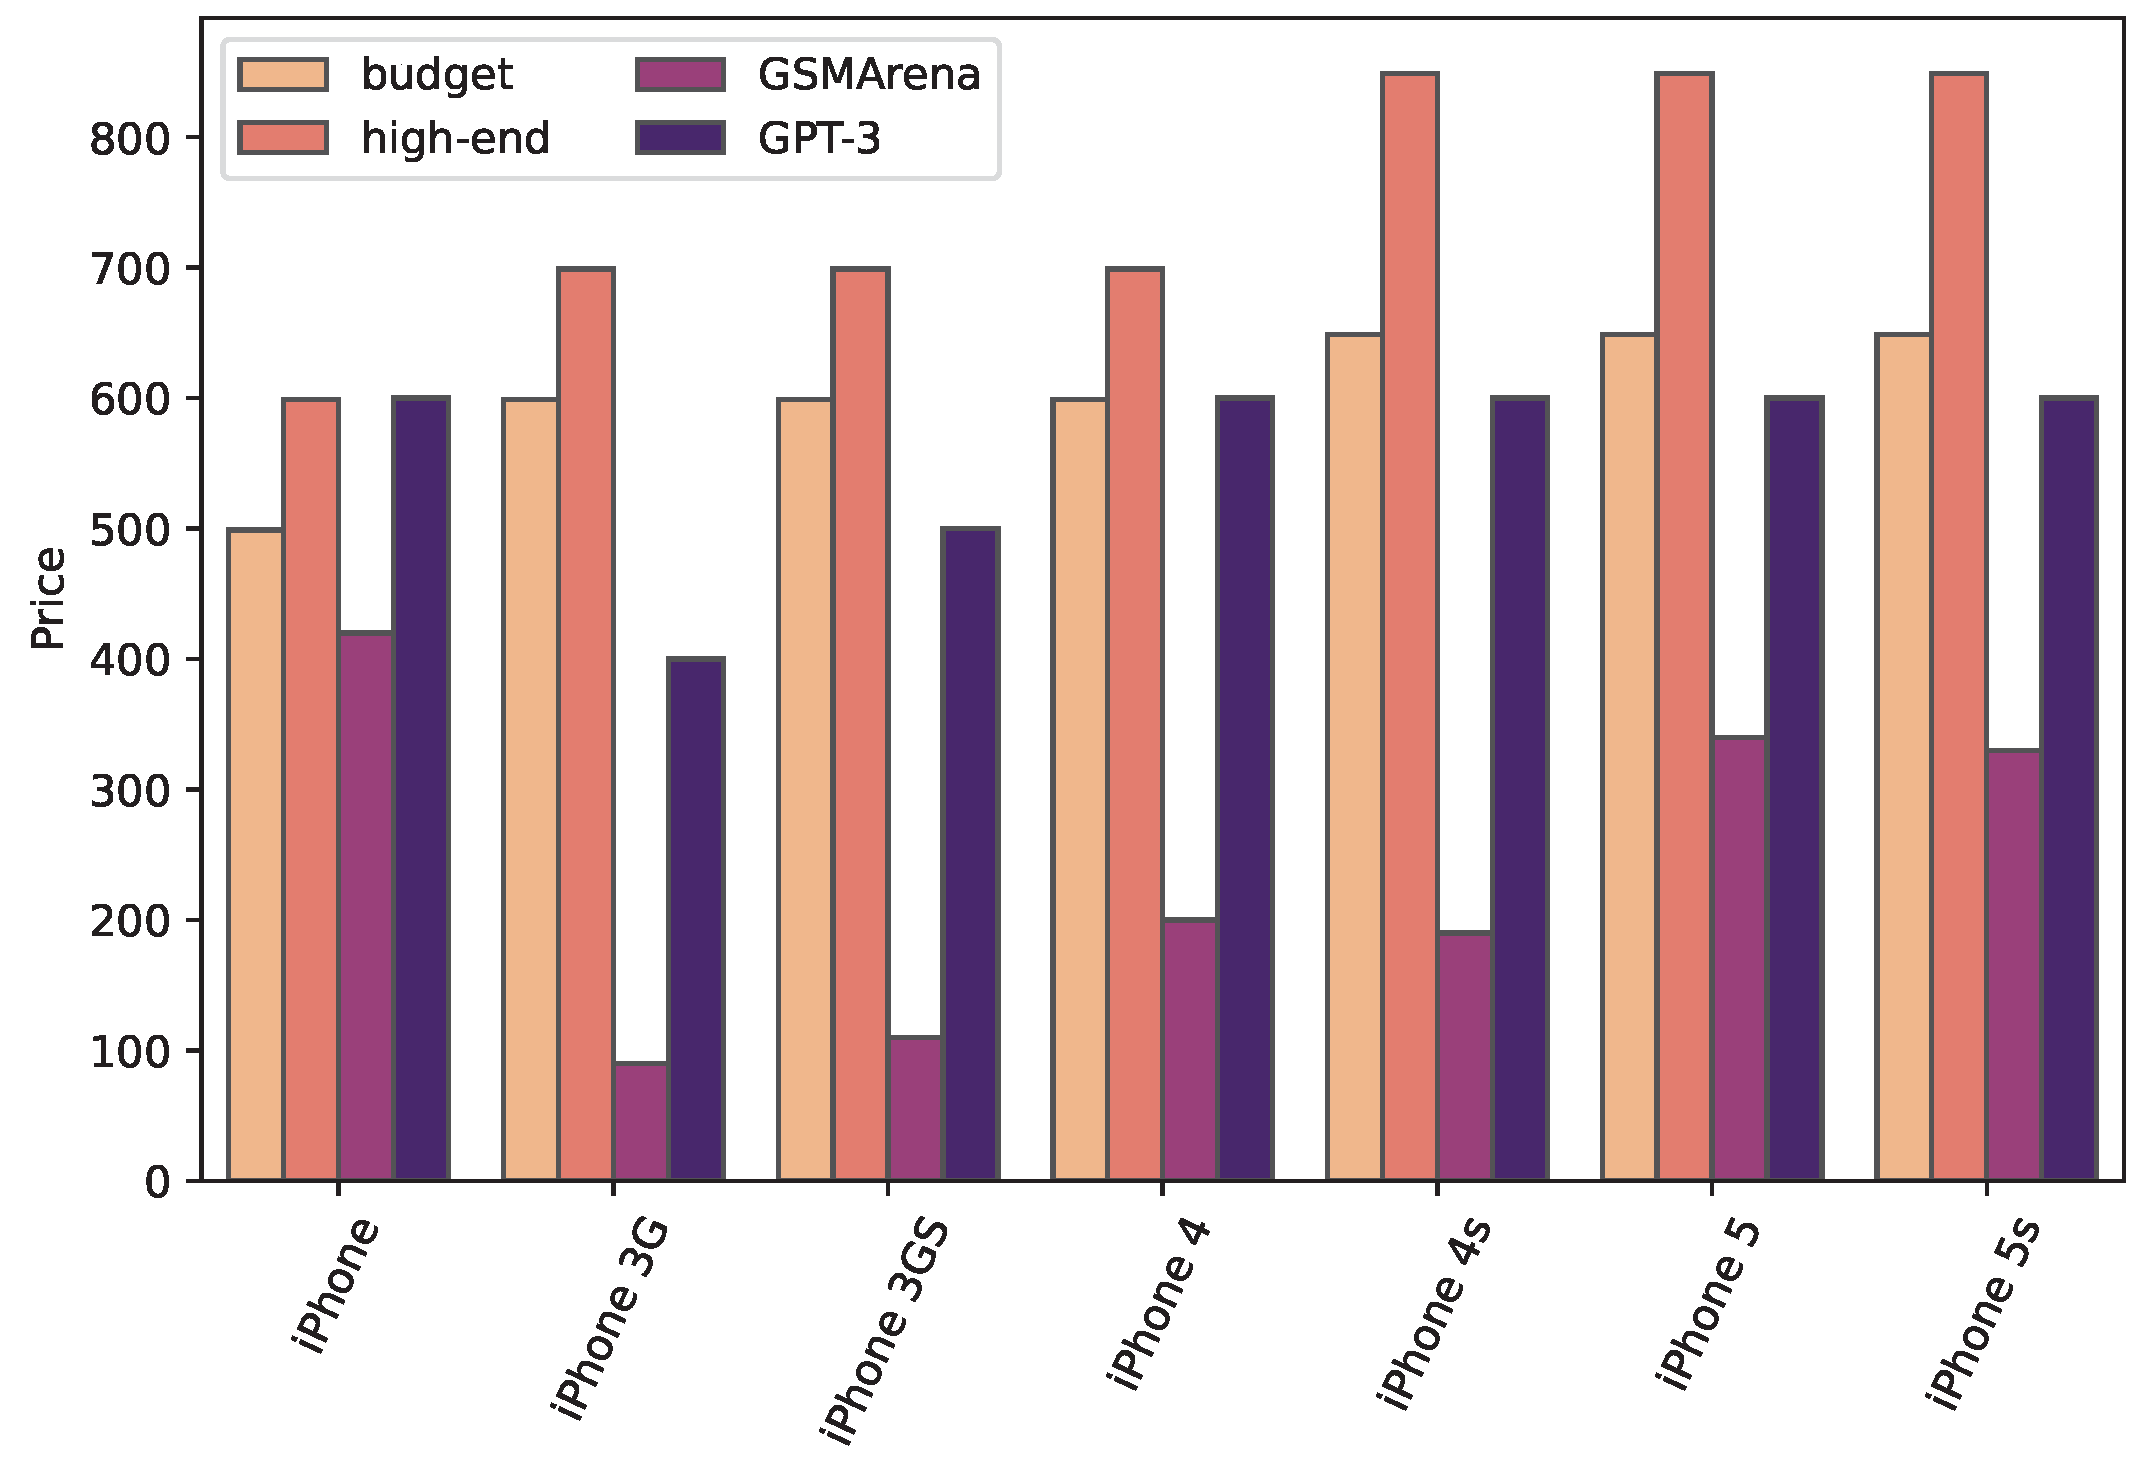
’What was the first retail price of the Apple iPhone 4s in EUR?’. The most used phone had a price of EUR 190 in the original database, as opposed to the information retrieved via GPT-3 — EUR 600. The unlocked iPhone 4s from the Hungarian Apple Store started from HUF 189,000 [
59], which is an appropriate estimate.
After testing on several popular mobile phones and verifying that the returned values were accurate, an application was built using the OpenAI API [
58] to send prompt questions to the AI. In [
7], Apple iPhone devices were used to validate the accuracy of the phone prices, and it was found that the price values are depreciated. The same test was applied and
Figure 4 shows the result. Versions with the lowest amount of storage are denoted by “budget”, and versions with the most expensive versions are categorised as “high-end”. Although the older iPhones have usually decreasing prices in the GSMArena data, the GPT-3 based values are close to the “budget” variants.
All the mobile phone names were inserted into the same question structure, and the answers were collected alongside the models. On the day of the event, 851 distinct devices were recorded and resolved using the TACs, and their release prices were obtained via this technique. The answers were stripped of words, spaces, and punctuation marks, and the last number was rounded up to the nearest 10. Then, the data was loaded into the original database and added to a new column.
3.4. Event Analysis
In this section, the methodology of the proposed large-scale event analysis framework is presented. The aim is to produce spatial descriptors for the areas covering Budapest’s Hungarian State Foundation Day celebrations. The call detail record analysis focuses on the city centre of Budapest during a large-scale event in August 2014. The attendees of the main event of the Hungarian State Foundation Day are analysed based on their socioeconomic status. This section proposes an approach to estimating SES by the price and age of the subscribers’ phones, obtained by fusing a mobile phone property database with the CDRs.
The proposed framework is shown in
Figure 5 and works as follows: the cell list containing the cell towers that make most of the mobile phone transactions has to be selected and stored in a list. This can be done manually, knowing the terrain well or selecting the points of interest and the cells based on a predefined rule (e.g.,
x metre radius). Next, the CDR table from the database has to be filtered (
Figure 5/1.1) using the cell list and time of the event, thus producing the event data output. This list contains all the call detail records that were most likely made by users at the time and place of the event. Next, the mobile phone price and relative age are used from the database introduced in
Section 3.1 to estimate the socioeconomic status of attendees. Finally, the event data CDRs are joined on the records’ TAC, selecting the corresponding phone property (
Figure 5/1.2). At this point, the records without known TAC details can be eliminated. In some cases, where the TAC is known but the mobile phone property is not, records must also be eliminated from further analysis. An average SES indicator is used to generate a cell-by-cell descriptor, calculated in (
Figure 5/1.3).
The final output of the proposed framework produces a list of cell IDs with their average socioeconomic status indicator. This list can be used to create maps and scatter plots to analyse the results and stored in a comma-separated value or JSON/GeoJSON file. Note that the framework can only function with one SES indicator at a time. However, as we only have two of these in this study, the calculations only have to run twice, with the appropriate mobile phone property configured
Figure 5/1.2).
3.5. Clustering
The proposed mobile network cell clustering framework is presented in this section. Similar to
Section 3.4, the aim is to produce a cell-by-cell descriptor, but in this case, the groups are created by an unsupervised clustering algorithm. Three different cases will be investigated: clustering based on mobility, SES, and mixed indicators.
The proposed framework is shown in
Figure 6 and includes the following elements: the cell ID list must be prepared, where the analysis is to be concluded. The input cell list is then joined with the precomputed cell indicators (
Figure 6/2.1). The output is the raw clustering data with different indicators having different units of measurement, which needs to be preprocessed (
Figure 6/2.2). It is crucial to prepare input data for clustering algorithms, as they might result in inaccurate output without data set standardisation. The clustering algorithm (
Figure 6/2.3) runs using the preprocessed data set. It outputs the cluster labels, indicating which cells are more similar based on the given metrics than others.
The analysis uses a k-means clustering algorithm based on its characteristics and usage in related works (
Section 2.5). The number of clusters is determined using the elbow method [
62].
4. Results and Discussion
4.1. Data Processing Framework
This study aimed to create a mobile network processing framework to infer user mobility and socioeconomic status indicators using call detail records and base station locations. The framework has been used throughout the large-scale event analysis and clustering and was detailed in
Section 3.4 and
Section 3.5.
The data processing framework was implemented in Python, and consists of database queries, tabular data processing functions, and producing a cell list with their specific metrics. It was proven to work well with any spatiotemporal data from the source database, producing serviceable information for the event analysis and cell clustering. Therefore, the results presented in
Section 4.2 and
Section 4.3 are the products of this framework. The implementation allows easy modification possibilities to facilitate other call detail record databases or sources to infer socioeconomic status or other metrics.
4.2. Large Social Event Analysis
St. Stephen’s Day is celebrated in Hungary every year on the 20th of August. Tens of thousands of people visit the capital for an all-day-long celebration and the main event, a 30-minute-long firework show. The main area of the event includes three bridges and two embankments on the Danube for approximately three kilometres. With great views from the Buda and Pest embankments and the Castle District, these areas show a significant spike in cellular activity. Therefore, they were the primary subject of the event analysis.
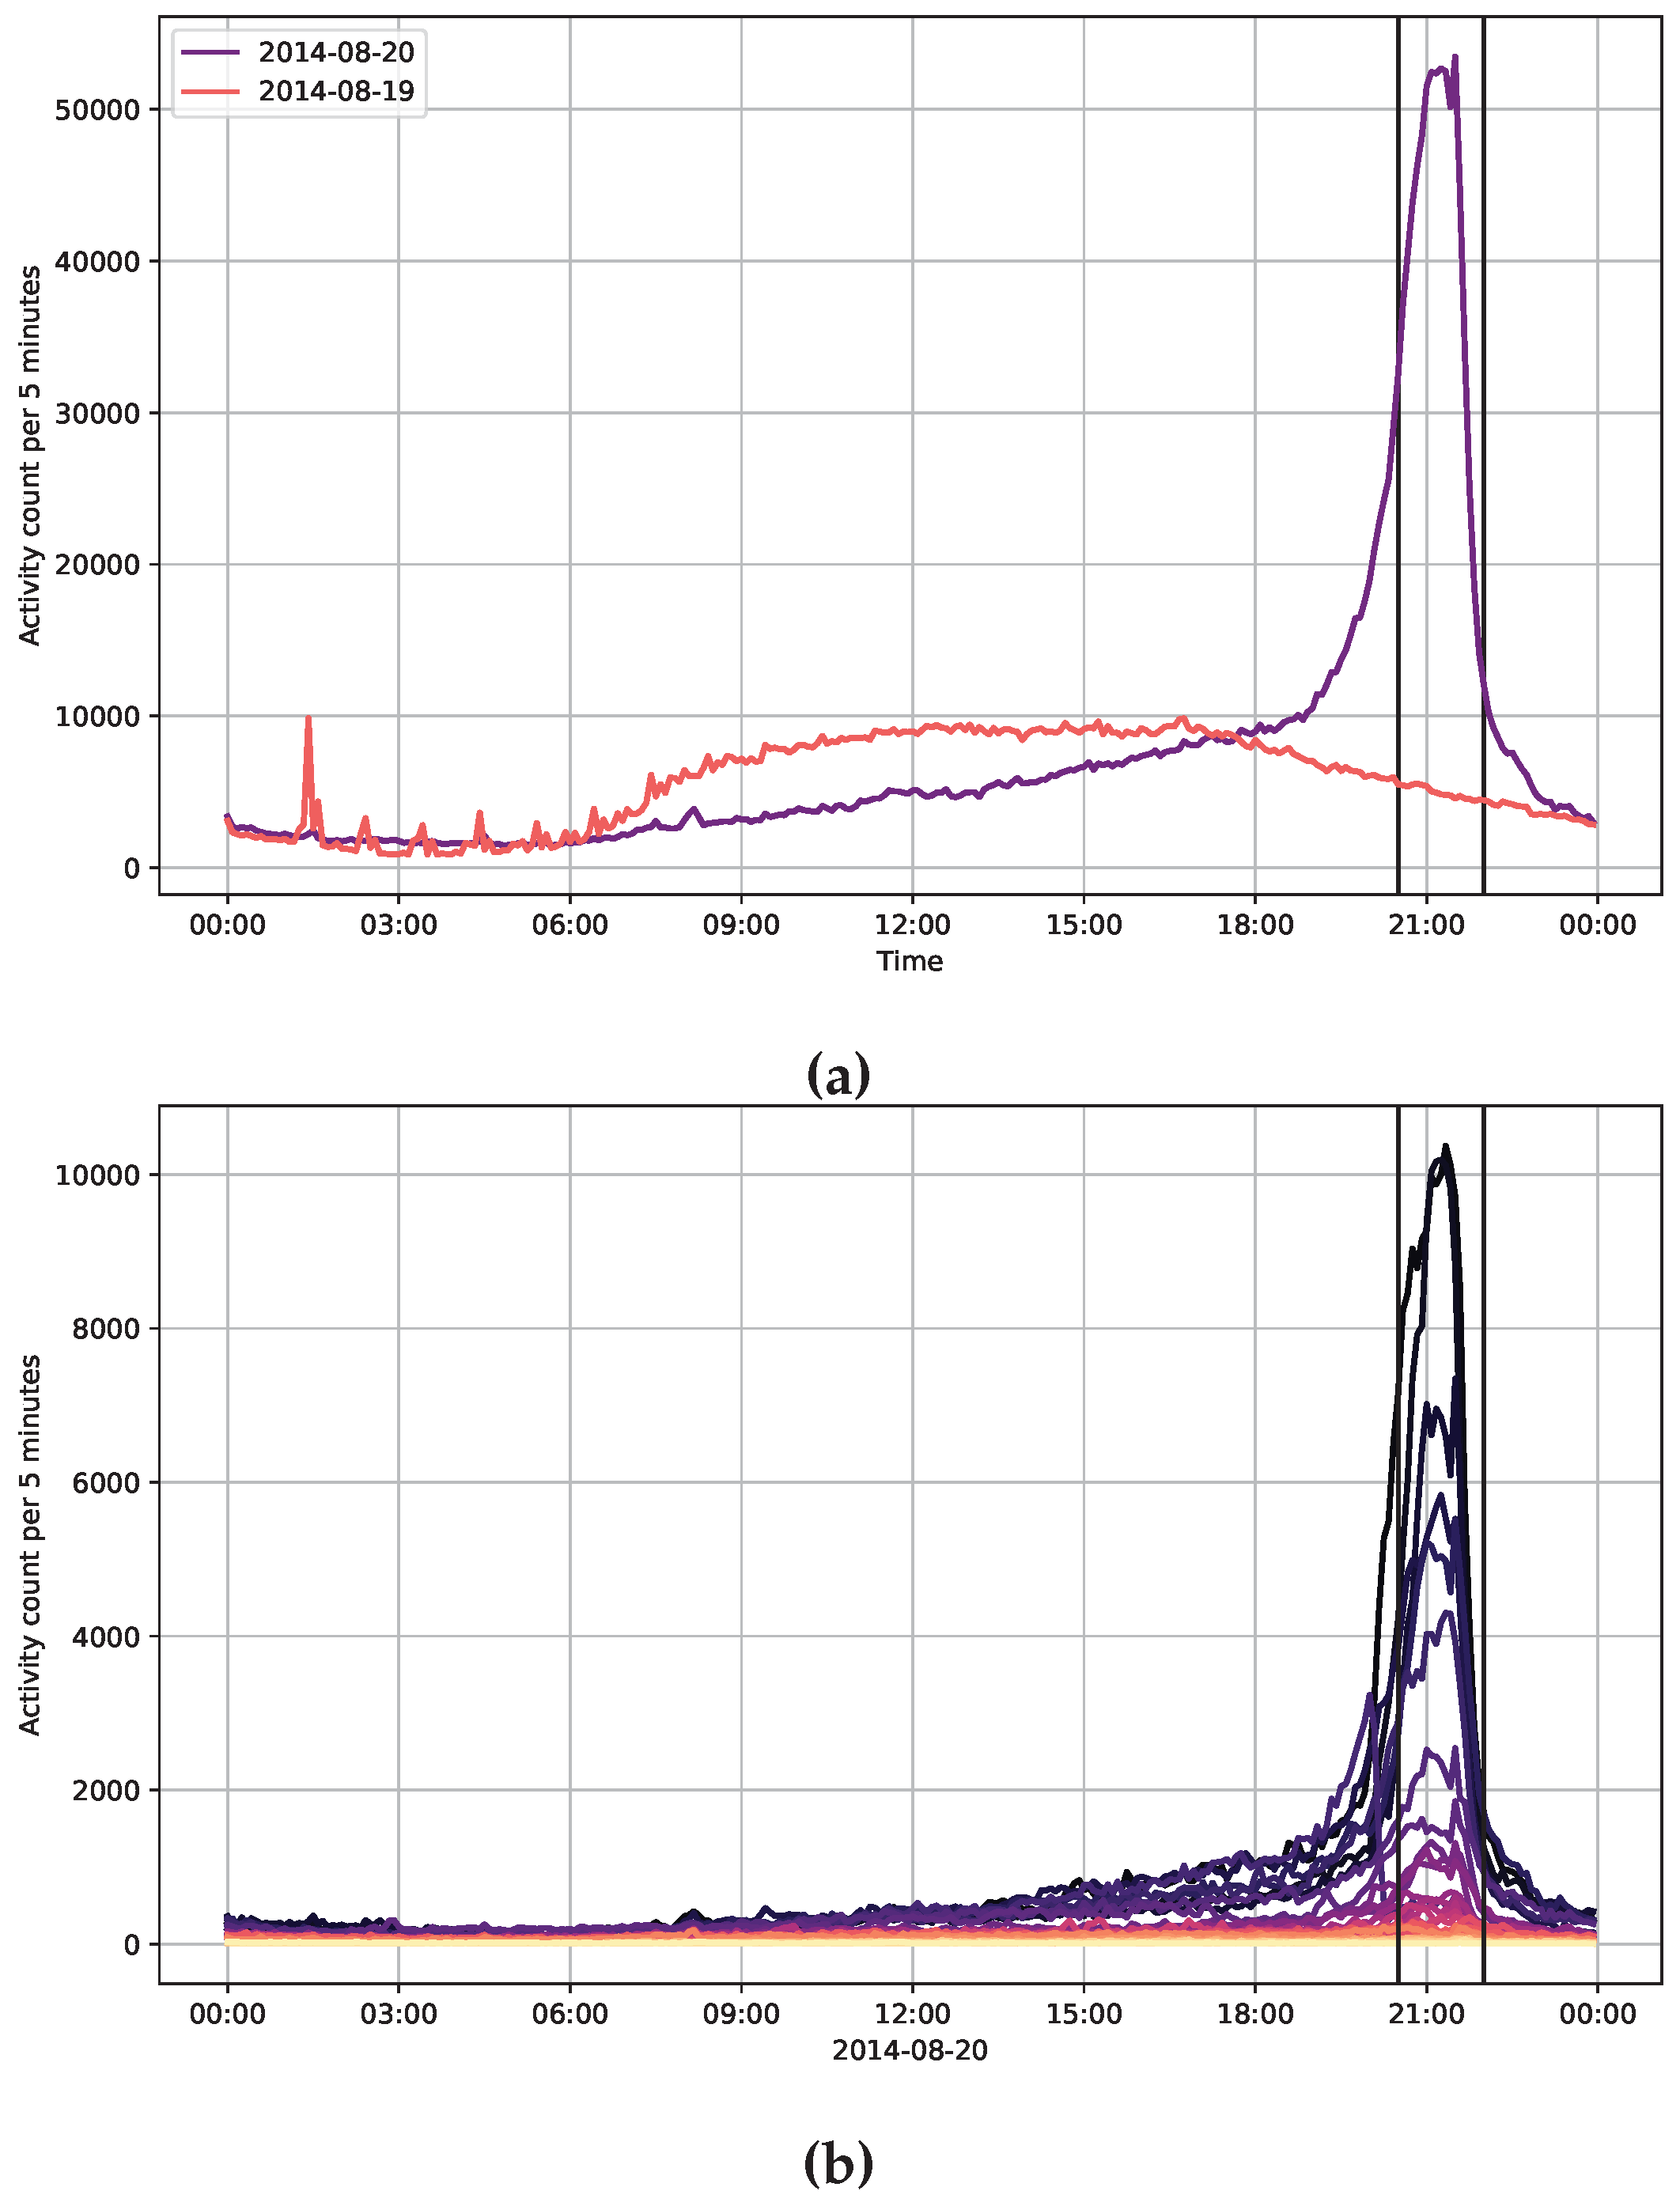
The research focused on the socioeconomic status indicator distribution among the State Foundation Day celebratory firework viewers in Budapest, on the banks of the river Danube and in the Castle District in August 2014. The examined time frame is 20:00 – 21:30, including half an hour before and after the 30-minute show, marked with vertical lines in
Figure 7a and
Figure 7b.
The significance of State Foundation Day in mobile network usage is apparent in
Figure 7a. The two lines show the accumulative number of records per 5 minutes in the event area. The peak was just after around 21:00, with more than 50,000 records per 5 minutes (10,000/min). The mobile network load on individual cells is shown in
Figure 7b; the higher the usage per 5 minutes, the darker the colour. The top cells peak at around 10,000 transactions per 5 minutes (1,600/min).
A cell-by-cell average of mobile phone prices and relative ages was calculated for the SES indicator distribution.
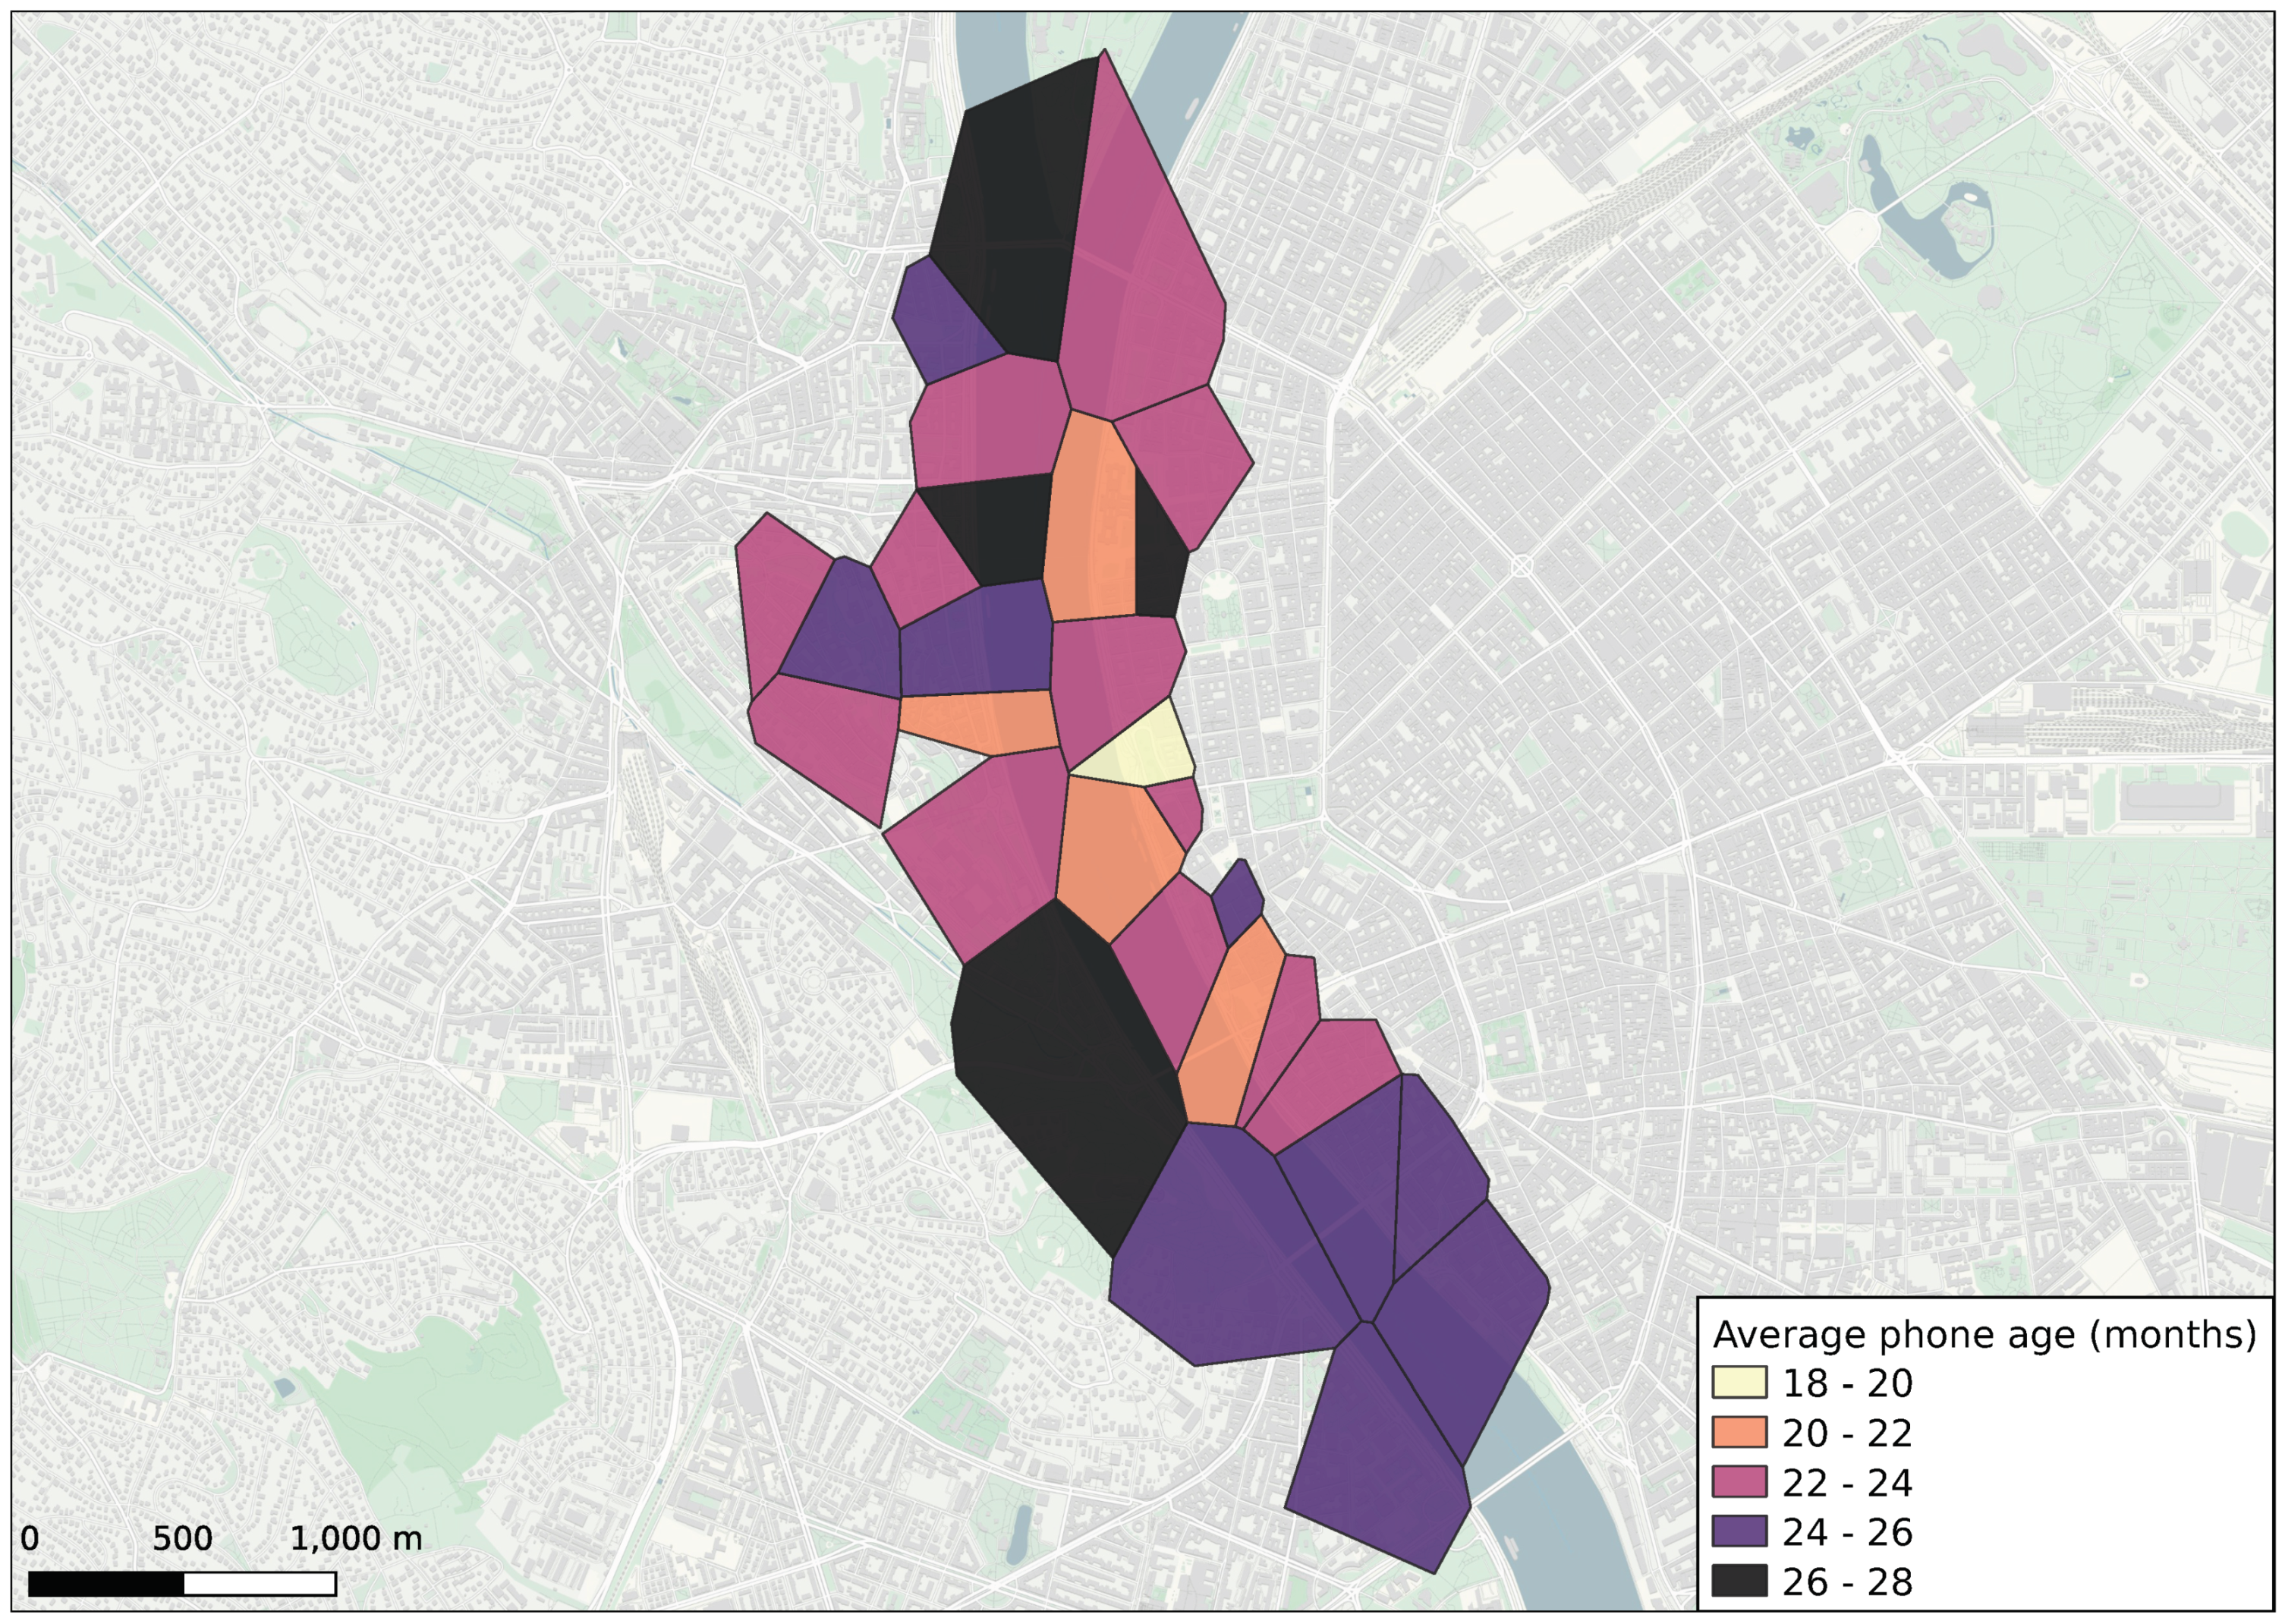
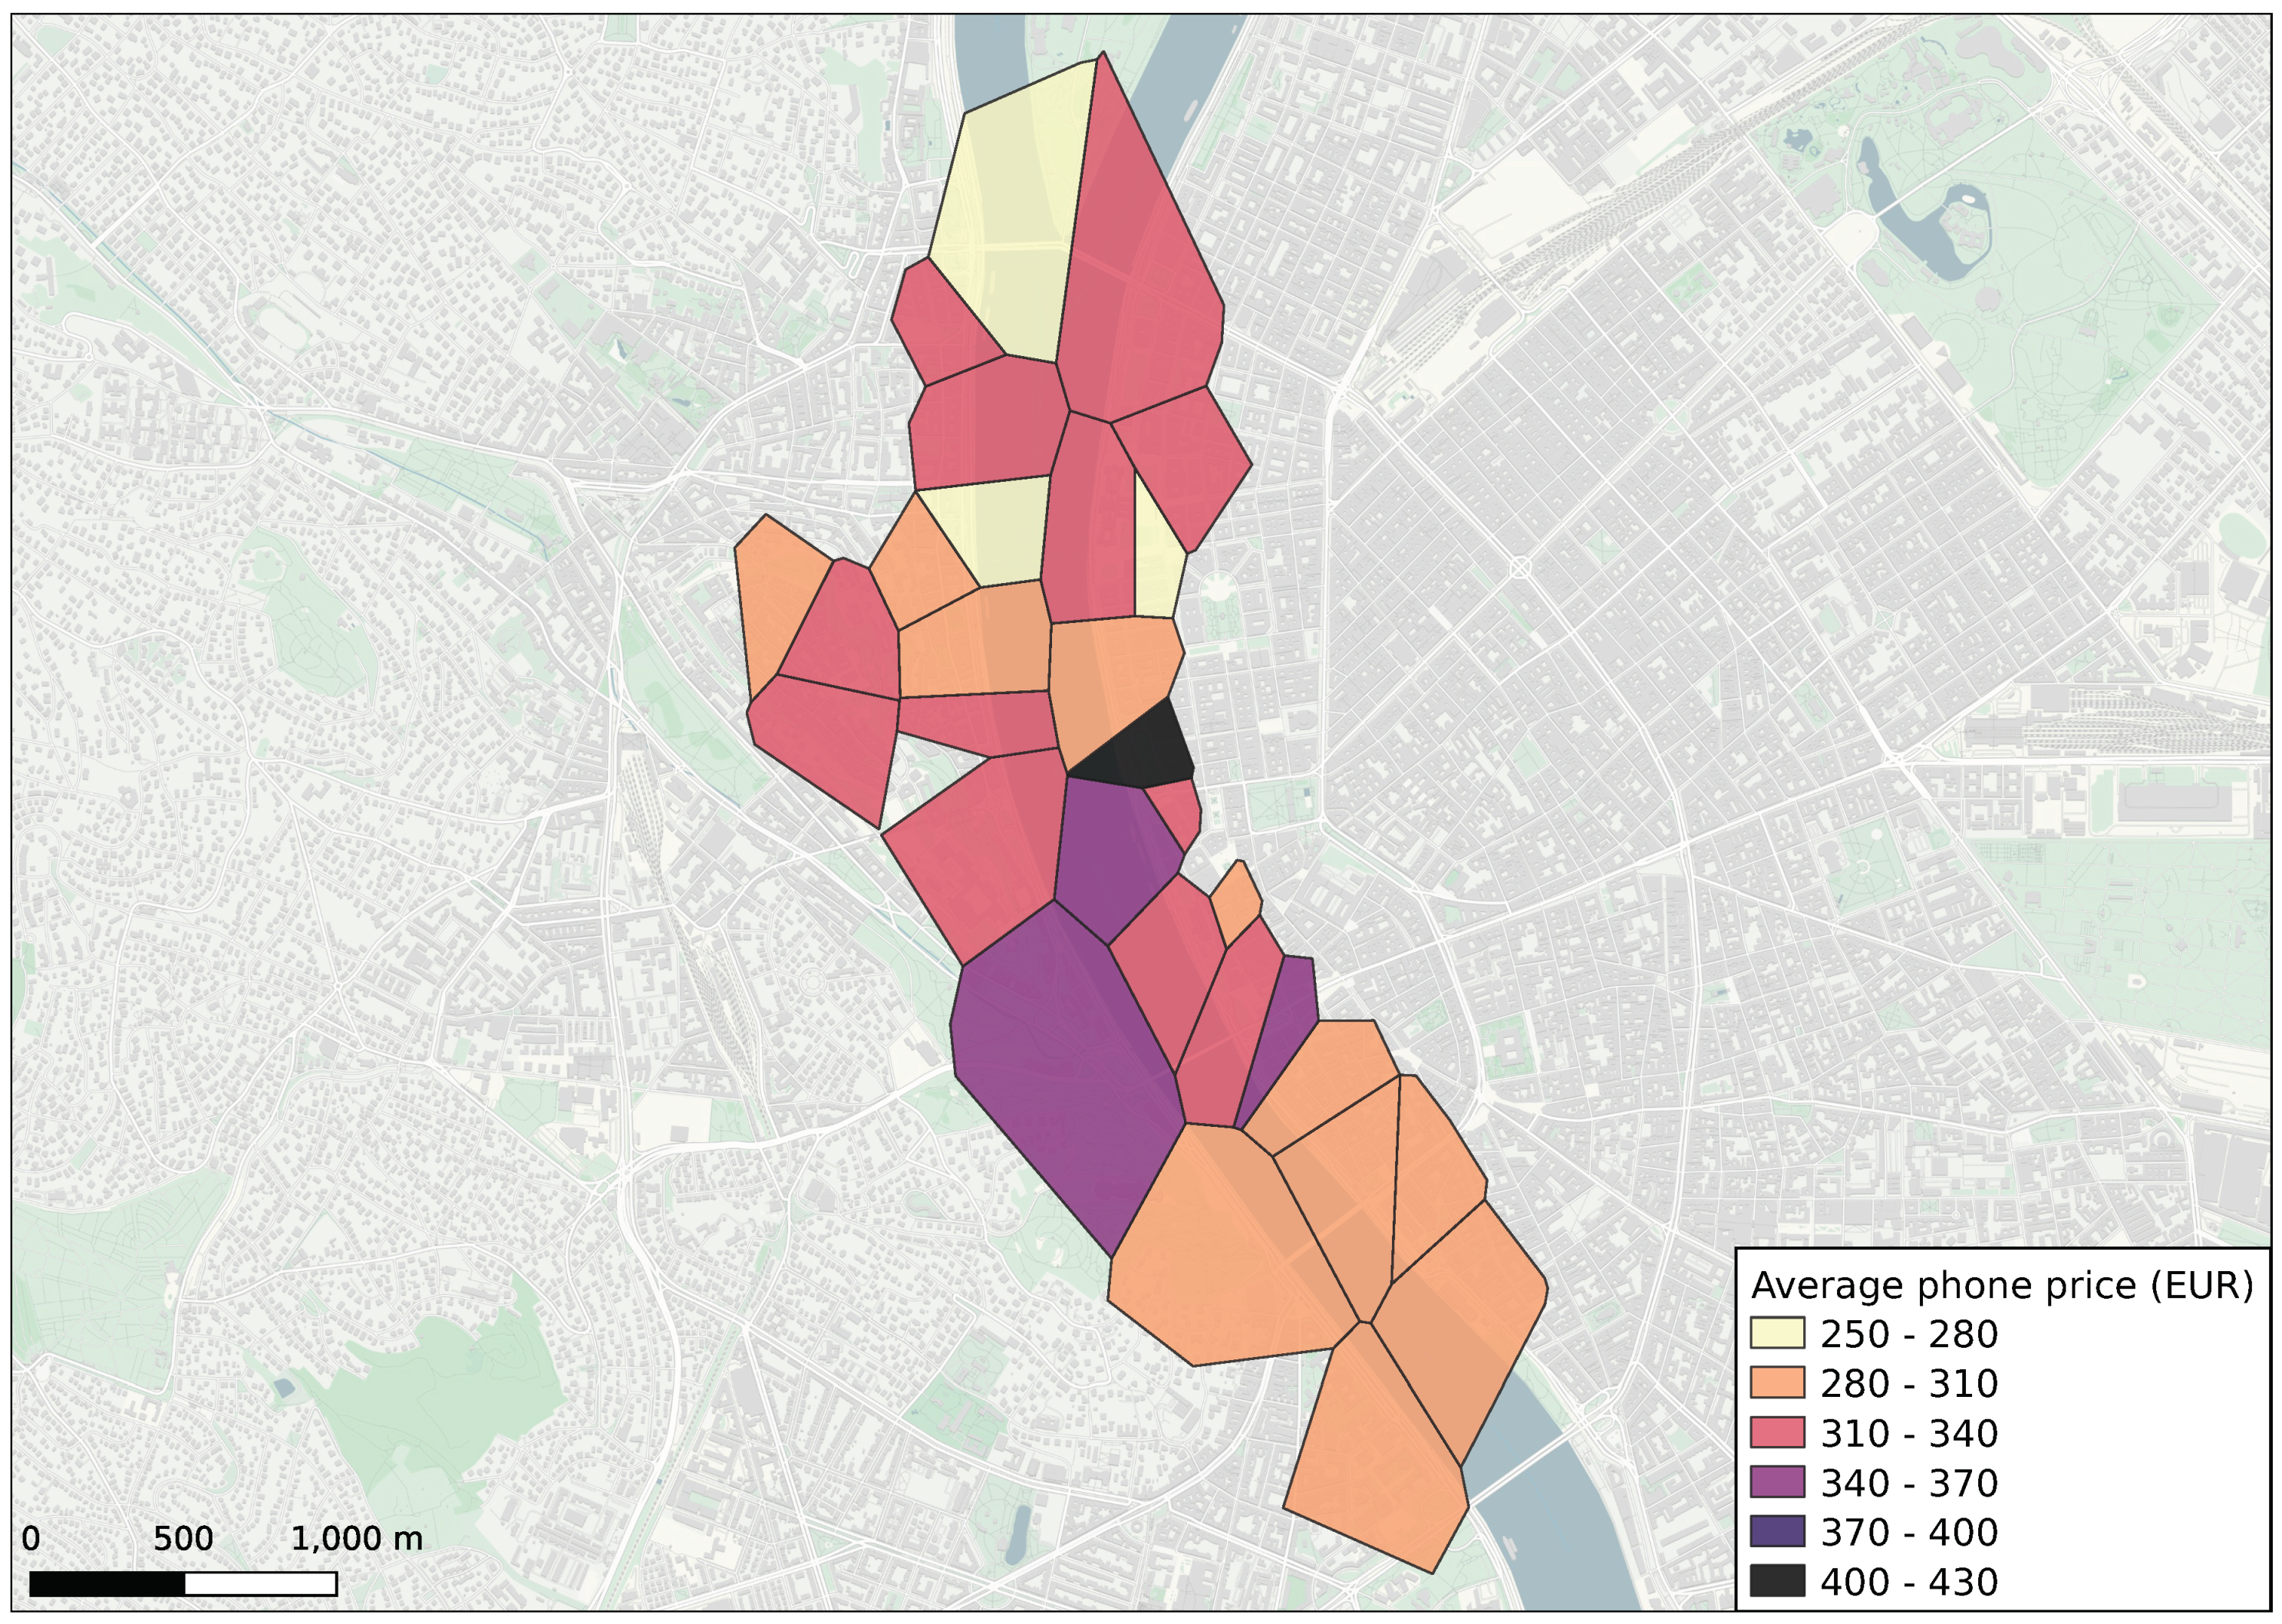
Figure 8 and
Figure 9 show the spatial distribution of these indicators using Voronoi polygons generated around the cell tower locations. Cells are coloured by the average SES indicators; the higher the value, the darker the colour.
The expectation was that there would be a significant contrast between Buda and Pest in socioeconomic indicator distribution. However, there are only minor differences in this spatial resolution, from which it can be concluded that those interested in the event do not divide drastically into socioeconomic groups. Pintér
et al. [
6] also found no clear separation could be detected among football fans based on SES. However, they investigated fan bases all over the city, here the two sides of the Danube, which can have a strong geographical separation force. On the contrary, Barnett
et al. [
17] found strong evidence of social event attendees’ spatial homophily during humanity’s largest gathering.
The average mobile phone price was EUR 303 in Buda (without the Castle District), EUR 314 in the Castle District, and EUR 318 in Pest. The differences in averages are not substantial. However, it is notable, that there is a drastic increase in expensive phones on the Pest side of the Széchenyi Chain Bridge (black area in
Figure 9). This cell also shows the lowest average phone age (white area in
Figure 8).
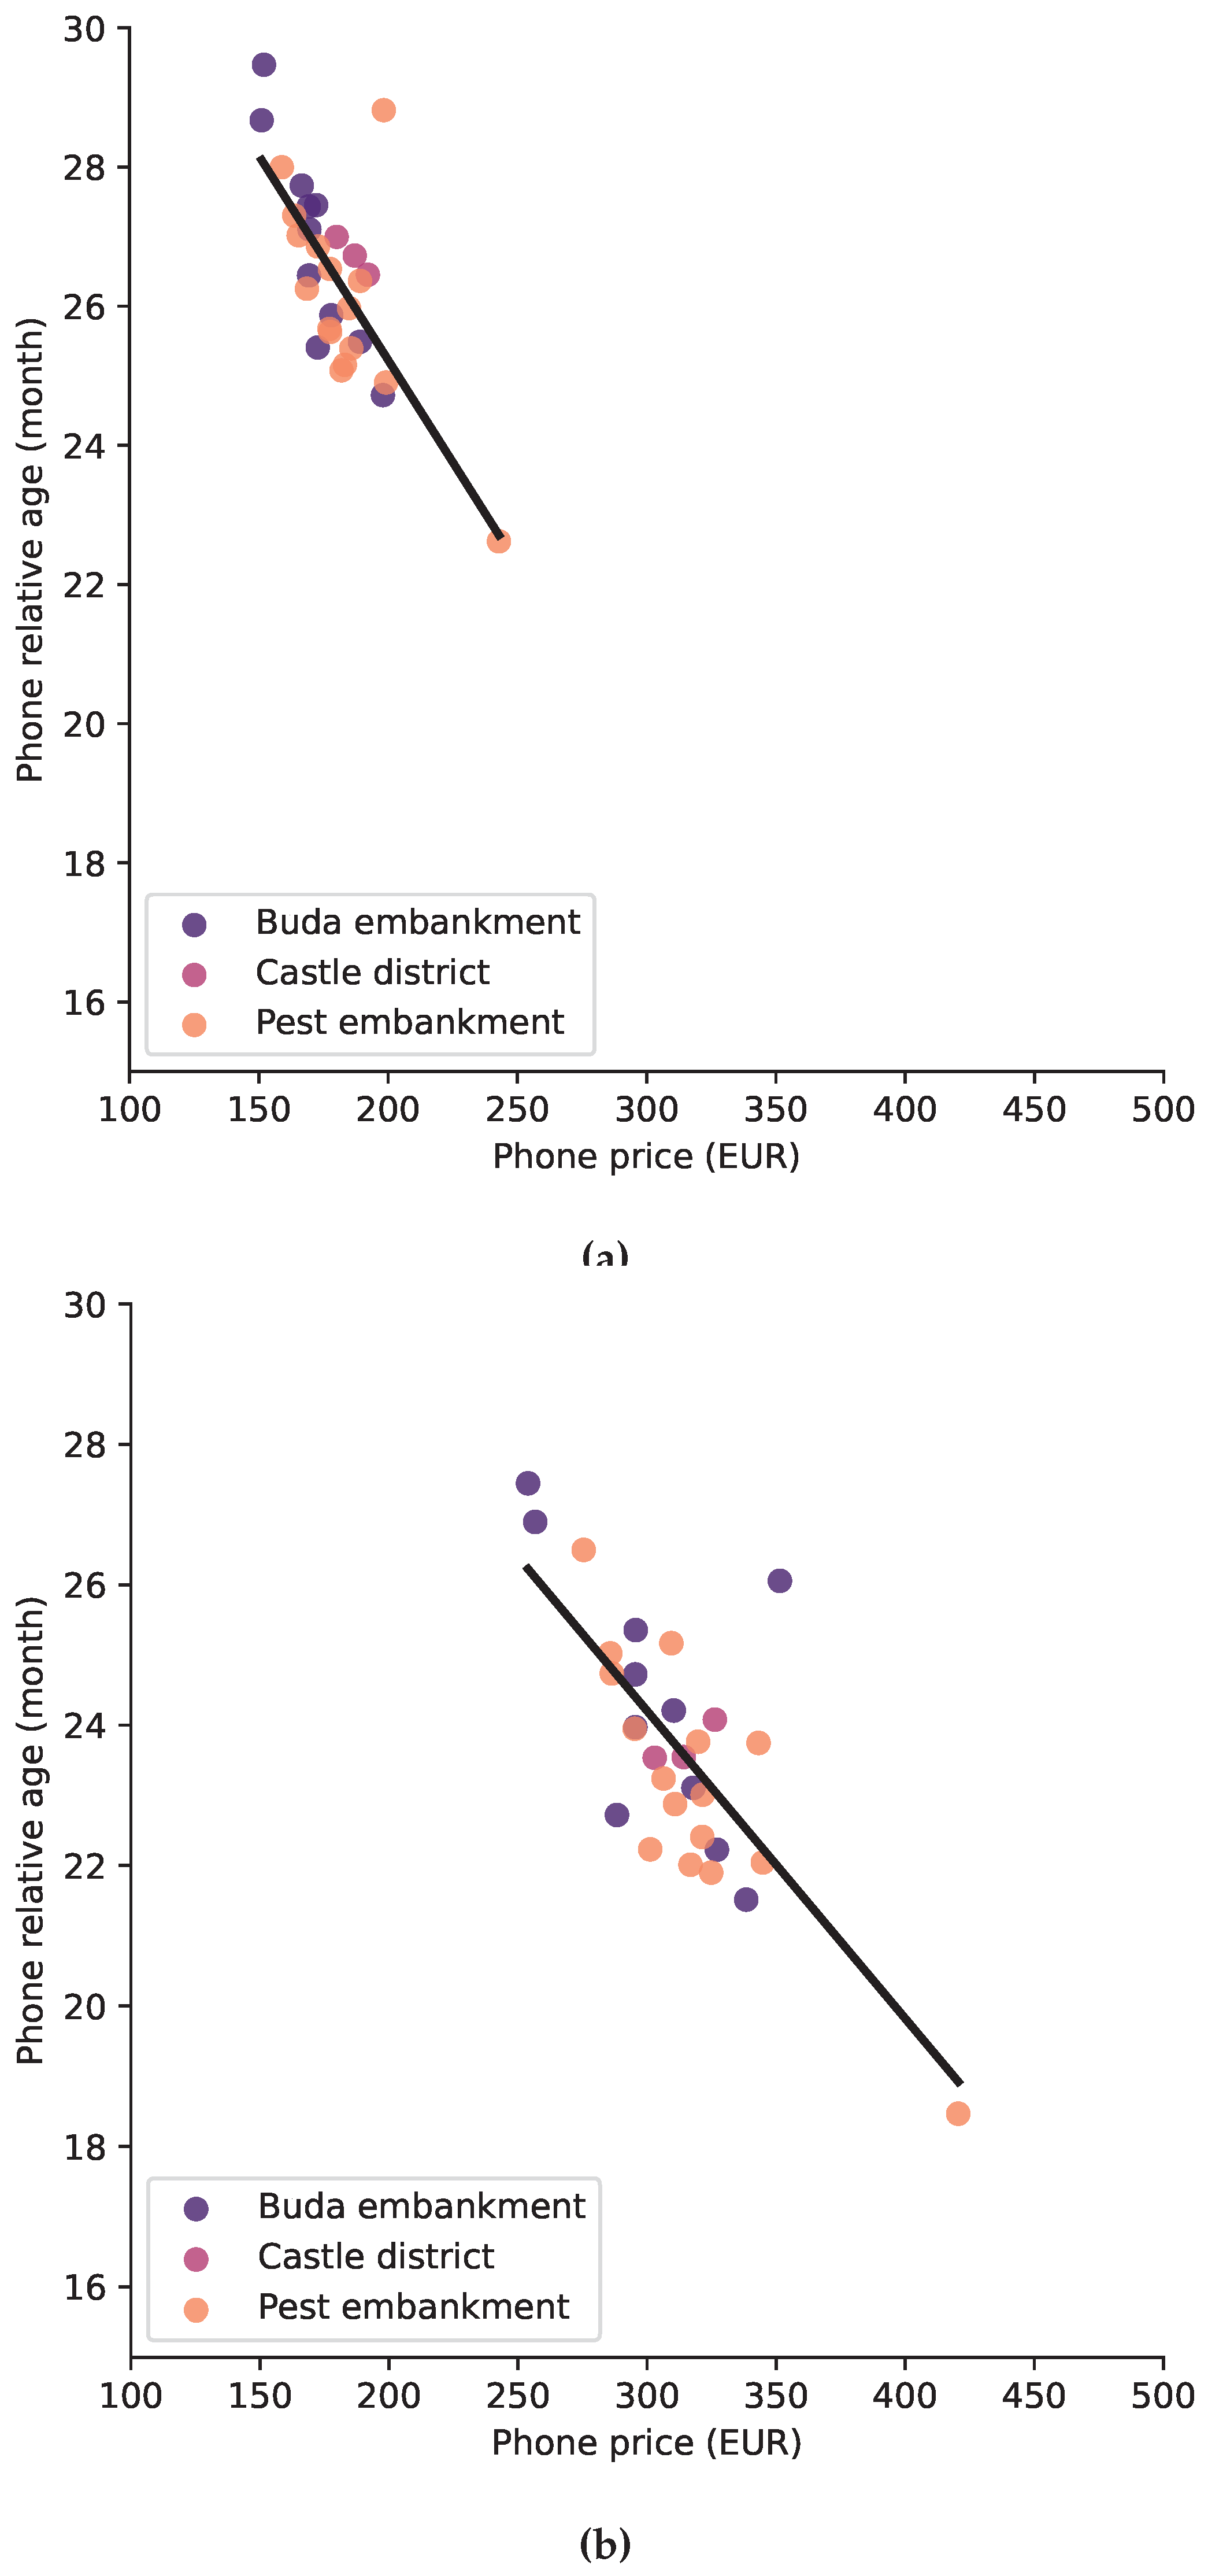
The regression plot of the same data is shown in
Figure 10, where (
Figure 10a) shows the original results of the data set used in [
63], and (
Figure 10a) shows the results of the GPT-3 collection of mobile phone release prices. Data points are coloured based on their location in the city, but there are no visible groups based on socioeconomic status. The results demonstrate an opposite trend between mobile phone price and age. This was expected, as mobile phones are getting more expensive, and people who purchase more expensive phones usually change them more often than those, who own older, cheaper phones.
In
Figure 10b the regression line’s slope is closer to 45 degrees, which means that the data points are more closely correlated and are more evenly spread out along the line. This indicates a stronger linear relationship between the average mobile phone prices and ages. The Pearson correlation coefficients are respectively
and
. The new data set generates a visibly larger spread of average cell indicators, which can be the result of more phones being involved in the calculations. Compared to the GSMArena database, where only phones with known TAC, release date and price could be involved, in this study, a know TAC was sufficient and the release prices were acquired via GPT-3. Release dates were already available for all the devices used at the event. The larger spread means more distinguished cell SES indicators, and the higher amount of phone data used stands for better credibility of the results.
This section presented a concept of socioeconomic data analysis on a large social event using call detail records and mobile phone details. This work fits into current research tendencies, fusing mobile network-generated mobility data with socioeconomic descriptors that make it possible to deduce socioeconomic status from anonymous call detail records.
It was expected that in Buda, where the housing prices are higher [
36], more expensive and newer phones would generate the majority of the activity. Nonetheless, this study found that slightly more expensive phones were active in Pest, but the difference, on average, was not substantial. The base station level aggregation may have partly caused this result, or the attendees might not have watched the fireworks isolated from each other based on social status.
4.3. Clustering
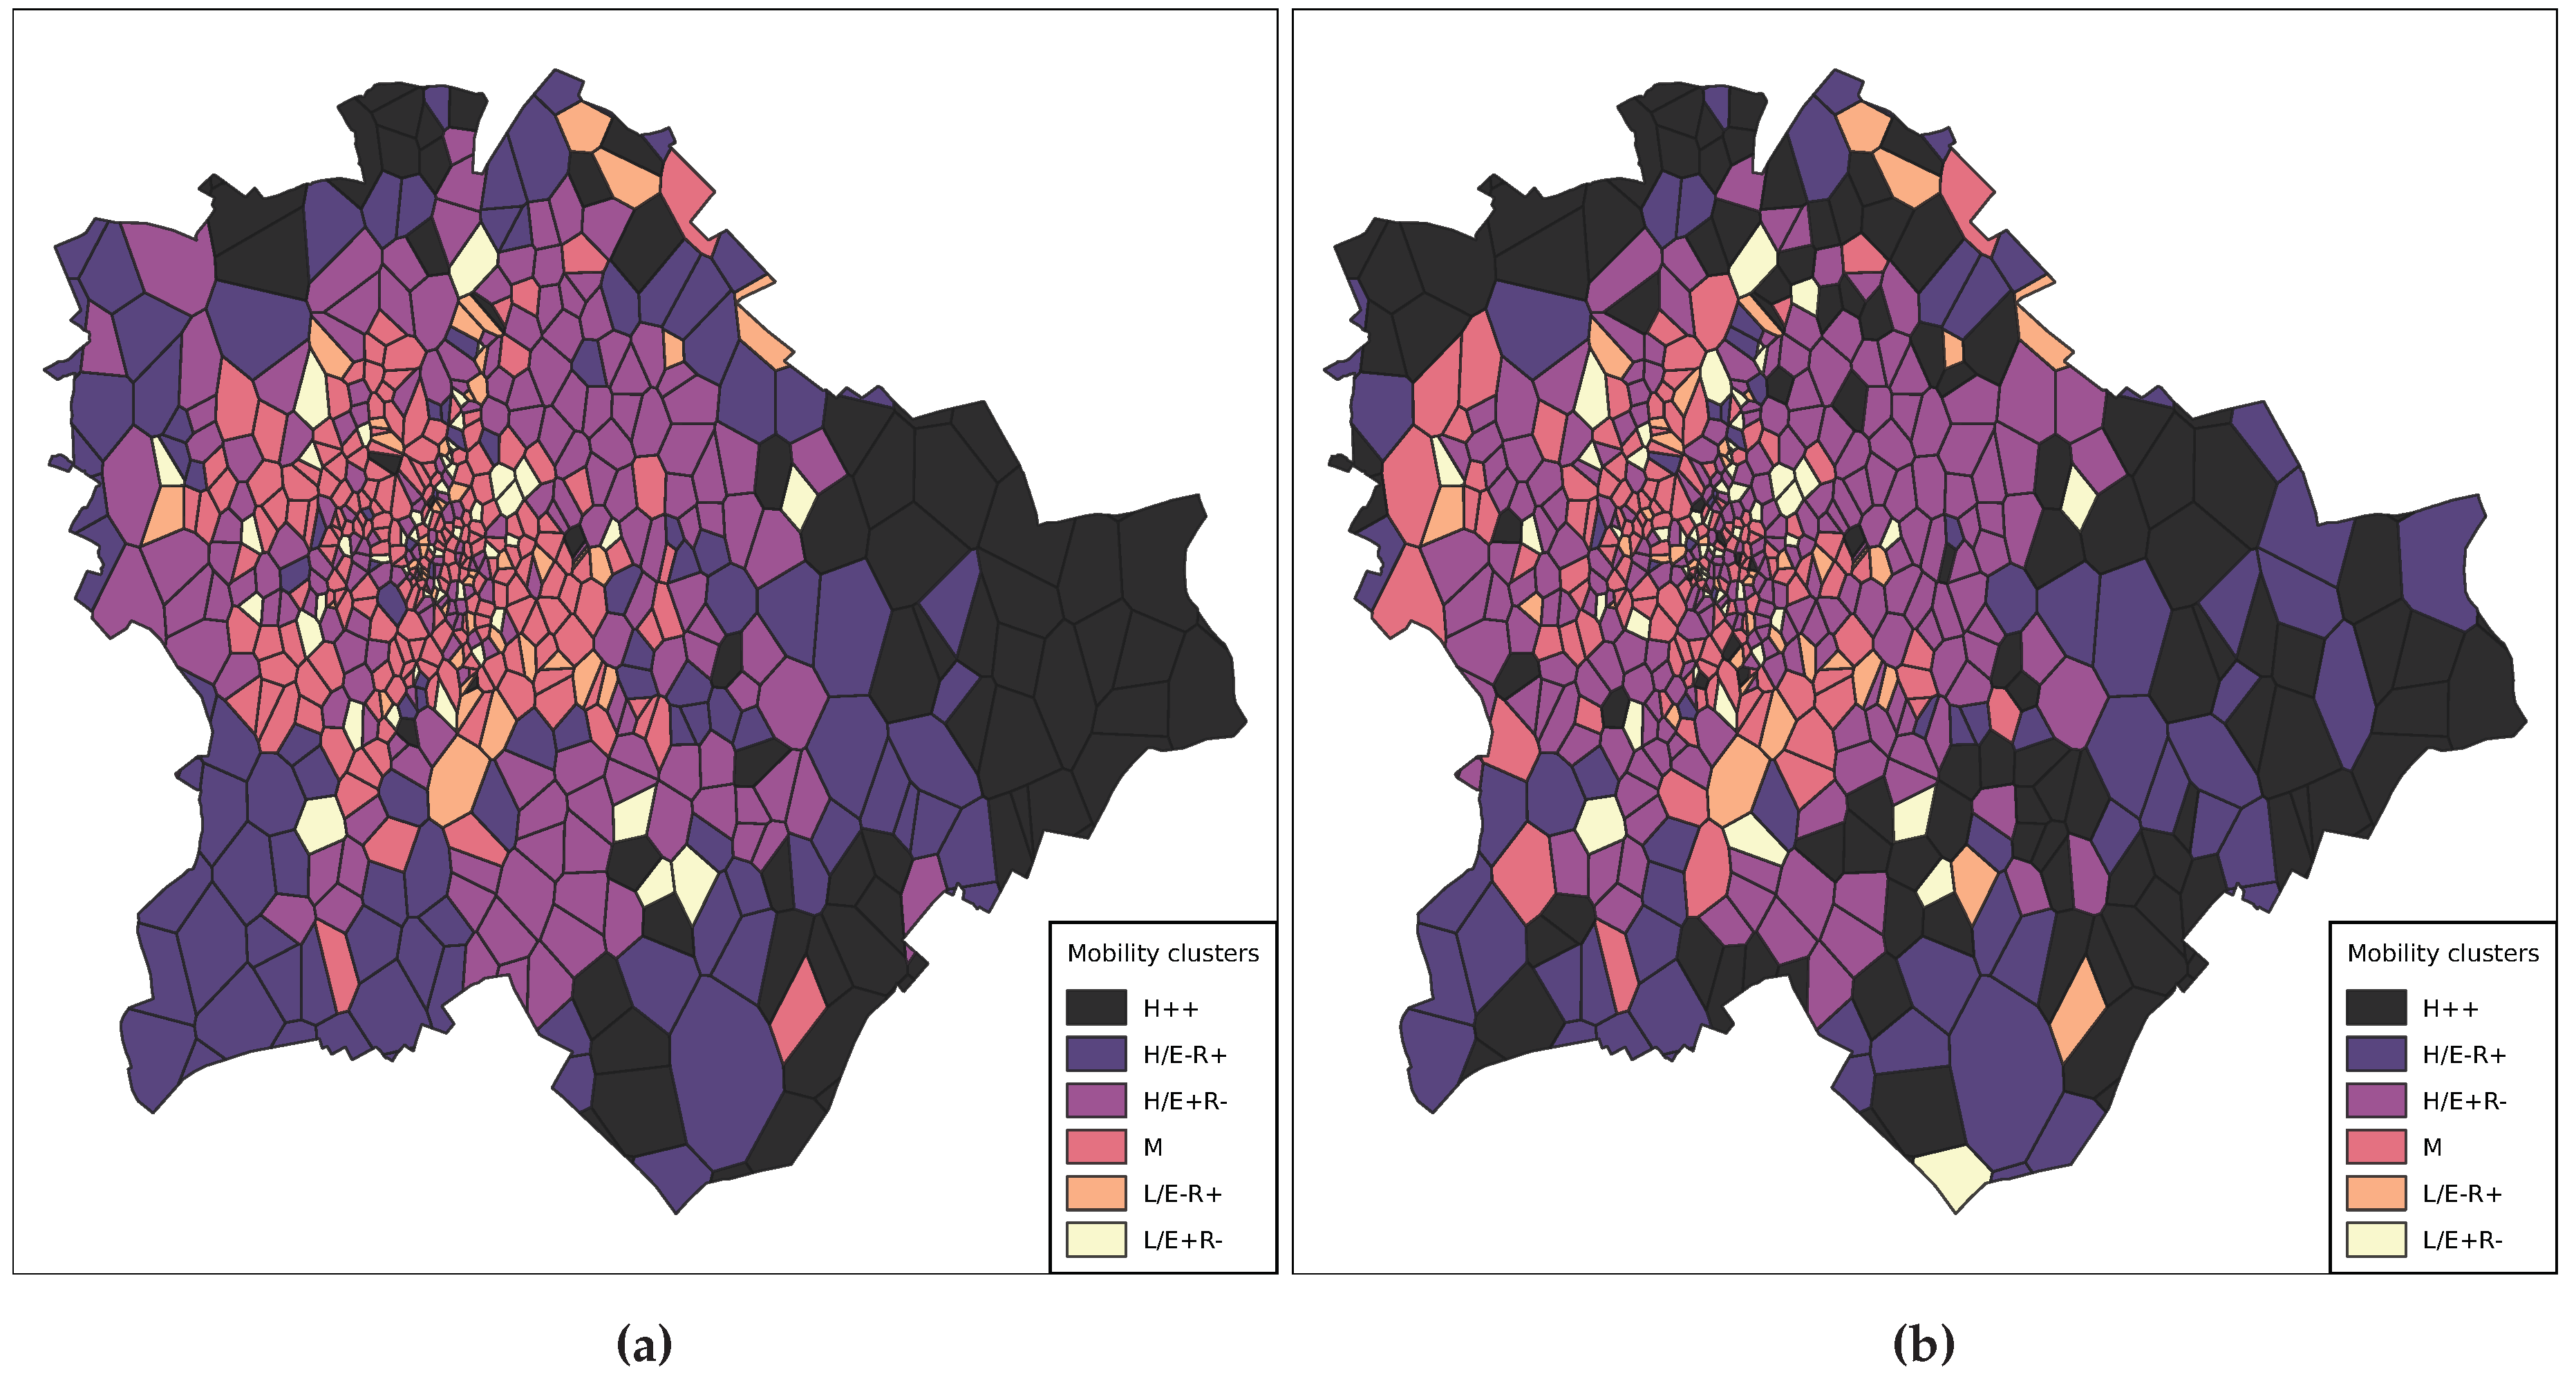
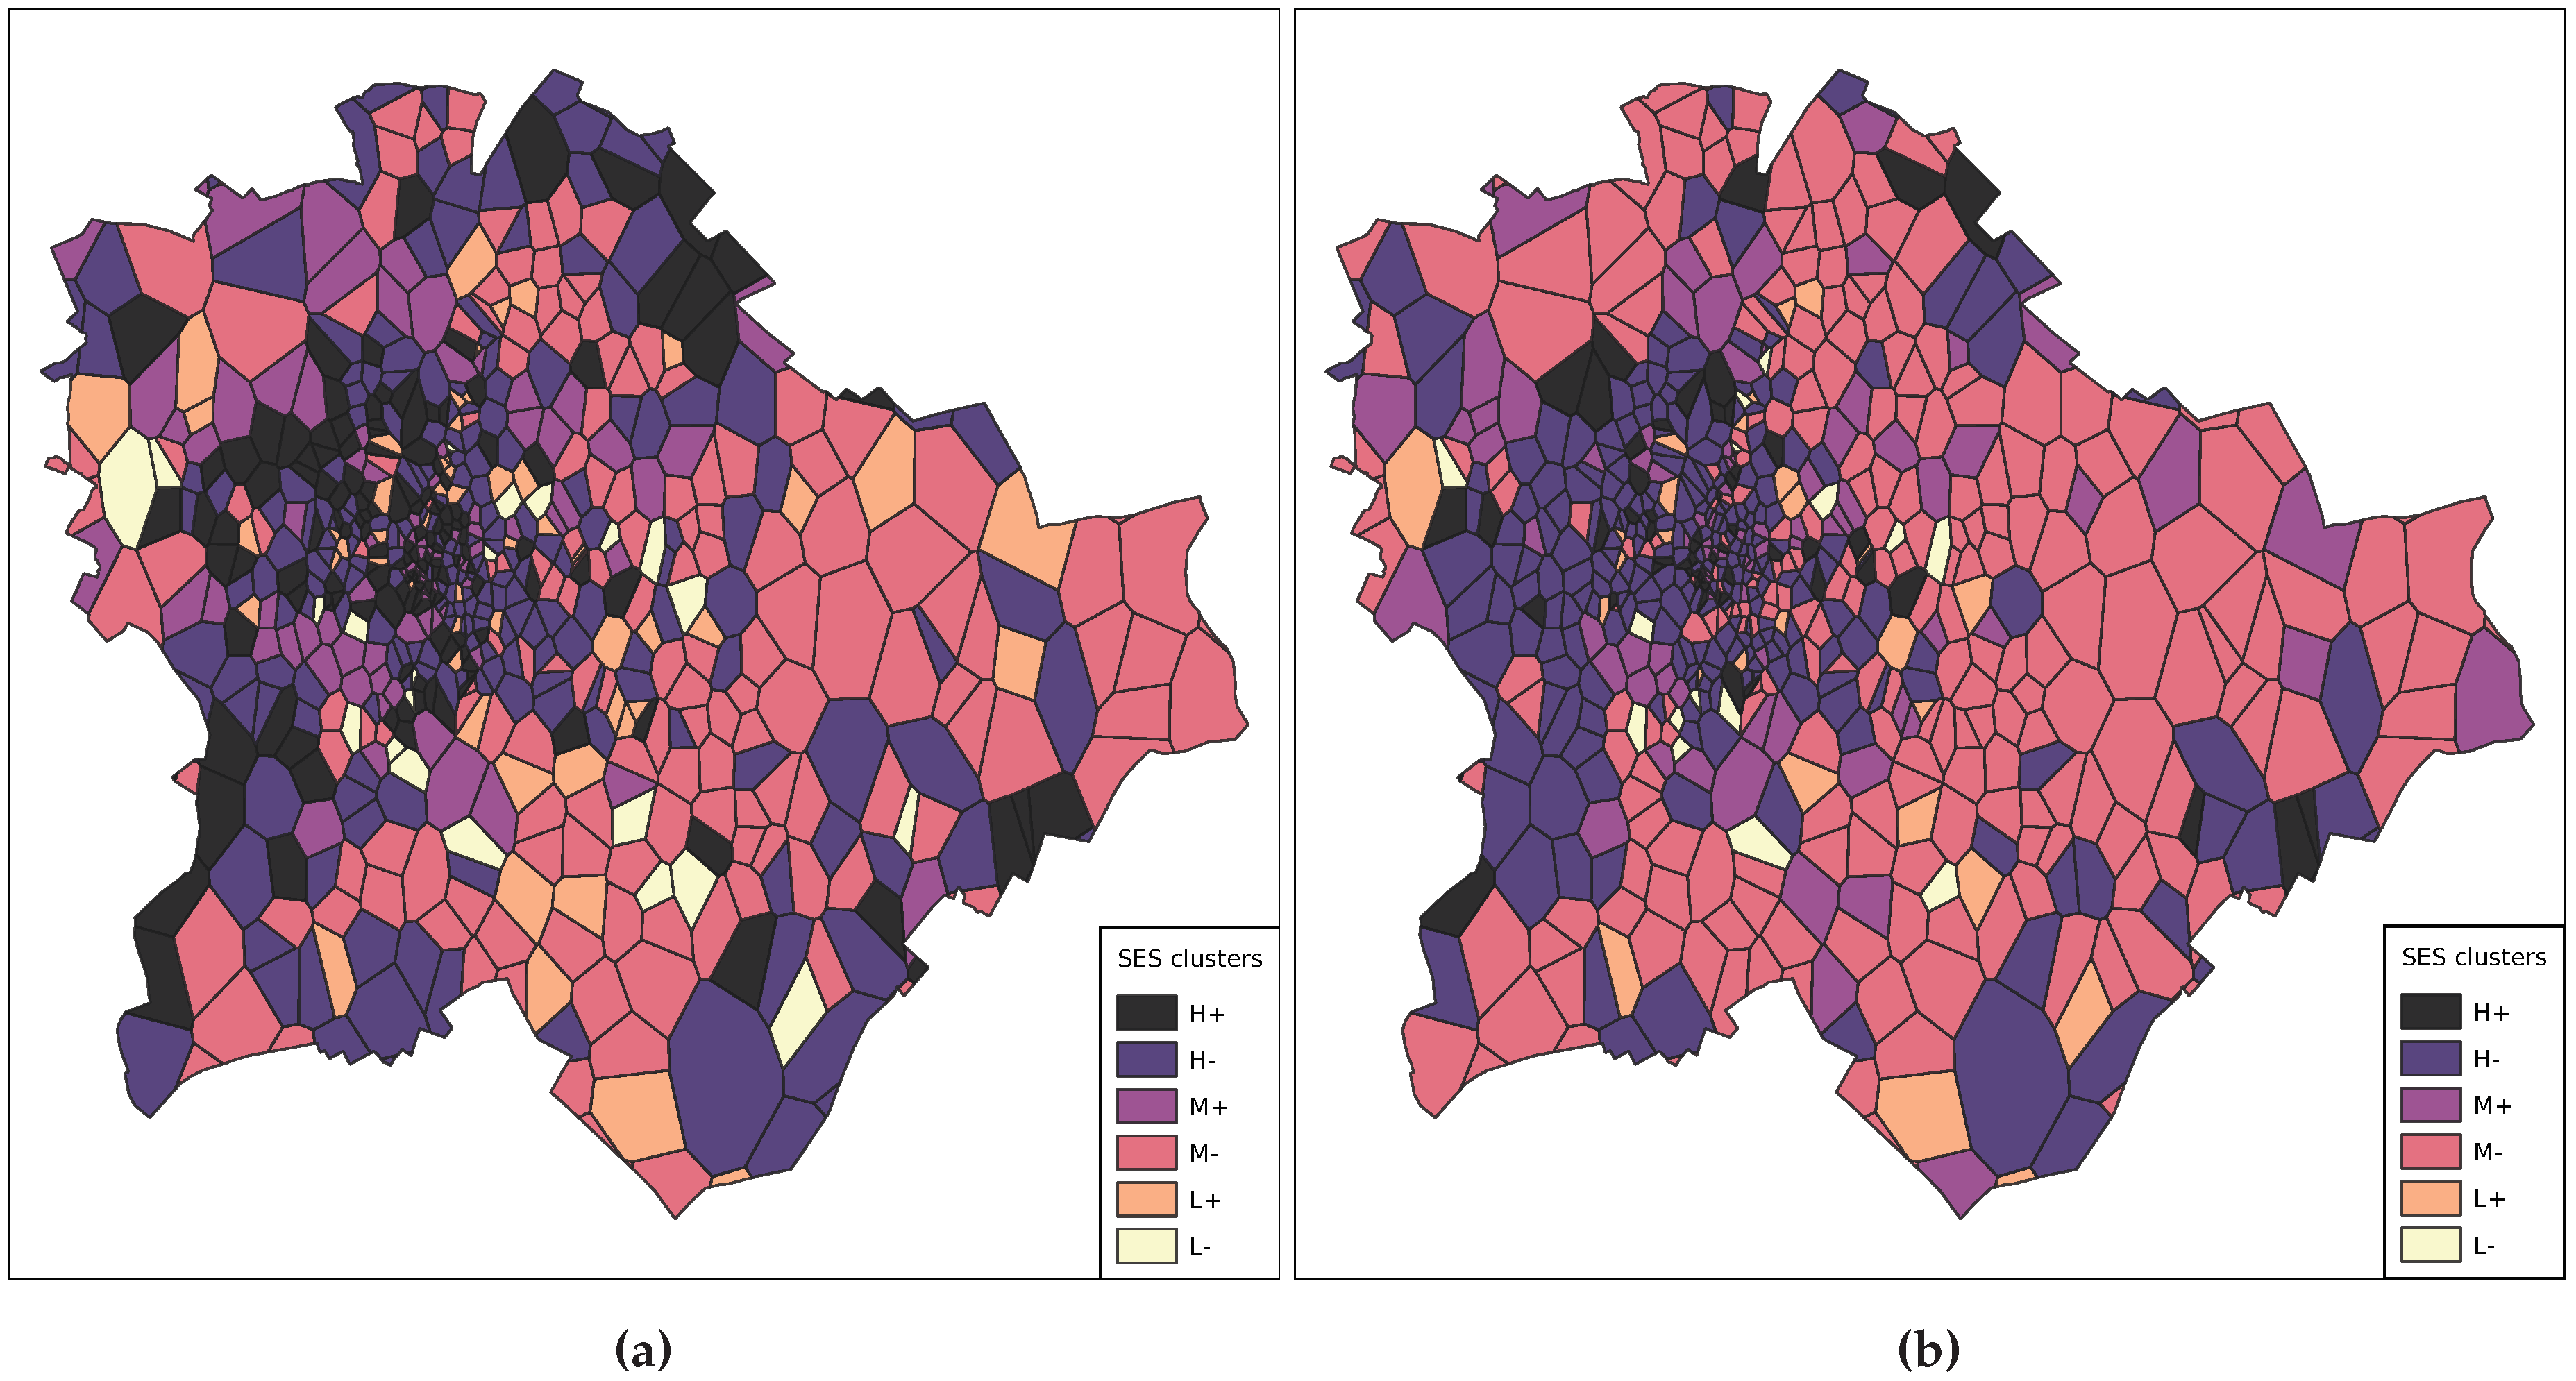
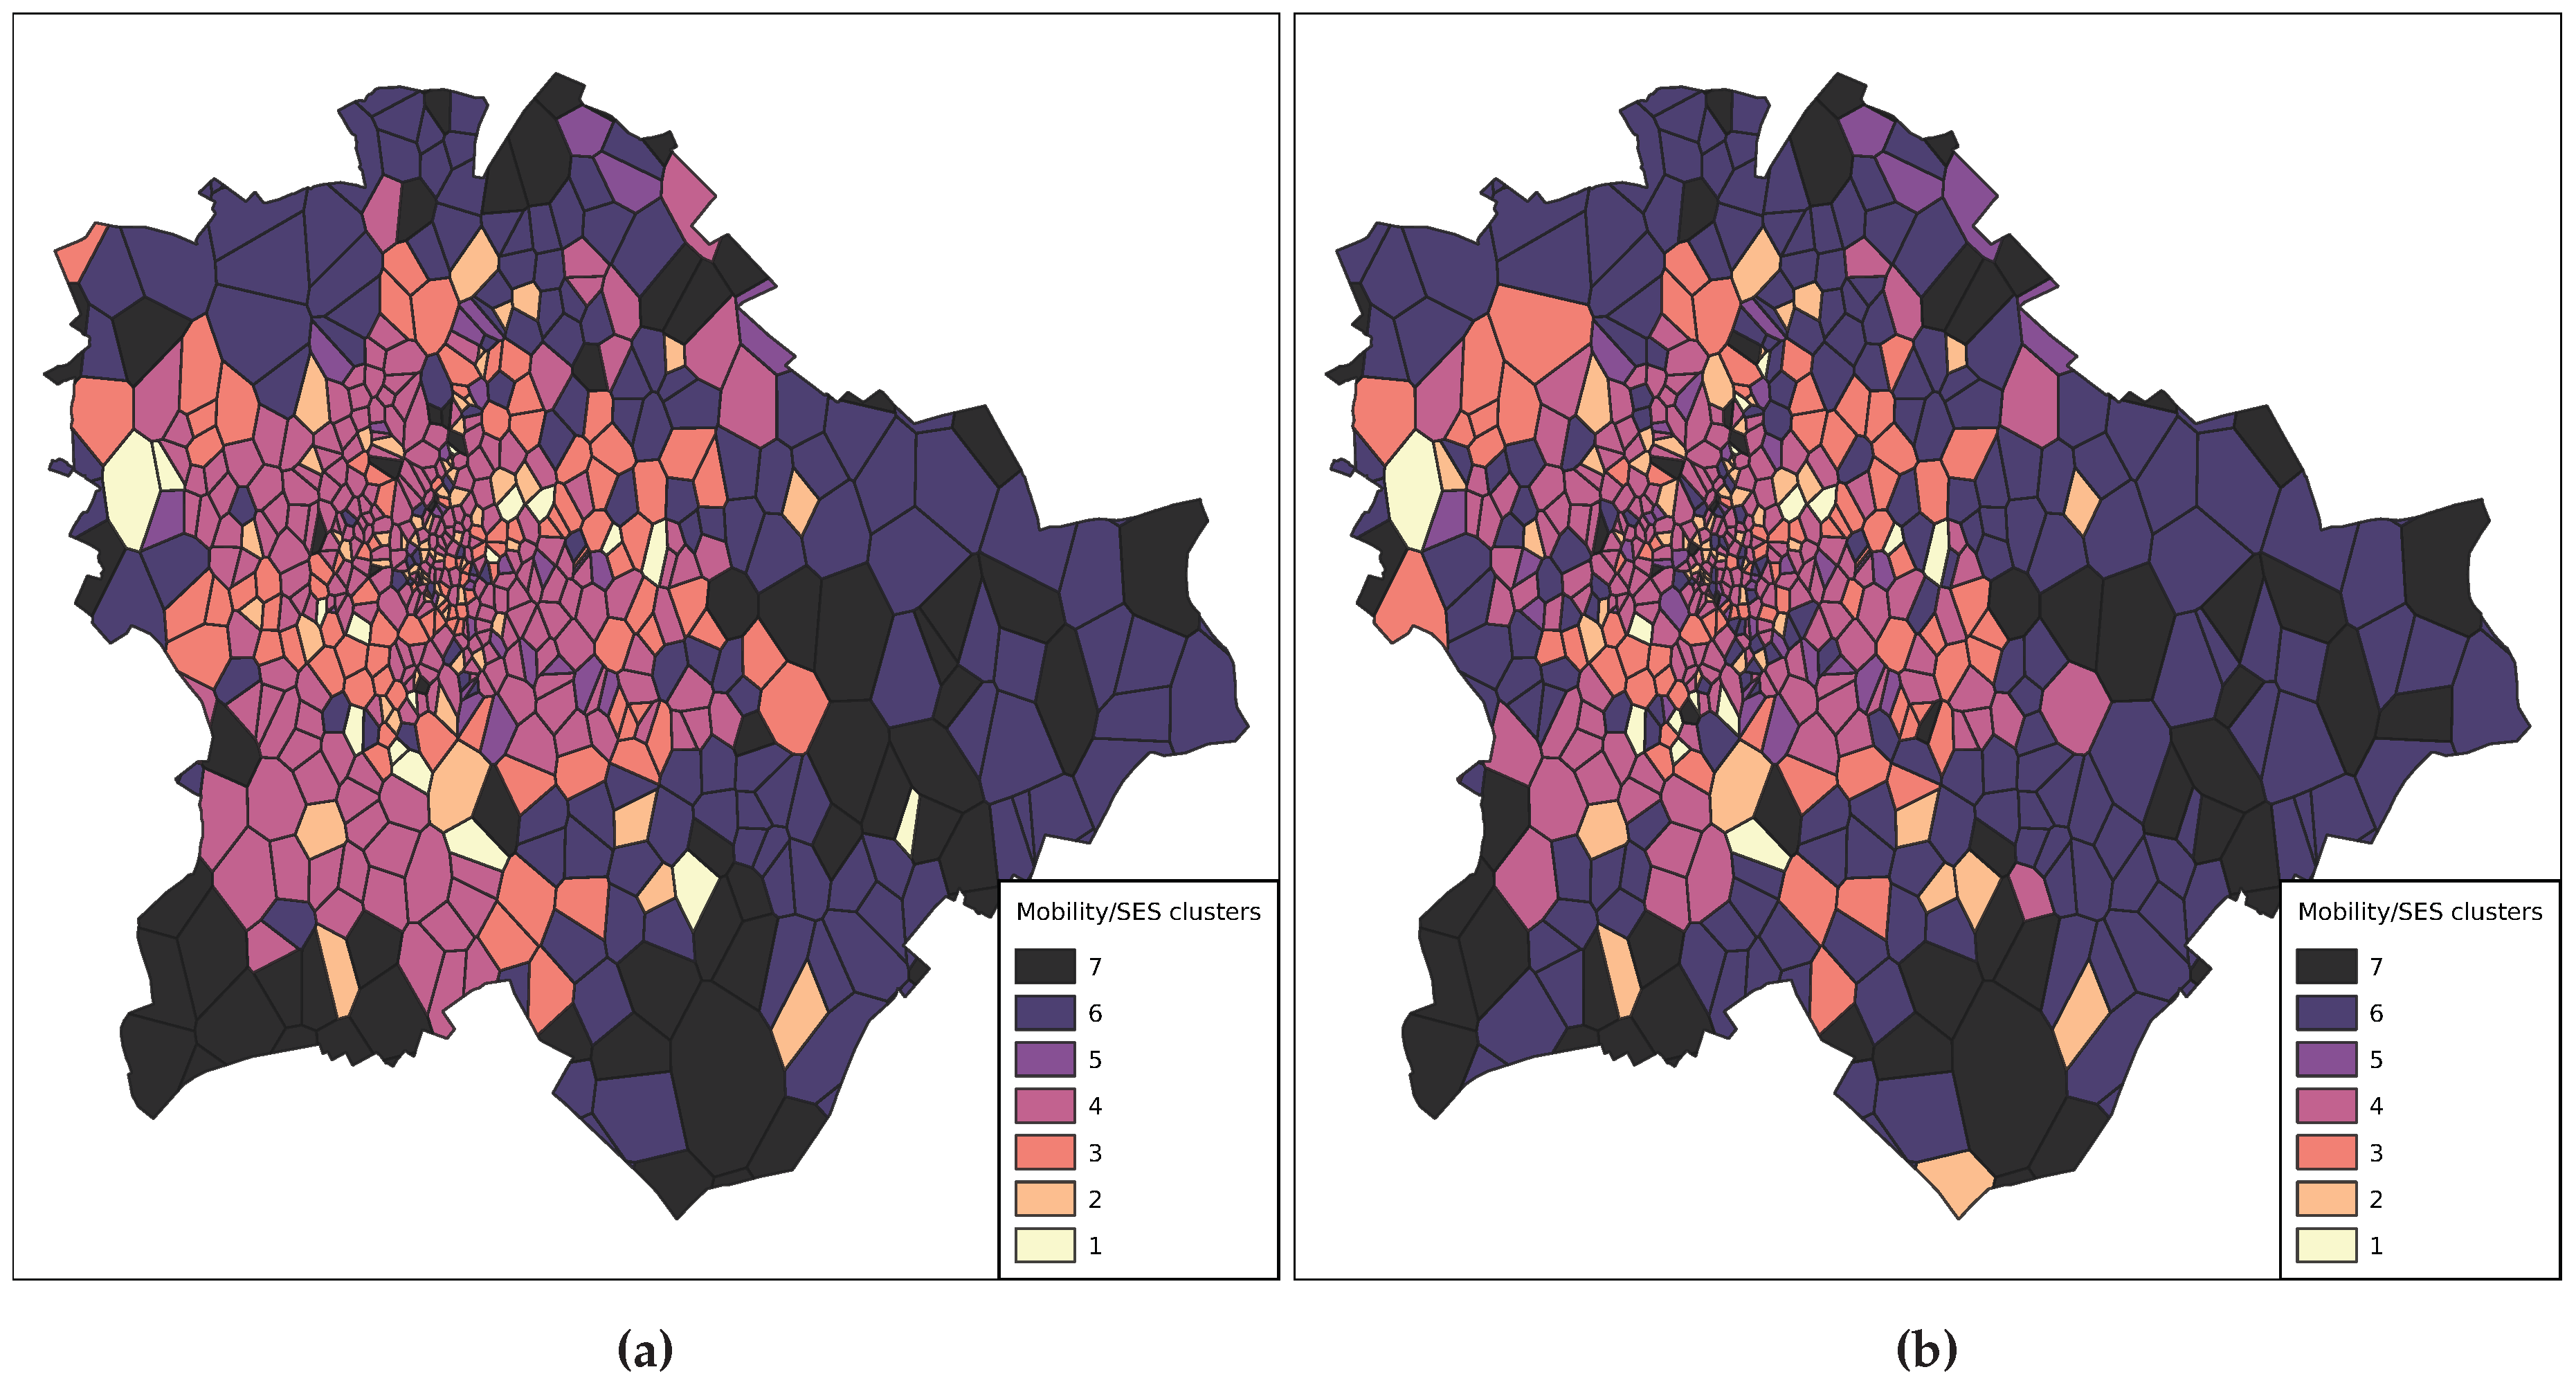
Six different input data sets were prepared and processed using the clustering framework. Three sets of indicators were selected: mobility, SES, mobility and SES together; on two separate days: the 19th and 20th of August 2014. The two days are different because the former is a regular workday, and the latter is a national holiday. The results are shown in the form of maps of Budapest, where the Voronoi cells are coloured by cluster cell centroid positions. Darker colours indicate higher values in the units of measures of clustering data dimensions.
4.3.1. Mobility Clusters
Mobile phone users’ mobility customs were represented by their radius of gyration and entropy calculated over the whole period of the data collection, detailed in
Section 3.1. Using the clustering framework and the list of cells with their average mobility metrics, six SES groups were determined:
H++ - High radius of gyration and high entropy.
H/E–R+ - High metrics overall, lower entropy and higher radius of gyration.
H/E+R– - High metrics overall, lower radius of gyration and higher entropy.
M - Medium metrics.
L/E–R+ - Low metrics overall, lower entropy and higher radius of gyration.
L/E+R– - Low metrics overall, lower radius of gyration and higher entropy.
The visualised results are seen in
Figure 11. It is visible that the outskirts of Budapest have higher mobility metrics on average. This is possibly the result of a significant amount of individuals commuting to the city centre to work regularly. The highest (H++) clusters are almost all on the eastern side of Pest — furthest away from the centre. The distribution on the 19
th is relatively homogeneous; however, on the 20
th, a large number of cells show higher average mobility metrics towards the city centre. This might result from the national holiday and people travelling from the outskirts and other settlements to the city centre for the celebratory events. Similar results have been found in [
36], where Pinter
et al. showed that the farther lives someone from the city centre the more one travels.
4.3.2. Socioeconomic Status Clusters
Mobile phone users’ socioeconomic status was represented by their mobile phone’s relative age and price. Using the clustering framework and the list of cells with their average SES metrics, six groups of cells were determined:
,where H+ is the highest, and L– is the lowest SES cluster.
The visualised results are seen in
Figure 12. It is noticeable that the higher SES clusters are mainly in the city centre, central and south-west Buda, and north and south-east Pest. On the contrary, the lowest average SES cell clusters are east and south Pest and the outskirts. The group distribution is visibly lower on average but more homogeneous on the 20
th. This is possibly due to numerous rural attendees visiting the State Foundation Day celebrations in Budapest or simply higher activity from individuals from groups of lower SES. In line with other research results [
6,
34] mobile phone prices as SES indicators are sufficient to uncover clusters in an urban population.
4.3.3. Mobility and Socioeconomic Clusters
Cells were clustered based on their average mobility and socioeconomic status indicators. These mixed groups were resolved using all four metrics used in
Section 4.3.1 and
Section 4.3.2. Seven groups of cells were determined using the clustering framework and the list of cells with their average mixed metrics: 1 – 7. The cell centroids exist in a four-dimensional space; hence, cluster labels were not given as in previous cases.
The visualised results in
Figure 13 show that homogeneous groups of cells form on large areas. The outskirts and the centre are separate from each other. The spatial cluster distribution is more homogeneous on the 19
th than on the 20
th of August; however, there are only more minor differences between the two days, unlike in
Section 4.3.1 and
Section 4.3.2. Changes in larger areas between the two observation periods are mainly visible in central and south Buda. In line with other results [
19,
36], it is clear, that the mobility customs of the inhabitants are not strongly dependent on their socioeconomic status. Note that another study [
64] observes a positive correlation between travel diversity and per capita income based on mobile phone data collected in France.
4.4. Limitations
When considering the separating effect of the river, the subscribers’ home locations are not taken into consideration. As the observation period is very short — only a few days — it is hardly possible to determine the home locations with confidence. So, it cannot be taken into consideration that a spectator lives on the same side of the river where they watched the fireworks. Furthermore, many people came to Budapest from the countryside to watch the event, but the observation area was only Budapest, so even their morning location could not have been used. Moreover, it is also possible, that the “goodness” of the viewpoint is more important than the side of the river, viewers would end up naturally. There are several bridges on the Danube, mostly accessible by foot, hence getting across should not cause any problems.
Another limitation of the study is the possibility of a non-representative data sample. Potentially, watching fireworks alone can have a socioeconomic status bias — people from lower SES groups might be more likely to attend such events.
The socioeconomic status is estimated with the release price of mobile phones. However, subscribers did not necessarily purchase their phones at that price. Many people buy their phone used, on sale or discount via the operator in exchange for signing an x-year contract. Furthermore, mobile phone prices do not reflect the full range of a person’s financial resources. For example, a person could have a high-end phone but still face financial hardship due to other expenses, and vice versa. Moreover, mobile phone prices may not accurately reflect the current economic situation in a particular region or country. For example, Hungary has a low purchasing power parity compared to the rest of the EU or North America. Therefore, high-end phones are more likely to indicate a higher level of socioeconomic status.
The GPT-3 language model was used to gather the phone prices on a large scale. Although the gathered information is proven to be adequate it has some limitations. The example of the Apple iPhone models showed that the variant of a given model can have significant price differences based on its properties (e.g., storage). As only the model is known, these differences cannot be taken into consideration but may have a considerable effect on socioeconomic status. Moreover, GPT-3 is known to be untethered to the truth, hence the acquired mobile phone prices may be inaccurate.
4.5. Future Work
Naturally, longer observation period and more recent data (both mobile network and mobile price) could help to improve the results. With data from more days available, home and work locations could be determined — with their help, more precise event attendance estimation would be possible. Cell tower directions or more granulated cells could uncover new clusters and show separation between the event attendees based on their socioeconomic status.
Furthermore, cell switching information could help determine trajectories, and thus build an accurate primary event location for individuals.
The current solution takes every user into consideration, who generated at least one record during the event, or analysis timeframe. With randomised user selection socioeconomic status and mobile phone usage biases could be reduced.
The rivers separating effect might be analysed further, not only during a large social event, but in general during the everyday life of the individuals.
5. Conclusions
In this study, mobility customs and socioeconomic status of mobile phone users in Budapest were analysed using call detail records. The most common mobility indicators and mobile phone properties represented the individuals in a selected area. A mobile network data processing framework was developed to produce these metrics, and the methodology for a large-scale event analysis was proposed. In addition, a clustering framework was introduced to investigate socioeconomic status and mobility indicators, which is capable of grouping spatial cells.
GPT-3 was utilised to gather mobile phone release prices on a large scale, which is then used to estimate the socioeconomic status of the subscribers. The results were presented using Voronoi tessellation maps with cell locations as centroids. The large-scale event analysis showed minor differences in socioeconomic status indicators between Buda and Pest during the fireworks of the 2014 State Foundation Day in Budapest. Between the city centre and the outskirts, however, major differences in socioeconomic status have been discovered. There are hundreds of Euros differences between the highest and lowest cells regarding average phone prices.
Using the clustering framework three different clusterings were performed — based on human mobility, socioeconomic status, and mixed indicators. All proved to be capable of uncovering homogeneous areas of Budapest using the selected indicators. Clustering was proven to be an expressive spatiotemporal metric for data-driven analytics and a robust technique that can be applied to a range of datasets to uncover meaningful patterns in a given area. Furthermore, it is possible to compare different clustering results to look for similarities and differences in their spatial characteristics.
Author Contributions
Conceptualisation, K.Sz. and G.P.; methodology, K.Sz. and G.P.; software, K.Sz. and G.P.; validation, K.Sz. and G.P.; formal analysis, K.Sz. and G.P.; investigation, K.Sz. and G.P.; resources, G.P.; data curation, G.P.; writing—original draft preparation, K.Sz.; writing—review and editing, K.Sz. and G.P.; visualisation, K.Sz.; supervision, G.P. and I.F.; project administration, G.P. and I.F. All authors have read and agreed to the published version of the manuscript.
Institutional Review Board Statement
Not applicable
Informed Consent Statement
Not applicable
Data Availability Statement
The mobile network data, and the type allocation codes used in this study, are not publicly available due to third-party restrictions. For plotting the maps, OpenStreetMap data were used; these data are copyrighted by the OpenStreetMap contributors and licensed under the Open Data Commons Open Database License (ODbL).
Acknowledgments
The authors would like to thank Vodafone Hungary and 51Degrees for providing the Call Detail Records and the Type Allocation Code database used in this study.
Conflicts of Interest
The authors declare no conflict of interest. The funders had no role in the design of the study; in the collection, analyses, or interpretation of data; in the writing of the manuscript, or in the decision to publish the results.
Abbreviations
The following abbreviations are used in this manuscript:
| AI |
Artificial Intelligence |
| API |
Application Programming Interface |
| CDR |
Call Detail Record |
| EU |
European Union |
| EUR |
Euro |
| GPS |
Global Positioning System |
| GPT |
Generative Pre-trained Transformer |
| GSM |
Global System for Mobile Communications |
| HUF |
Hungarian Forint |
| ID |
Identification |
| IMEI |
International Mobile Equipment Identity |
| SES |
Social Economic Status |
| SIM |
Subscriber Identity Module |
| TAC |
Type Allocation Code |
| UEFA |
Union of European Football Associations |
| USD |
United States dollar |
References
- United Nations, Department of Economic and Social Affairs, Population Division. World Urbanization Prospects: The 2018 Revision (ST/ESA/SER.A/420), 2019.
- Mamei, M.; Colonna, M. Estimating attendance from cellular network data. International Journal of Geographical Information Science 2016, 30, 1281–1301. [Google Scholar] [CrossRef]
- Furletti, B.; Trasarti, R.; Cintia, P.; Gabrielli, L. Discovering and understanding city events with big data: the case of rome. Information 2017, 8, 74. [Google Scholar] [CrossRef]
- Hiir, H.; Sharma, R.; Aasa, A.; Saluveer, E. Impact of Natural and Social Events on Mobile Call Data Records – An Estonian Case Study. Complex Networks and Their Applications VIII; Cherifi, H.; Gaito, S.; Mendes, J.F.; Moro, E.; Rocha, L.M., Eds.; Springer International Publishing: Cham, 2020; pp. 415–426.
- Rotman, A.; Shalev, M. Using Location Data from Mobile Phones to Study Participation in Mass Protests. Sociological Methods & Research, 2020; 0049124120914926. [Google Scholar]
- Pintér, G.; Felde, I. Analyzing the Behavior and Financial Status of Soccer Fans from a Mobile Phone Network Perspective: Euro 2016, a Case Study. Information 2021, 12, 468. [Google Scholar] [CrossRef]
- Pintér, G.; Felde, I. Awakening City: Traces of the Circadian Rhythm within the Mobile Phone Network Data. Information 2022, 13, 114. [Google Scholar] [CrossRef]
- Dale, R. GPT-3: What’s it good for? Natural Language Engineering 2021, 27, 113–118. [Google Scholar] [CrossRef]
- Candia, J.; González, M.C.; Wang, P.; Schoenharl, T.; Madey, G.; Barabási, A.L. Uncovering individual and collective human dynamics from mobile phone records. Journal of physics A: mathematical and theoretical 2008, 41, 224015. [Google Scholar] [CrossRef]
- Gonzalez, M.C.; Hidalgo, C.A.; Barabasi, A.L. Understanding individual human mobility patterns. nature 2008, 453, 779–782. [Google Scholar] [CrossRef] [PubMed]
- Pappalardo, L.; Simini, F.; Rinzivillo, S.; Pedreschi, D.; Giannotti, F.; Barabási, A.L. Returners and explorers dichotomy in human mobility. Nature communications 2015, 6, 1–8. [Google Scholar] [CrossRef] [PubMed]
- Andrienko, N.; Andrienko, G. Designing visual analytics methods for massive collections of movement data. Cartographica: The International Journal for Geographic Information and Geovisualization 2007, 42, 117–138. [Google Scholar] [CrossRef]
- Calabrese, F.; Colonna, M.; Lovisolo, P.; Parata, D.; Ratti, C. Real-time urban monitoring using cell phones: A case study in Rome. IEEE transactions on intelligent transportation systems 2010, 12, 141–151. [Google Scholar] [CrossRef]
- Sagl, G.; Loidl, M.; Beinat, E. A visual analytics approach for extracting spatio-temporal urban mobility information from mobile network traffic. ISPRS International Journal of Geo-Information 2012, 1, 256–271. [Google Scholar] [CrossRef]
- Senaratne, H.; Mueller, M.; Behrisch, M.; Lalanne, F.; Bustos-Jiménez, J.; Schneidewind, J.; Keim, D.; Schreck, T. Urban mobility analysis with mobile network data: A visual analytics approach. IEEE Transactions on Intelligent Transportation Systems 2017, 19, 1537–1546. [Google Scholar] [CrossRef]
- Wirz, M.; Franke, T.; Roggen, D.; Mitleton-Kelly, E.; Lukowicz, P.; Tröster, G. Probing crowd density through smartphones in city-scale mass gatherings. EPJ Data Science 2013, 2, 1–24. [Google Scholar] [CrossRef]
- Barnett, I.; Khanna, T.; Onnela, J.P. Social and spatial clustering of people at humanity’s largest gathering. PLOS ONE 2016, 11, 1–12. [Google Scholar] [CrossRef] [PubMed]
- Hiir, H.; Sharma, R.; Aasa, A.; Saluveer, E. Impact of Natural and Social Events on Mobile Call Data Records – An Estonian Case Study. Complex Networks and Their Applications VIII. Springer, 2019, pp. 415–426.
- Xu, Y.; Belyi, A.; Bojic, I.; Ratti, C. Human mobility and socioeconomic status: Analysis of Singapore and Boston. Computers, Environment and Urban Systems 2018, 72, 51–67. [Google Scholar] [CrossRef]
- Stowe, K. An Introduction to Thermodynamics and Statistical Mechanics; Cambridge University Press, 2007. [Google Scholar]
- Song, C.; Qu, Z.; Blumm, N.; Barabási, A.L. Limits of predictability in human mobility. Science 2010, 327, 1018–1021. [Google Scholar] [CrossRef] [PubMed]
- Pappalardo, L.; Vanhoof, M.; Gabrielli, L.; Smoreda, Z.; Pedreschi, D.; Giannotti, F. An analytical framework to nowcast well-being using mobile phone data. International Journal of Data Science and Analytics 2016, 2, 75–92. [Google Scholar] [CrossRef]
- Pintér, G.; Nadai, L.; Bognár, G.; Felde, I. Evaluation of mobile phone signals in urban environment during a large social event. 2018 IEEE 12th International Symposium on Applied Computational Intelligence and Informatics (SACI). IEEE, 2018, pp. 247–250.
- Preoţiuc-Pietro, D.; Lampos, V.; Aletras, N. An analysis of the user occupational class through Twitter content. 53rd Annual Meeting of the Association for Computational Linguistics and the 7th International Joint Conference on Natural Language Processing (Volume 1: Long Papers), 2015, pp. 1754–1764.
- Preoţiuc-Pietro, D.; Volkova, S.; Lampos, V.; Bachrach, Y.; Aletras, N. Studying user income through language, behaviour and affect in social media. PloS one 2015, 10, e0138717. [Google Scholar] [CrossRef] [PubMed]
- Lampos, V.; Aletras, N.; Geyti, J.K.; Zou, B.; Cox, I.J. Inferring the socioeconomic status of social media users based on behaviour and language. European conference on information retrieval. Springer, 2016, pp. 689–695.
- Huang, Q.; Wong, D.W. Activity patterns, socioeconomic status and urban spatial structure: what can social media data tell us? International Journal of Geographical Information Science 2016, 30, 1873–1898. [Google Scholar] [CrossRef]
- Soto, V.; Frias-Martinez, V.; Virseda, J.; Frias-Martinez, E. Prediction of socioeconomic levels using cell phone records. International conference on user modeling, adaptation, and personalization. Springer, 2011, pp. 377–388.
- Frias-Martinez, V.; Virseda, J. Cell phone analytics: Scaling human behavior studies into the millions. Information Technologies & International Development 2013, 9, 35–50. [Google Scholar]
- Blumenstock, J.; Cadamuro, G.; On, R. Predicting poverty and wealth from mobile phone metadata. Science 2015, 350, 1073–1076. [Google Scholar] [CrossRef] [PubMed]
- Almaatouq, A.; Prieto-Castrillo, F.; Pentland, A. Mobile communication signatures of unemployment. International conference on social informatics. Springer, 2016, pp. 407–418.
- Ding, S.; Huang, H.; Zhao, T.; Fu, X. Estimating Socioeconomic Status via Temporal-Spatial Mobility Analysis - A Case Study of Smart Card Data. 2019 28th International Conference on Computer Communication and Networks (ICCCN), 2019, pp. 1–9.
- Barbosa, H.; Hazarie, S.; Dickinson, B.; Bassolas, A.; Frank, A.; Kautz, H.; Sadilek, A.; Ramasco, J.J.; Ghoshal, G. Uncovering the socioeconomic facets of human mobility. Scientific reports 2021, 11, 1–13. [Google Scholar] [CrossRef] [PubMed]
- Sultan, S.F.; Humayun, H.; Nadeem, U.; Bhatti, Z.K.; Khan, S. Mobile phone price as a proxy for socio-economic indicators. Proceedings of the Seventh International Conference on Information and Communication Technologies and Development, 2015, pp. 1–4.
- Wijesinghe, W.; Kumarasinghe, C.; Mannapperuma, J.; Liyanage, K. Socioeconomic status classification of geographic regions in Sri Lanka through anonymized call detail records. EAI International Conference on Big Data Innovation for Sustainable Cognitive Computing. Springer, 2020, pp. 299–311.
- Pintér, G.; Felde, I. Evaluating the Effect of the Financial Status to the Mobility Customs. ISPRS International Journal of Geo-Information 2021, 10, 328. [Google Scholar] [CrossRef]
- Brown, T.B.; Mann, B.; Ryder, N.; Subbiah, M.; Kaplan, J.; Dhariwal, P.; Neelakantan, A.; Shyam, P.; Sastry, G.; Askell, A.; et al. Language Models are Few-Shot Learners, 2020.
- Thiergart, J.; Huber, S.; Übellacker, T. Understanding Emails and Drafting Responses – An Approach Using GPT-3, 2021.
- Chintagunta, B.; Katariya, N.; Amatriain, X.; Kannan, A. Medically Aware GPT-3 as a Data Generator for Medical Dialogue Summarization. Proceedings of the 6th Machine Learning for Healthcare Conference; Jung, K.; Yeung, S.; Sendak, M.; Sjoding, M.; Ranganath, R., Eds. PMLR, 2021, Vol. 149, Proceedings of Machine Learning Research, pp. 354–372.
- Goyal, T.; Li, J.J.; Durrett, G. News Summarization and Evaluation in the Era of GPT-3, 2022.
- Wang, S.; Liu, Y.; Xu, Y.; Zhu, C.; Zeng, M. Want To Reduce Labeling Cost? GPT-3 Can Help, 2021.
- Bishop, C.M.; Nasrabadi, N.M. Pattern recognition and machine learning; Vol. 4, Springer, 2006.
- Estivill-Castro, V. Why so many clustering algorithms: a position paper. ACM SIGKDD explorations newsletter 2002, 4, 65–75. [Google Scholar] [CrossRef]
- Yang, P.; Zhu, T.; Wan, X.; Wang, X. Identifying significant places using multi-day call detail records. 2014 IEEE 26th International Conference on Tools with Artificial Intelligence. IEEE, 2014, pp. 360–366.
- Qin, S.; Zuo, Y.; Wang, Y.; Sun, X.; Dong, H. Travel trajectories analysis based on call detail record data. 2017 29th Chinese Control And Decision Conference (CCDC). IEEE, 2017, pp. 7051–7056.
- Nair, S.C.; Elayidom, M.S.; Gopalan, S. Call detail record-based traffic density analysis using global K-means clustering. International Journal of Intelligent Enterprise 2020, 7, 176–187. [Google Scholar] [CrossRef]
- Gil-Garcia, R.J.; Badia-Contelles, J.M.; Pons-Porrata, A. A general framework for agglomerative hierarchical clustering algorithms. 18th International Conference on Pattern Recognition (ICPR’06). IEEE, 2006, Vol. 2, pp. 569–572.
- Ghahramani, M.; Zhou, M.; Hon, C.T. Extracting significant mobile phone interaction patterns based on community structures. IEEE Transactions on Intelligent Transportation Systems 2018, 20, 1031–1041. [Google Scholar] [CrossRef]
- Li, M.; Gao, S.; Lu, F.; Zhang, H. Reconstruction of human movement trajectories from large-scale low-frequency mobile phone data. Computers, Environment and Urban Systems 2019, 77, 101346. [Google Scholar] [CrossRef]
- Wang, H.; Calabrese, F.; Di Lorenzo, G.; Ratti, C. Transportation mode inference from anonymized and aggregated mobile phone call detail records. 13th International IEEE Conference on Intelligent Transportation Systems. IEEE, 2010, pp. 318–323.
- Sultan, K.; Ali, H.; Zhang, Z. Call detail records driven anomaly detection and traffic prediction in mobile cellular networks. IEEE Access 2018, 6, 41728–41737. [Google Scholar] [CrossRef]
- Al-Zuabi, I.M.; Jafar, A.; Aljoumaa, K. Predicting customer’s gender and age depending on mobile phone data. Journal of Big Data 2019, 6, 1–16. [Google Scholar] [CrossRef]
- Lenormand, M.; Samaniego, H.; Chaves, J.C.; da Fonseca Vieira, V.; da Silva, M.A.H.B.; Evsukoff, A.G. Entropy as a measure of attractiveness and socioeconomic complexity in Rio de Janeiro metropolitan area. Entropy 2020, 22, 368. [Google Scholar] [CrossRef]
- Ghahramani, M.; Zhou, M.C.; Qiao, Y.; Wu, N.Q. Spatio-Temporal Analysis of Mobile Phone Network based on Self-Organizing Feature Map. IEEE Internet of Things Journal 2021. [Google Scholar]
- Zhao, T.; Huang, H.; Yao, X.; Luo, J.d.; Fu, X. Predicting individual socioeconomic status from mobile phone data: a semi-supervised hypergraph-based factor graph approach. International Journal of Data Science and Analytics 2020, 9, 361–372. [Google Scholar] [CrossRef]
- Research summary for the National Media and Infocommunications Authority. Electronic Communication Services Usage by Households and Individuals, 2014.
- Hungarian Central Statistical Office. Gazetteer of Hungary 1st January, 2014; Hungarian Central Statistical Office, 2014. [Google Scholar]
- OpenAI. API. https://openai.com/api, accessed on 15.12.2022.
- szifon.com. Elérhetoek a független iPhone 4S árak a magyar Apple Store-ban! https://szifon.com/2011/10/21/elerhetoek-a-fuggetlen-iphone-4s-arak-a-magyar-apple-store-ban, accessed on 20.12.2022.
- Protalinski, E. iPhone prices from the original to iPhone X. https://venturebeat.com/2017/09/12/iphone-prices-from-the-original-to-iphone-x, accessed on 14.02.2022.
- Sainani, M. GSMArena Mobile Phone Devices. https://www.kaggle.com/msainani/gsmarena-mobile-devices, accessed on 02.03.2022.
- Bholowalia, P.; Kumar, A. EBK-means: A clustering technique based on elbow method and k-means in WSN. International Journal of Computer Applications 2014, 105. [Google Scholar]
- Szabó, K.; Pintér, G.; Felde, I. Evaluating the Socioeconomic Status of a Large Social Event Attendees. 2022 IEEE 16th International Symposium on Applied Computational Intelligence and Informatics (SACI), 2022, pp. 77–80.
- Pappalardo, L.; Pedreschi, D.; Smoreda, Z.; Giannotti, F. Using big data to study the link between human mobility and socio-economic development. 2015 IEEE International Conference on Big Data (Big Data). IEEE, 2015, pp. 871–878.
|
Disclaimer/Publisher’s Note: The statements, opinions and data contained in all publications are solely those of the individual author(s) and contributor(s) and not of MDPI and/or the editor(s). MDPI and/or the editor(s) disclaim responsibility for any injury to people or property resulting from any ideas, methods, instructions or products referred to in the content. |
© 2023 by the authors. Licensee MDPI, Basel, Switzerland. This article is an open access article distributed under the terms and conditions of the Creative Commons Attribution (CC BY) license (http://creativecommons.org/licenses/by/4.0/).
