
Submitted:
29 December 2022
Posted:
03 January 2023
You are already at the latest version
Abstract
Acanthamoeba keratitis (AK) is a blinding corneal infection caused by the protozoan Acanthamoeba. The long-term course of AK suggests the host immunity could not kill Acanthamoeba rapidly. The immune status is still unclear in the late stage of AK. The comparative transcriptome analysis was made based on the bulk RNA sequencing of cornea tissues from AK patients and donors. Differentially expressed genes and enriched signaling pathways were calculated. CIBERSORT algorithm was used for Immune infiltration analysis of cornea tissue between AK and normal controls. A total of 2668 differentially expressed genes, including 1477 upregulated genes and 1191 downregulated genes, were detected. Gene Ontology analysis revealed that the pathways were significantly enriched in leukocyte migration, regulation of T cell activation, the external side of plasma membrane, collagen-containing extracellular matrix, immune receptor activity and cytokine binding. KEGG pathway analysis showed that the pathways were significantly enriched in the cytokine-cytokine receptor interaction, hematopoietic cell lineage and Staphylococcus aureus infection pathway. The immune infiltration profiles varied little between AK and normal controls. Compared with normal tissue, cornea tissue of AK contained a higher proportion of M0 macrophages and CD8 T cells, while resting memory CD4 T cells contributed to a relatively lower portion (P < 0.05). Finally, the expression levels of cell markers and SLAMF7/STAT6 pathway were confirmed by histopathology examinations, RT-qPCR and western blot.
Keywords:
Acanthamoeba keratitis
; transcriptome analysis
; immune status
; differentially expressed genes
; SLAMF7/STAT6 pathway
1. Introduction
Acanthamoeba keratitis (AK) is a rare but potentially blinding corneal infection caused by the protozoan Acanthamoeba, an opportunistic free-living parasite. Contact lens (CL) wear and trauma become the most important risk factors for AK. With the increasing use of contact lenses around the world, the incidence of AK is obviously rising [1,2]. Carnt et al. reported 36-65 AK cases per year in the UK from 2010 to 2017, representing a 3 to 5 times increase in incidence compared to 2004-2009 (15-23 cases per year) [3]. Normally, host immune system is capable of controlling this pathogen, while under certain circumstances, for instance, wearing soft contact lens or orthokeratology [4], could render individuals more susceptible to Acanthamoeba infection. Because AK is frequently misdiagnosed as fungal or viral keratitis, as well as Acanthamoeba can differentiate into cysts inside host tissues which resist multiple antiseptics, AK is difficult to treat and so may result in blindness and corneal scarring, even in immunocompetent people [5], as compared to Acanthamoeba encephalitis, which occurs in immunocompromised patients more often. Understanding of the micro change in AK is essential to furtherly explore more interventions of pathogen killing.
Classically, inherent immunity is the main way to kill protozoa. The activated macrophages polarized into M1 phenotype which produces nitric oxide synthase, reactive oxygen species, interleukin-1 β (IL-1β), tumor necrosis factor-alpha (TNF-α) to defend infection [6]. Meanwhile, macrophages can also be alternatively polarized into M2 phenotype which produce arginase-1 to control excessive inflammation and promote wound healing [6,7]. But the histopathology showed that the absence of inflammatory infiltrates in the deep stroma of cornea with Acanthamoeba [8]. Even the zone contain amoebic cysts could without noticeable inflammation [9]. Although neutrophils are promptly recruited and visible around Acanthamoeba trophozoites in the early inflammatory response of innate immunity [10,11], the histopathology suggested the disturbed immune response in AK, especially in the late-stage which Acanthamoeba are mainly present in the cornea as cyst. RNA sequencing could allow for the deep and efficient probing of transcriptome, which may provide some clues of host immune reactivity to the Acanthamoeba. The immune status and the roles of macrophages in the late stage of AK could furtherly investigate, based on transcriptome sequencing technologies.
Signaling Lymphocyte Activation Molecule (SLAM) family receptors are expressed on different types of hematopoietic cells and play important role in immune regulation in health and disease. SLAM family-7 (SLAMF7), an immunomodulatory transmembrane receptor that is highly and uniformly expressed on is expressed on macrophages, natural killer cells, and other immune cells.[10] Previously, SLAMF7 was found to have increased expression on M1 macrophages in murine model with Pseudomonas aeruginosa keratitis[11], which in turn promoted polarization of M2 through Signal Transducer and Activators of Transcription 6 (STAT6) activation and alleviated corneal inflammation.[11] The checks and balances between the differentiated states of the macrophages may also play a role in Acanthamoeba infection. But the polarization status of macrophage, the expression level of SLAMF7 and the transcription factor STAT6 remains unclear in AK.
In this study, we used bulk RNA sequencing to illustrate the mRNA expression and enriched signaling pathways of corneas in AK patients, which may contribute to unveil the immune condition between Acanthamoeba and host cornea. At the same time, we investigated the expression level of SLAMF7/STAT6 pathway in the late-stage of AK. The activation of SLAMF7/STAT6 signaling may affect immunological competence and tissue repairing in AK. These findings may provide evidence and novel targets for the immunotherapy of AK.
2. Materials and Methods
2.1. Patients enrolled
This study was conducted at the Beijing Tongren Hospital between September 2021 and May 2022 with the approval of the Medical Ethics Committee of Beijing Tongren Hospital (TRECKY2021-024), Beijing, China. The cornea tissues were from three AK patients and three donors from the local eye bank (Beijing Tongren’s Eye bank, Beijing, China). Patients with AK were enrolled with typical clinical manifestations and at least one of positive laboratory tests (corneal scraping or cultures for Acanthamoeba). NULL of the participants had a history of ocular infection, ocular inflammation, ocular trauma, or eye surgery, mixed ocular infections, cancer and chronic infections such as Hepatitis B, C, and HIV. All participants were informed of the goals of the study, and their written informed consent was obtained in accordance with the declaration of Helsinki. Patient information was recorded using a standard protocol which included demographics, time to diagnosis from symptom onset, risk factors, a history of steroids use, preoperative and postoperative visual acuity of the affected eye, surgical modality. Risk factors for AK including contact lenses wear, ocular trauma or exposure to potentially contaminated water. For all subjects, slit lamp and in vivo confocal microscopy (IVCM) images were obtained. Slit lamp images were taken per eye at 10× times magnification using a calibrated Haag-Streit BX900 slit-lamp bio-microscope (Haag Streit AG, Bern, Switzerland). And the confocal microscope HRT3 (Heidelberg Engineering, Heidelberg, Germany) was used for detecting Acanthamoeba trophozoite and cysts, and inflammatory cells with 800 magnifications. Laboratory examinations for AK included corneal scrapings, optical microscopic observation after Giemsa staining, and cultures on non-nutrient agar plates overlaid with Escherichia coli, performed in the Department of Ocular Microbiology at the Beijing Institute of Ophthalmology.
2.2. mRNA extraction and Sequencing
Half of the corneal button removed from surgery was used for RNA extraction while the other half was used for validation experiments. Total RNA was extracted and purified from cornea tissue using TRIzol reagent (Invitrogen, Carlsbad, CA, USA) following the manufacturer's procedure. The RNA amount and purity of each sample was quantified using NanoDrop ND-1000 (NanoDrop, Wilmington, DE, USA). The RNA integrity was assessed by Bioanalyzer 2100 (Agilent, CA, USA) with RIN number >7.0, and confirmed by electrophoresis with denaturing agarose gel. Poly-A mRNA is purified from 1μg total RNA using Dynabeads Oligo (dT)25-61005 (Thermo Fisher, CA, USA) using two rounds of purification. Then the poly-A mRNA was fragmented into small pieces using Magnesium RNA Fragmentation Module (NEB, cat.e6150, USA) under 94℃ 5 min. Then the cleaved RNA fragments were reverse transcribed to create the cDNA by SuperScript™ II Reverse Transcriptase (Invitrogen, cat. 1896649, USA), which were next used to synthesize U-labeled second-stranded DNAs with Escherichia coli DNA polymerase I (NEB, cat.m0209, USA), RNase H (NEB, cat.m0297, USA) and dUTP Solution (Thermo Fisher, cat.R0133, USA). An A-base is then added to the blunt ends of each strand, preparing them for ligation to the indexed adapters. Each adapter contains a T-base overhang for ligating the adapter to the A-tailed fragmented DNA. Single- or dual-index adapters are ligated to the fragments, and size selection was performed with AMPureXP beads. After the heat-labile UDG enzyme (NEB, cat.m0280, USA) treatment of the U-labeled second-stranded DNAs, the ligated products are amplified with PCR. The average insert size for the final cDNA library was 300±50 bp. At last, we performed the 2×150 bp paired-end sequencing (PE150) on an illumina Novaseq™ 6000.
2.3. Differentially Expressed Gene Analysis
Fastp software (https://github.com/OpenGene/fastp) were used to remove the reads that contained adaptor contamination, low quality bases and undetermined bases with default parameter. Then sequence quality was also verified using fastp. HISAT2 (https://ccb.jhu.edu/software/hisat2) was used to map reads to the reference genome of Homo sapiens GRCh38. The mapped reads of each sample were assembled using StringTie (https://ccb.jhu.edu/software/stringtie) with default parameters. Then, all transcriptomes from all samples were merged to reconstruct a comprehensive transcriptome using gffcompare (https://github.com/gpertea/gffcompare/). After the final transcriptome generating, StringTie was used to perform expression level for mRNAs by calculating FPKM. The differentially expressed mRNAs were selected with fold change > 4 or fold change < -4 and with P value < 0.05 by R package DESeq2 (https://github.com/mikelove/DESeq2).
2.4. Pathway Enrichment Analysis
To better understand the function of differentially expressed genes, Gene Ontology (GO) and the Kyoto Encyclopedia of Genes and Genomes (KEGG) were performed on the obtained differential genes. Since GO term has three independent aspects of biological process (BP), cellular component (CC) and molecular function (MF), clustering results were obtained, based on semantic similarity of GO terms. And then, KEGG and GO term gene set enrichment analysis (GSEA) was done using clusterProfiler. Normalized enrichment score (|NES|>1), nominal P<0.05, and false discovery rate (FDR)<0.25 were considered statistically significant. The raw counts were loaded into R 4.2.1 (R Foundation for Statistical Computing, Vienna, Austria) for statistical analysis and the ridge plot was used for data representation.
2.5. Immune infiltration analysis
Based on Chen et al. method of CIBERSORT, the RNA content of all tissues was analyzed [12]. Under LM22 as the signature gene file and permutation = 1000, the 22 immune cell profiles were reconstructed. The sum of all proportions of immune cell fractions was normalized to 1 in each sample and ggplot2 (version 3.3.6; https://ggplot2.tidyverse.org/) used to generate a stacked bar plot for better visualization. Further the 4 aggregated immune cell types, including total lymphocytes, total dendritic cell, total macrophage, and total mast cell were calculated, following the method of Li et al [13].
2.6. Histopathology Examinations
The corneal button was fixed in 4% paraformaldehyde (PFA) overnight and embedded in paraffin. Then it was sectioned with thickness of 4μm, and slices were dewaxed and hydrated. Hematoxylin and eosin (HE) staining was conducted according to routine protocols. The slices for immunohistochemical staining were repaired with EDTA buffer. Endogenous peroxide activity was blocked by incubation of the slides with 3% H2O2 for 20 minutes. After permeabilized (0.5% Triton X-100 in PBS) and blocked (10% Normal donkey serum and 0.5% Triton in PBS), the rabbit anti-human CD8a (1:800; Cell Signaling Technology, #98941), CD4 (1:1000; Abcam, #ab183685), SLAMF7 (1:2000; Abcam, #ab32520) and STAT6 antibodies (1:200; Abcam, #ab230945) were applied overnight at 4℃. The sections were washed and incubated with HRP conjugated goat anti-rabbit IgG (1: 2000; Abcam, #ab205718) for 1 hour at room temperature. Photographed with a microscope equipped with a digital camera (Olympus BX-51, Olympus, Tokyo, Japan) and the cells with brown-stained cytoplasm were considered positive.
2.7. Western Analysis
Equal amounts of proteins were electrophoresed on 10% PAGE gels and transferred to a polyvinylidene fluoride membrane with a wet transfer system. The membranes were blocked with 5% skim milk for 1 h. After washing with PBS plus 0.05% Tween 20 (PBST), the membrane was incubated with primary antibodies overnight at 4 °C. In addition to the anti-human SLAMF7 and STAT6 antibodies described above, the rabbit anti-human phospho-stat6 antibody (1:1000; Cell Signaling Technology, #9361) and GAPDH antibody (1:2000; Proteintech, #1E6D9) were also used for western analysis. The following day, the same secondary antibody as described in the aforementioned histopathology examinations was performed for 1 h at room temperature. Membranes were visualized by chemiluminescence using an enhanced chemiluminescence substrate.
2.8. Quantitative real-time PCR
Total RNA of the cornea was extracted using Tissue Total RNA Isolation Kit V2 (Vazyme Medical Technology, Nanjing, China). RNA was reverse transcribed into cDNA using the qPCR RT Master Mix Kit (FSQ-301, Toyobo, Japan). Quantitative real-time PCR (qRT-PCR) was performed using the Taq Pro Universal SYBR qPCR Master Mix (Vazyme Medical Technology, Nanjing, China) and conducted on ABI 7500 System. All experiments were repeated at least three times, and P < 0.05 indicated a statistically significant difference. Relative expression levels were calculated using the comparative threshold cycle (Ct) method. Human β-actin expression acted as an endogenous reference to normalize relative gene expression. Primers sets used in qRT-PCR were listed in Table S1.
2.9. Statistical analysis
The data of qRT-PCR are presented as the mean ± standard error of the mean (SEM) according to statistical analysis. Statistical comparisons were analyzed using an unpaired Student’s t-test by graphing software. Correlation between RNA-seq and qRT-PCR was calculated by linear regression and Pearson correlation. P < 0.05 indicated statistical significance.
3. Results
3.1. Clinical Manifestations
Three patients (2 females and 1 male) with AK were recruited. Diagnosis based on the clinical manifestations and laboratory findings. The results of corneal scraping, culture, and IVCM of these patients were all positive of AK. The mean age of patients with AK (44.0±17.0 years) was comparable to that of the control (46.2±13.6 years). Their major risk factors included agricultural injury and orthokeratology lenses wearing. The mean time between the first clinical symptom and the definitive diagnosis was 32.7 ± 4.2 days. Figure S1 provided the preoperative slit-lamp photograph, and the mean ulcer size was 7.2 ± 1.6mm. Two patients had undergone penetrating keratoplasty (PK) and the other get deep anterior lamellar keratoplasty (DALK). Visual improvement was observed in these three cases after surgery (Table S2).
3.2. Assessment of Sequencing Data Quality
The expected number of fragments per kilobase of transcript sequence per million reads mapped (FPKM) density and saturation distribution at the transcriptome level in the two groups of sequencing samples were detected. The statistical results of the expression characteristics of all the genes in each sample were shown in Figure 1A,B. The results of the principal component analysis and sample correlation tests showed that there is clear heterogeneity among the two groups of six sequencing samples, as shown in Figure 1C,D. The above information showed that the high-throughput sequencing data were of high quality and met the standards for further analysis.
3.3. Significant DEGs Associated with Acanthamoeba Keratitis
Based on the alignment with the human reference genome, a total of 18,249 genes transcripts were identified. By comparing the gene expression profiles of the AK cases and normal controls, based on the threshold criterion of log2 fold change > 4 and P < 0.05 significance, 2,668 differentially expressed genes were screened, including 1477 upregulated genes and 1191 downregulated genes (Figure 2A). Excluding the factor of zero value, the SIGLEC1 (Sialic acid-binding immunoglobulin-type lectins-1, CD169) gene, which was linked to type I interferons [14], increased 8-fold in the AK group and was the most significantly upregulated gene. SIGLEC1 was a sialic acid binding cell-surface protein, exclusively expressed on monocytes and macrophages. When the expression of SIGLEC1 was elevated, it was linked to type I interferons and to a lesser degree, other activator stimuli such as LPS [14]. Among the 1191 significantly downregulated genes, expression of the CYTL1 (cytokine-like protein 1) gene in the AK group was the lowest. The expression of this gene was approximately 11 times lower in the AK group than in the control group. Previous literature had reported that CYTL1 was a small widely expressed secreted protein, which closely related to CCL2, and the expression was also downregulated in the squamous cell carcinoma of the lung [15]. Top 20 of significantly altered genes were annotated in volcano plot (Figure 2B).
3.4. Significantly Enriched Pathways Associated with Acanthamoeba Keratitis
Based on the screened DEGs and the method of GO analysis, the significantly enriched signal transduction pathways related to the pathogenesis and immunomodulatory of AK in human were identified. Compared with the control group, the AK group revealed 1,099 significantly different signaling pathways by GO analysis. To further understand the results of signaling pathways enriched by GO analysis, the GO terms were clustered based on semantic similarity. Figure 3A revealed the cluster of pathways annotated by biological process (BP) category of GO terms, contained leukocyte migration, regulation of T cell activation, leukocyte cell-cell adhesion, negative regulation of immune system process, and cell chemotaxis. When the classification was based on cellular component (CC) category, the cluster contained the external side of plasma membrane, collagen-containing extracellular matrix, secretory granule membrane, endocytic vesicle, and endocytic vesicle membrane (Figure 3B). And the classification with molecular function (MF) provided the cluster of pathways including immune receptor activity, cytokine binding, receptor ligand activity, cytokine activity and signaling receptor activator activity (Figure 3C). Each top 10 GO pathways of BP, CC, MF were showed in the Figure 3D. The -log10P-value, the number of up and down regulated genes and the total number of genes in the pathway were also sketched out in Figure 3D. KEGG pathway analysis of DEGs in total, 58 pathways were significantly enriched (p <0.05). KEGG pathway enrichment analysis suggested that the top 30 pathways related with DEGs were cytokine-cytokine receptor interaction (Figure 3E). Similar GO terms and KEGG pathways were observed via GSEA analysis (Figure 3F). Cytokine-cytokine receptor interaction was determined as the most likely difference between AK and control group. In addition, the enriched terms also included viral protein interaction with cytokine and cytokine receptor, IL-17 signaling pathway, Staphylococcus aureus infection and hematopoietic cell lineage. Previous study reported IL-17A production plays an important role in against Acanthamoeba infection. The mice with IL-17A deficiency were significantly increased corneal AK pathology.[16]
3.5. Distribution of the immune cells in Acanthamoeba Keratitis
CIBERSORT algorithm provided the abundance of immune cells in each cornea (Figure 4A). RNA-seq data were pooled and performed group comparisons. Figure 4B showed significantly higher immunocyte infiltration degrees of M0 macrophages and CD8 T cells, and significantly lower immunocyte infiltration degrees of CD4 memory resting T cells in AK group. The immunocyte infiltration degrees of M2 macrophages was also increased but was not statistically significant in the level of P < 0.05. There was no significant intergroup difference in neutrophil, NK cells, B cells, and Dendritic cells. A further aggregated version based on cells type provided the results that the macrophage was significantly increased in AK group (Figure 4C). The dendritic cell was also increased, and lymphocytes and mast cell decreased in patients with AK. However, those differences were not statistically significant. Based on the results above, we revisit the cell marker of M0 (CD33, CD14), M1 (IL-1β, CD86) and M2 (CD163, CD206), associated regulators, and chemokine in the results of DGEs. The outcomes revealed that macrophage-associated markers were significantly higher, especially the marker of M2 (P < 0.001). M2-associated regulators (SLAMF7, STAT6) and the chemokine CCL3 was significantly increased in the AK group (P < 0.01). But the difference of chemokine CCL23 didn’t reach significance (P = 0.08) (Figure 4D).
3.6. Validation of Expression genes in Acanthamoeba Keratitis
Furthermore, to verify the bioinformatics results, seven DEGs were validated for selected genes by immunohistochemistry, quantitative real-time PCR, western blot, and a similar trend of expression was obtained. CD8a staining was weakly positive by immunohistochemistry, and no significant difference was found between groups. Immunohistochemistry also did not reveal clear differences in the expression levels of CD4. Comparing the present immunohistochemical staining, it is evident that the expression of SLAMF7 and STAT6 have significant difference between groups (Figure 5). The bioinformatics results were also validated for selected genes by quantitative real-time PCR (Figure 6A), and a similar trend of expression was obtained. Western blot also showed the level of phosphor-STAT6, which was significantly increased compared with control (Figure 6B). In general, the results also showed good consistency of the qPCR results and RNA sequencing results (Figure. 6C), demonstrating reliability of the RNA-seq data (r = 0.875, P = 0.002).
4. Discussion
AK is a rare disease with unfavorable therapeutic efficacy, and dismal prognosis, which could occur in normal individuals. To date, the process of the immune response in the cornea of AK has been slightly revealed. To our knowledge, this is the first study to make bulk RNA sequencing of corneas in AK patients and analyze the immune state. In the current study, we performed a comprehensive evaluation of the immune landscape of AK and found that only several immune cells (M0 macrophage and CD8 T cells) had a significantly increased infiltration. But most of immune cells lacked significant infiltrate in the cornea of AK patients, compared with completely healthy controls. The findings herein indicate that escape from recognition by immune effector cells may appear in late-stage AK and ultimately lead to an extremely poor prognosis.
Previous studies had suggested this point. The clinicopathologic report found the macrophage and neutrophils presented in regions with cysts, but distribution of CD4 or CD8 T cells didn’t directly associate with Acanthamoeba parasites. NK cells were absent in cornea of AK infected in the report [17]. Another clinicopathologic study also found the acanthamoeba cysts grouped in a zone without noticeable inflammation [18]. Compared with our study, they mentioned the infiltration of neutrophils, which origin probably from the granulomatous retro-corneal membrane in their sample. Typically, the neutrophils are identified as the first responders to acute infections. In the current study, the sample were taken from the late-stage of AK patients and HE staining showed no additional retro-corneal membrane.
The innate immune system is responsible for immediate host defense against pathogens upon infection. Former research in fungal keratitis indicated that inflammatory cytokines, IL-1β, IL-6, TNF- α, as well as Wnt, Hippo, and cGMP-PKG signaling pathways were significantly associated with the disease [19]. Transcriptome analysis showed dominated innate immune response and lower levels of adaptive immune pathways in both late-stage bacterial and late-stage fungal keratitis [20]. While in AK, T cells and B cells were not found around Acanthamoeba-infected cornea regions and serum antibodies are not protective against this infection as recrudescence also occurs [21,22], suggesting that adaptive immune response fails to protect the host and innate immune response is vital for disease resolution. As the depletion of conjunctival macrophages led to exacerbated Acanthamoeba infection and increased number of neutrophils were found to accumulate in acanthamoeba-infected corneas [10,23], macrophages and neutrophils were believed to be two elements in the innate immune system important in Acanthamoeba infection. [24] Both cells were shown to kill Acanthamoeba trophozoites in vitro [25,26]. In vivo, although cysts are not chemotactic towards macrophages and neutrophils, their lysates can be recognized and thus be phagocytosed by macrophages and be killed by neutrophils via myeloperoxidase. [27,28,29] Interestingly, unlike neutrophils, macrophages were shown to maintain at the infection site, demonstrating their role in mounting immune response as well as tissue repair [22,30,31].
We found part of the landscape of immune condition in human late-stage AK where dendritic cells and macrophages increased while lymphocytes decreased. As antigen-presenting cells, dendritic cells are crucial in both innate and acquired immune responses. The increased activated dendritic cells are in line with the concept that microbial molecules could induce the maturation of dendritic cells, while the decreased lymphocytes suggested that signaling pathways between dendritic cells and lymphocytes may be hampered in late-stage AK [32]. M0 macrophages were significantly increased in the AK group compared to the control. Previous studies have found that Acanthamoeba can activate proinflammatory M1 macrophage to produce IL-12 and IL-6 via TLR4-MyD88 pathway [33]. In our study, transcriptome data of late-stage AK showed that the amount of M1 macrophage had no difference between AK and control groups, and M2 macrophages are increased in the AK group. SLAMF7, the regulator associated with M2 macrophages, was significantly increased in the AK group, suggesting its association with M2 polarization. Changes in SLAMF7 and STAT6 in AK patients were also observed by immunohistochemistry. Figure 6A,B show that SLAMF7 and STAT6 were abundant in AK groups mainly expressed in epithelial and anterior stromal cells.
Still, some limitations are present in this study. On the one hand, in that lack of corneas from AK patients resulted in the small number of specimens recruited for analysis. Because bulk RNA sequencing is subject to having less accurate analysis to reveal the immune condition, single-cell sequencing should be carried out in future and the results should be compared to other types of keratitis. On the other hand, although the function of SLAMF7/STAT6 pathway had been validated in P.aeruginosa keratitis, and the expression of pathway had been observed in AK, further experimental validation is required to verify the effect and major target of SLAMF7/STAT6 pathway.
5. Conclusions
To our knowledge, this is the first transcriptome analysis of AK, and we initially shape the immune landscape of AK. M0 macrophage is the principal immune cells, but most of immune cells infiltrated lower in late-stage of AK. We also preliminarily explored the role of SLAMF7/STAT6 pathway play in AK, which was considered that perturb the polarisation direction of macrophage. Taken together, these observations revealed an inhibited immune response in AK and could provide potential directions for further treatment.
Supplementary Materials
The following supporting information can be downloaded at: www.mdpi.com/xxx/s1, Figure S1: the slit-lamp and in vivo confocal microscopy images of three recruited patients with acanthamoeba keratitis; Table S1: Nucleotide sequences of human primers for RT-qPCR; Table S2: Demographics and Clinical Characteristics of patients with acanthamoeba keratitis.
Author Contributions
Conceptualization, Z.W. and X.X.; methodology, Z.W., Q.C. and Z.P.; investigation, Z.W.; writing—original draft preparation, W.Z.; writing—review and editing, Q.L.; Q.L.; project administration, Q.L.; funding acquisition, Q.L. All authors have read and agreed to the published version of the manuscript.
Funding
This research was funded by National Natural Science Foundation of China, grant number 82171017; National Key Research and Development Program, grant number 2021YFC2301000
Institutional Review Board Statement
Not applicable.
Informed Consent Statement
Not applicable.
Data Availability Statement
Not applicable.
Conflicts of Interest
The authors declare no conflict of interest.
References
- A K, H Y, T H, et al. Clinical significance of owl eye morphologic features by in vivo laser confocal microscopy in patients with cytomegalovirus corneal endotheliitis [J]. American journal of ophthalmology, 2012, 153, 445–453.
- NIELSEN S E, IVARSEN A, HJORTDAL J. Increasing incidence of Acanthamoeba keratitis in a large tertiary ophthalmology department from year 1994 to 2018 [J]. Acta Ophthalmol, 2019.
- CARNT N, HOFFMAN J M, VERMA S, et al. Acanthamoeba keratitis: confirmation of the UK outbreak and a prospective case-control study identifying contributing risk factors [J]. Br J Ophthalmol, 2018, 102, 1621–1628.
- WATT K, SWARBRICK H A. Microbial keratitis in overnight orthokeratology: review of the first 50 cases [J]. Eye Contact Lens, 2005, 31, 201–208.
- MAGISTRADO-COXEN P, AQEEL Y, LOPEZ A, et al. The most abundant cyst wall proteins of Acanthamoeba castellanii are lectins that bind cellulose and localize to distinct structures in developing and mature cyst walls [J]. PLoS Negl Trop Dis, 2019, 13, e0007352.
- MURRAY P J, WYNN T A. Protective and pathogenic functions of macrophage subsets [J]. Nature Reviews Immunology, 2011, 11, 723–737.
- HAZLETT L D, MCCLELLAN S A, BARRETT R P, et al. IL-33 shifts macrophage polarization, promoting resistance against Pseudomonas aeruginosa keratitis [J]. Invest Ophthalmol Vis Sci, 2010, 51, 1524–1532.
- VEMUGANTI G K, PASRICHA G, SHARMA S, et al. Granulomatous inflammation in Acanthamoeba keratitis: an immunohistochemical study of five cases and review of literature [J]. Indian J Med Microbiol, 2005, 23, 231–238.
- HANSSENS M, DE JONCKHEERE J F, DE MEUNYNCK C. Acanthamoeba keratitis. A clinicopathological case report [J]. International Ophthalmology 1985, 7, 203–213. [CrossRef] [PubMed]
- HURT M, APTE S, LEHER H, et al. Exacerbation of Acanthamoeba keratitis in animals treated with anti-macrophage inflammatory protein 2 or antineutrophil antibodies [J]. Infect Immun, 2001, 69, 2988–2995.
- FONSECA Z, DÍAZ-GODÍNEZ C, MORA N, et al. Induce Signaling via Raf/MEK/ERK for Neutrophil Extracellular Trap (NET) Formation [J]. Front Cell Infect Microbiol 2018, 8, 226. [CrossRef] [PubMed]
- CHEN B, KHODADOUST M S, LIU C L, et al. Profiling Tumor Infiltrating Immune Cells with CIBERSORT [J]. Methods Mol Biol 2018, 1711, 243–259.
- LI B, CUI Y, NAMBIAR D K, et al. The Immune Subtypes and Landscape of Squamous Cell Carcinoma [J]. Clin Cancer Res, 2019, 25, 3528–37.
- OSTENDORF L, DITTERT P, BIESEN R, et al. SIGLEC1 (CD169): a marker of active neuroinflammation in the brain but not in the blood of multiple sclerosis patients [J]. Scientific Reports, 2021, 11, 10299.
- TOMCZAK A, SINGH K, GITTIS A G, et al. Biochemical and biophysical characterization of cytokine-like protein 1 (CYTL1) [J]. Cytokine 2017, 96, 238–246. [CrossRef] [PubMed]
- SURYAWANSHI A, CAO Z, SAMPSON J F, et al. IL-17A-mediated protection against Acanthamoeba keratitis [J]. 2015, 194, 650–663.
- Knickelbein JE, Kovarik J, Dhaliwal DK, Chu CT. Acanthamoeba keratitis: a clinicopathologic case report and review of the literature. Hum Pathol. 2013, 44, 918–922.
- Hanssens M, de Jonckheere JF, de Meunynck C. Acanthamoeba keratitis. A clinicopathological case report. Int Ophthalmol. 1985, 7, 203–213. [CrossRef] [PubMed]
- ZHANG Q, ZHANG J, GONG M, et al. Transcriptome Analysis of the Gene Expression Profiles Associated with Fungal Keratitis in Mice Based on RNA-Seq [J]. Investigative Ophthalmology & Visual Science, 2020, 61, 32.
- CHIDAMBARAM J D, KANNAMBATH S, SRIKANTHI P, et al. Persistence of Innate Immune Pathways in Late Stage Human Bacterial and Fungal Keratitis: Results from a Comparative Transcriptome Analysis [J]. Front Cell Infect Microbiol 2017, 7, 193. [CrossRef]
- ALIZADEH H, HE Y, MCCULLEY J P, et al. Successful immunization against Acanthamoeba keratitis in a pig model [J]. Cornea, 1995, 14, 180–186.
- KNICKELBEIN J E, KOVARIK J, DHALIWAL D K, et al. Acanthamoeba keratitis: a clinicopathologic case report and review of the literature [J]. Hum Pathol, 2013, 44, 918–922.
- VAN KLINK F, TAYLOR W M, ALIZADEH H, et al. The role of macrophages in Acanthamoeba keratitis [J]. Invest Ophthalmol Vis Sci, 1996, 37, 1271–1281.
- CLARKE D W, NIEDERKORN J Y. The immunobiology of Acanthamoeba keratitis [J]. Microbes Infect, 2006, 8, 1400–1405.
- MARCIANO-CABRAL F, TONEY D M. The interaction of Acanthamoeba spp. with activated macrophages and with macrophage cell lines [J]. J Eukaryot Microbiol, 1998, 45, 452–458.
- STEWART G L, SHUPE K, KIM I, et al. Antibody-dependent neutrophil-mediated killing of Acanthamoeba castellanii [J]. Int J Parasitol, 1994, 24, 739–742.
- HURT M, PROY V, NIEDERKORN J Y, et al. The interaction of Acanthamoeba castellanii cysts with macrophages and neutrophils [J]. J Parasitol, 2003, 89, 565–572.
- LARKIN D F, EASTY D L. Experimental Acanthamoeba keratitis: II. Immunohistochemical evaluation [J]. The British Journal of Ophthalmology, 1991, 75, 421–424.
- MOSSER D M, EDWARDS J P. Exploring the full spectrum of macrophage activation [J]. Nature Reviews Immunology, 2008, 8, 958–969.
- HAZLETT L, D. Role of innate and adaptive immunity in the pathogenesis of keratitis [J]. Ocul Immunol Inflamm, 2005, 13, 133–138. [Google Scholar] [CrossRef] [PubMed]
- CANO A, MATTANA A, WOODS S, et al. Acanthamoeba Activates Macrophages Predominantly through Toll-Like Receptor 4- and MyD88-Dependent Mechanisms To Induce Interleukin-12 (IL-12) and IL-6 [J]. Infect Immun. 2017, 85.
Figure 1.
RNA sequencing data quality control and consistency tests. (A) FPKM density distribution of the sequencing data. The x-axis represents the log10 (FPKM) value of the gene, and the y-axis represents the distribution density of the genes with corresponding expressions. (B) Boxplot of the FPKM density distribution. (C) Principal component analysis of the sequencing samples. (D) Correlation test of the sequencing samples.
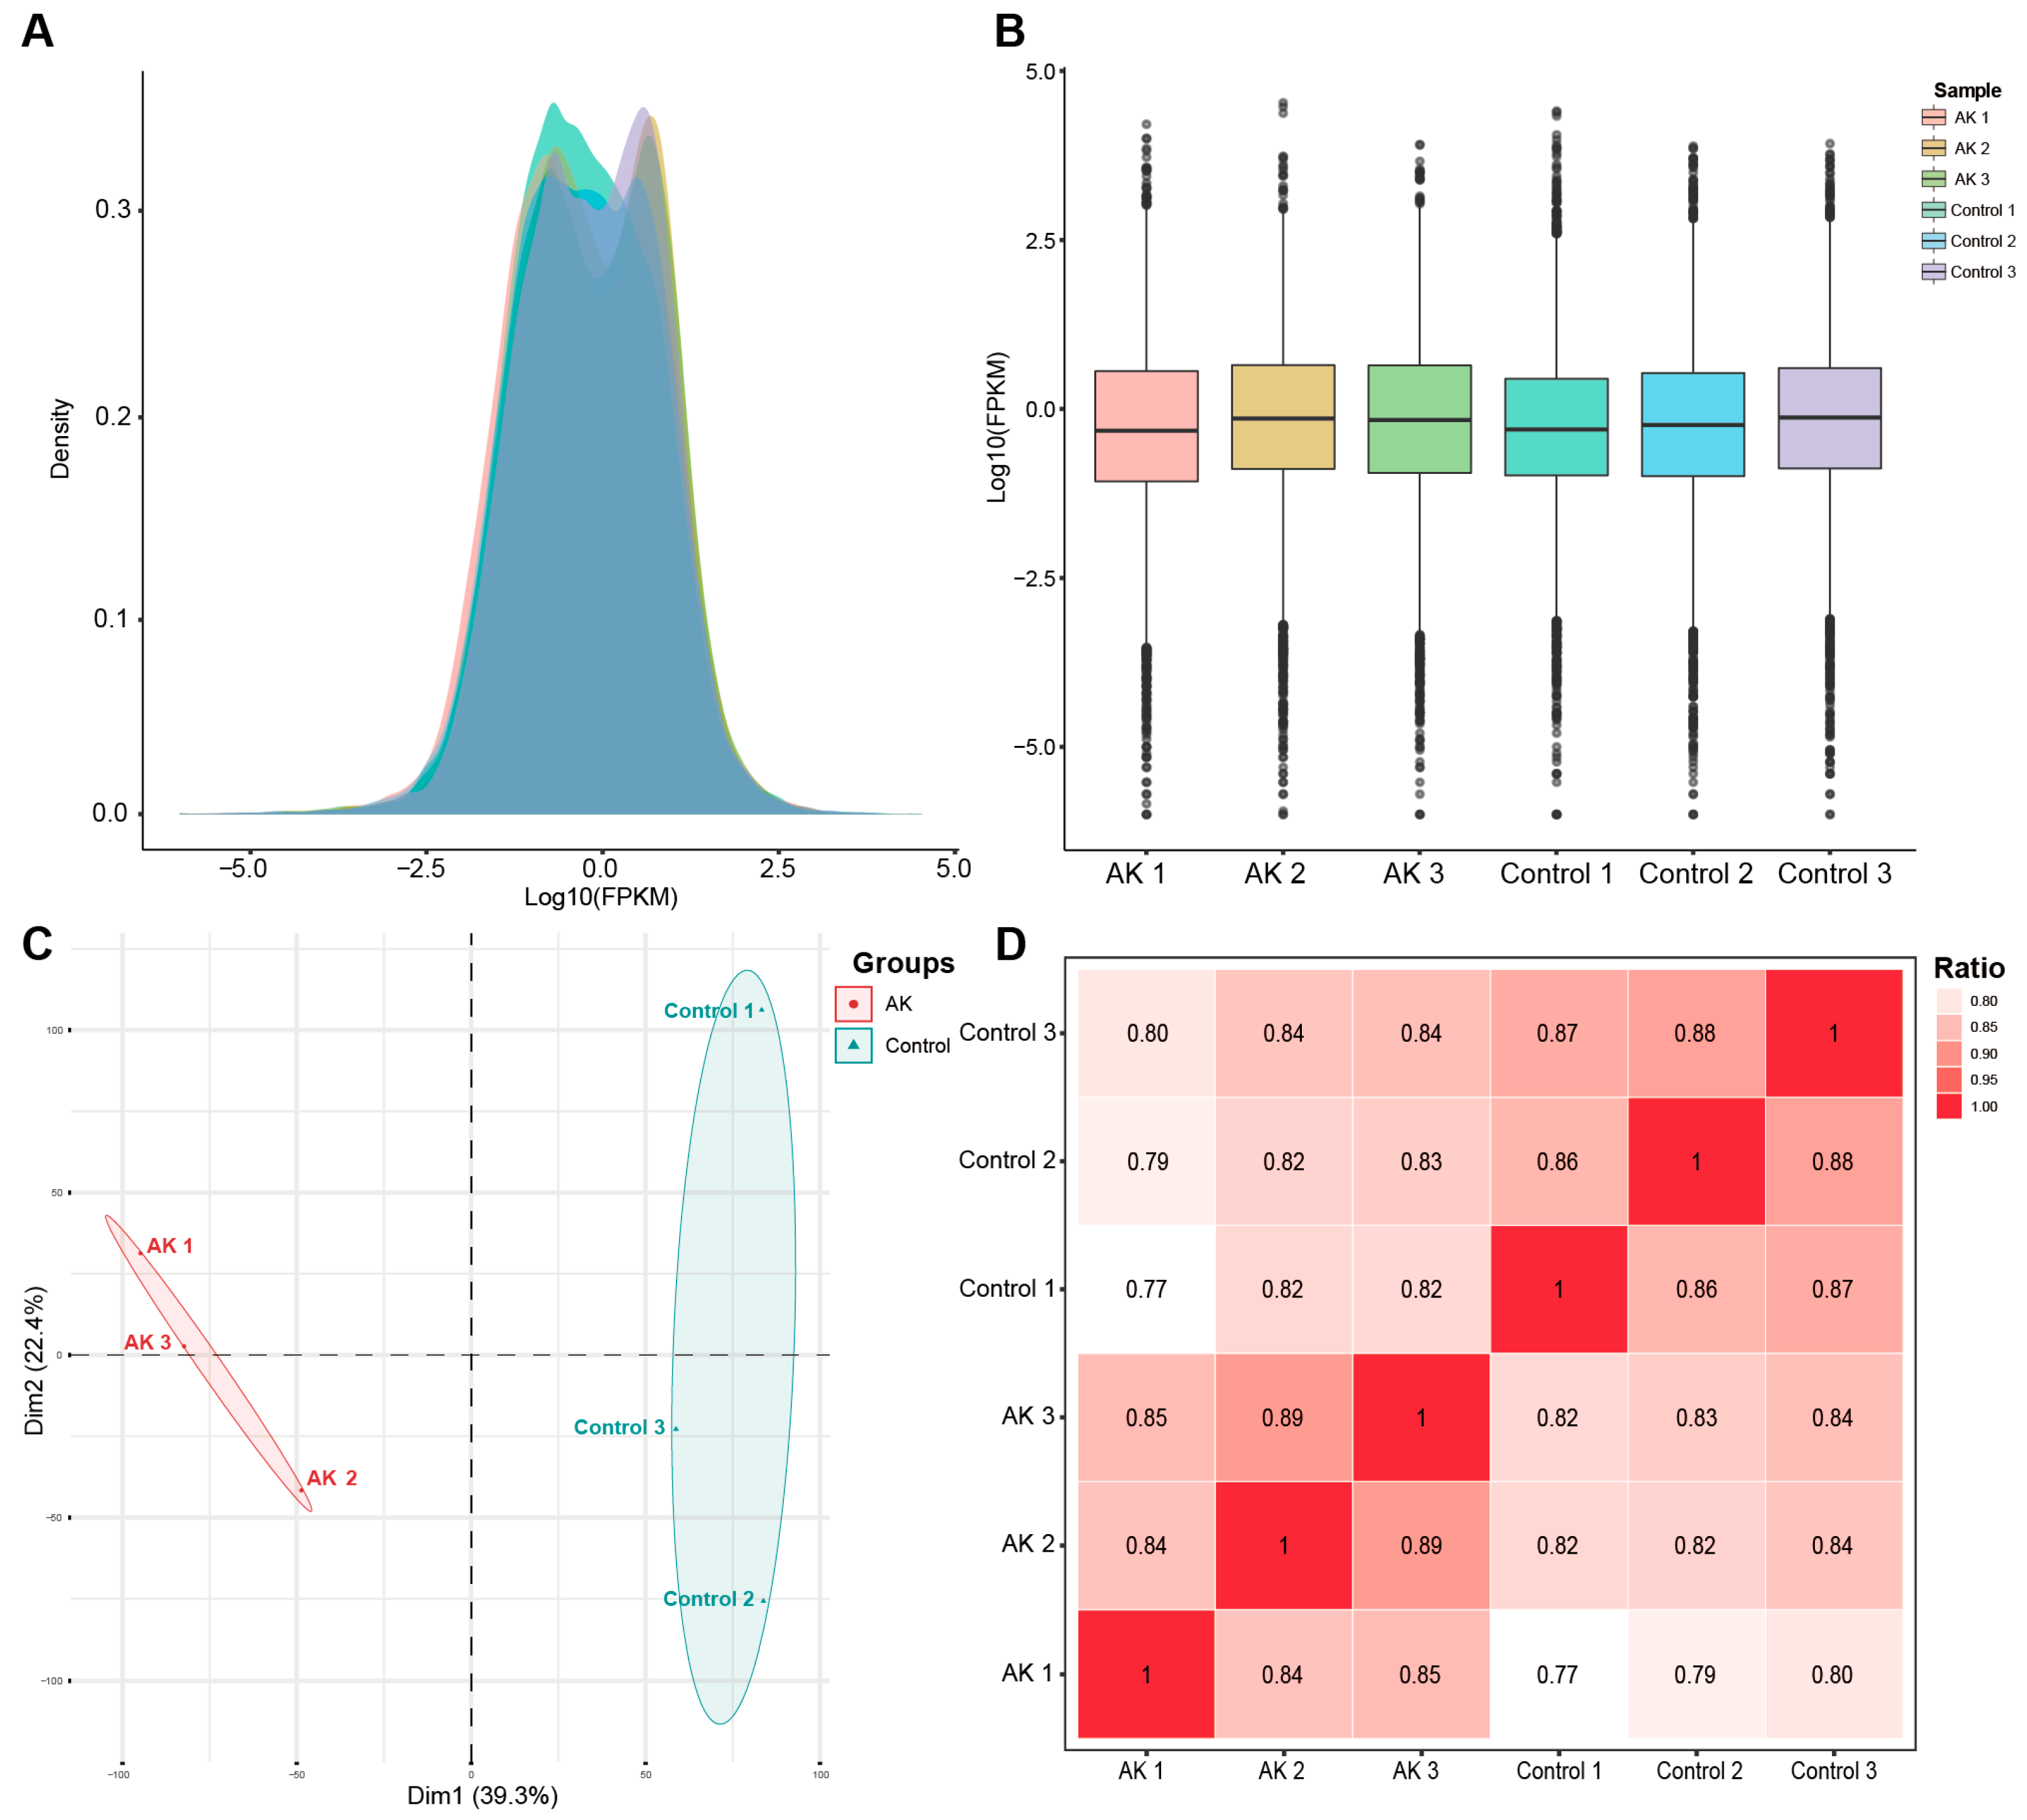
Figure 2.
Results of the DEGs between AK group and control group. (A) A heatmap of each significant DEG in different samples. (B) Volcano plot of the significant DEGs between two groups. The x-axis represents the log2 fold change and the y-axis represents –log10 (P value) of each significant DEG.
Figure 2.
Results of the DEGs between AK group and control group. (A) A heatmap of each significant DEG in different samples. (B) Volcano plot of the significant DEGs between two groups. The x-axis represents the log2 fold change and the y-axis represents –log10 (P value) of each significant DEG.
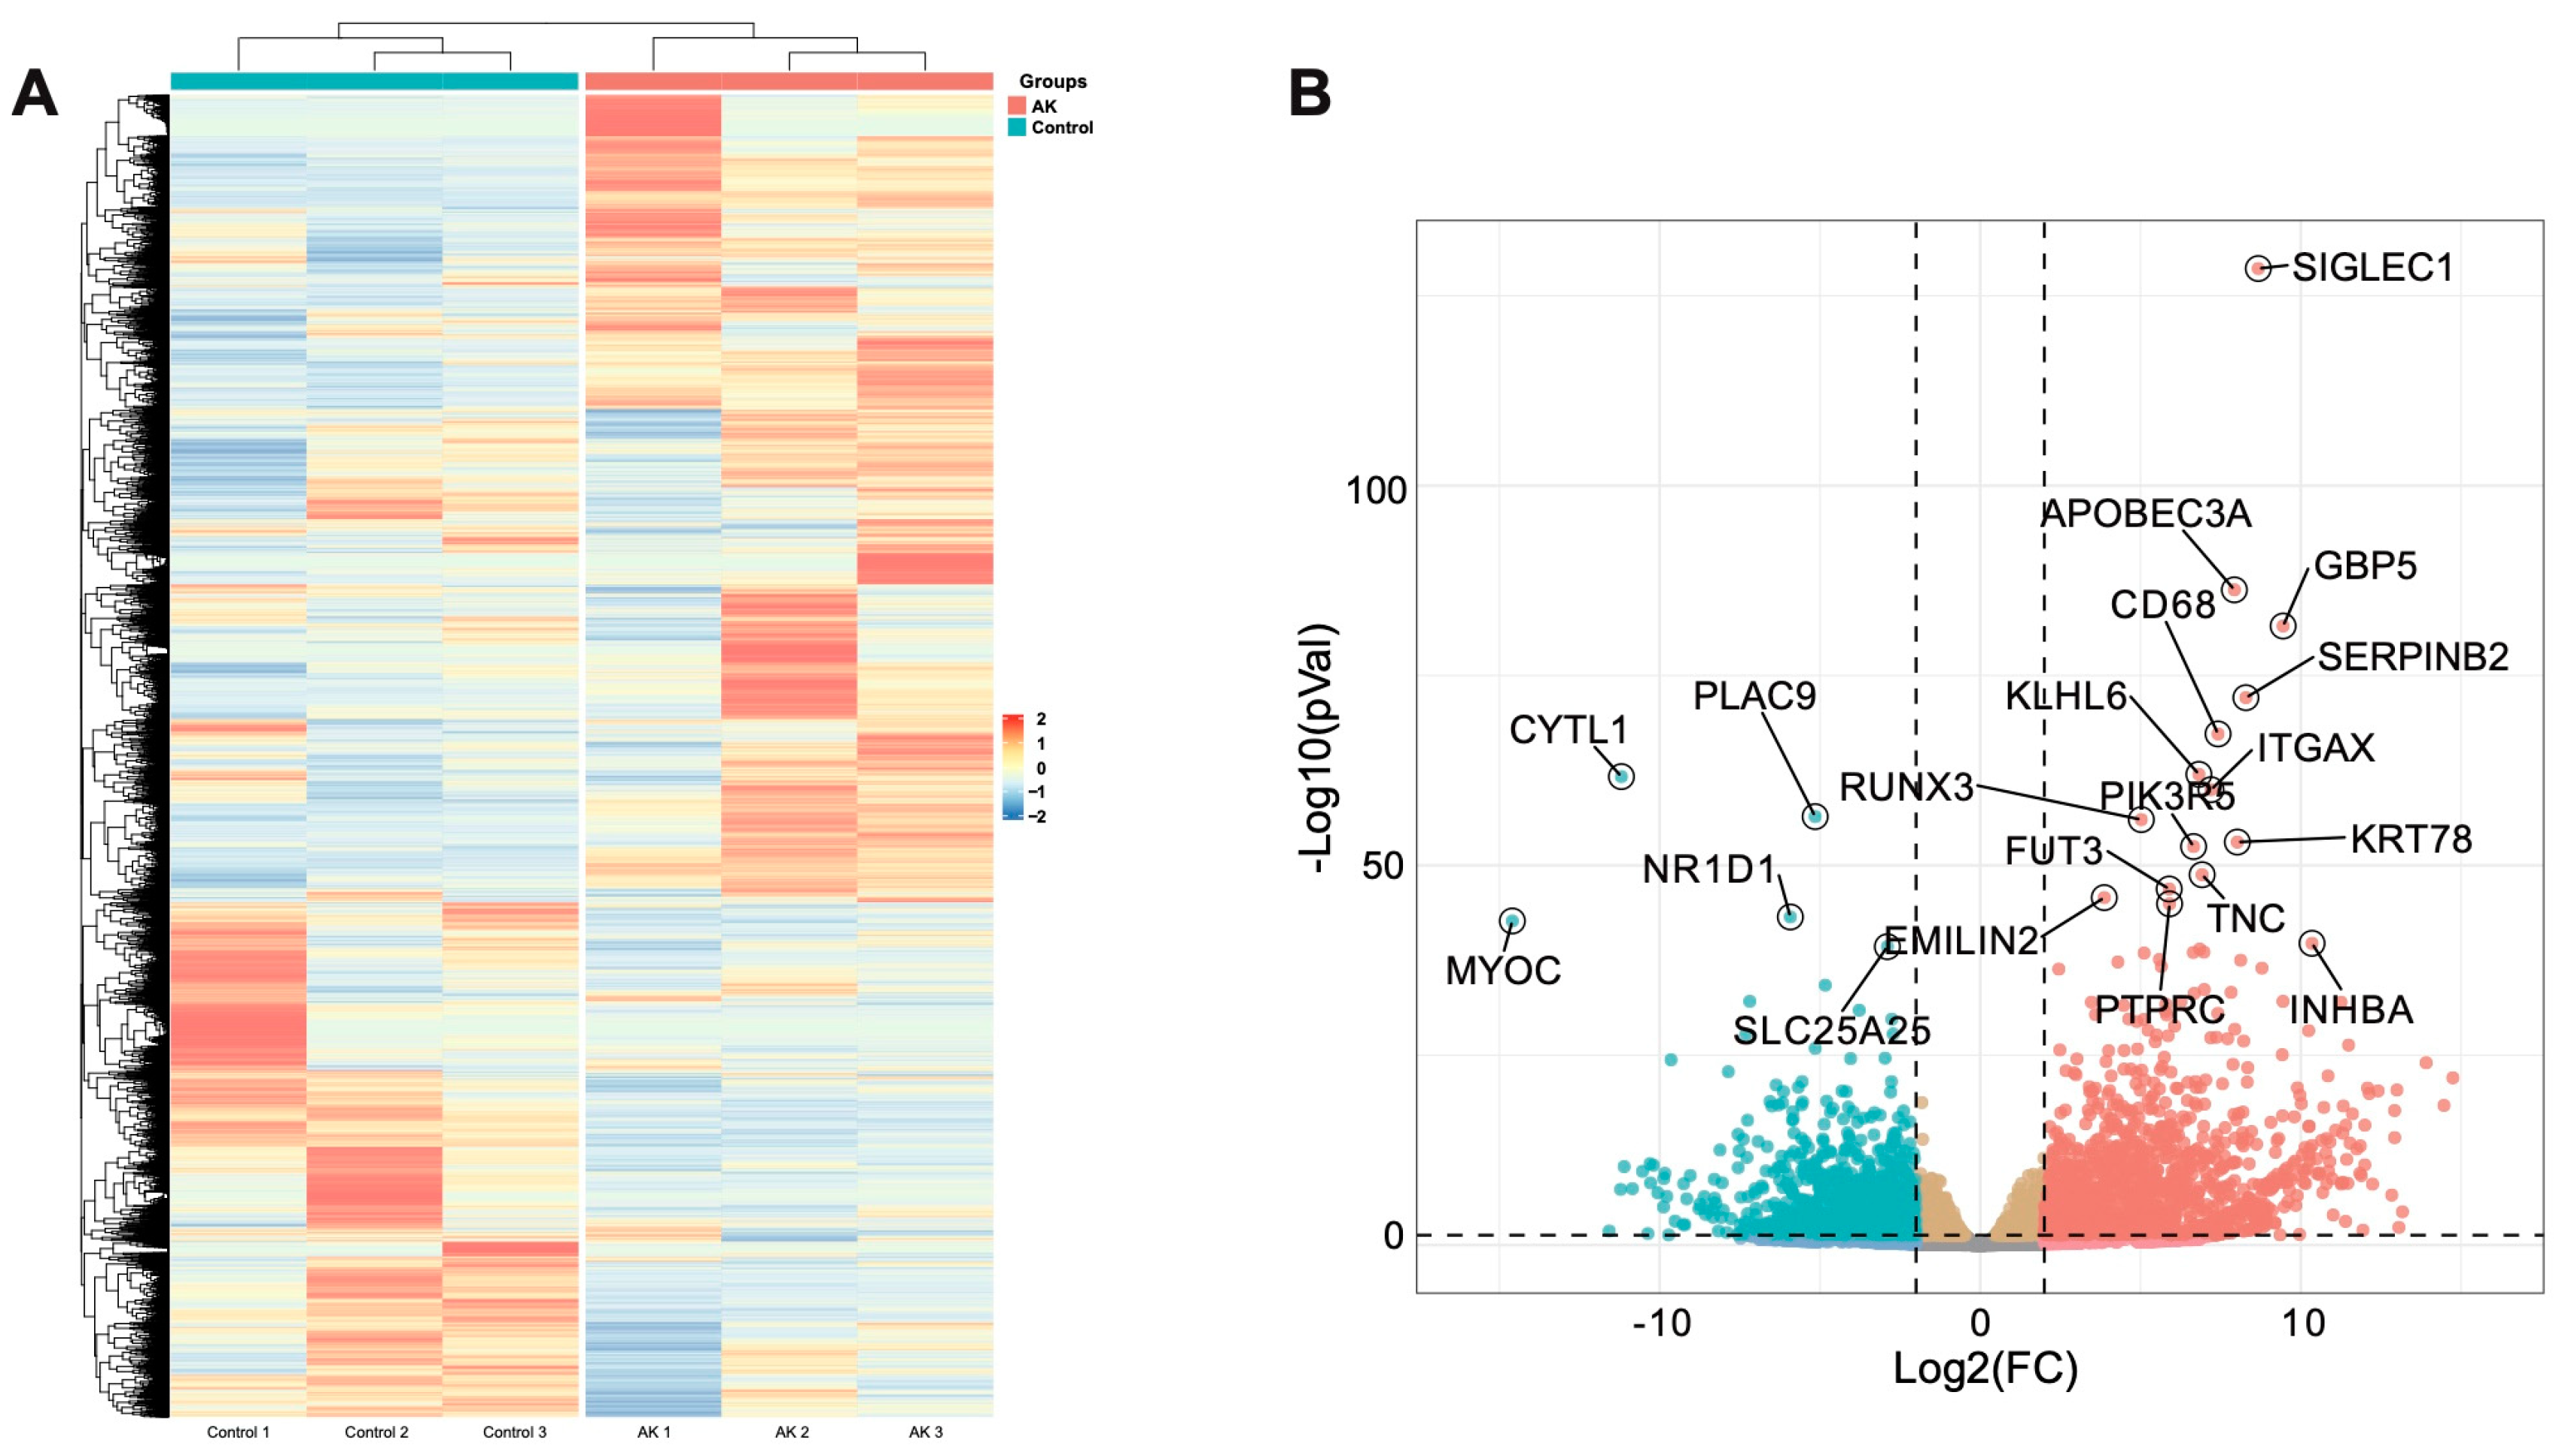
Figure 3.
Signal transduction-related pathways enriched. (A-C) Clustering results based on semantic similarity of GO terms annotated by biological process (BP), cellular component (CC) and molecular function (MF); (D) Significant signal transduction-related pathways were enriched by GO analysis. From the outer circle to the inner circle: the top 10 pathways annotated by BP, CC, and MF; the result of -log10(P value) corresponding to the pathway; the number of genes upregulated or downregulated in this pathway; the total number of genes associated in that pathway; (E) Top 30 significant signal transduction-related pathways were enriched by KEGG analysis. The x-axis represents gene number, and the y-axis represents the name of each pathway. The color scale indicates the significant level of pathway enrichment; (F) The ridge plot depicted top 10 signaling pathways enriched by the gene-set enrichment analysis.
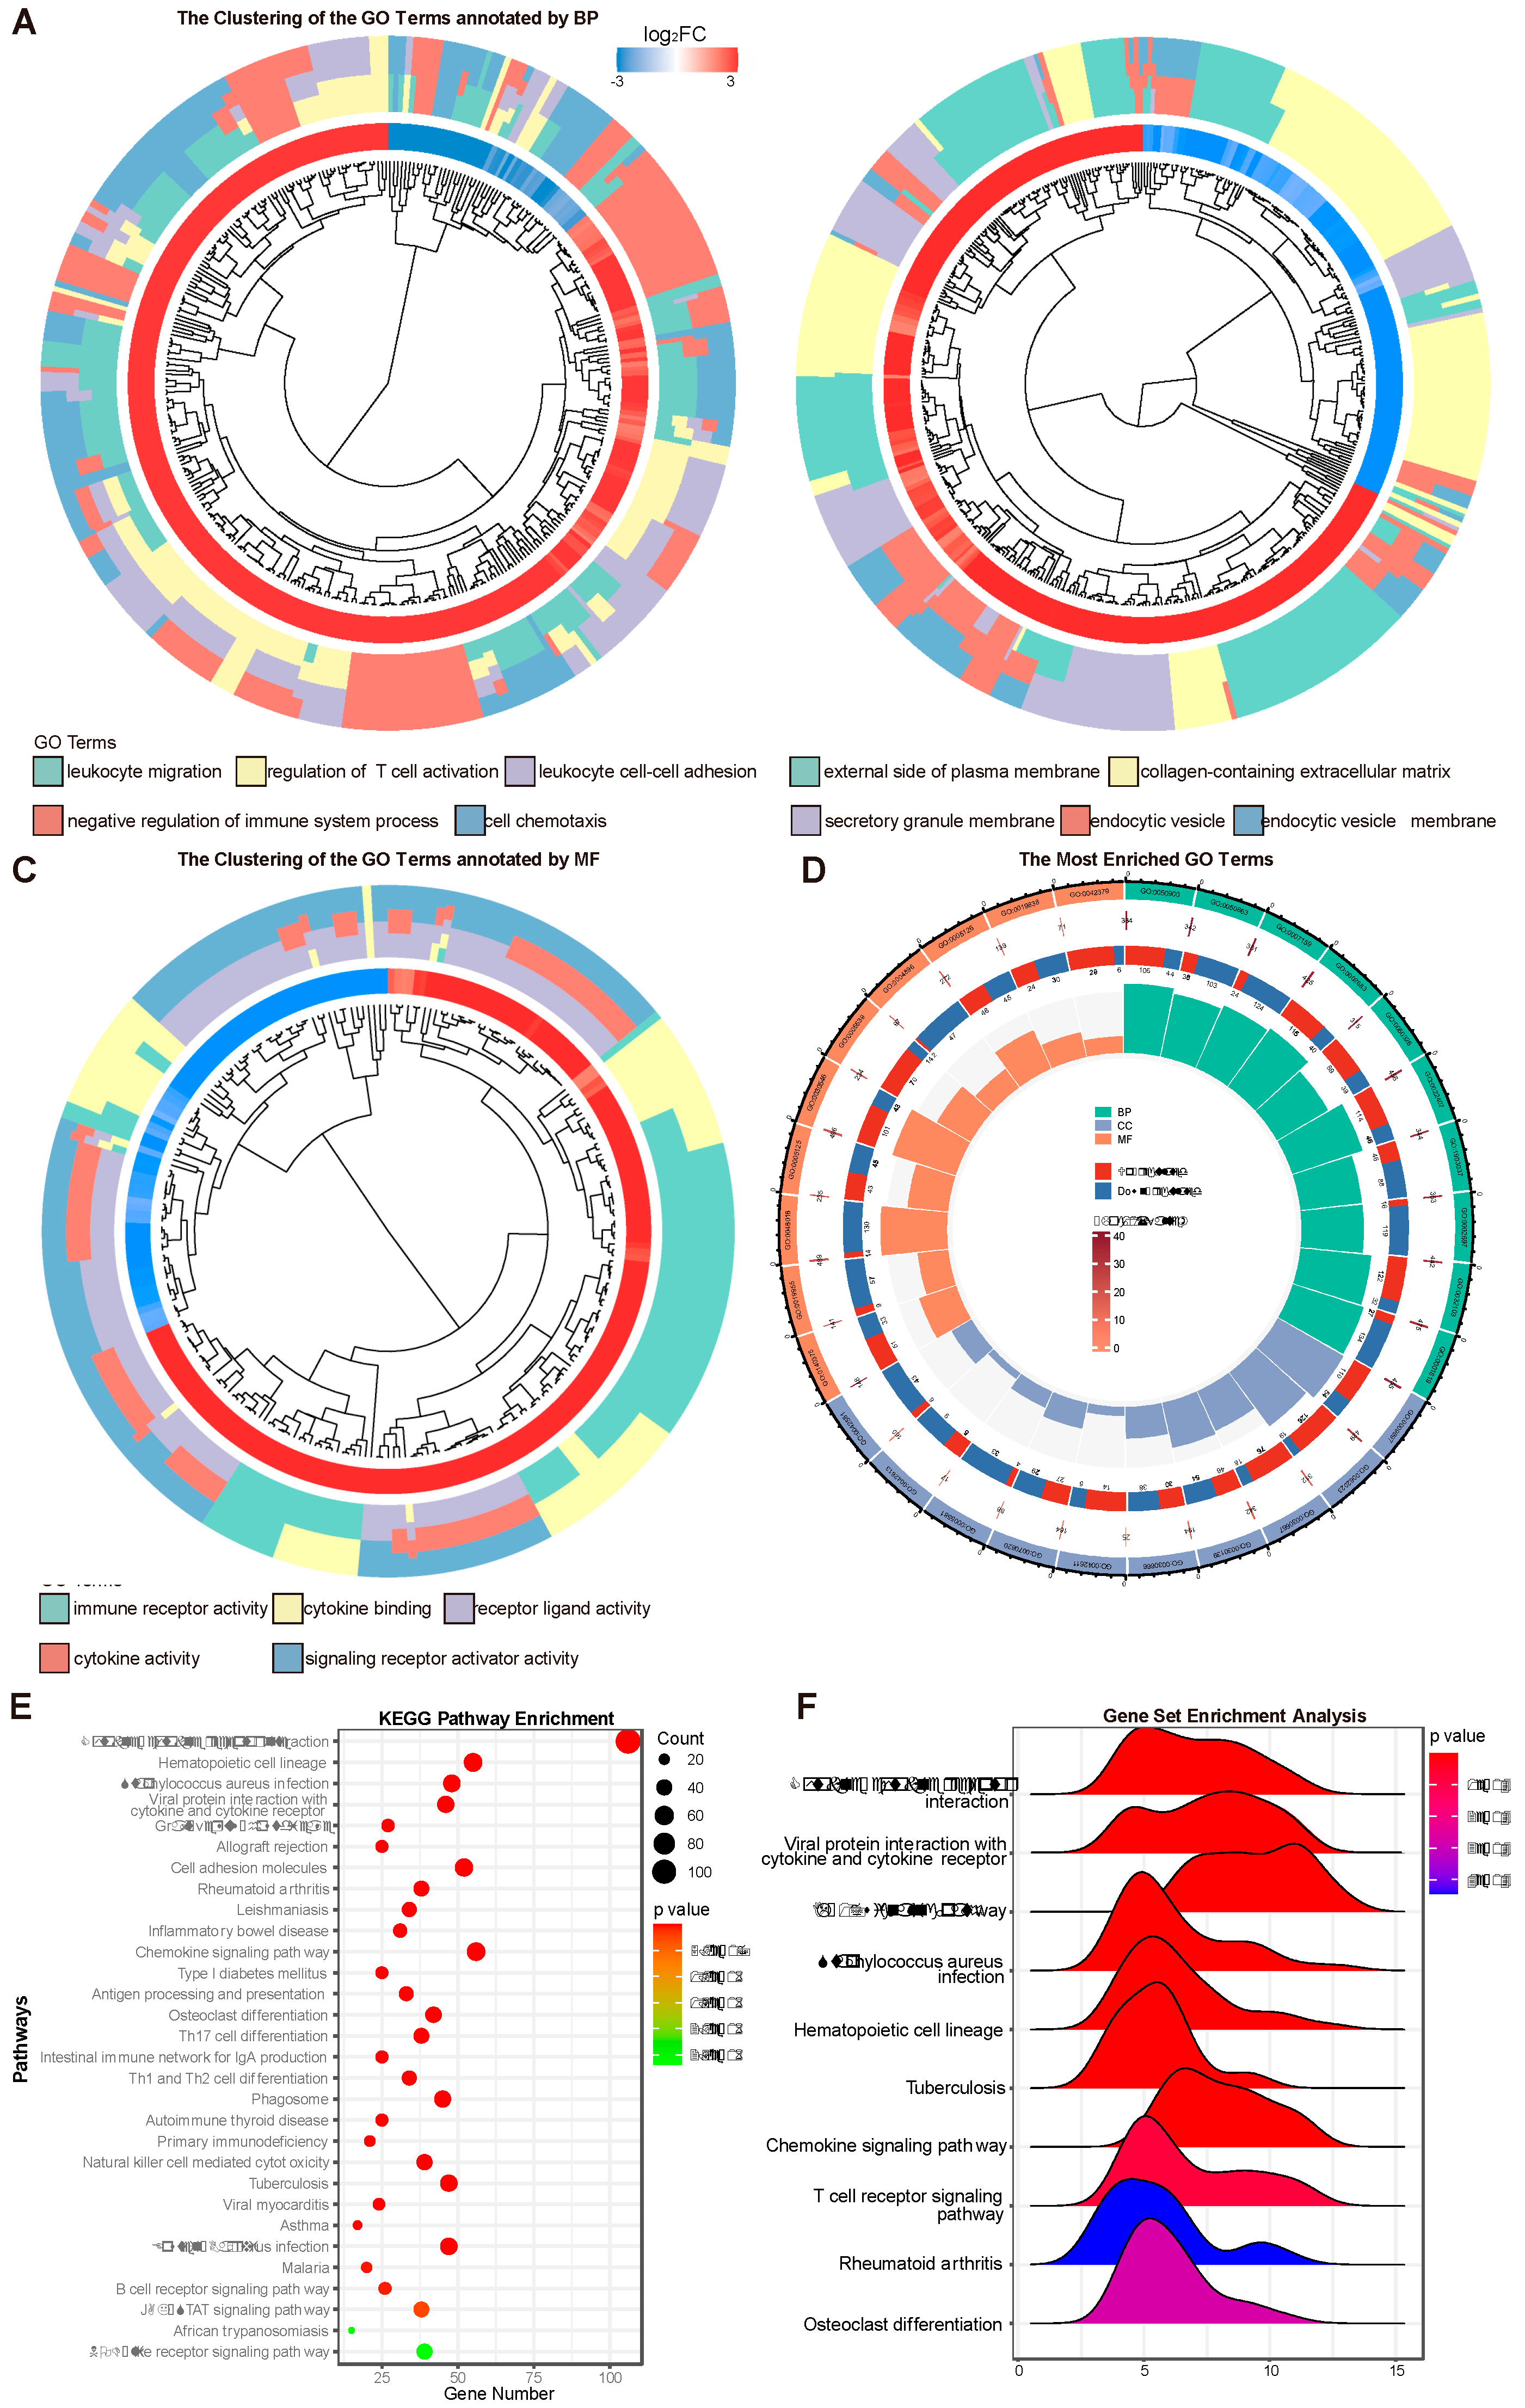
Figure 4.
Distribution of the immune cells (22 types of immune cells) in cornea between AK and control group by CIBERSORT algorithm. (A) the proportions of immune cells in each cornea. (B) comparison of immune cell proportions between AK and control group. (C) comparison of 4 aggregated immune cell types between AK and control group. (D) expression patterns of immune cell related gene module were shown in AK and control group. *P < 0.05, **P < 0.01, ***P < 0.001.
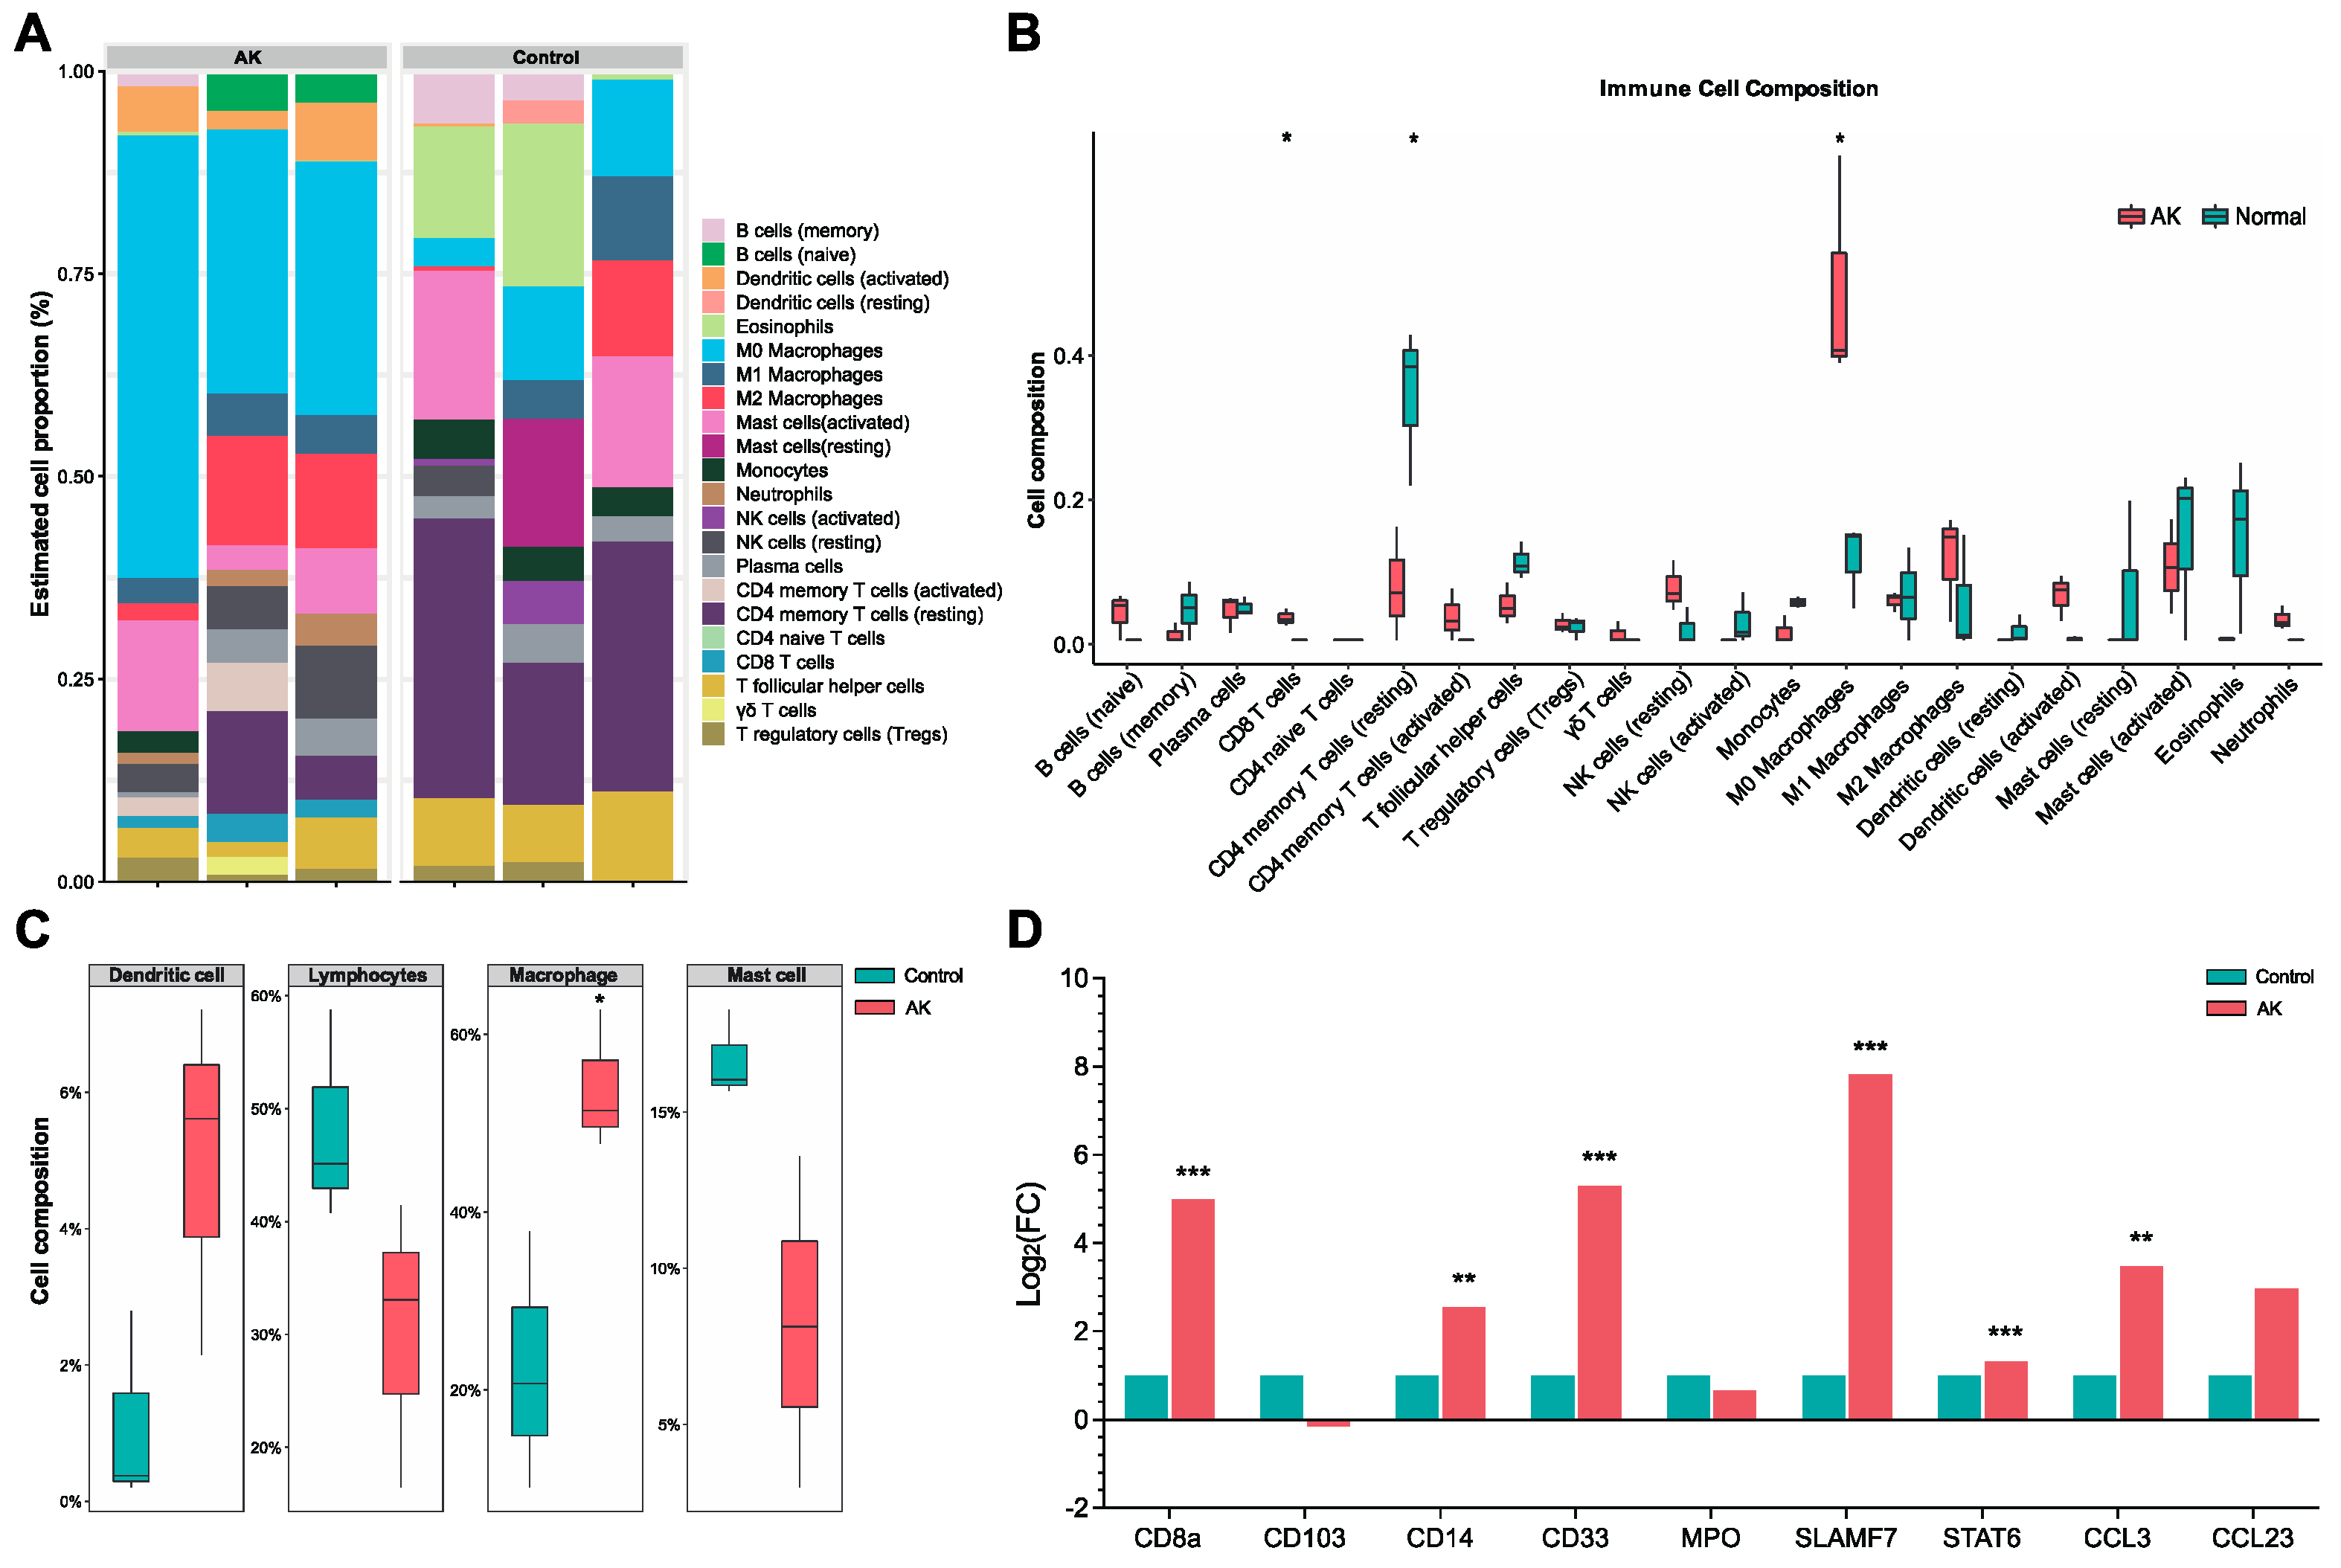
Figure 5.
Representative images of CD8a, CD4, SLAMF7 and STAT6 immunohistochemistry staining in the different groups. Scale bars: 100μm.
Figure 5.
Representative images of CD8a, CD4, SLAMF7 and STAT6 immunohistochemistry staining in the different groups. Scale bars: 100μm.
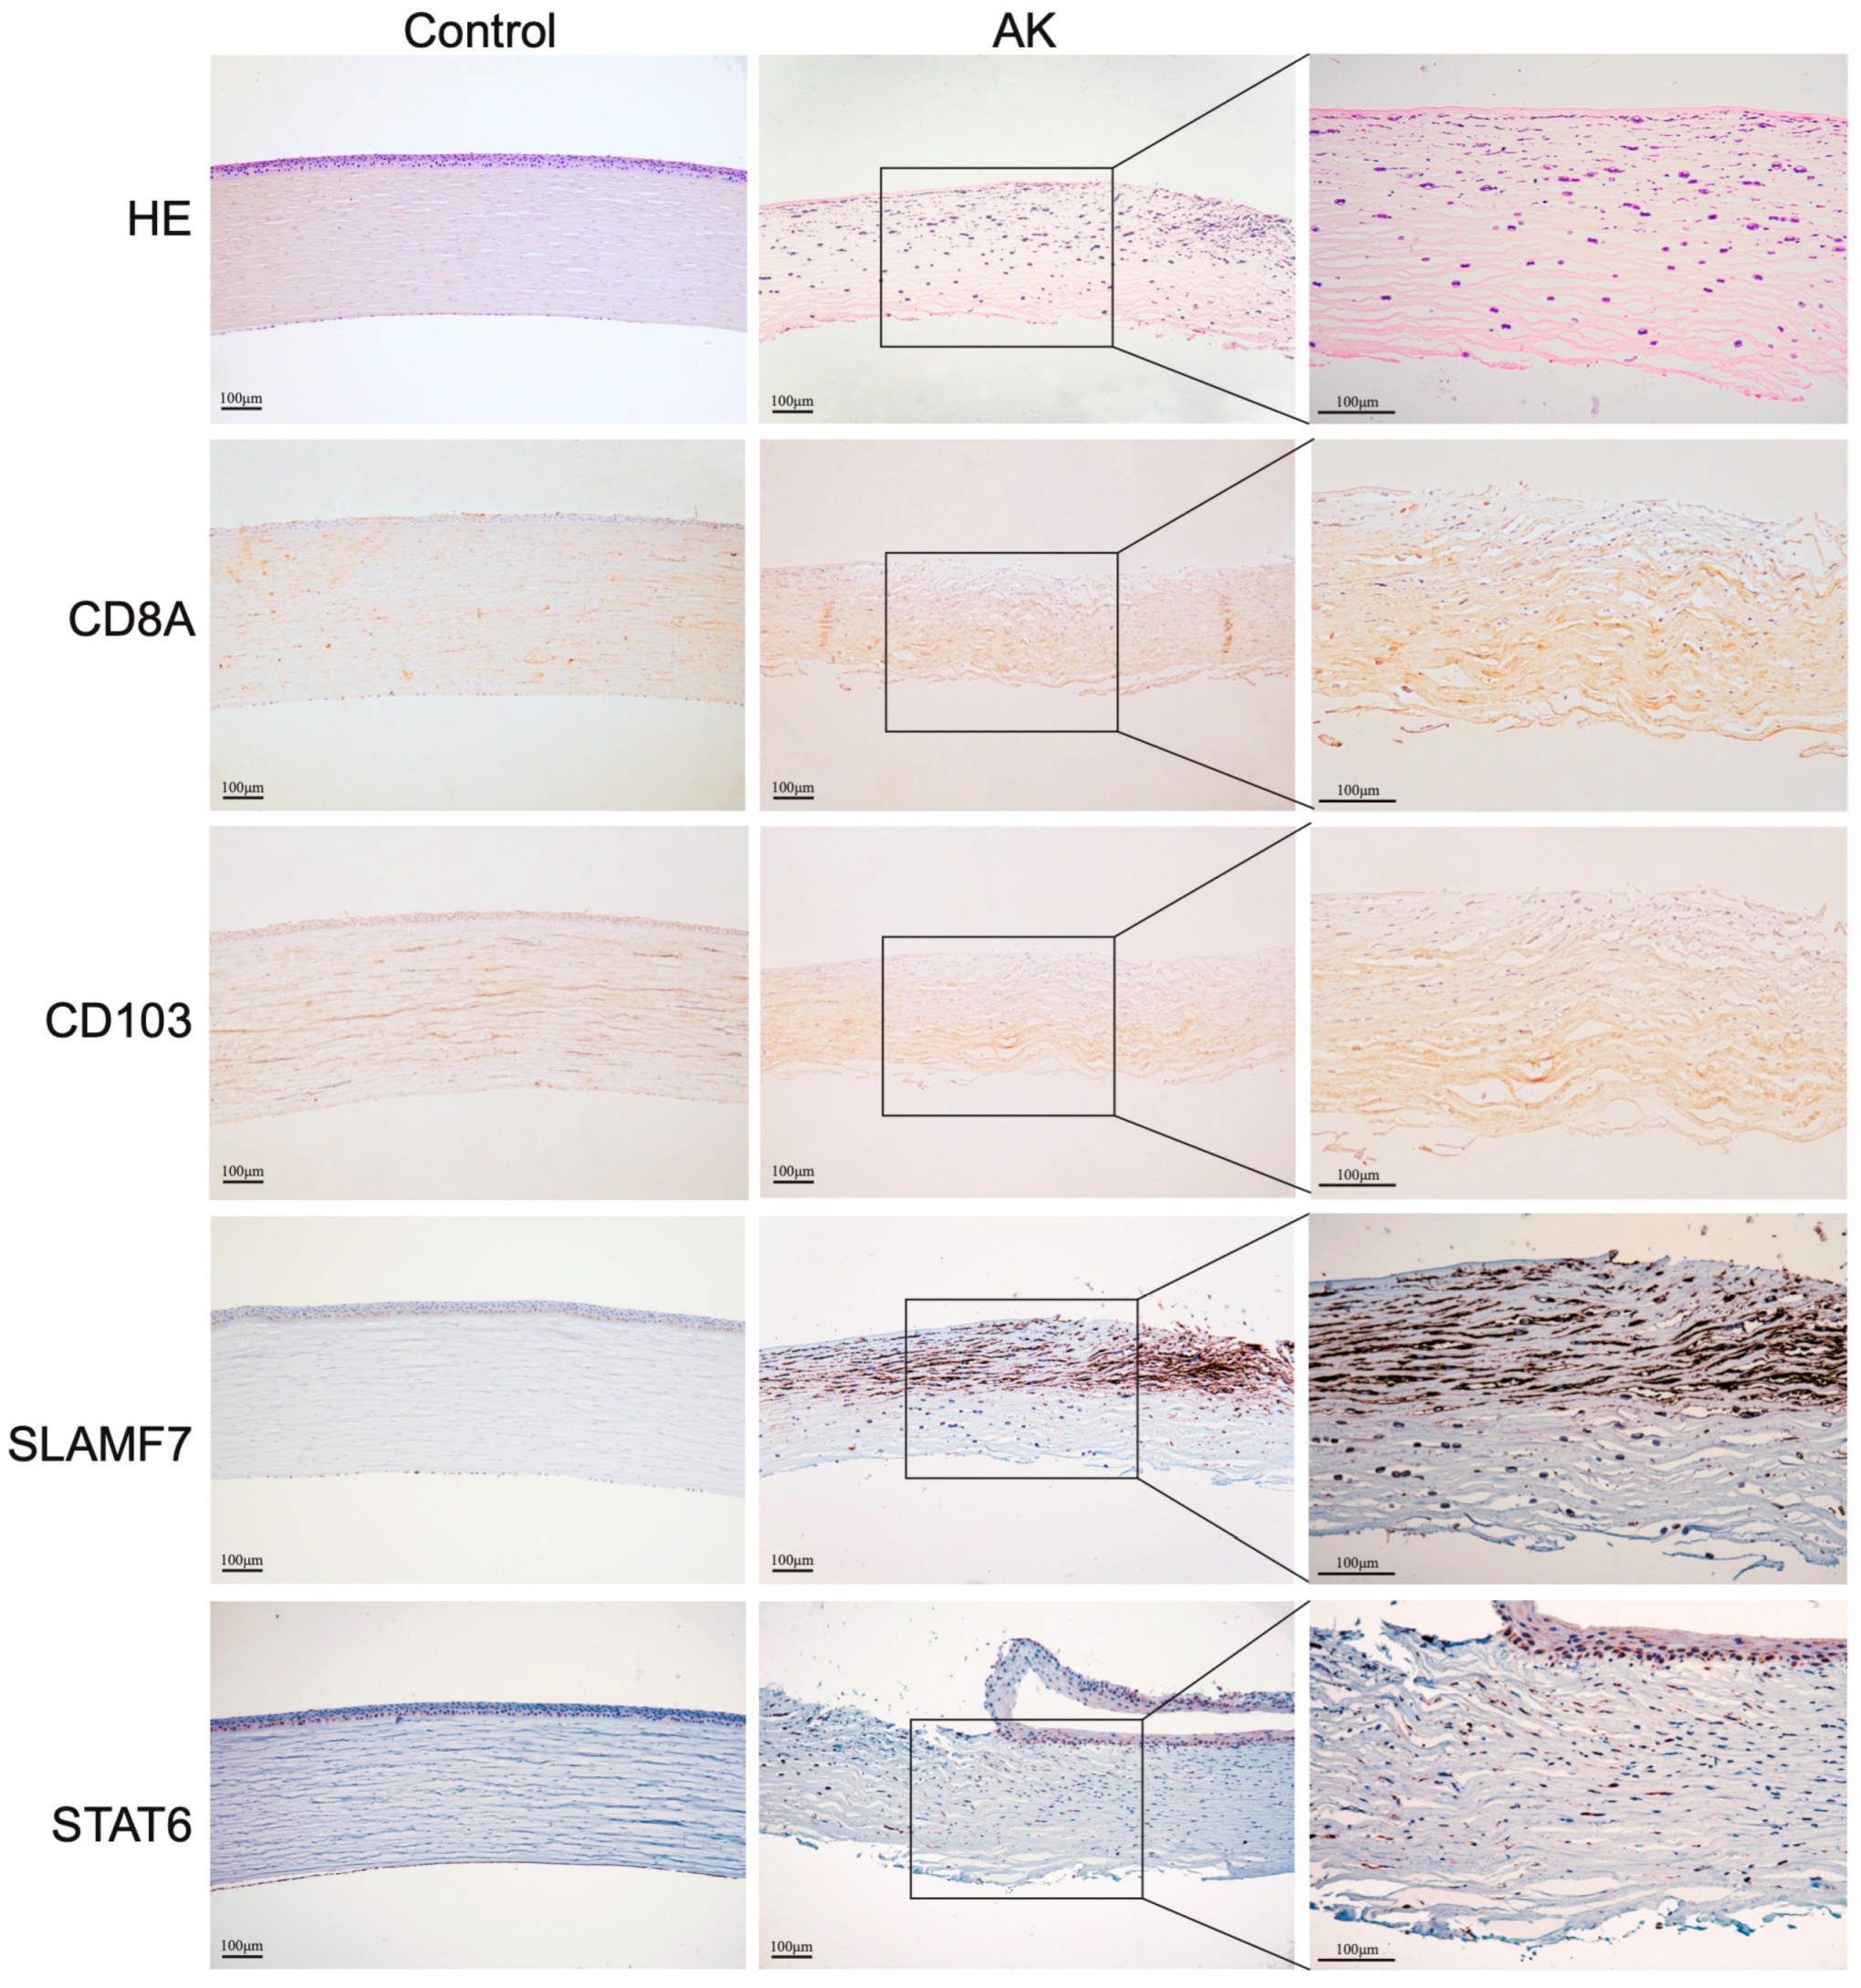
Figure 6.
RT-qPCR and western blot analysis confirming the validity of the RNA-seq results. (A) The relative expression levels of the DEGs between the AK and control groups were analyzed by RT-qPCR. *P < 0.05, **P < 0.01, ***P < 0.001. (B) The protein levels of SLAMF7, pSTAT6 and STAT6 in cornea. (C) Correlation of the gene expression levels between RT-qPCR and bioinformatics data.

Disclaimer/Publisher’s Note: The statements, opinions and data contained in all publications are solely those of the individual author(s) and contributor(s) and not of MDPI and/or the editor(s). MDPI and/or the editor(s) disclaim responsibility for any injury to people or property resulting from any ideas, methods, instructions or products referred to in the content. |
© 2023 by the authors. Licensee MDPI, Basel, Switzerland. This article is an open access article distributed under the terms and conditions of the Creative Commons Attribution (CC BY) license (http://creativecommons.org/licenses/by/4.0/).
Copyright: This open access article is published under a Creative Commons CC BY 4.0 license, which permit the free download, distribution, and reuse, provided that the author and preprint are cited in any reuse.


