Submitted:
17 January 2023
Posted:
17 January 2023
You are already at the latest version
Abstract
Although total nett CO2 atmospheric flow can be estimated with reasonable accuracy, the contributing gross fluxes between the atmosphere and the earth's surface are poorly understood. This paper presents a method, driven by the objective of simplicity, by which the global outflow and inflow of CO2 between atmosphere and a globally equivalent "mixing reservoir" can be estimated, using the isotopes 14C and 13C as tracers. It has been asserted that the isotopic carbon in CO2 cannot be directly used as a tracer in flow studies because it is not subject to the Revelle factor. Evidence is provided showing that this view is mistaken. The model contains 7 key parameters which are used to create synthetic records of Δ14C and d13C spanning 200 years or more, including during the period of atmospheric weapons testing and its decay known as the "bomb pulse". By optimising the fit between these computed values and the historical records of d13C and Δ14C, all seven key parameters are determined. The effective "mixing reservoir" is thereby determined to have a size around six times that of the atmosphere, with global outflux rising from 39.7 GTC yr-1 in 1750 to 58.9 GTC/yr in 2020, this figure probably not including annually cycled carbon.
Keywords:
CO2 turnover time
; anthropogenic emissions
; CO2 flux
; global warming
Environmental Significance
An accurate estimate of the flux between the atmospheric and sequestered CO2 is important as it is key to our understanding of the carbon-cycle. However, estimates of these fluxes have large uncertainties. This paper describes a method of calculating the atmospheric CO2 flux by using the historical variations of 14CO2 and 13CO2 for calibration, challenging the view that such studies cannot be carried out because of a supposed anomalous isotopic effect. It also provides a new estimate of the fossil fuel airborne fraction and the accumulation of carbon inventory.
Introduction
The components of global CO2 flux between the atmosphere and the earth's surface are imprecisely known, with considerable uncertainties in their estimation. According to the Global Carbon Budget (GCB), CO2 atmospheric growth is known to within 0.4%, the uncertainty in fossil fuel emissions are an order of magnitude greater at 5% while uncertainty in sink rates range from 14% to 20% for ocean and 21% for land, with the figure for equivalent emissions from land-use change being higher still at 29% to 50% (Friedlingstein et al. 2021). Yet this uncertainty is dwarfed by the uncertainty in gross flows, reported by IPCC as being more than 50% for both ocean and land (Ciais 2013). Although this level of uncertainty is surprising, it should be remembered that many useful experimental techniques are not available to climate scientists, including the use of a control experiment, or the ability to apply external stimuli in the form of periodic functions, step functions or spikes (the Heavyside and Dirac functions) to examine the system response. Therefore a reliance on models has evolved with over 35 recently being listed by IPCC, being categorised as Earth System Models (ESM) and coupled General Circulation Models (GCMs). Canadell reports that there is a "wide range of model responses", and "disagreement between models....in the relative contribution of land and ocean fluxes", with significant variation between model predictions being reported (Canadell et al. 2021). Furthermore, with many models there is a need for tuning (Flato et al 2013), there is the possibility of overfitting (Bindoff et al. 2013) and the fundamental question has also been raised of whether complexity rather than simplicity can ever contribute to our understanding (Paola et al. 2011). This paper bucks the trend towards micro-modelling and complexity. Its fundamental guiding principle is to find the simplest solution which best fits historical measurements. We describe, after consideration of a number of different models, a model which combines simplicity with an excellent quality of fit; a 7 parameter model of global CO2 outflow and inflow using Dalton's mixing laws (i.e. paint) to calculate values of 14CO2 and 13CO2. The model indicates a rising influx of CO2 from an internal reservoir. Such variations are known to have occurred during the deglaciation between 16ka and 12ka, when changes in global temperature accompanied century-scale variations in CO2 and δ13C (Bauska et al. 2014, Bengtson et al 2020, Marcott et al. 2014). Therefore changes in nett CO2 flux should not be disregarded, especially when accompanied by a significant global temperature change, such as is recently becoming apparent. Throughout this document the phrases "atmospheric mixing ratio" and "atmospheric CO2 level" are used interchangeably, while the term CO2ff refers to the anthropogenic fossil fuel CO2 emissions. The calculations are provided in the form of a working Excel Spreadsheet. Our analysis critically relies upon the variation of atmospheric 14CO2 and 13CO2 over the past 200 years, hence a brief historical perspective of atmospheric radiocarbon is now provided.
Radiocarbon Summary
The most abundant isotope of atmospheric carbon is the stable form 12C, while around 1 percent is the non-radioactive isotope 13C and around 1 part in 1012 is the radioactive isotope 14C. Samples of wood, charcoal etc, provide an historical record of the atmospheric concentration of 14C and 13C, as carbon becomes embedded in the sample (Stenström 2011). However 14C and 13C exhibit very different properties; 14C undergoes radioactive decay with a half-life of 5700 ± 30 years (Kutschera 2013), while 13C is radioactively stable. Fossil fuels, being hundreds of millions of years old, contain virtually no 14C as it has already radioactively decayed. The combustion of fossil fuels therefore releases virtually no 14CO2 into the atmosphere, thus diluting the 14C atmospheric concentration; a process known as the "Suess Effect" (Suess 1955). Stuiver & Quay (1981) confirmed the "Suess Effect", using 14C in archived tree-ring samples, but found it was only 32% of the expected value, a margin they called the "14CO2/CO2 attenuation factor" because "part of the radiocarbon deficit is stored in the oceans and biosphere". By contrast with 14C, the content of 13C in fossil fuels is just a few percent below background levels of 13C. This reduction is not due to radioactive decay but is caused by fractionation, arising because 13C atoms are slightly larger and heavier than 12C, and their corresponding reaction rates are slightly slower. During the conversion of atmospheric CO2 to carbon within the sample, fractionation reduces the relative presence of 14C and 13C. Therefore, when fossil-fuel combustion adds CO2 to the atmosphere, the 13C concentration falls because fossil fuels contain a lower concentration of 13C, in a similar but much less pronounced way than that for 14C. The 13C/C ratio is written as δ13C which incorporates an offset scale so that zero corresponds approximately the background level. Before 1900 δ13C remained remarkably constant over the previous 10,000 years, maintaining its value to within ± 0.1‰ (Bengston 2020). However, since 1900 δ13C has fallen sharply; by approximately 2‰. Similarly the 14C/C ratio is written as Δ14C which in addition to using an offset scale also incorporates the corrections for decay and fractionation so that comparison can be made across different ages. Δ14C has been less stable, falling on average by around 2‰ per century over the past 10,000 years, occasionally falling by 8‰ in one century (IntCal20). However, its fall between 1900 and 1950 is much steeper, being 25‰ in only 50 years. Thus δ13C and Δ14C both show exceptional falls since 1900. For 14CO2 since 1950 the picture is even more complex, because of the creation of 14CO2 in atomic weapons atmospheric tests. The decay of this "bomb pulse" (Figure 3) was initially exponential. By 2020, although the atmospheric 14C level was dipping below its pre-bomb value approximating zero, it continued to fall rather than levelling off. However calculation of Suess dilution suggested its rate of fall should be even quicker, with a theoretical reduction rate due to CO2ff dilution alone as 12-14‰ per year this being "partially compensated by 14CO2 release from the biosphere, industrial 14CO2 emissions and natural 14C production." (Levin 2009). Similarly, calculations of the Suess dilution for 13CO2 show that it too should be falling more steeply than its measured value (see Appendix D). Thus both the fall of Δ14C and δ13C exhibit a dilution discrepancy, which this paper explains is due to the inflow of heavier isotopic gas back from the reservoir (ocean and land) mixing with the lighter isotopic gas inflow from fossil fuels CO2ff. The reader may be interested to note that while Δ14C continues to fall, the absolute atmospheric content of 14C has recently begun to increase (Svetlik 2010), reflecting the general atmospheric increase in CO2.
Revelle Isotopic Anomaly
When atmospheric CO2 dissolves in sea-water, the relative increase in dissolved inorganic carbon (DIC) is approximately only one tenth of the relative increase in dissolved CO2, this factor being known as the Revelle factor, and being due to buffering by CO32- ions. (Zeeb and Wolf 2001) When the CO2 is partially isotopic carbon, an equilibrium is reached where the ratio of the two isotopic partial pressures match the inverse ratio of the fractionation factors (Appendix Equation (A7)). Although the fractionation factor for photosynthesis is approximately 0.98, the seawater fractionation factors are even closer to unity, so close as to be irrelevant (Bolin and Eriksson 1959). Irrespective of this, it has been asserted that analysis of the decay of the "14C bomb pulse" cannot be used to calculate atmospheric CO2 flux because "bomb radiocarbon and anthropogenic CO2 do not behave identically.....the equilibration time is about ten times longer for 14C than it is for anthropogenic CO2" (Joos 1994) and more recently "The Revelle factor does not apply to isotopic equilibration because a 12CO2 molecule is replaced by a 13CO2 or vice versa. As a result, an isotopic anomaly disappears from the atmosphere more quickly than a total CO2 anomaly." Tans 2022. The assertion of the existence of such a large difference in the behaviour of an isotope compared to its non-radioactive form is unusual, apparently originating from a mathematical derivation published by Tans (Tans 1993 Equation (16)). The assertion has been widely repeated (Ciais et al 1995, Harvey 2000, Tans 2022). The author contends that the notion arose because of an approximation in Tans’ calculation which in some cases is unjustified, and which gave rise to a misinterpretation (Appendix A). In 1959 Bolin and Eriksson published CO2 flux calculations where both the Revelle factor and Suess effect were derived by consideration of isotopic flow at the seawater-atmosphere boundary. They did not make the same claim regarding unfettered anomalous isotopic diffusion. Furthermore, regarding fractionation they stated "The deviation of μ from unity will be completely irrelevant in the following discussion. We shall ... thus neglect fractionation." This approach was adopted in the model described here. Fractionation rates have been set to unity, and the mistaken Isotopic Revelle Anomaly is not included.
CO2 Finite Reserve Model
The CO2 Finite Reserve Model (CFR) is a two box model describing CO2 fluxes between the atmosphere and a finite mixing reservoir, based upon 7 solution parameters, these being determined by curve fit to measured δ13C and Δ14C values, with the following assumptions.
- There is a continuous CO2 outflow AOUT, from the atmosphere to a global carbon mixing reservoir, the flow being proportional to the CO2 atmospheric level, ACO2, as listed (Data Ref 1,2). The constant of proportionality is the inverse turnover time, T (IPCC 2013 Glossary); it determines the initial rate of fall of the 14C bomb pulse, (Figures 2 and 3), and is a solution parameter.
- Carbon is returned to the atmosphere from the reservoir via an inflow of CO2. The amount returned, AIN, is calculated by "balancing the budget" of outflow with the known atmospheric growth of CO2, Δ(ACO2) and fossil fuel emissions input AFF, as shown in Figure 1. CO2 inflow from a reservoir in which atmospheric CO2 has previously accumulated hinders the fall in value of 14C. Hence it predominantly determines the shape of the tail of the 14C bomb pulse, the rate of fall of δ13C, and recent δ13C levels, see Figure 3, Figure 4 and Figure 5. Note that some inflows are roughly independent of atmospheric CO2 level (e.g., fire / respiration) while others may be dependant upon pressure difference (e.g., oceanic flux). Both types of inflow are computed within this balanced budget method. The relative reservoir size, RCO2, is a solution parameter.
- Total fossil fuel emissions inflows (CO2FF) are derived from known listings (Data Ref 3). A portion of the inflow, as described by an Airborne Factor, AF, is directly mixed into the atmosphere, while the remaining portion (1-AF) is absorbed directly by the reservoir. This does not imply the absorption is instantaneous, because each cycle is annual. AF is a solution parameter. It predominantly determines the shape of the tail of the 14C bomb pulse, the rate of fall of δ13C, and recent δ13C levels Figure 3, Figure 4 and Figure 5.
- Inflow of 14CO2 from known listed atmospheric atomic weapon detonations B14, (Data Ref 5) are assumed to be linearly related to the bomb yield. The conversion factor Yb (14C [in 1820 background units] per megaton) is a solution parameter. It has the main effect of scaling the bomb pulse portion of the graph after 1960, Figure 3.
- Isotopic 13C and 14C concentrations are calculated using Dalton’s mixing laws, see Appendix B. Fractionation is considered negligible at the reservoir-atmosphere boundary so fractionation factors are implicitly unity. The isotopic equilibrium is identical for 13C ,14C and 12C hence there is no Revelle exception. In accounting for isotopic concentration, it is not necessary to explicitly embed Stuiver's attenuation factor, Suess dilution or a general Revelle factor (see Radiocarbon above), because they are implicitly represented. The initial values i.e. δ13Cinit, Δ14Cinit , determine the initial level of the curves in Figure 3 and Figure 4 and for δ13CFF determine the curve slopes in Figure 4 and Figure 5. δ13Cinit, Δ14Cinit and fossil fuel δ13Cff content are solution parameters.
Figure 1.
CO2 Finite Reservoir Two Box Model.
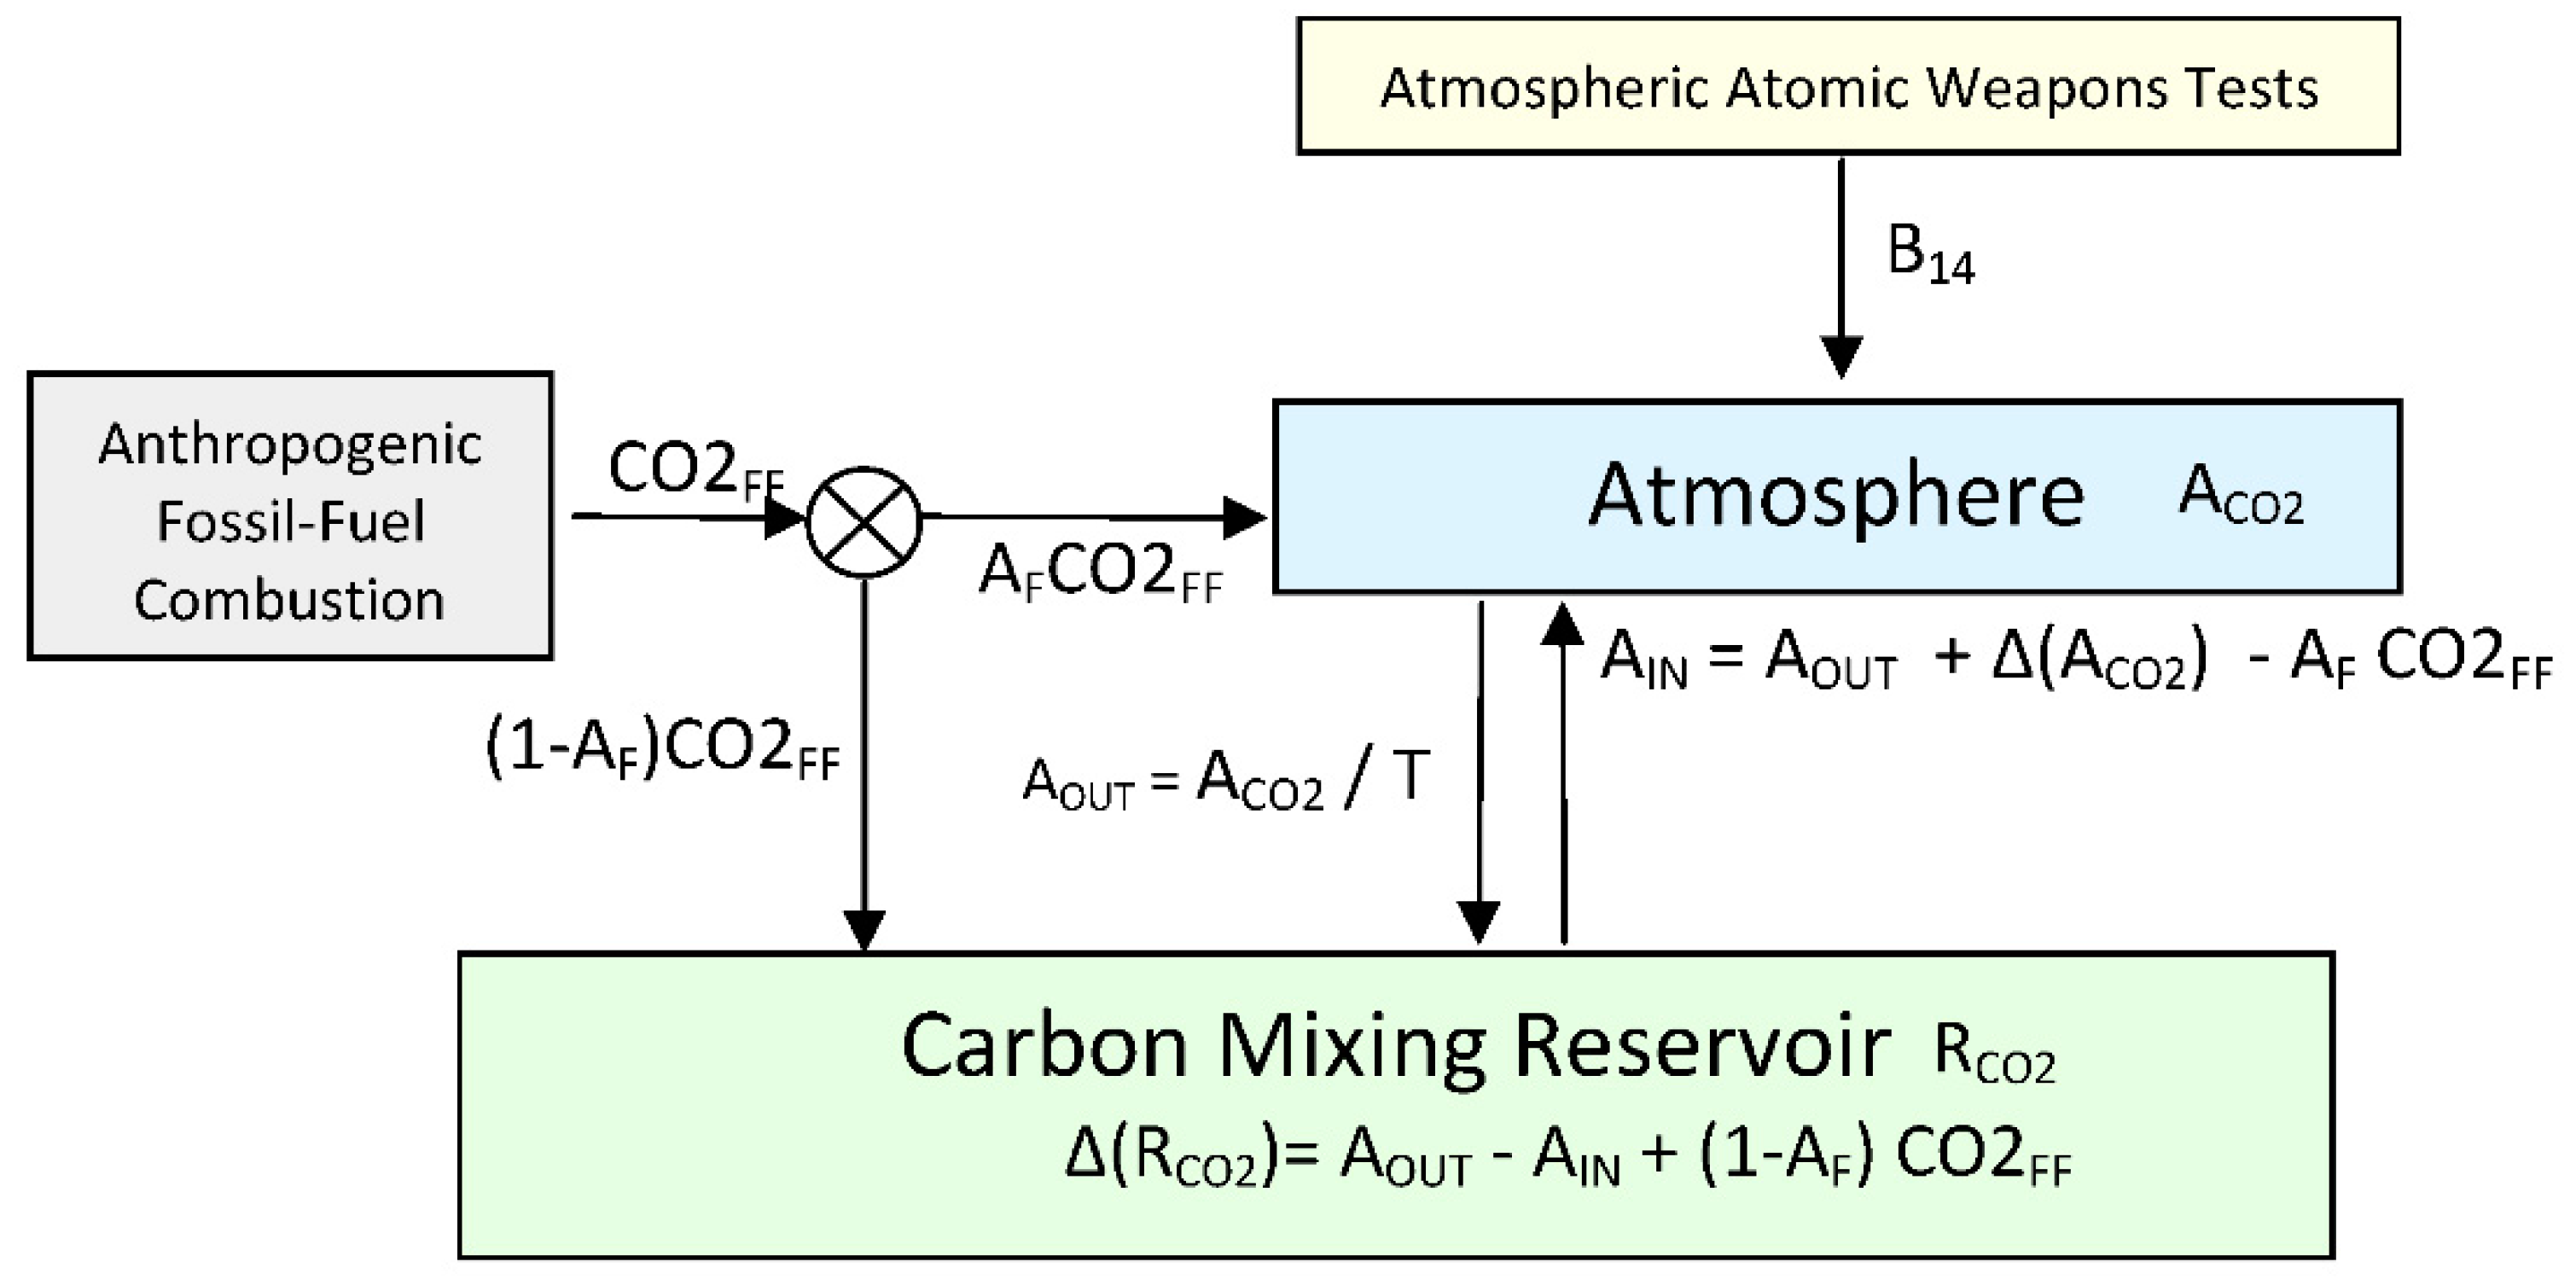
Figure 2.
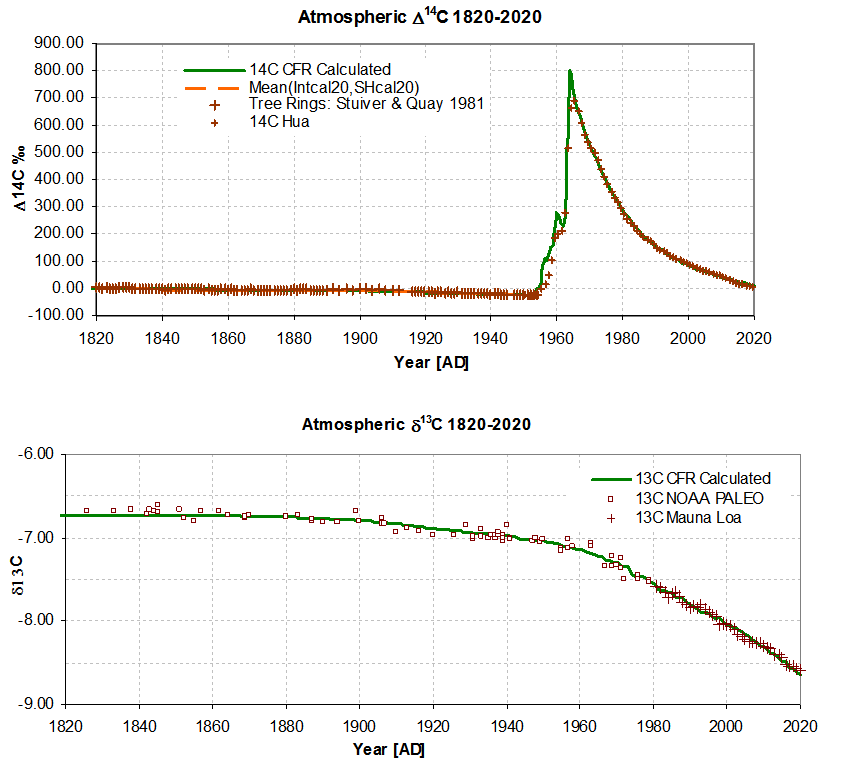
Atmospheric Δ14C 1820-2020. CFR calculated: (solid line). Mean (Intcal20,SHCal20) (dashed line). σ = 3.0‰, excl. values during the rising pulse from 1950 to 1968.
Figure 2.
Atmospheric Δ14C 1820-2020. CFR calculated: (solid line). Mean (Intcal20,SHCal20) (dashed line). σ = 3.0‰, excl. values during the rising pulse from 1950 to 1968.
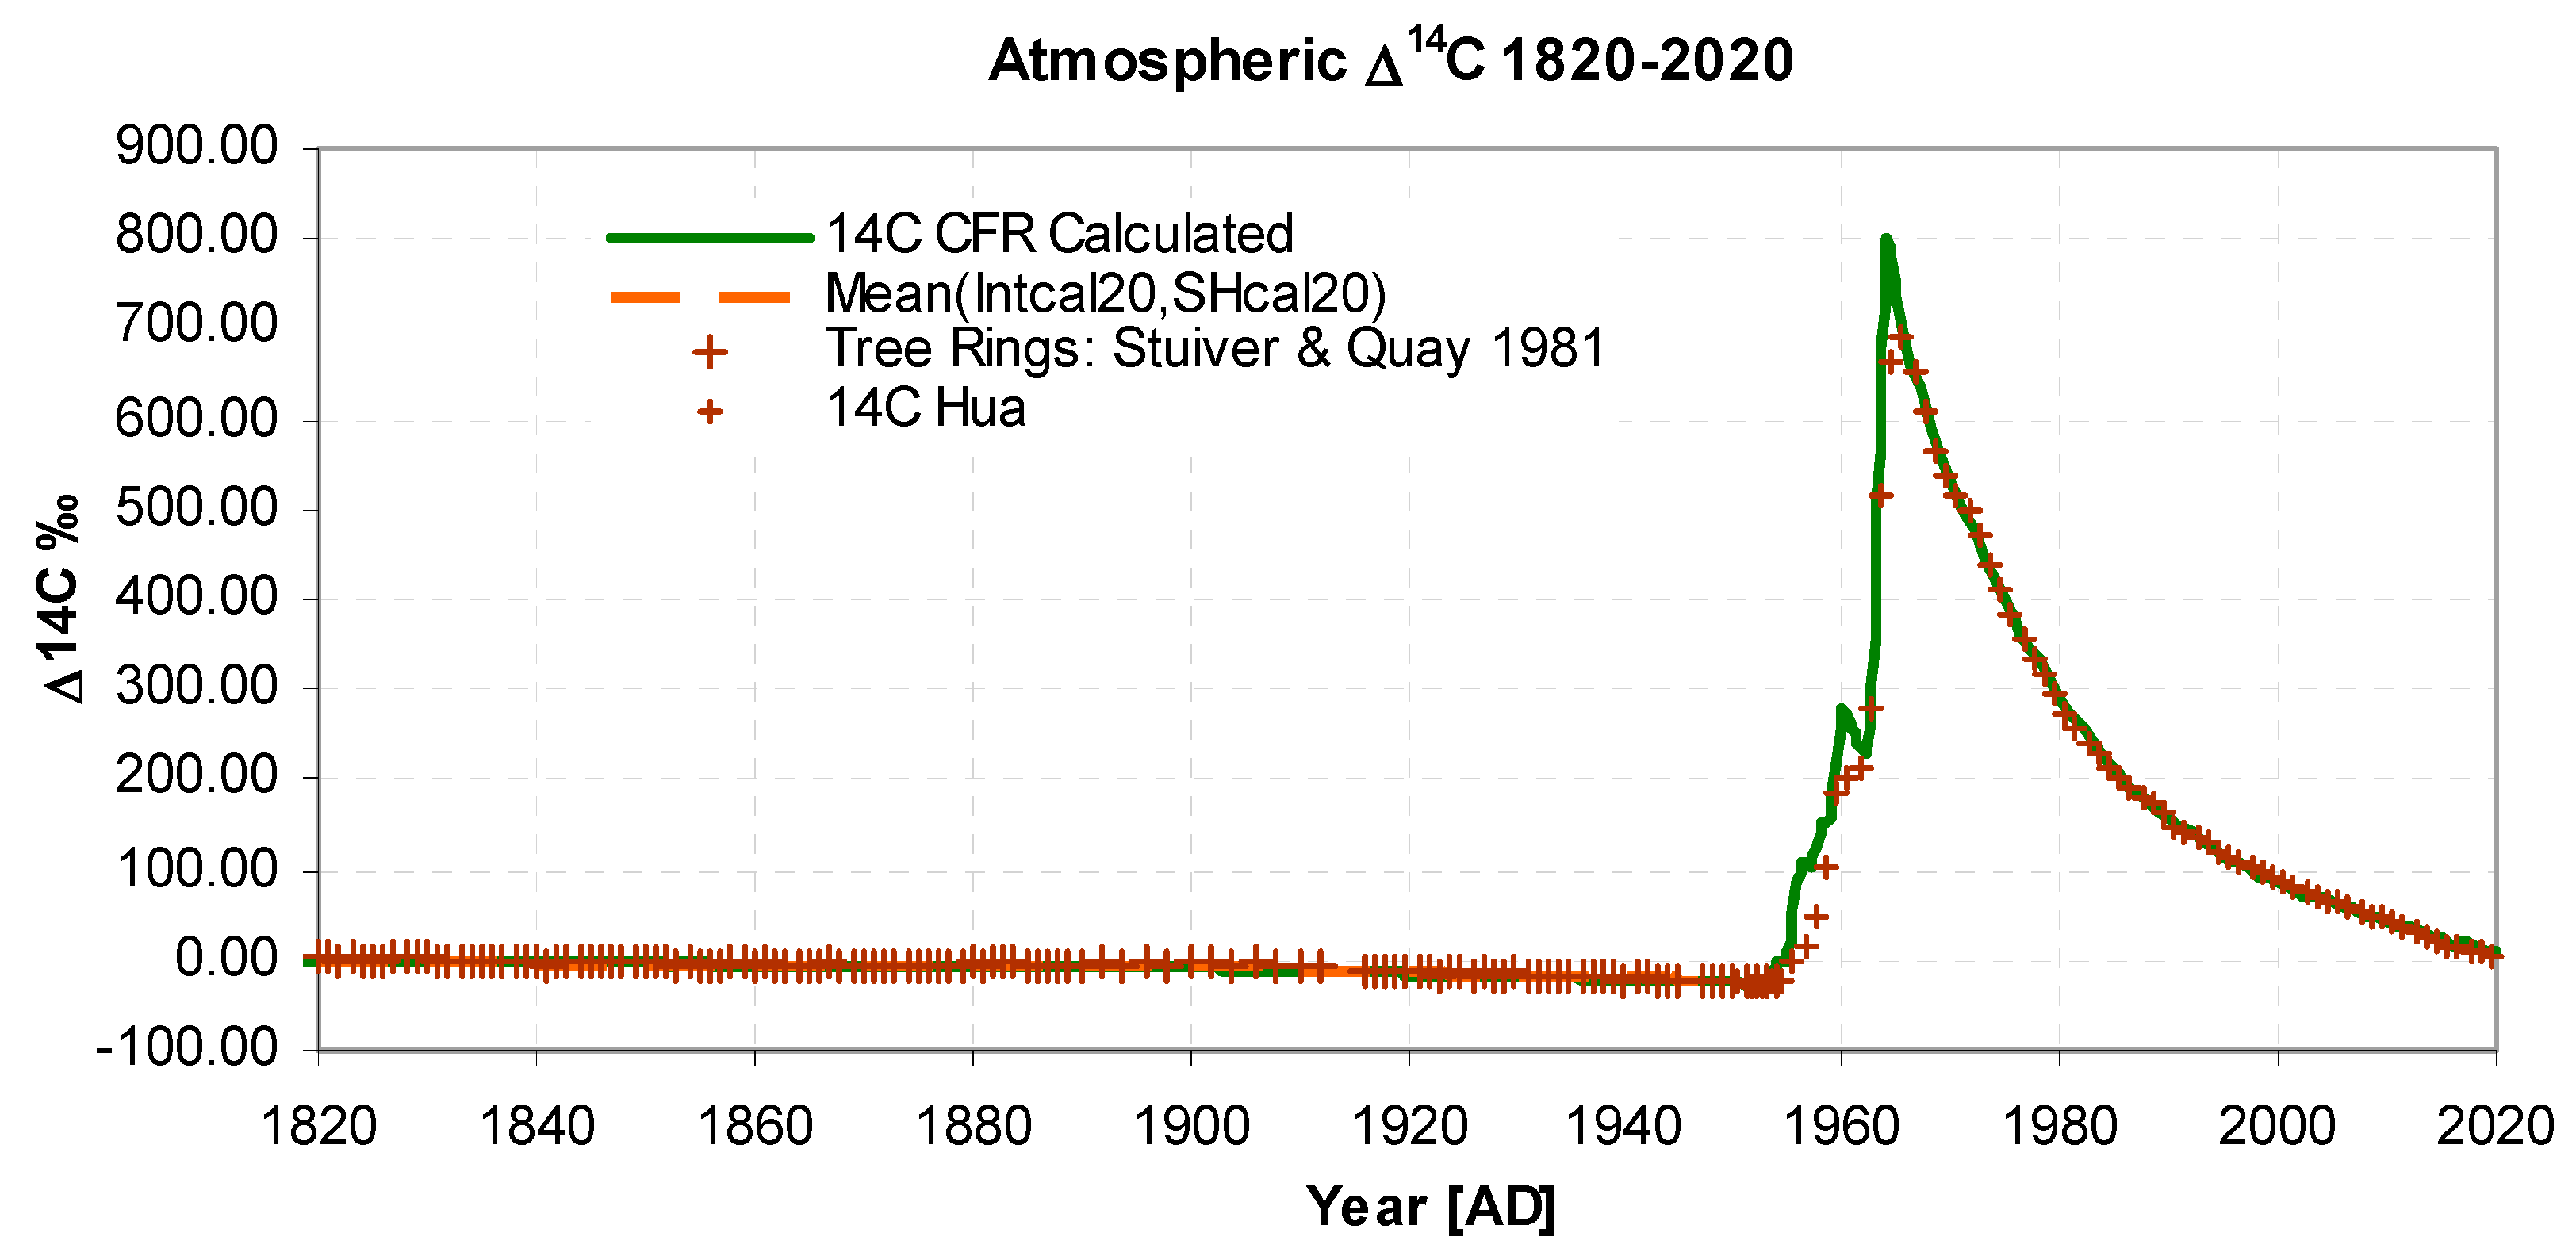
Figure 3.
Atmospheric Δ14C. CFR calculated values: (solid line). Collated: Hua 2021 (crosses), Mean SHCAL20 and INTCAL20 (Square). For σ see Fig. 2.
Figure 3.
Atmospheric Δ14C. CFR calculated values: (solid line). Collated: Hua 2021 (crosses), Mean SHCAL20 and INTCAL20 (Square). For σ see Fig. 2.
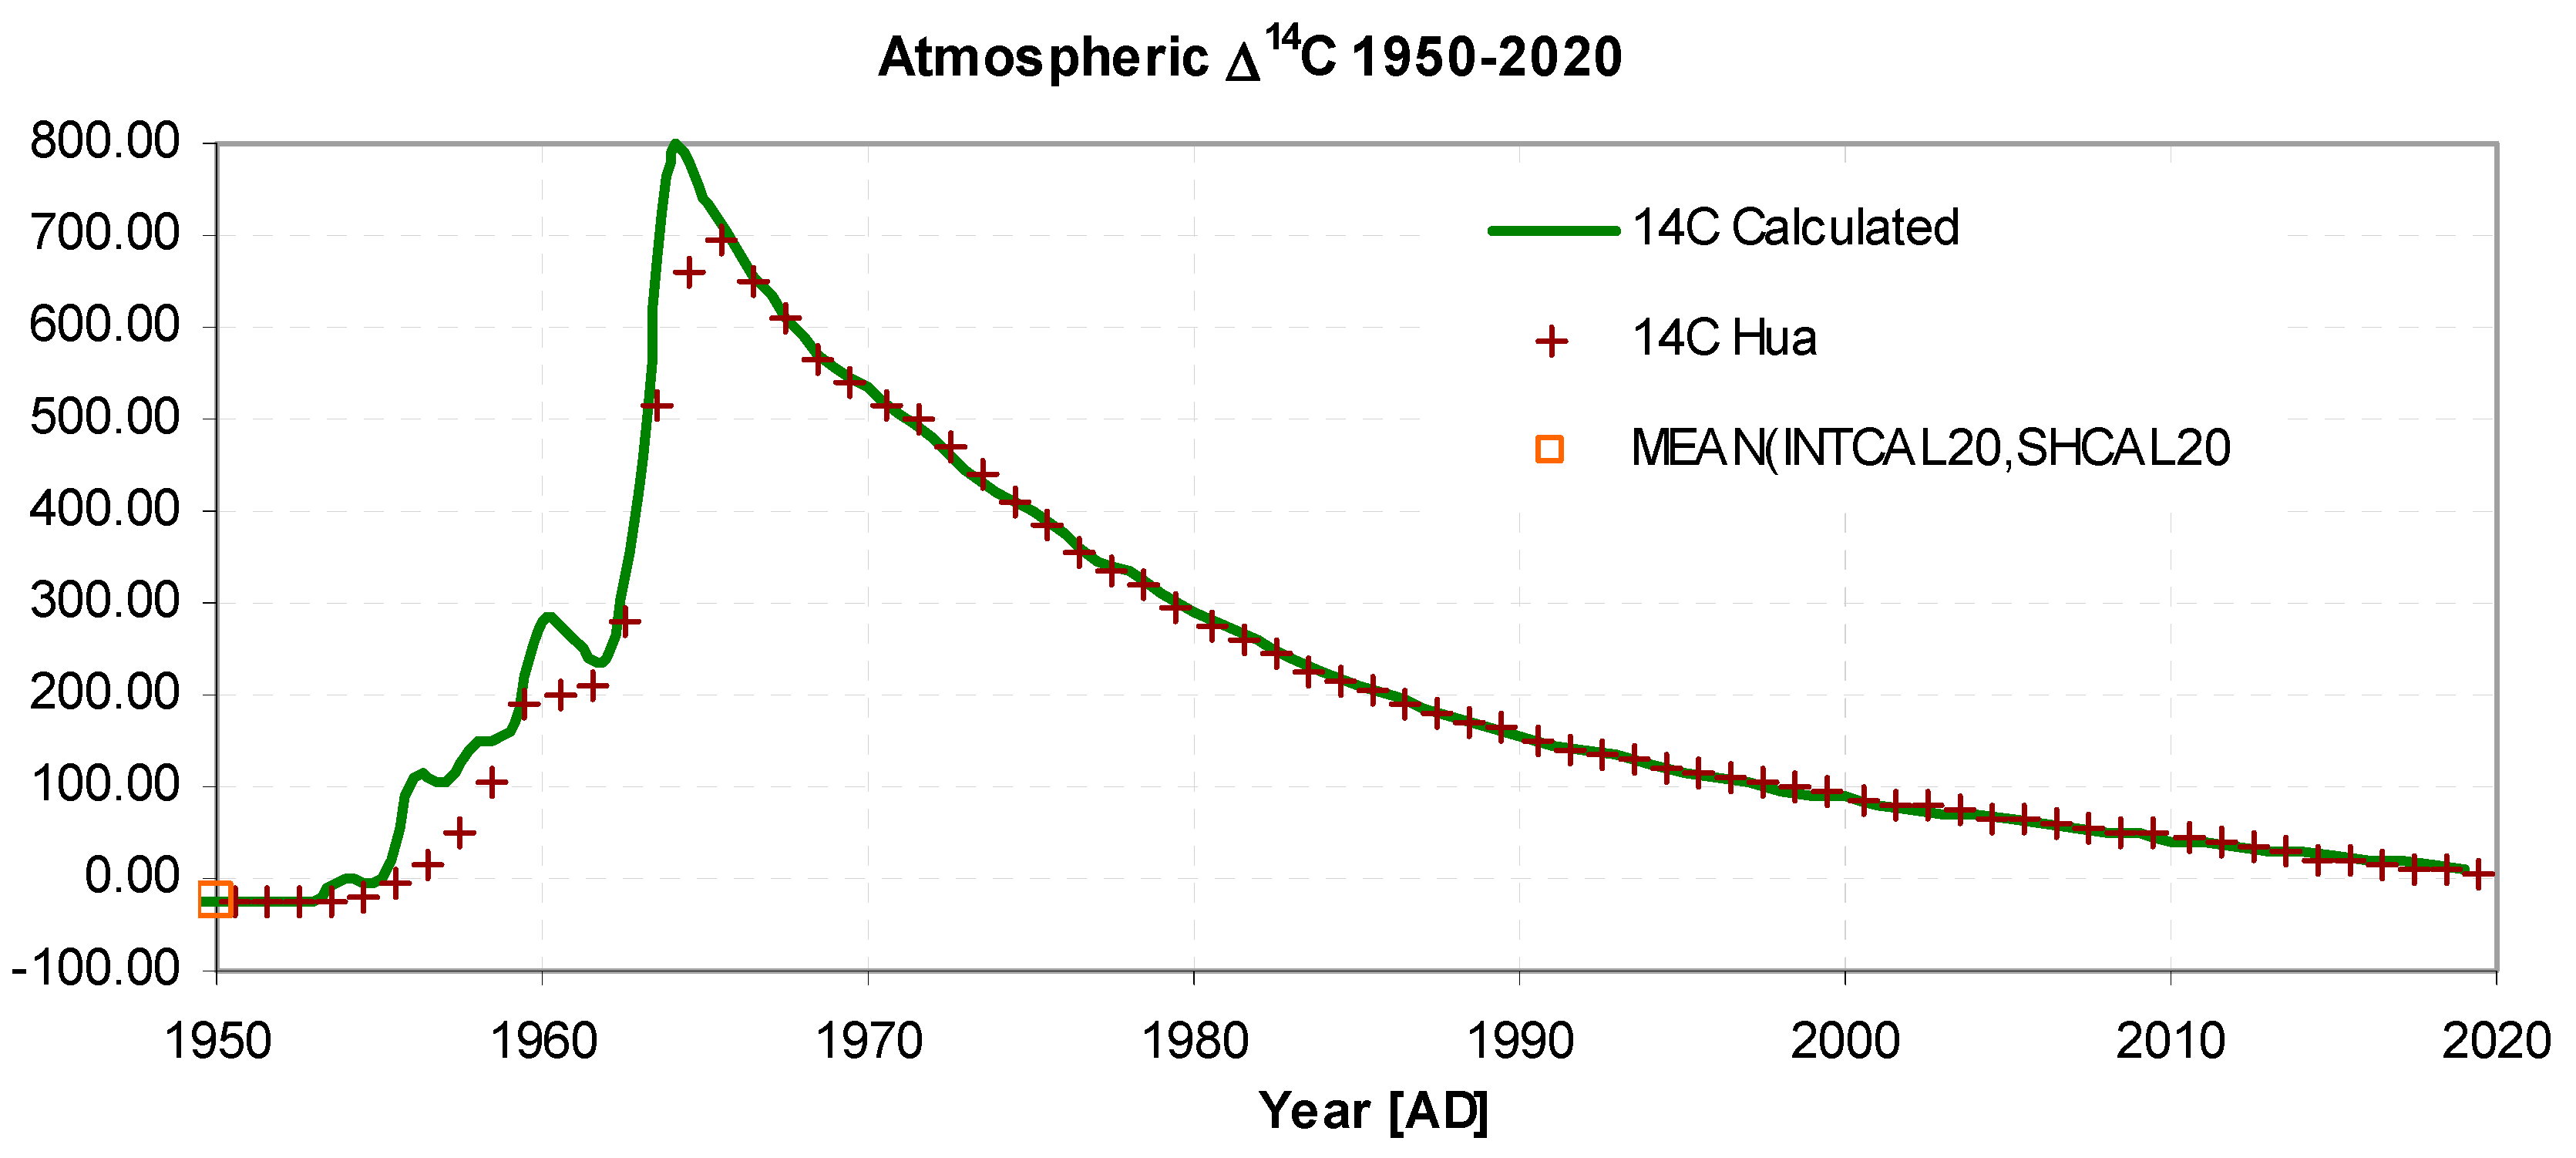
Figure 4.
Atmospheric δ13C 1820-2020. CFR calculated values (solid-line), Observed values: NOAA Paleo (squares), Mauna Loa (crosses) σ1820-2020,= 0.05‰.
Figure 4.
Atmospheric δ13C 1820-2020. CFR calculated values (solid-line), Observed values: NOAA Paleo (squares), Mauna Loa (crosses) σ1820-2020,= 0.05‰.
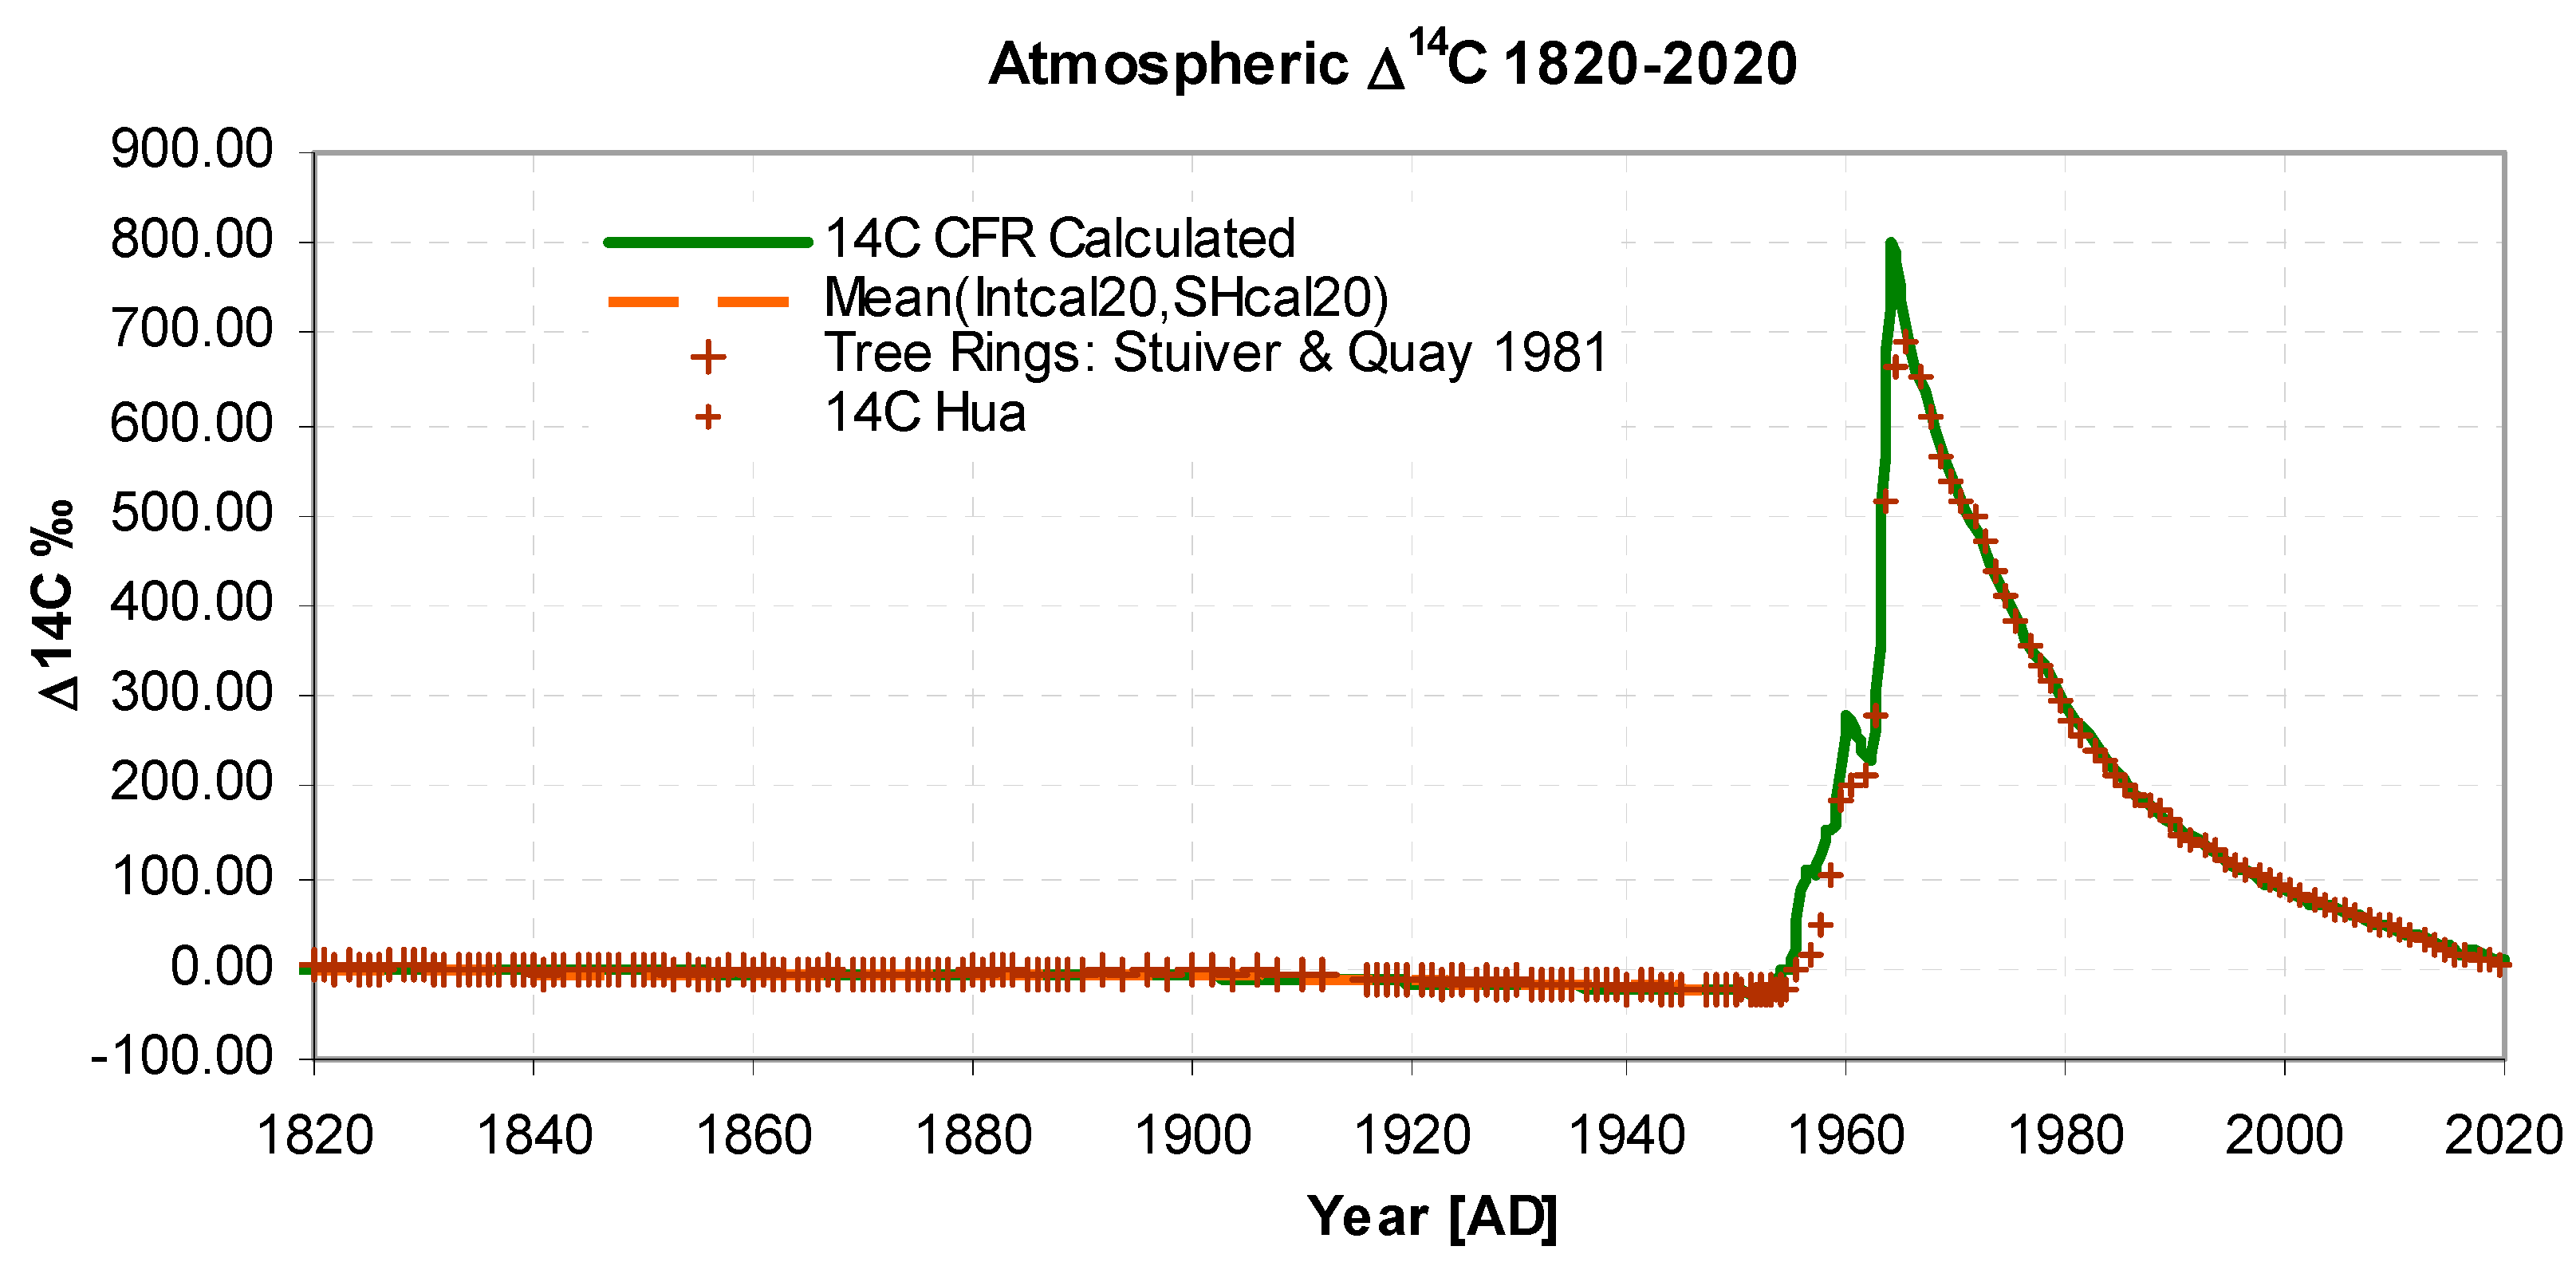
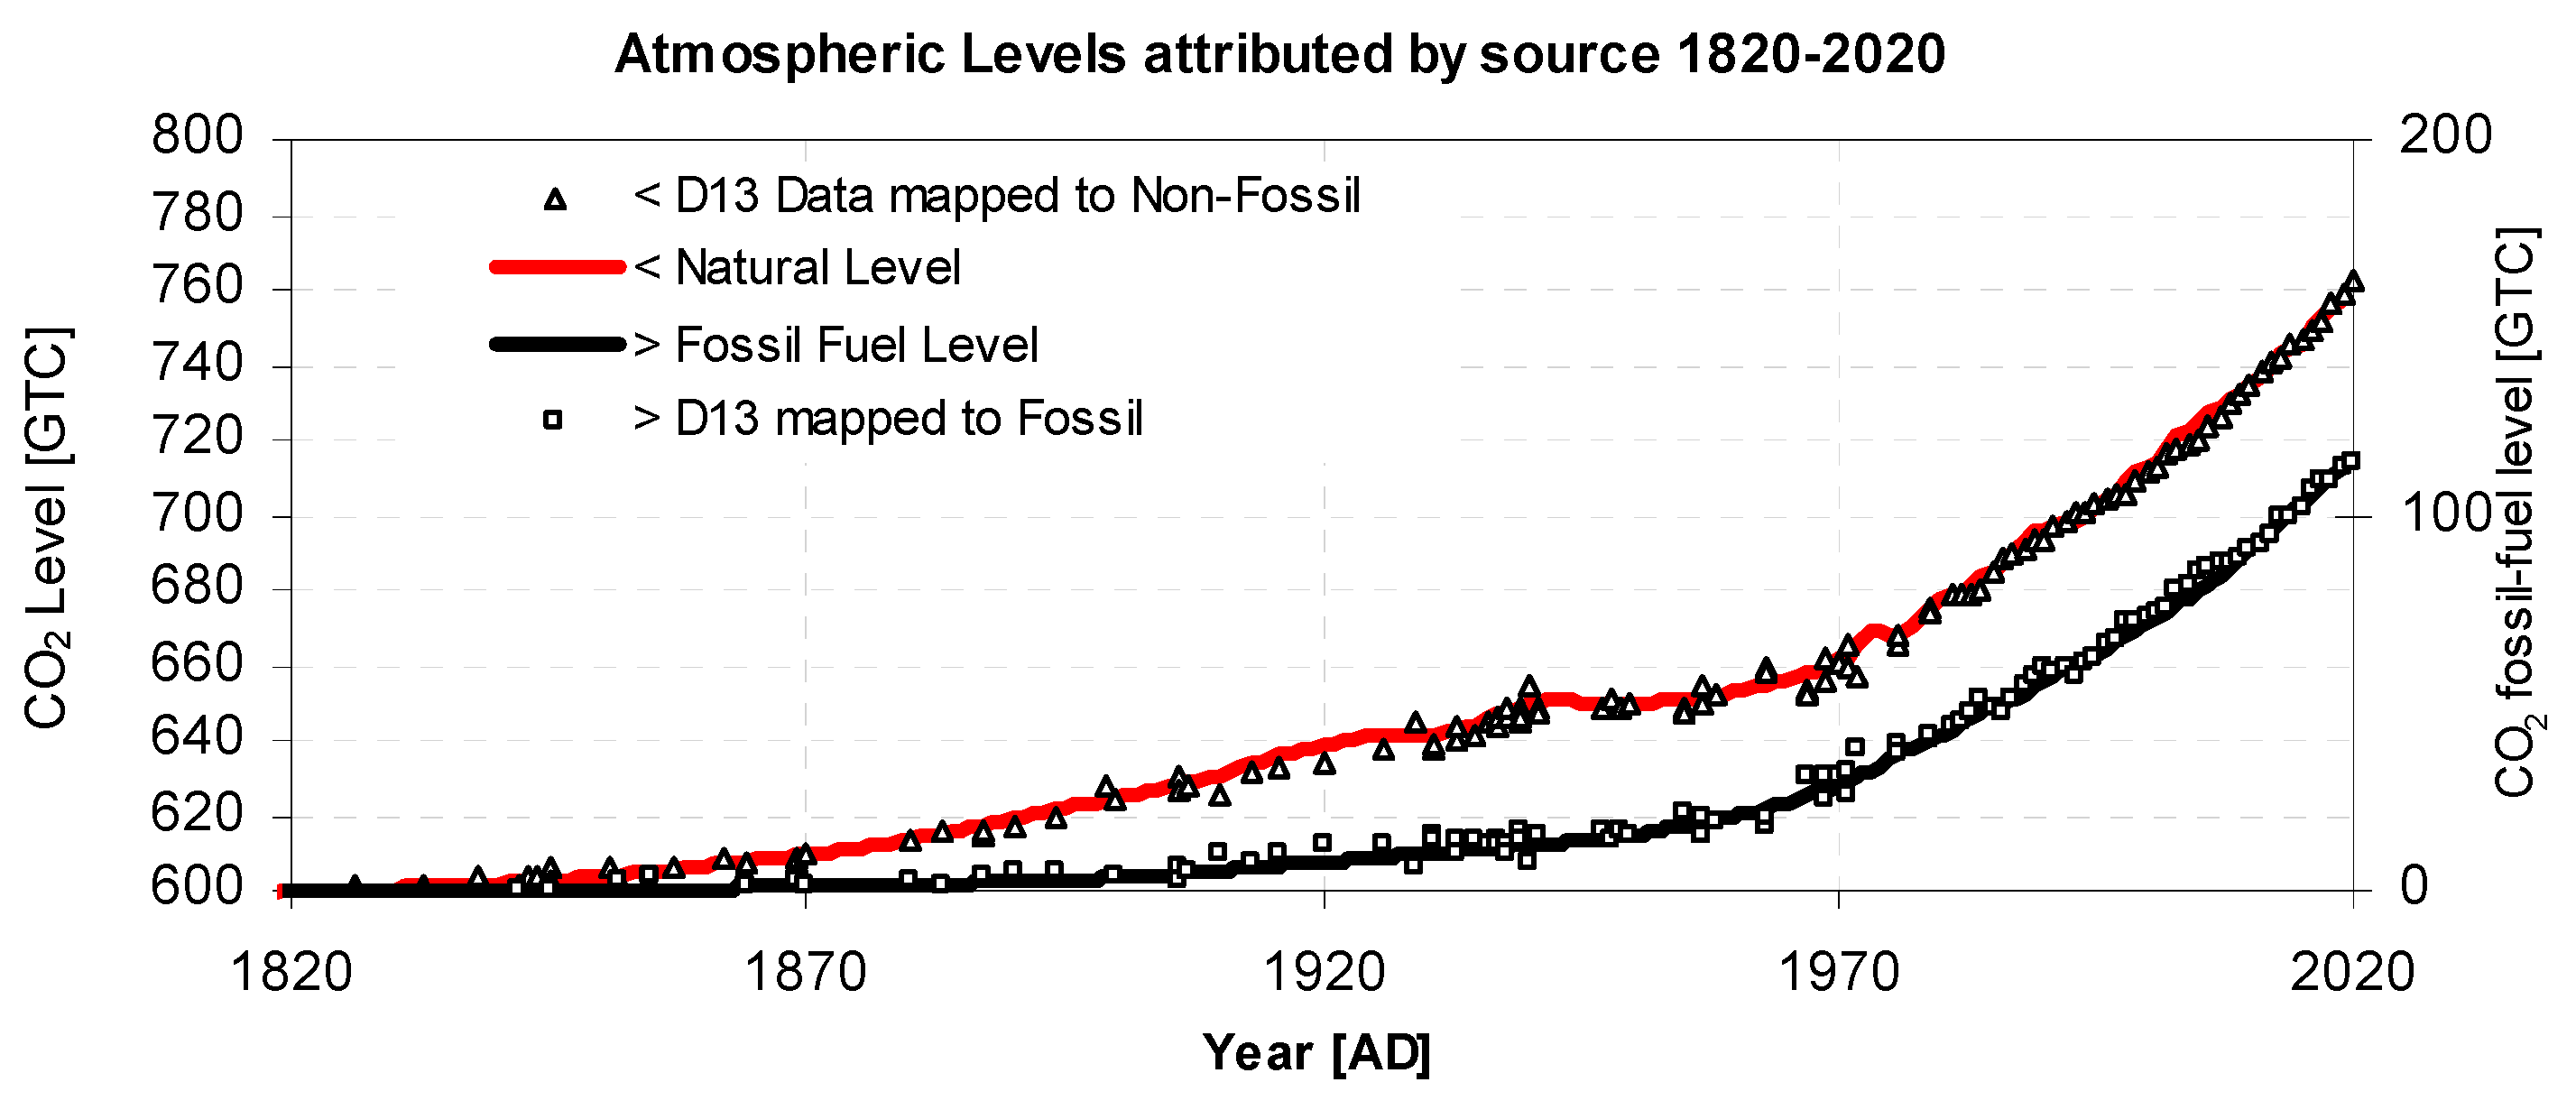
Figure 5.
Atmospheric Levels as derived from δ13. CFR computed (fossil black-line, non-fossil red-line). Measured values mapped via Eq. A6 using δ13CF, δ13CB to fossil (square) and non-fossil (triangle). The slope represents Net flow indicating a similar nett flows of fossil and natural sources.
Figure 5.
Atmospheric Levels as derived from δ13. CFR computed (fossil black-line, non-fossil red-line). Measured values mapped via Eq. A6 using δ13CF, δ13CB to fossil (square) and non-fossil (triangle). The slope represents Net flow indicating a similar nett flows of fossil and natural sources.
To be clear, the CFR does not use ad-hoc corrections to an exponential decay shape. Rather, it calculates year by year the amount of CO2 in the biospheric reservoir, the change of 14C and 13C in atmosphere and reservoir and its release back to the atmosphere. The return flux is determined by "balancing the books" since atmospheric CO2 mixing ratio is a data input. See Appendix C for annual iteration relations. The final solution is found by minimising the standard deviation between the observed and predicted values of δ13C, Δ14C as each parameter is adjusted. The entire model is re-calculated for each of these iterations. In practice the standard deviation between observed and predicted was calculated for each graph σ1, σ2 and a product was taken. The square root of this product gives the total standard deviation,σ. Hence
σj = √ 1/n Σ (obsi - calci)2
σ = (σ1 x σ2)1/2
The minimisation of standard deviation was carried out using the solver function in Microsoft Excel. Only one true constant was used, atmospheric capacity, which was taken to have a value of 2.124 ppm GTC-1 (Ballantyne 2012).
Results
The input data was prepared and selected from Data References 1–5. The model was run from 1750 to 2020, with results from 1820 to 2020 being shown for ∆14C in Figure 2 and Figure 3 and δ13C in Figure 4. In total 340 observed data points were used giving a total overall standard deviation of 0.39‰. The individual quality of fit is indicated in the graph captions. The graphs show excellent agreement between the CFR model and the observed global measurements. Figure 2 shows Δ14C from 1820 to 2020 before, during and after the atomic bomb pulse, with 130 observed data points before 1950 and 70 observed data points from 1968 onwards taken from Hua 2021.
Note the quality of fit during the latter parts of the pulse. If the model is deliberately run with a different relative reservoir size the latter tail portion of the pulse tail ceases to fit, indicating the back flow is having the anticipated effect. Figure 3 shows just the period since the bomb pulse. Figure 4 shows the value of δ13C from 1820 to 2020 with the predicted values (green line) being from the model (after the global curve fitting process) and the experimental values (brown squares and brown cross) being from NOAA PALEO and MAUNA LOA respectively showing good agreement. Figure 5 shows two key quantities from the CFR model, the anthropogenic fossil-fuel level (black line) and the level attributable to the rest (red line) termed here “natural”. The values, see left and right axis labels, represent the level while the slope of the curves indicate flux rate. The similarity of the slopes of the natural level and fossil level curves shown in Figure 5, indicates similar fluxes from natural and fossil fuel inflow rates. The superimposed data points were derived uses Equation B6 as suggested to me by Tom Quirk (Quirk 2021). Essentially the method finds what quantities of the two gases (i.e., pre-industrial δ13CB and fossil fuel δ13CF), would mix to form the observed δ13C value?” Since Figure 4 shows a high level of agreement this is also the case in Figure 5. The solution of all 7 parameters values, is listed in Table 1, along with error SD.
In Table 1, the SD value was derived by variation of each parameter, whilst holding the other values constant, until the standard deviation approximately doubled. Table 2 and Figure 6 indicate cumulative CO2 flows and storage as calculated by the CFR over various periods. The cumulative fossil-fuel within the atmospheric CO2 relative to total fossil fuel emissions during the same period, has remained fairly constant, with 26% remaining in the atmosphere. However, the cumulative atmospheric increase due to fossil fuels relative to the atmospheric increase itself over the past 270 years is 43%, rising to 49% over the past 60 years. For further details see next section.
6. Discussion
In the CFR method described above, the reservoir size and outflow was determined by curve fitting of Δ14C and δ13C values (Figure 2 and Figure 4) whose rate of fall is a balance between Suess dilution and CO2 inflow from the mixing reservoir. Table 6 shows that that atmospheric growth relative to fossil fuel input i.e., 282/454 is as high as 62%, with similar figures being listed in GCB (Friedlingstein 2021 Table 8). However at the same time only 13.7% of the atmosphere consists of fossil fuel CO2. How is this possible? The answer is because the reservoir is considerably larger than the atmosphere. When the reservoir absorbs fossil fuel CO2 its concentration of fossil fuel CO2 increases only slowly. Therefore, although outflow from the atmosphere to the reservoir almost matches the opposing inflow there is a considerable nett transport of fossil fuel CO2 (120GTC) from the atmosphere into the reservoir Figure 6. Hence only 13.7% of the atmosphere remains due to CO2ff. Whether this latter atmospheric inflow would have occurred without anthropogenic fossil fuel emission is an important question, but one this paper does not attempt to address. We now discuss each of the seven solution parameters in more detail.
a) Reservoir Size. The CFR method indicated that the atmosphere could be considered as if connected to a carbon reservoir with approximately six times the atmospheric carbon content (in 1820) and with a current size of 3770 ± 900 GTC, the errors being determined from the uncertainty in reservoir size, Table 1. This figure compares favourably with figures from IPCC WG1AR6 for the total reserve totalling 4250 GTC (Canadell et al. 2021)comprising 1700 GTC in soil, 450 GTC in vegetation, 1200 GTC in permafrost and 900 GTC in surface ocean.
b) Airborne Factor. It is clear that each year, the annual growth in the atmospheric level of CO2 is smaller than the CO2ff. This ratio is known as the Airborne Factor. The model returns a figure of 54% ± 11% of CO2ff entering the atmosphere while 46% is removed each year, in good agreement with the value of airborne fraction averaged over 60 years recently published by IPCC of 44% ± 10% (Canadell et al. 2021).
c) Nuclear Bomb Yield. The model produces a figure of 1.6 ± 0.1 mills of 14C per MT. The number of atoms per unit of Δ14C can be found by calculating the number of carbon atoms for the CO2 level in 1950 (ACO2 = 6.7x10¹⁷), using Avogadro's number (NA) and by dividing by the carbon atomic weight MC = 12, then multiplying by the 14C/12C ratio which can itself be calculated from the specific activity, α = 0.226 decays per gram, 14C half life T1/2 = 5730yr = 1.807 1011 s, and ln(2) as follows giving
Nc = (ACO2 NA /MC12 ) x ( α T1/2 MC14 / (NA ln(2)) = 4.6 x 1028 14C atoms per unit Δ14C
d) Turnover Time. The figure of turnover time T, was found to be 14.9 ± 1.7 years. The flux figure may be calculated as atmospheric size divided by turnover time (IPCC Glossary 2013, Harde 2017), and ranges from 39.7 GTC yr-1 in 1720 to 59.0 GTC yr- in 2020. These figures are around 1/3rd of the IPCC listed values who have in WG1 AR5 for 1750 an oceanic flux of 60 GTC yr-1 and land flux of 108 GTC yr-1, and for 2013 79 GTC yr-1 and 120 GTC yr-1 respectively, with uncertainties quoted as a minimum of 50% (Ciais 2013). WG1 AR6 has "rescaled values" giving oceanic flux as 54 GTC yr-1 and land 111 GTC yr-1 (Canadell et al. 2021). One consideration is that some of the carbon may not isotopically mix in the reservoir at each iteration, thereby leaving carbon trapped in an annual cycle or perhaps in soil or dense wood. Hence the figures may correspond to the amount of carbon which mixes each year in the ocean, but not the amount that is cycled. Indeed, the figure is not far from the oceanic flux quoted above. Furthermore the turnover time figure compare very reasonably with older estimates by Revelle & Suess 1957 ~ 10yrs, and Arnold & Anderson 1957 of 10 - 20yrs, these being referred to (respectively) as “the average lifetime of a CO2, molecule in the atmosphere before it is dissolved into the sea” and “the mixing half-time between the atmosphere and ocean”.
e) Pre-industrial Δ14Cinit, Pre-industrial δ13Cinit. The solution values (-3‰, -6.7‰) from the model for these values represent the model aligning to the initial values and are in good agreement with values of Δ14Cinit = -3.4‰ (Intcal20) and δ13Cinit = 6.7‰. (Rubino et al 2013).
f) Fossil Fuel δ13Cff. This figure from the model is δ13Cf = -20.8 ‰, in reasonable agreement but slightly low for fossil fuels. See Stuiver & Polach 1977 who have coal δ13C = -23.
It is extremely unlikely the above results would occur by chance given the excellent mean quality of fit for Δ14C and δ13C, and the reasonable values for six of the seven solution parameters, together with the reasonable explanation for the discrepancy in the other parameter, atmospheric outflow.
7. Conclusions
This paper presented a novel method for calculating global CO2 flux, demonstrating that despite its apparent complexity, global flows can be approximated using a top-down approach. The CFR model provides a plausible explanation for the "14CO2/CO2 attenuation factor" suggested by Stuiver and it accounts for a similar discrepancy in 13C dilution, providing a means for estimating the influx. It has been asserted that the 14C bomb pulse cannot be used for CO2 flux studies due to anomalous behaviour of 13C and 14C regarding the Revelle factor (Joos 1994, Tans 2022). Yet this study produces reasonable results, without incorporating an exception for the Revelle anomaly for 13C and 14C, thus showing that the Tans assertion is unfounded. The specific theoretical mistakes which may have led to this assertion are listed in Appendix. This conclusion restores the common-sense view that such anomalous behaviour of carbon isotopes is unlikely. The effects of this mis-step upon climate science may be considerable and wide reaching, since the isotopic ratiometric exception has almost certainly entered the internal coding for various climate models. Such models have been widely used for flux calibration using the partition method (Zeng et al, 2020) and for scenario testing of fossil fuel emissions (IPCC 2021). Although the CFR model is not itself a climate model it can usefully provide indications of effective bulk global parameters and provides a focus on the physics of internal processes. The CFR method thus offers a means by which estimates of effective bulk global quantities can be compared. The model can be downloaded as a Microsoft Excel Spreadsheet from https://www.geomatix.net/atmos2boxmodel.htm.
Acknowledgments
I would like to thank my colleagues Dr. Andrew Layfield (Engineering and Environmental Studies), City University, Hong Kong, and Dr. Michael Oates (Geologist) of Barrow-upon-Humber, UK for their detailed comments and proof reading. The author would like to thank and acknowledge all the data providers indicated in "Data References", without whom this work could never have been carried out. This research was self-funded and received no external funding. The author declares no conflict of interest. The author would like to thank the publisher for waiving the APC which was funded by the publisher.
Appendix A. Notes on Tans 1993 and Tans 2022
In 1993 Tans derived an expression for CA dRA/dt where CA is the atmospheric CO2 content, R is the isotopic composition with subscript A for atmospheric gaseous CO2 Equation (13) and O for ocean, and F is flow and subscript FOS refers to fossil fuel CO2 emissions. Tans 2022 Equation (1) is a simplified version of his Equation (13) obtained by setting all terms with subscripts lb or ph to zero. In either case Tans derives.
CadRa/dt = Ffos (Rfos - Ra) - (Fao - Foa) Ra ( αao - 1) + Foa αao (Raeq - Ra) )
It is claimed the last term, because it is a difference of ratiometrics, multiplied by a one way flux provides evidence of "pure isotopic equilibration that always takes place regardless of what the net total flux is". In 2022 he states "The Revelle factor does not apply to isotopic equilibration because a 12CO2 molecule is replaced by a 13CO2 or vice versa. As a result, an isotopic anomaly disappears from the atmosphere more quickly than a total CO2 anomaly." In the derivation Tans has.
where αoa and αao are the fractionation rates to and from the atmosphere. At equilibrium between the two reservoirs Rfos=0, d13Ca/dt =0 and dCa/dt =0 so we have.
d13Ca/dt = d (RaCa) /dt = CadRa/dt + RadCa/dt
d13Ca/dt = RfosFfos + αoaRoFoa - αaoRaFao
dCa/dt = Ffos + Foa - Fao
αoaRoeqFoaeq = αaoRaeqFaoeq
Foaeq = Faoeq
Giving
αoaRoeq = αaoRaeq
However Tans, after rearranging, has written eq. A7 as
The effect of the incorrect substitution is to enable the grouping in the last term in Equation (T1). Its effect upon the rate of isotopic transfer d13Ca/dt can be evaluated by adding Tans' expression for CadRa/dt (eq. T1) to the value of RadCa/dt (Equation (A4) multiplied by Ra) to provide a new “test” value for d13Ca/dt.
“d13Ca/dt” = Ffos (Rfos - Ra) - (Fao - Foa) Ra ( αao - 1) + Foa αao (Raeq - Ra) + Ra (Ffos + Foa - Fao)
After some re-arranging and using the correct substitution of (A7) gives.
“d13Ca/dt” = Ffos Rfos + αoa Roeq Foa - αao Ra Fao
It can be seen that the term Ro in eq. A3 is replaced by its equilibrium value Roeq . This is not justifiable as it prevents the ocean from exhibiting any isotopic variation when coming to an equilibrium, effectively clamping its isotopic ratio to the value Roeq, implying its volume is infinite. Furthermore Tans' expression for CadRa/dt (Equation (A1)) does not fully represent d13Ca/dt (which is the quantity required) because RadCa/dt is missing from the calculation. The same arguments apply to 14C as 13C. Equations (A3) and (A4) are the correct versions and are used throughout this paper neglecting fractionation (with αoa = αao= 1) and in the production of the presented results.
Appendix B. Notes on Isotopic Mixtures and Radiocarbon Levels
Dalton's "Law of Partial Pressures" indicates that, when two gases having partial pressure PA and PB and concentration RA and RB, are mixed, then the total pressure, PT of the mixture will be given by.
and its concentration RM of the mixture or model is
PT = PA + PB
RM = (RA PA +RB PB) / PT
Note: If the isotopic amount is described by an offset scale e.g., R = (m.δa + c) the above becomes
which after rearranging gives equations of similar form, i.e.
(m δm + c) PT = ( m δa + c) PA + ( m δa + c) PB
δm Pt = δa PA + δb PB
δm = (δa PA + δb PB) / PT
Conversely, for a mixture of total pressure PT, whose concentration is δm, given the concentration of its two constituents δa and δb, the pressure of the constituent PA, is given by (Quirk T. 2021).
PA = PT ( δm - δa ) / ( δa - δb )
Conventionally δ14C is defined as an offset scale whose value is zero when As, the specific activity of the atmosphere or reservoir is equal to Aabs, the absolute specific standard, with both being in units of Bq per unit mass of carbon. Hence we may write
where A refers to the relative specific 14C activity. Thus A contains no allowance for radioactive decay or fractionation. For the mixture M obtained by mixing natural N and fossil fuel derived F components we may write using Equation (A2) for AM and δ13CM
bearing in mind that AF = 0. The inverse for δ13CM,, used in Figure 6 to map from observed atmospheric values of δ13 to CO2 levels by source from Equation (A3) is
A = δ14C +1 = (As/Aabs)
AM = (AN PN / PT) -1
δ13CM = (δ13CF PF + δ13CN PN) / PT
PN = PT ( δ13CM - δ13CF ) / ( δ13CN - δ13CF )
Fractionation
It is desired to compare values of AM with collated measured values of Δ14C. However Δ14C incorporates a fractionation correction to "translate the measured activity to the activity the sample would have had if it had been wood" (Lund 2011) and is a function of δ13C. Therefore a fractionation correction must be applied to AM, where δ13 for wood is taken as -25‰, given by
Δ14CM = AM . { (1+ δ13CW)/(1+ δ13CM) }2 - 1
This formula decreases the values by around 35‰ compared to the values for AM.
Age Correction
Sample age correction, common in radiocarbon calculations, is not included in the CFR or the definition of Δ14C. The 14C half-life of 5700± 30 years (Kutschera, W., 2013) translates to a decay of around 2% over the period 1820 to 2020. However, the steady level of stratospheric 14C production roughly balances the amount of 14C decay since the two are in approximate equilibrium, providing a buffering effect. Disregarding 14C decay introduces an error at most in the low percentage region and probably considerably smaller and is regarded as negligible. Therefore neither 14C decay nor natural stratospheric 14C production were included in the CFR model. Values of A were not artificially corrected for 14C decay before comparison with Δ14C.
Appendix C. Implementation
The implementation process involves a number of calculations at each iteration which are based upon "Daltons Law of Partial Pressures". The amount of CO2 in the atmosphere is ACO2, its turnover time is T, outflow is AOUT and the amount of CO2 initially in the reservoir is RCO2 , with respective increases being written as Δ(ACO2) and Δ(RCO2) at each iteration, i, then the iteration relationships are:-.
Δ(RCO2) = RCO2[i] - RCO2[i-1] Δ(ACO2)= ACO2 [i] - ACO2[i-1]
AOUT[i] = AOUT /T AIN[i] = AOUT [i] + ACO2 [i] - ACO2 [i-1] - AF CO2FF [i]
RCO2[i] = RCO2[i-1 ]+ AOUT[i] - AIN[i] + (1-AF)CO2FF [i]
For the ratio of 14C to 12C in Atmosphere A14[i] and Reservoir R14[i] we have:-
A14[i] = (A14 [i-1].ACO2 [i-1] + AIN [i-1].R14[i-1] - AOUT[i-1]. A14[i-1] + B14[i-1]) / ACO2 [i]
(14C previously + 14C coming in - 14C going out + Bomb 14C ) / Atmos C
R14[i] = (R14 [i-1].RCO2 [i-1] - AIN [i-1].R14[i-1] + AOUT[i-1]. A14[i-1] ) / RCO2 [i]
( 14C previously + 14C coming in - 14C going out ) /Reservoir C
Similarly the relative atmospheric and reservoir fossil fuel content AFF[i], RFF[i], on a scale of 0 to 1, are given by:-
where the absolute fossil fuel level, FL[i], and natural non-fossil level, NL[i], are shown in the final equation. The isotopic ratiometric measures for 13C, δ13C and 14C Δ14C are given by:-
where AOUT is the atmospheric outflow, ACO2 is the atmospheric CO2 mixing ratio, AIN is the atmospheric inflow, RCO2 is the reservoir CO2 mixing ratio, RFF is the relative fossil fuel level in the reservoir, R14 is the f14C level in the reservoir, FRSVR is the Fossil fuel CO2 mixing ratio in the reservoir, A14 is the f14C level in the atmosphere, B14 is the annual 14C production due to atomic weapons testing Δ14C is the 14C/12C ratio and δ13C = is the 13C/12C ratio and the square brackets "[ ]" refer to the value at each iteration. The constant α is an output which in the case of an infinite reservoir represents the time constant in equations C1, C2.
AFF[i] = (AFF [i-1].ACO2 [i-1] + AIN [i-1].RFF [i-1] - AOUT[i-1].AFF[i-1] + AF CO2FF [i]) / ACO2 [i]
RFF[i] = (RFF [i-1].RCO2 [i-1] - AIN [i-1].RFF [i-1] + AOUT[i-1].AFF[i-1] + (1-AF) CO2FF [i]) / RCO2 [i]
FL[i] = ACO2[i] AFF[i] NL[i] = ACO2[i] (1- AFF[i])
δ13C = δ13CFF . AFF + δ13CN ( 1- AFF ) Δ14C = (A14 -1)
Initial Conditions: AIN [0] = AOUT [0] , A14 [0] = 1 , R14 [0] = 1, AFF[0] = 0 , RFF[0] = 0
Appendix D. Attenuation Factor of 14C and 13C
Stuiver & Quay proposed an "attenuation factor" for Δ14C because the Suess dilution of atmospheric CO2 was not as great as expected. (Stuiver & Quay 198). Between 1820 and 1950 the actual reduction in Δ14C was around 20‰ using IPCCC-WG1AR5 WG1AR5 Figs. 4&6b, pp 493-4 (Ciais 2013) or Intcal20 data. During this time the atmospheric level increased from 600 to 667 GTC while listed CO2ff emissions totalled 61GTC. Setting in Equation B5 δ14CF = -1000, PF = 6, δ14CN= 0 , PN= 600, PT=667 gives a reduction in Δ14C of 89‰, much larger than the measured decrease of 20‰. A similar argument can be made for δ13C. The actual annual reduction can be measured from Figure 4 or from IPCCC-WG1AR5 Figure 6b and is around 0.025‰ per year. Both the IPCC curve and Figure 4 from this paper indicate that the annual CO2 emissions from fossil fuels in 2000AD was approximately 6 GTC yr-1 around one 125th of the atmospheric size of around 750 GTC which was increasing at around 3GTC per year. For fossils d13 = -26V (or higher) while for the atmosphere in 2000AD δ13 = -8 (see) Setting in Equation (B5) δ13CF = -26, PF = 6, δ13CN=-8, PN= 750, PT=756 gives δ13CM = -8.14‰, indicating a decrease of 0.14‰ per year which is considerably greater than 0.025‰ per year. Some have suggested fossil fuels have even lower δ13 figures of approaching -44‰ (Bush et al 2007) which would make this discrepancy greater. Even allowing for the airborne fraction (i.e., the fact that the atmospheric increase was attributed to only half of the CO2ff) there still is a considerable discrepancy in both cases. The analysis given above of δ13C and Δ14C is entirely independent of the CFR model itself and is simply based on published data. It is postulated here that the above discrepancy can be accounted for by a CO2 inflow from a reservoir in which previous atmospheric CO2 has accumulated, which having higher Δ14C and δ13C values than those for fossil fuel would hinder the fall. The CFR model not only shows that this inflow is a plausible explanation, it accurately calculates the inflow, the δ13C and the value of Δ14C.
References
- Archer, D et al. 2009. Atmospheric lifetime of fossil fuel carbon dioxide. Annu. Rev. Earth Planet. Sci., 2009. 37:117–134.
- Arnold J.R. & Anderson E.C. 1957. The Distribution of Carbon-14 in Nature. Tellus IX 1957.
- Ballantyne, A. P et al. 2012. Increase in observed net carbon dioxide uptake by land and oceans during the last 50 years. Nature, 488, 70–72.
- Bauska et al. 2014 Carbon isotopes characterize rapid changes in atmospheric carbon dioxide during the last deglaciation. PNAS | March 29, 2016 | vol. 113 | no. 13 | 3465–3470.
- Bengston et al. 2020 Lower oceanic δ13C during the last interglacial period compared to the Holocene. Clim. Past, 17, 507–528. [CrossRef]
- Bindoff, N.L. et al. 2013, Detection and Attribution of Climate Change: from Global to Regional. Climate Change 2013: The Physical Science Basis. WG1 AR5, IPCC, Cambridge University Press.
- Bolin B, Eriksson E. 1959. Changes in the carbon dioxide content of the atmosphere and sea due to fossil fuel combustion. In Rossby Memorial Volume, ed. B Bolin:130-42. New York: Rockefeller Institute Press, Oxford University Press. Number of 130-42 pp.
- Broecker W. & Peng T, 1994. Stratospheric contribution to the global bomb radiocarbon inventory: Model versus observation.
- Bush S.E. et al 2007. Sources of variation in d13C of fossil fuel emissions in Salt Lake City, USA , Applied Geochemistry 22 (2007) 715–723.
- Canadell, J.G et al. 2021: Global Carbon and other Biogeochemical Cycles and Feedbacks. In Climate Change 2021: The Physical Science Basis. WG1 AR6 IPCC, [Masson-Delmotte V et al.]. Cambridge University Press, pp. 673–816. [CrossRef]
- Ciais, P. et al, 2013. Carbon and Other Biogeochemical Cycles. Chapter 6. Climate Change 2013: The Physical Science Basis. [Stocker et. al] WG1 AR5 IPCC 2013.
- Ciais, P. et al, 1995. Partitioning of ocean and land uptakeof CO2 as inferred by d13C measurements from the NOAA Climate Monitoring and Diagnsotics Laboratory Global Air Sampling Network, Journal of Geophysical Research Vol. 100 D3, 5051-5070, March 20, 1995.
- Flato, G.et al., 2013: Evaluation of Climate Models. Climate Change 2013: The Physical Science Basis. WG1 AR5, IPCC. Cambridge University Press, UK and USA.
- Friedlingstein P. et al, 2021. Global Carbon Budget 2021, Earth Syst. Sci. Data, 14,1917-2005, 2022. [CrossRef]
- Gruber, N. et al. 2019. The oceanic sink for anthropogenic CO2 from 1994 to 2007. Science 363, 1193–1199 (2019).
- Harde H. 2017. Scrutinizing the carbon cycle and CO2 residence-time in the atmosphere , Global and Planetary Change 152 (2017) 19–26.
- Harvey Danny LD 2000, Global Warming: The Hard Science, Pearson Education Limited, UK. ISBN 0582-38167-3.
- Hesshaimer, V et al. 1994, Radiocarbon evidence for a smaller oceanic carbon dioxide sink than previously believed. Nature Vol 370 21 July 1994.
- Hua Q. et al. Atmospheric Radiocarbon For The Period 1950–2019, Radiocarbon Vol 0 Nr00 2021. Submitted. Private Communication.
- IPCC 2013: Glossary. Climate Change 2013: The Physical Science Basis. [Stocker et. al] WG1 AR5 IPCC 2013.
- IPCC, 2021: Annex II: Models [Gutiérrez, J M., A.-M. Tréguier (eds.)]. In Climate Change 2021: The Physical Science Basis. Contribution of Working Group I to the Sixth Assessment Report of the Intergovernmental Panel on Climate Change [Masson-Delmotte V. et al]. Cambridge University Press, 2087–2138. [CrossRef]
- Joos F. 1994. , Imbalance in the Budget, Nature Vol 370 21July 1994.
- Kutschera, W., (2013) Applications of accelerator mass spectrometry. International Journal of Mass Spectrometry 349, 203-218.
- Levin I. et al. 2010 Observations and modelling of the global distriution and long-term trend of atmospheric 14CO2. Tellus B, 62: 26-46 2010.
- Marcott A S et al., 2014. Centennial-scale changes in the global carbon cycle during the last deglaciation. Nature,Vol 514,30October 2014.
- Paola, C. & Leeder M, Simplicity versus complexity. Nature 469, 38–39(2011).
- Quirk T. 2021 Suggested method using inversion formulae for d13C. Private Communication 2021.
- Revelle, R & Suess H, 1957. Carbon Dioxide Exchange Between Atmosphere and Ocean and the Question of an Increase of Atmospheric CO2 during the Past Decades. Tellus IX(1957).1.
- Rubino, M et al 2013. A revised 1000 year atmospheric δ13C-CO2 record from Law Dome and South Pole, Antarctica. Journal of Geophysical Research: Atmospheres, 118(15), pp.8482-8499. 2013.
- Physics, Division of Nuclear Physics. Sweden. 2011.
- Stenström K. E. 2011. A guide to radiocarbon units and calculations, Lund University, Department of Stuiver, M. & Quay, P.D. 1981. Atmospheric 14C changes resulting from fossil fuel CO2 release and cosmic ray flux variability. Earth and Planetary Science Letters, 53 (1981) 349-362.
- Stuiver M & Polach H A. 1977 Discussion: Reporting of 14C Data, Radiocarbon, Vol19 No 3 1977 P355-363.
- Stuiver, M et al. 1998 "Intcal98 Radiocarbon Age Calibration, 24,000-0 Cal Bp", Radiocarbon, Vol. 40, No. 3, 1998, P.1041-1083.
- Suess, H.E. 1955 Radiocarbon concentration in modern wood. Science 122, 415.
- Svetlik I. 2010 Estimation of Long-Term Trends in the Tropospheric 14CO2 Activity Concentration. Proceedings of the 20th International Radiocarbon Conference, edited by A J T Jull, RADIOCARBON, Vol 52, Nr 2–3, 2010, p 815–822.
- Tans, P., Berry J., Keeling R. 1993. Oceanic 13C/12C Observation: A new window on ocean CO2 uptake. Global Biogeochemical Cycles Vol 7 No2 P353-368) June 1993.
- Tans P. 2022. Reminiscing On The Use And Abuse Of 14c And 13c In Atmospheric Co2. Radiocarbon, Vol 64, Nr 4, 2022, p 747–760. [CrossRef]
- Zeebe, R.E. and Wolf-Gladrow, D.A. 2001. CO2 in Seawater: Equilibrium, Kinetics, Isotopes. Gulf Professional Publishing. http://store.elsevier.com/product.jsp?isbn=9780444509468.
- Zeng J. et al. 2020. Global terrestrial carbon fluxes of 1999–2019 estimated by upscaling eddy covariance data with a random forest . Scientific Data (2020) 7:313. [CrossRef]
Figure 6.
Atmospheric CO2 cumulative flux 1750 to 2020. (GTC) The figures in red represent the increase over the time period, underscore indicates 2020 values. The atmospheric flux out contains more CO2ff than the flux in because the atmospheric concentration of CO2ff is higher than the reservoir concentration, removing CO2ff from the atmosphere. Atmospheric CO2ff = 246 - 292 + 166 = 120 corresponding to 120/871 = 13.7% of the atmosphere (See Table 2).
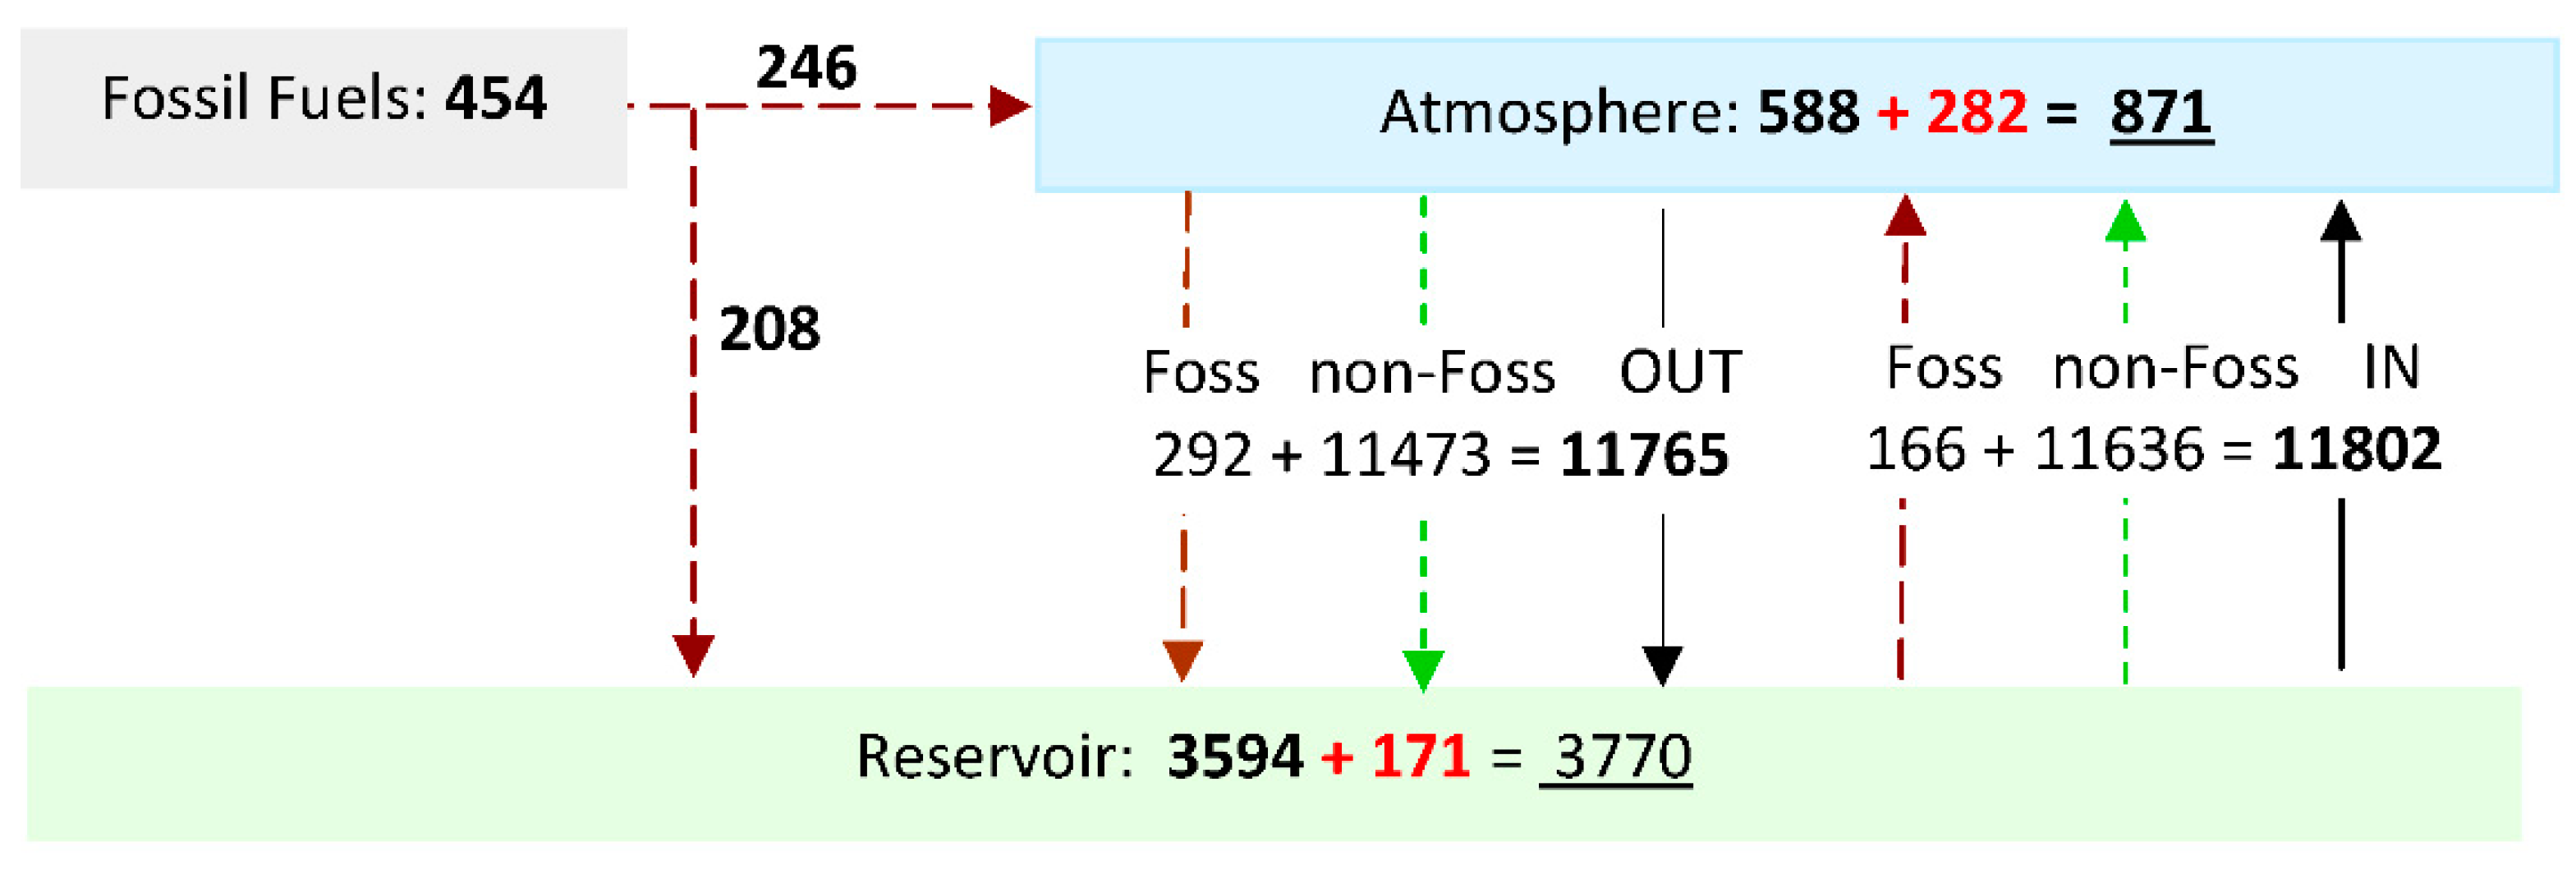

Table 1.
Solved 7 Parameter Values.
| Parameter | Symbol | Value | SD ± |
| Turnover Time = ACO2 /AOUT | T | 14.9 yr | 1.7 |
| Fossil-fuel Inflow Fraction | AF | 0.54 | 0.11 |
| Nuclear Bomb Yield* | Yb | 1.60 | 0.1 |
| Rel. Reserve Size | RCO2 | 6.1 | 1.4 |
| 14C Pre-industrial | Δ14Cinit | -3.0‰ | 10‰ |
| 13C Pre-industrial | δ13Cinit | -6.7‰ | 0.2‰ |
| 13C fossil fuel | δ13Cff | -20.8‰ | 4‰ |
Table 2.
Cumulative CO2 Flow and Storage.
| Duration | 1750 - | 2020 | 1850 - | 2020 | 1960 - | 2020 | ||
| GTC | % | GTC | % | GTC | % | |||
| CO2FF Supplied | ||||||||
| CO2FF delivered to Atmos. (AF) | 246 | 54 | 245 | 54 | 202 | 45 | ||
| CO2FF delivered to Rsvr. (1-AF) | 208 | 46 | 207 | 46 | 170 | 38 | ||
| CO2FF Total | 454 | 100 | 452 | 100 | 372 | 82 | ||
| CO2FF Destination | ||||||||
| CO2FF present in Atmos. | 120 | 26 | 120 | 26 | 99 | 26 | ||
| CO2FF present in Rsvr. | 333 | 74 | 333 | 74 | 273 | 72 | ||
| CO2FF Total | 454 | 100 | 452 | 100 | 382 | 100 | ||
| Atmospheric Growth | ||||||||
| Atmos. CO2 Growth due to CO2FF | 120 | 43 | 120 | 44 | 99 | 49 | ||
| Atmos. CO2 Growth due to non-Foss* | 162 | 57 | 152 | 56 | 104 | 51 | ||
| Atmospheric Growth Total | 282 | 100 | 272 | 100 | 204 | 100 | ||
| Reservoir Growth | ||||||||
| Reservoir Growth due to CO2FF | 333 | 333 | 273 | |||||
| Reservoir Growth due to non-Foss* | -158 | -143 | -97 | |||||
| Reservoir Growth Total | 171 | 185 | 171 | |||||
| Atmospheric Outflow | ||||||||
| Atmos Outflow CO2FF | 292 | 291 | 245 | |||||
| Atmos Outflow non-Foss | 11473 | 7459 | 2806 | |||||
| Atmospheric Outflow Total | 11765 | 7750 | 3051 | |||||
| Reservoir Outflow | ||||||||
| Reservoir Outflow CO2FF | 166 | 166 | 143 | |||||
| Reservoir Outflow non-Foss | 11636 | 7606 | 2907 | |||||
| Reservoir Outflow Total | 11802 | 7772 | 3050 | |||||
| CO2FF rel. to CO2 atmos. 2020† (%) | 120/876 | 13.7 | 120/876 | 13.7 | 99/876 | 11.3 | ||
| Average Annual Flux from Reservoir | 43.77 | 45.79 | 50.96 | |||||
| Average Annual Flux to Reservoir | 43.63 | 45.67 | 50.99 |
* Non-Foss means “not due to anthropogenic fossil fuel CO2 emissions”. † The CO2 atmospheric mixing ratio in 2020, was 412.44 ppm, 876 GTC. These values take into account the backflow of fossil fuel CO2 from reservoir to atmosphere. Year Intervals chosen to align with GCB Frieldingstein 2021 Table 8.
Data References
- Institute for Atmospheric and Climate Science (IAC), CO2 Mean Global AD0 to AD2014 ftp://data.iac.ethz.ch/CMIP6/input4MIPs/UoM/GHGConc/CMIP/yr/atmos/UoM-CMIP-1-1- 0/GHGConc/gr3-GMNHSH/v20160701/ mole_fraction_of_ carbon_dioxide_in_air_input 4MIPs_GHGConcentrations_CMIP_UoM-CMIP-1-1-0_gr3-GMNHSH_0000-2014.csv
- NOOAA GML. Accessed 04-March-2022. https://gml.noaa.gov/ccgg/trends/gl_data.html File: https://gml.noaa.gov/webdata/ccgg/trends/co2/co2_annmean_gl.txt
- Global Carbon Budget: National_Carbon_Emissions_2021v0.4.xlsx Historical Budget, Global Fossil Emissions Visited 04 March 2022.Friedlingstein et al (2021),
- World Data Service for Paleoclimatology, Boulder and NOAA Paleoclimatology Program, National Centers for Environmental Information (NCEI) https://www1.ncdc.noaa.gov/pub/data/paleo/icecore/antarctica/law/law2018d13c-co2.txt, https://doi.org/10.25919/5bfe29ff807fb
- UNSCEAR: United Nations Scientific Committee on the Effects of Atomic Radiation 2000 Report To The General Assembly. Volume I: Sources. Annex C: Exposures To The Public From Man-Made Sources Of Radiation 207 Sources And Effects Of Ionizing Radiation. . Table 4. Annual Fission And Fusion Yields.
- Calib: INTCAL20/SGCAL20. Stuiver, M. et al, 2022 CALIB 8.2 [WWW program] at http://calib.org, accessed 2022-3-4 Rev 8.1.0 intcal20.14c, shcal20.14c
Disclaimer/Publisher’s Note: The statements, opinions and data contained in all publications are solely those of the individual author(s) and contributor(s) and not of MDPI and/or the editor(s). MDPI and/or the editor(s) disclaim responsibility for any injury to people or property resulting from any ideas, methods, instructions or products referred to in the content. |
© 2023 by the authors. Licensee MDPI, Basel, Switzerland. This article is an open access article distributed under the terms and conditions of the Creative Commons Attribution (CC BY) license (http://creativecommons.org/licenses/by/4.0/).
Copyright: This open access article is published under a Creative Commons CC BY 4.0 license, which permit the free download, distribution, and reuse, provided that the author and preprint are cited in any reuse.


