Submitted:
07 September 2022
Posted:
07 September 2022
You are already at the latest version
Abstract
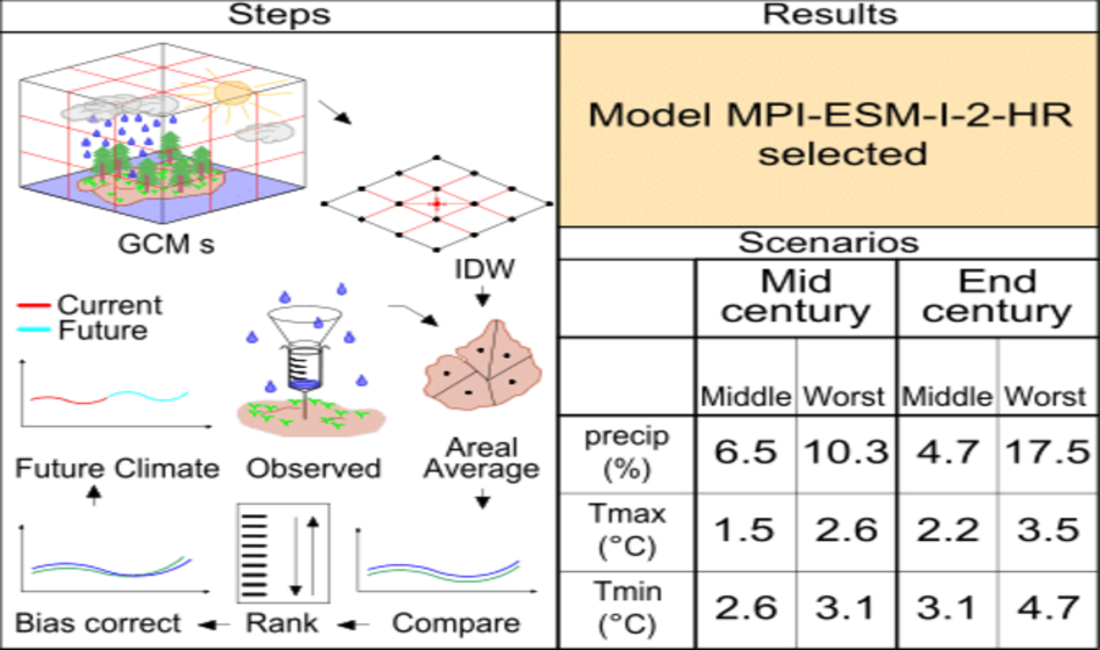
Climate change is a phenomenon that makes the climate system of a given region to be more unpredictable and increases the risk of water-related problems. GCMs under the new CMIP6 framework holds several climate models with many improvements as compared to past similar efforts. The improvements are mainly in the number of scenarios formulated, setup, parametrization, and resolution. In this study, 10 downscaled climate models from CMIP6 are evaluated by applying statistical and data mining tools and are ranked based on their capability to describe the historical observed series. The result of the analysis showed that the outputs of the MPI-ESM1-2-HR model have a good overall ranking among those 10 models. The output of this top-ranked model is used to understand future climate over UASB after properly bias-corrected using the QM method. Results of the bias correction step show that average annual precipitation has shown an increment of 6.5\% in the middle (SSP2-4.5) and 10.3\% in the worst (SSP5-8.5) case scenarios for the mid-century (2040 - 2069). Similarly, for the end of the century (2070 - 2099) an increment of 4.7\% and 17.5\% was predicted for the two scenarios respectively. Whereas average annual maximum temperature series showed an increment of 1.5 $\degree C$ for middle and 2.6 $\degree C$ for the worst case in the mid-century. At the same time, an increment of 2.2 $\degree C$ and 3.5 $\degree C$ were predicted for the end of the century similarly for those scenarios. Furthermore, it was predicted that the average annual minimum temperature series will have an increment of 2.6 $\degree C$ and 3.1 $\degree C$ for mid-century and 3.1 $\degree C$ and 4.7 $\degree C$ for the end century for the two scenarios respectively. An increase in precipitation with increased land degradation problems in the sub-basin increases the risk of flood events in the future.
Keywords:
GCMs
; PDF
; Trend Test
; IDW
; QM
; PCA
; DTW
; bias correction
; Ethiopia
; climate change
Copyright: This open access article is published under a Creative Commons CC BY 4.0 license, which permit the free download, distribution, and reuse, provided that the author and preprint are cited in any reuse.


