
Submitted:
06 July 2023
Posted:
07 July 2023
You are already at the latest version
Abstract
Uranium (U) is enriched in the waters of the southern Colorado Plateau, including waters of the Navajo Nation. The region has naturally occurring U in rocks and a history of U mining which may increase U concentrations in waters. Despite prior research into the concentration of U in the waters of the Navajo Nation, a framework has not been established to understand the variation of U in the region’s groundwater. To this end, we examined data from five studies to establish where and why U is likely to be enriched in waters of the southern Colorado Plateau. We show that U concentrations are related to the presence of U-rich rock bodies, surface elevation, and local aquifer salinity. Additionally, we show that the distance to the nearest mine is a significant predictor of U in water sources. Our work can act as a guide for local water withdrawal, regional water remediation and mitigation efforts, and provides a means for understanding the geographical patterns of U concentration in waters of the southern Colorado Plateau.
Keywords:
Uranium
; Groundwater
; Colorado Plateau
; Navajo Nation
; Chinle Formation
1. Introduction
Elevated uranium (U) concentrations in waters affect more more than 400 million people across Korea, India, Ireland, Germany, and the United States of America (Nania and Cozetto, 2014; Lapworth et al., 2021; Papageogiou et al., 2022), and the presence of U in water has been linked to increases in kidney and autoimmune disease prevalence (USDHHS 2013; Hund et al., 2015; Erdei et al., 2019; Rock et al., 2019; Hoover et al., 2020; Nozadi et al., 2022). The Colorado Plateau (USA) has waters that are enriched in U and this further complicates water access in a region where surface water is scarce (Hoover et al., 2017; Credo et al., 2019; Jones et al., 2020). Water scarcity is driven by an annual rainfall ranging 25 cm per year with drier areas receiving 13 cm per year (Schwinning et al., 2008), and is expected to decrease as a result of climate change (Udall and Overpeck, 2017). Despite prior work on elevated U concentrations in the region, a framework for understanding where and why U is likely to be enriched has not yet been established. Such a framework will help improve the well-being of people in the region.
The southern Colorado Plateau is the ancestral land of the Navajo (Diné) people and the current boundaries of the Navajo Nation are located entirely within the region (Figure 1A). Regional U mining began in the 1940s and continued through the 1980s in support of the efforts of the United States during the Cold War (Wenrich et al., 1989). The after-effects of U mining on environmental and public health have resulted in multiple remediation efforts by the US EPA. Currently, approximately 30 % of Diné people lack access to municipal water sources and rely on hauling water to meet their needs. However, water from these unregulated sources has been shown to have U concentrations above the World Health Organization and US EPA guidelines of 30 μg/L (US EPA, 2018).
U occurs naturally in rocks on Earth and tends to have concentrations of 2.8 ppm on average in upper crustal rocks (McLennan, 2001). U tends to dissolve when waters have high Eh and low pH, and is less soluble in waters with low Eh and intermediate pH (Goodwin, 1982). The tailings and materials from U mines are known to contribute to elevated U concentrations in waters through the oxidation of sulfides which decreases the pH (Hoover et al., 2017; Ingram et al., 2020). U also forms complexes with the bicarbonate anion that increase its mobility (Campbell and Ingram, 2014). The presence of organic matter can also influence U concentrations through the formation of strong complexes that can facilitate either U trapping or transport (Lakaniemi et al., 2019).
More than 1200 mining related features are located in the southern Colorado Plateau (O’Rear, 1966; US EPA, 2006). U mining in the region largely focused on the Shinarump Conglomerate Member of the Chinle Formation (Chinle Fm.), and the Salt Wash Member of Morrison Formation (Figure 1B) (Rosenzweig et al., 1954; Evensen, 1958; Sanford 1982). The Shinarump Member is the stratigraphically lowest portion of the Chinle Fm. and tends to be enriched in U compared to other units due to the presence of ancient weathered volcanic debris (Weeks and Garrels, 1959). As a whole, the rocks of the Chinle Fm. have a median U concentration of 300 ppm. (Johnson and Writ, 2009). U is generally present as uraninite, but other U-containing minerals are present (Haynes, 2000). U in the Morrison Formation (Morrison Fm.) is generally present as U3O8 and ore bodies in the formation can average about 2000 ppmm U (McLemore and Chenoweth, 1997). Prior research has shown that the U concentrations of some waters in the region are related to mine drainage (Hoover et al., 2017). However, a model incorporating both the contributions of rock units to U concentrations in groundwater and inputs from mining has not yet been attempted.
We gathered data from five published sources to better understand the factors determining the abundance of U in the groundwater of the southern Colorado Plateau. We hypothesized that U concentrations in groundwater should be correlated with regional drainage patterns and the presence of U rich rocks in the region. Additionally, we hypothesized that U mining in the region may influence the concentration of U in groundwater. The results from our work present a framework for understanding the geospatial concentrations of U in groundwater throughout the southern Colorado Plateau.
2. Geological Setting
The Colorado Plateau is bounded on its south, southeast, and southwest by the uplifted Mogollon Rim and in its east by the Southern Rockies (Figure 1A) (Elston and Young, 1991; Blakey, 2019). Internal regions of uplift in the plateau occur in the Chuska Mountains and in Black Mesa (Figure 1B). The major drainages in the basin are the San Juan River, the Colorado River, and the Little Colorado River (Cooley et al., 1969). Rain falling on the western side of the Chuska Mountains either flows north and into the San Juan River or flows south where it eventually enters the Little Colorado River. These regional uplifts and depressions drive the flow of groundwater across the southern Colorado Plateau, which generally follows the same patterns observed in surface water (Robson and Banta, 1995).
The Colorado Plateau is dominated by four major aquifers, the Coconino-De Chelly aquifer, the Mesaverde aquifer, the Uinta-Animas aquifer, and the Dakota-Glen Canyon aquifer. All four are present in the southern Colorado Plateau but the two most prominent are the Coconino-De Chelly aquifer, and the Dakota-Glen Canyon aquifer. In its southern portion, the Coconino-De Chelly aquifer experiences its highest elevations in the Chuska Mountains, and the groundwater in this portion flows south towards the little Colorado River, and discharges through springs in the walls of the Grand Canyon (Robson and Banta, 1995). This flow path roughly traces the elevation gradients in the region (Robson and Banta, 1995).
The salinity of the Coconino-De Chelly aquifer is lowest in region of the Chuska Mountains where it ranges from 0–3,000 total dissolved solids (TDS) mg/L to the region of discharge near the Grand Canyon (Robson and Banta, 1995). However, the highest concentrations of TDS occur in the southeastern portion of the aquifer where concentrations are greater than 25,000 mg/L. Robson and Banta (1995) suggest that the high mineralization of water in this portion of the aquifer may be due to the northwestern flow path of groundwater in this region, but the high TDS concentrations in this region could be related to a long residence time as has been seen in other systems (Lakey and Krothe, 1996; Edmunds and Smedley, 2000).
The Coconino-De Chelly aquifer is principally comprised of the De-Chelly Sandstone, and is the surface-most major aquifer in the southwest of Colorado Plateau (Figure 1B). In this region, the potentiometric surface of the aquifer is roughly equal to the elevation of the land surface (Robson and Banta, 1995). In some portions of the Coconino-De Chelly aquifer, the Chinle Fm., whose rocks have a median U concentration of 300 ppm., overlies the De Chelly Sandstone (Figure 1C) (Robson and Banta, 1995; Ludington et al., 2007). In other locations, the Moenkopi Formation overlies the De Chelly Sandstone. Neither the Chinle nor the Moenkopi typically yield much water, although the basal Shinarump Conglomerate of the Chinle Formation is more permeable than other members of these two units (Longsworth, 1994). In places where the colorful Chinle Fm. is not the surface-most unit, the shale-rich formation acts as a barrier between the more surficial waters of the Dakota-Glen Canyon aquifers and the Coconino-De Chelly aquifer (Ludington et al., 2007; Robson and Banta, 1995).
The Morrison Fm. is Jurassic in age and hydrogeologically comprises the Morrison aquifer, an isolated aquifer system within the Dakota-Glen Canyon aquifer system (Robson and Banta, 1995). Several members are recognized within the Morrison Fm., including the uraniferous Salt Wash Member (Rosenzweig et al., 1954; Robson and Banta, 1995). The Salt Wash Member is recognized by light-pink to buff colored sandstone with interbedded green and red mudstones (Rosenzweig et al., 1954; Ludington et al., 2007).
3. Methods
3.1. Data sources and extraction
We relied on five published data sets to perform the analyses in this study (Table 1). 211 measurements of U concentrations in regional groundwater were obtained from data published by Credo et al. (2019). Briefly, dissolved metals in regional waters — including U — were measured from unregulated water sources, namely springs, windmills, water storage tanks, and troughs, with multiple measurements from some locations. The detection limit for U in the samples was 0.047 μg/L. In locations that measured at or below the detection limit, the detection limit was used in the analysis. Credo et al. (2019) contains more information as to how these data were collected. Additionally, pH data collected from these samples has been published for the first time with this manuscript. The pH of samples collected from 2013–2014 was measured using a two step litmus test e.g., the first litmus paper delivered a range from 1–14, followed by a second litmus paper with a narrower range. The pH of samples collected after 2014 was measured with a portable pH meter (Thermo Scientific Orion 4 STAR).
Characteristics and data regarding the salinity of the Coconino-De Chelly aquifer were obtained from Robson and Banta (1995). These authors identified where the Coconino-De Chelly aquifer is the surface-most aquifer in the region. Their work also identifies regions of salinity in the Coconino-De Chelly aquifer that ranged in concentration from 0–1,000, 1–3,000, 3–25,000, and > 25,000 mg/L TDS. We extracted these regions from the published maps using the ‘countcolors’ package in R version 4.2.0 (Figure 2B) (R Core Team, 2022; Weller, 2019). The outlines of the identified collection of points were identified using the ‘concaveman’ package in R (Gombin et al., 2020), and transformed into polygons using the ‘sp’ package (Pebesma and Bivand, 2005). The digital boundary of the polygons generated for the salinity regions within the Coconino-De Chelly aquifer did not exactly correspond with published boundaries since the boundaries of the regions were marked in black and did not correspond to the target color in the image search. To account for the discrepancy, we adjusted the boundaries of the regions of interest by 3 km which approximately corresponded to the missing area.
Information about the locations where the Chinle and Morrison Fms. outcrop were obtained from the keyhole markup language (kml) versions of the geological maps of Arizona and Utah (Ludington et al., 2007). The boundaries of these formations were expanded by 1 km to account for potential imprecision in the plotted boundary of the formation.
Locations of abandoned U mines were obtained from the US EPA (2006). In all, we analyzed the influence of 1173 mining features in the region. Data published by the US EPA (2006) and Credo et al. (2019) did not contain elevation data for the abandoned mines and water sources. Elevations for the mines and water sources were obtained by converting the locations of water sources and mines into kml files and uploading them to GPS Visualizer (Schneider, 2019). Water sources located within the surficial boundaries of an aquifer or rock unit were identified using the ‘sp’ package, which determines if a point is located within an enclosed polygon (Pebesma and Bivand, 2005).
U concentrations in water sources could also be influenced by the heterogeneity of U concentrations in the rocks. Heterogeneity of U in the rocks themselves could cause water sources that are downstream from mines to have enriched U concentrations not due to mining, but due to naturally enriched U concentrations. To address this, we used aeromagnetic survey data to provide proxy information on the U concentrations at the surface (Hill et al., 2009). Spacing of the aeoromagnetic survey flights in the region was approximately 5 km. Apparent U concentration at a location was recorded in parts per million and tracked as bismuth 214, which is part of the 238U decay chain (Hill et al., 2009). The lowest reported apparent U concentration in this dataset is 0.1 ppm, which we have taken to be the detection limit for this technique. Interpolation through kriging using the ‘gstat’ package in R was used to predict the apparent U concentration at the locations of mines since their locations did not precisely coincide with the measured locations of the aeromagnetic surveys (Pebesma, 2004). We limited the analysis of mines and water sources to those in Arizona when analyzing the apparent U concentrations at mines and across the study region since most of the U concentrations in waters in the study came from Arizona. This resulted in a dataset of 350,893 aeromagnetic observations.
3.2. Statistical Analyses
The U concentrations in the water sources on the Navajo Nation exhibited a left-skewed distribution and were log-transformed to better approximate a normal distribution for further analysis. Differences in the U concentrations in water sources in different regions of the Coconino-De Chelly aquifer were assessed using a Kruskal-Wallis rank-sum test followed by a Dunnett’s Multiple Comparison test. The relationship between U concentrations and elevation was assessed through linear regression.
Differences between U concentration in waters where the Chinle or Morrison Fm. outcrop and waters from locations where these formations do not outcrop were assessed using Wilcoxon signed-rank tests. Since it was possible that the presence of samples in the Chinle or Morrison Fm. may have influenced the U concentration in regions where one of the formations does not outcrop, waters from locations where the Chinle or Morrison Fm. outcrops were compared against regions where neither formation outcrops.
The influence of mining on U concentrations in water sources was assessed in a variety of ways. We calculated the median distance to the nearest mine in all directions, and in the upstream direction from 1, 5, 10, 20, 40, and 80 mines. Additionally, we analyzed the number of mines in any direction as well as upstream, as well as the presence of a mine in any direction and upstream from a water source over scales from 1 to 5 km. All of these measures showed significant relationships with the U concentrations in water sources. Since all measures were significant, we selected the distance to the nearest mine upstream from a water source for use in subsequent analyses to assess the influence of mines on U in waters since it was the strongest predictor of U in water sources ([U] = 10^(−0.020⋅d + 0.74), R2 = 0.22, p = 1.1⋅10−12). The location of mining features in the US EPA dataset exhibits errors of approximately 200 – 300 m (US EPA, 2006), however this imprecision is relatively small compared to the magnitude of this measure, which had a maximum range of 83 km and 5 only water sources were located less than 500 m to a mine.
Some of the factors that may influence the U concentration in groundwater are likely correlated. For instance, elevation and the presence of a mine upstream from a well are inherently related because an elevation difference is necessary for the analysis. Additionally, a sample may also exhibit high U concentrations because it was downstream from a mine, but may have simultaneously been located in a U-rich rock formation. To begin understanding the causes between elevated U concentrations and the presence of U-rich rocks in the region, analyses were undertaken where water sources located within the Chinle Fm. were analyzed separately from water sources that were not.
Multiple linear regression models were used predict U concentrations in water sources across the region and assess colinearities in the predictors of U concentrations. Multiple linear regression models were built using a publicly available online application developed by Rush University Medical Center for reproducible and automated regression analyses (https://regression-workbench.herokuapp.com/). Statistically unimportant features were automatically removed via recursive feature elimination with cross-validation, a machine-learning methodology for identifying the most important features in a statistical model. Predictors used in the multiple linear regression models included the salinity region of Coconino aquifer where a well was located; the elevation of a point; the pH of the sample, whether a well was located in either the Morrison Fm. or the Chinle Fm.; and the distance to the nearest mine upstream of the water source. Additionally, multiple linear regression models were constructed to predict U concentrations for water sources within the Chinle Fm. using the salinity region of Coconino aquifer, elevation, pH, and the distance to the nearest mine upstream of the water source.
3.3. Data Availability
All project code and files unique to this manuscript are hosted on GitHub and can be found at (https://github.com/websterkgd/USouthernColoradoPlateau).
4. Results
U concentration in groundwater of the southern Colorado Plateau exhibited geographical trends (Figure 3), and eight percent of the samples contained U concentrations above the EPA’s guideline of 30 μg/L. The U concentration in groundwater was related to the TDS in the region where the Coconino-De Chelly aquifer is the surface most aquifer (Kruskal-Wallis rank sum test: df = 2, χ2 = 15.9; p = 3⋅10-4) (Figure 3A). The U concentration was not significantly different between regions where TDS ranges from 0 – 1,000 mg/L and 1,000 – 3,000 mg/L, but was higher in regions where TDS ranges from 3,000 – 25,000 mg/L (Table 2). Additionally, the elevation (z) of groundwater sampling sites explained 11 % of the variation in U concentrations in the region, with lower elevations tending to have higher U concentrations than higher elevations ([U] = 10^(-0.0013⋅z + 2.59), R2 = 0.11, p = 5⋅10-7) (Figure 3B). The pattern related to elevation was also recovered when the points at the detection limit were removed ([U] = 10^(-0.0009⋅z + 2.15), R2 = 0.09, p = 4⋅10-5). However, the U concentration in groundwater of the Navajo Nation was not higher in regions where the Coconino-De Chelly aquifer is the surface-most aquifer compared to other regions (median [U]Coconino-De Chelly = 3.48 μg/L, n = 39; median [U]other = 2.43 μg/L, n = 172; Wilcoxon Rank Sum Test: W = 3666, p = 0.36).
Figure 3: A) Boxplots showing the relationship between U concentrations in groundwater and Total Dissolved Solids region in the Coconino-De Chelly aquifer. The asterisk indicates that significantly higher U concentrations were observed in regions of the Coconino-De Chelly aquifer where TDS ranges from 3,000 – 25,000 mg/L. B) U concentrations in groundwater plotted against elevation. C) Boxplots showing the relationship between U concentrations in groundwater and whether a water source is located in a location where the Chinle Formation outcrops. The asterisk indicates that significantly higher U concentrations were observed in regions where the Chinle Formation outcrops. D) Boxplots showing the relationship between U concentrations in groundwater and whether a water source is located in a location where the Morrison Formation outcrops. Boxplots follow the format of the lower quartile, median, and upper quartile. Whiskers extend either to the maximum, minimum, or 1.5 times the interquartile range of the data. Note that U concentrations are always expressed on a log10 axis. The US EPA guideline of 30 μg/L is plotted on all figures.
U concentration in waters across the southern Colorado Plateau was influenced by the presence of rock formations. Sampling locations in areas where the Chinle Fm. outcrops exhibited higher U concentrations (median [U]Chinle = 6.54 μg/L, n = 49) than locations where the Chinle and Morrison Fms. are not present (median [U]no Chinle/Morrisonn = 2.26 μg/L, n = 147; Wilcoxon Rank Sum Test: W = 2521, p = 0.002) (Figure 3C). In contrast, U concentrations in areas where the Morrison Fm. outcrops were not statistically different (median [U]Morrison = 1.23 μg/L, n = 15) from locations where the Chinle and Morrison Fms. are not present (Wilcoxon Rank Sum Test: W = 1032, p = 0.69) (Figure 3D).
Average U concentrations in waters were influenced by the presence of mines. The strongest predictor of increased U concentrations in a water source across the whole dataset was distance to the nearest mine upstream ([U] = 10^(−0.020⋅d + 0.74), R2 = 0.22, p = 1.1⋅10−12) (Figure 4). For comparison, the nearest distance to any mine was only able to account for 14 % of the variation in the U concentrations ([U] = 10^(−0.030⋅d + 0.70), R2 = 0.14, p = 2.4⋅10−8). However, the median distance to the nearest five mines in any direction from a water source was able to account for 19 % of the variation in the U concentration ([U] = 10^(−0.031⋅d + 0.85), R2 = 0.19, p = 1.5⋅10−11).
Within the Chinle Fm., the elevation of sites accounted for 32% of the variation of U concentration in the water source ([U] = 10^(-0.0014⋅z + 3.04), R2 = 0.32; p = 2⋅10-5) (Figure 5A). Additionally the distance to the nearest mine in regions located where the Chinle Fm. outcrops significantly influenced the U concentration of the water source ([U] = 10^(−0.035⋅d + 1.14), R2 = 0.21, p = 0.001) (Figure 5B). In contrast, elevation only explained 3 % of the U concentration in a water source in locations outside of the Chinle Fm. ([U] = 10^(-0.0009⋅z + 1.92, R2 = 0.03; p = 0.008) (Figure 5C). Additionally, the U concentration in waters where the Chinle Fm. did not outcrop increased as the distance to the nearest mine decreased ([U] = 10^(−0.025⋅d + 0.56), R2 = 0.11, p = 1.5⋅10−5) (Figure 5D).
Multiple linear regression models exhibited varying degrees of explanatory power in explaining the U concentration in water sources, although all were statistically significant (p < 0.05). A model of U concentration vs. elevation; the distance to the nearest mine upstream; the salinity of the Coconino De-Chelly Aquifer; and the presence of the Chinle Fm. was able explain 30 % of the variance in U concentrations and each of the individual predictors was also significant ([U] = 10^(−7⋅10−4⋅z + 0.26⋅Chinle + 0.17⋅TDS + −0.016⋅d + 1.7), R2 = 0.30, p = 9⋅10−14). The multiple regression model examining water sources within the Chinle Fm. was able to explain 42 % of the variance in U concentration; pH was not a significant predictor of U concentrations and was dropped from the model while elevation, salinity, and the distance to the nearest mine upstream were all significant ([U] = 10^(−1.2⋅10−4⋅z + 0.26⋅TDS + −0.026⋅d + 2.8), R2 = 0.42, p = 7⋅10−5).
The data from aeromagnetic surveys showed that the Chinle Fm. exhibited higher apparent U than areas outside of the Chinle Fm. within the study region (median [Ua]Chinle = 2.5 ppm, n = 82959; median [Ua]No Chinle = 2.1 ppm, n = 267934; Wilcoxon Rank Sum Test: W = 1.2⋅1010, p < 2.2⋅10-16). Mines from the Chinle Fm. showed higher apparent U than areas that were not associated with the Chinle Fm. (median [Ua]mines Chinle = 3.2 ppm, n = 263; Wilcoxon Rank Sum Test: W = 4⋅107, p < 2.2⋅10-16). Additionally, mines located outside of the Chinle Fm. exhibited higher apparent U concentrations than the study region as a whole (median [Ua]mines outside Chinle = 2.7 ppm, n = 362; median [Ua]Study Region = 2.2 ppm, n = 350893; Wilcoxon Rank Sum Test: W = 8⋅108, p < 2.2⋅10-16). Additionally, mines located in the Chinle Fm., showed higher apparent U concentrations than those located outside of the Chinle Fm. (Wilcoxon Rank Sum Test: W = 59020, p = 3.0⋅10-7).
5. Discussion
5.1. A regional context for U in groundwater of the southern Colorado Plateau
Concentrations of U in waters of the southern Colorado Plateau are related to the elevation of the land surface, the presence of U-rich rocks in the region, the distance to the nearest mine, and the salinity of the Coconino-De Chelly aquifer. These patterns are consistent with a model whereby U increases in groundwater as groundwater spends more time in contact with a U-rich source and additional inputs of U to regional waters from mining. Similar models have been used to predict the contaminant load of waters in other systems (Jasechko et al., 2017; Frei et al., 2020; Vautier et al., 2021).
5.2. U concentrations in waters and U-rich rocks
Our results show that uranium tends to be elevated in water sources that are located in regions where the Chinle Fm. outcrops (Figure 3C). Additionally, elevation is a strong predictor of U concentration in water sources that are in regions where the Chinle Fm. outcrops (Figure 5A). The relationship between U concentration, elevation, and location within the Chinle Fm. appears to drive the overall relationship between U concentrations and elevation since elevation was a poor predictor of U concentration if a water source is not located in the Chinle formation (Figure 3B, Figure 5C).
As water flows in an aquifer it accumulates more solids the longer water has spent in the aquifer (Robson and Banta, 1995; Gaillardet et al., 1999; Raymond, 2017). In the upstream portions of the Chinle Fm. and Coconino-De Chelly aquifer, water has low amounts of dissolved U and other solids, but downstream portions tend to contain more U and other solids (Figure 3A). Indeed, both elevation and the salinity of the Coconino-de Chelly Aquifer were important predictors of U concentration in the sampled waters. This finding suggests that elevation and salinity are behaving as proxies for the amount of time water has spent in the aquifer.
The patterns of U in groundwater across the southern Colorado Plateau exhibit globally observed trends in U enrichment in waters and provide context for regional observations. Positive correlations have been observed between U concentrations and salinity in systems in India and Ireland (Nizam et al., 2022; Papageorgiou et al., 2022). Regional work has shown that U concentrations increased in soil effluent from the Chinle region as the soils were exposed to water over longer periods — demonstrating the mobility of U in areas where the Chinle Fm. outcrops (Webber et al., 2021). Our results showing increases in U concentrations with increases salinity match these global and local trends.
In contrast to water sources in the Chinle Fm., water sources within the Morrison Fm. did not show increases in U concentration compared to the broader region (Figure 3D). Our observation that groundwaters associated with the Morrison Fm. are not enriched in U agrees with other work yielding similar observations from outcrops of the Morrison Fm. in Colorado where the Salt Wash Member of the Morrison Fm. is in contact with groundwater (Phoenix, 1959). Low U concentrations in the waters of the Morrison Fm. were attributed to the Eh and pH of groundwater that inhibited the dissolution of U. Additionally, outcrops of the Morrison Fm. are limited in extent in the study region and this may limit the amount of time water spends interacting with these units.
Limitations of our study are reflective of the available data. First, the depth to the groundwater table in the water sources used in this study is unknown, and it is remarkable that surface elevation is able to serve as a proxy for U concentrations considering potential variations in stratigraphy that may be confounding. Water sources in the region are thought to be sourced by shallow groundwater (Jones et al., 2020). Our observations that U concentrations tend to be higher in water sources that are located where the Chinle Fm. outcrops support this idea. The depth to the water table of each well in the study area potentially contributes to the variation in U concentration in the sampled waters. Additionally, the lack of data on the depth to the water table may mean that water may not necessarily be coming from the Coconino-De Chelly aquifer, but the salinity of this aquifer is still predictive of U in the water sources. This represents an important tool for understanding how risky a water source is for local people.
Velocity of groundwater flow is another potential source of variation in the data. The velocity of groundwater — especially shallow groundwater — may vary with the inputs to the system over time. Potentially illustrating this variation is that the U concentrations from two springs located near each other show yearly differences (Ingram et al., 2020). This suggests the total amount of water moving through the system in a given year may influence U concentrations, since the velocity of ground water flow influences concentration of dissolved materials in it (Lakey and Krothe, 1996). Samples used in our study were collected over a period of years, and flow variability as well as variations in aquifer residence time represent sources of variation that we did not control for in our analysis.
5.3. U concentrations in waters and mines
U concentrations in the water sources were higher as the distance to the nearest mine upstream from a water source decreased (Figure 4). This result agrees with a study that found elevated U concentrations within 6 km from an abandoned mine (Hoover et al., 2017). This pattern was also present within the Chinle Formation (Figure 5B), and if the sampled water source was located outside of the Chinle (Figure 5D). This finding suggests that material mobilized from the mining process is entering waters more readily than in areas where mines are not present. The ratio of 234U/238U of waters in the region where the Chinle Fm. outcrops may help determine the influence of a mine by assessing how long water from a water source has been in the aquifer and may help determine its source (Zielinski et al., 1997; Johnson and Writ, 2009; Campbell and Ingram, 2014; Blake et al., 2019).
The increased U concentration in water sources downstream from a mine in locations where the Chinle Fm. does not outcrop yields itself to a few explanations. First, tailings or material from a mine may enter water from these locations. It is known that such materials influence U concentrations in waters (Winde, 2010; Hoover et al., 2017). However, U concentrations from mining sites outside of the Chinle Fm. were also elevated compared to the surrounding regions. The increased U concentrations in these areas may be related to variations water or sediment chemistry that increase U concentrations in waters, but could also be elevated because human disturbance has exposed or covered the ground surface with U-rich material thereby increasing the measurements.
5.4. Implications for well placement and remediation
Our findings have implications for the ongoing remediation and mitigation of U in groundwater in the region. If possible, new water sources should not be installed in areas that are downstream from mines or located within the Chinle Fm. Further, residents should be taught to recognize the locations where the Chinle Fm. outcrops and to avoid using water from such locations, if possible. Additionally, remediation and or mitigation efforts of U in water sources should first be targeted to water sources in downstream regions where the Chinle Fm. outcrops since it is likely to be found at greater concentrations in these areas.
6. Conclusions
U concentrations in waters of the southern Colorado Plateau are related to elevation, locations where the Chinle Fm. outcrops, the distance to the nearest mine upstream from a water sources, and the salinity of the Coconino-De Chelly aquifer. These relationships can be explained by the regional flow paths of groundwater, and additional interactions with U-rich material from mines. This work provides insight into elevated U concentrations in groundwater of the southwestern Colorado Plateau and begins the work of parsing natural contributions to increased U concentrations in the region versus those from mining. Our findings provide a basis for public education programs and for helping understand which unregulated water sources are more likely to have elevated U concentrations.
Several directions for future work exist. First, broad hydrochemical and geochemical characterization of the waters in the region are needed. This will allow for detailed geochemical modeling to understand the control of mineral saturation on observed water U concentrations. Future studies should assess the depth to the water table and more closely monitor the U concentrations in water sources over time to better understand possible temporal fluctuations in elements of concern. Future studies may also evaluate the evolution of U along particular flow paths to better understand how much additional U is present in local waters as a result of mining. Regional assessments of U may analyze the stable isotopic concentration of U in water sources to better understand the flow paths and how much time water has spent in the aquifer.
Acknowledgments
Funding for this work was provided by the NSF TCUP TEA-Center Grant [2054903] to K.D.W., and by the National Institute of Environmental Health Sciences, Grant [P50 ES026089] to J.C.I. K.D.W. thanks F.T. Boyd for discussions that led to the development of this project; J.T. Lennon for an introduction to geospatial data analysis using R; the Delafield Public Library; P. Lindright; and L. Kallas. Finally K.D.W. thanks three anonymous reviewers for greatly improving the quality of this manuscript.
Competing Interests
The authors declare no competing interests.
References
- Blake, J.M., Harte, P., Becher, K., 2019. Differentiating anthropogenic and natural sources of uranium by geochemical fingerprinting of groundwater at the Homestake uranium mill, Milan, New Mexico USA. Environmental Earth Sciences 78, 384. [CrossRef]
- Blakey, R.C., 2019. Chapter 7: Pennsylvanian-Jurassic sedimentary basins of the Colorado Plateau and Southern Rocky Mountains, in Miall, A.D., (Ed.), The Sedimentary Basins of the United States and Canada. Elsevier 315-367. [CrossRef]
- Campbell, N.R., Ingram, J.C., 2014. 4 - Characterization of 234U/238U activity ratios and potential inorganic uranium complexation species in unregulated water sources in the southwest region of the Navajo Reservation. In Ahuja, S. (Ed). Water Reclamation and Sustainability. Elsevier 77-94.
- Cooley, M.E., Harshbarger, J.W., Akers, J.P., Hardt, W.F., 1969. Regional hydrogeology of the Navajo and Hopi Indian Reservations, Arizona, New Mexico, and Utah. United States Geological Survey Professional Paper 521-A. https://pubs.usgs.gov/pp/0521a/report.pdf.
- Credo, J., Torkelson, J., Rock, T., Ingram, J.C., 2019. Quantification of elemental contaminants in unregulated water across Western Navajo Nation. International Journal of Environmental Research and Public Health 16, 2727. [CrossRef]
- Edmunds, W.M., Smedley, P.L., 2000. Residence time indicators in groundwater: the East Midlands Triassic sandstone aquifer. Applied Geochemistry 15, 737-752. [CrossRef]
- Elston, D.P., Young, R.A., 1991. Cretacous-Eocene (Laramide) landscape development and Oligocene-Pliocene drainage of transition zone and Colorado Plateau, Arizona. Journal of Geophysical Research 96 (B7), 12389-12406. [CrossRef]
- Evensen, G.G., 1958. The Shinarump Member of the Chinle Formation, in Anderson, R.Y., Harshbarger, J.W. (Eds.), Black Mesa Basin (Norteastern Arizona). New Mexico Geological Society 9th Annual Fall Field Conferece Guidebook, p. 95 – 97.
- Erdei, E., Shuey, C., Pacheco, B., Cajero, M., Lewis, J., Rubin, R.I., 2019. Elevated autoimmunity in residents living near abandoned uranium mine sites on the Navajo Nation. Journal of Autoimmunity 99, 15-23. [CrossRef]
- Frei, R.J., Abbott, B.W., Dupas, R., Gu, S., Gruau, G., Thomas, Z., Kolbe, T., Aquilina, L., Labasque, T., Laverman, A., Fovet, O., Moatar, F., Pinay, G., 2020. Predicting nutrient incontinence in the Anthropocene at watershed scales. Frontiers in Environmental Science 7, 200. [CrossRef]
- Gaillardet, J., Dupré, B., Allègre, C.J., 1999. Geochemistry of large river suspended sediments: silicate weathering or recycling tracer? Geochimica et Cosmochimica Acta 63 (23-24), 4037-4051. [CrossRef]
- Goodwin, B. 1982. Calculated uranium solubility in groundwater: implications for nuclear fuel waste disposal. Canadian Journal of Chemistry 60, 1759-1766. [CrossRef]
- Gombin, J., Vaidyanathan, R., Agafonkin, V., 2020. _concaveman: A Very Fast 2D Concave Hull Algorithm_. https://CRAN.R-project.org/package=concaveman.
- Haynes, P.E., 2000. Mineralogy of the Jomac Mine San Juan County, Utah. Rocks & Minerals 75 (4), 240-248. [CrossRef]
- Hill, P.L., Kucks, R.P., Ravat, D., 2019. Aeromagnetic and aeroradiometric data for the conterminous United States and Alaska from the National Uranium Resource Evaluation (NURE) Program of the U.S. Department of Energy. United States Geological Survey Open-File Report 2009-1129.
- Hoover, J., Gonzales, M., Shuey, C., Barney, Y., Lewis, J., 2017. Elevated arsenic and uranium concentrations in unregulated water sources on the Navajo Nation, USA. Exposure and Health 9, 113-124. [CrossRef]
- Hoover, J.H., Coker, E., Barney, Y., Shuey, C., Lewis, J., 2018. Spatial clustering of metal and metalloid mixtures in unregulated water sources on the Navajo Nation – Arizona, New Mexico, and Utah, USA. Science of the Total Environment 633, 1667-1678. [CrossRef]
- Hoover, J.H., Erdei, E., Begay, D., Gonzales, M., NBCS Study Team, Jarrett, J.M., Cheng, P.Y., Lewis, J., 2020. Exposure to uranium and co-occurring metals among pregnant Navajo women. Environ Res. 190 (109943). [CrossRef]
- Hund, L., Bedrick, E.J., Miller, C., Huerta, G., Nez, T., Ramone, S., Shuey, C., Cajero, M., Lewis, J., 2015. A Bayesian framework for estimating disease risk due to exposure to uranium mine and mill waste on the Navajo Nation. Royal Statistical Society 178 (4), 1069-1091. [CrossRef]
- Ingram, J.C., Jones, L., Credo, J., Rock, T., 2020. Uranium and arsenic unregulated water issues on Navajo lands. Journal of Vacuum Science and Technology A 38. 031003. [CrossRef]
- Jasechko, S., Perrone, D., Befus, K.M., Bayani Cardenas, M., Ferguson, G., Gleeson, T., Luijendijk, E., McDonnell, J.J., Taylor, R.G., Wada, Y., Kirchner, J.W., 2017. Global aquifers dominated by fossil groundwaters but wells vulnerable to modern contamination. Nature Geoscience 10, 425–429. [CrossRef]
- Johnson, R.H., Writ, L., 2009. Geochemical analyses of rock, sediment, and water from the region in and around the Tuba City Landfill, Tuba City, Arizona. U.S. Geological Survey Open-File Report 2009-1020.
- Jones, L., Credo, J., Parnell, R., Ingram, J.C., 2020. Dissolved uranium and arsenic in unregulated groundwater sources – Western Navajo Nation. Journal of Contemporary Water Research and Education 169, 27-43.
- Lakaniemi, A.M., Douglas, G.B. and Kaksonen, A.H. (2019). Engineering and kinetic aspects of bacterial uranium reduction for the remediation of uranium contaminated environments. Journal of Hazardous Material 371, 198-212. [CrossRef]
- Lakey, B., Krothe, N.C., 1996. Stable isotopic variation of storm discharge from a perennial karst spring, Indiana. Water Resources Research 32 (3), 721-731.
- Lapworth, D.J., Brauns, B., Chattopadhyay, S., Gooddy, D.C., Loveless, S.E., MacDonald, A.M., McKenzie, A.A., Muddu, S., Nara, S.N. 2021. Elevated uranium in drinking water sources in basement aquifers of southern India. Applied Geochemistry 133, 105092. [CrossRef]
- Lister, A., Froyum, J,. Credo, J., Ingram, J.C., 2021. Determination of uranium in sheep hearts from the Navajo Nation. Journal of Veterinary Medicine and Animal Science 4 (1), 1055.
- Longsworth, S.A., 1994. Geohydrology and water chemistry of abandoned uranium mines and radiochemistry of spoil-material leachate, Monument Valley and Cameron areas, Arizona and Utah. US Geological Survey, Water Resources Investigations Report, 93-4226.
- Ludington, S., Moring, B. C., Miller, R. J., Stone, P. A., Bookstrom, A. A., Bedford, D. R., Evans, J. G., Haxel, G. A., Nutt, C. J., Flyn, K. S., Hopkins, M. J., 2007. Preliminary integrated geologic map databases for the United States Western States: California, Nevada, Arizona, Washington, Oregon, Idaho, and Utah. Version 1.3 USGS Open File Report 2005-1305.
- McLemore, V.T., Chenoweth, W.L., 1997. Geology and uranium-vanadium deposits in the Salt Wash Member, Morrison Formation, King Tutt Mesa area, San Juan County, New Mexico. in Anderson, O., Kues, B., Lucas, S., (Eds.), Mesozoic Geology and Paleontology of the Four Corners Area. New Mexico Geological Society 48th Annual Fall Field Conference Guidebook, 288 p. [CrossRef]
- McLennan, S.M., 2001. Relationships between the trace element composition of sedimentary rocks and upper continental crust. Geochemistry, Geophysics, Geosystems 2, 2000GC000109. [CrossRef]
- Nania, J., Cozzetto, K., 2014. Chapter 12 – Energy. In Considerations for Climate Change and Variability Adaptation on the Navajo Nation. Eds. J. Nania and K. Cozzetto. University of Colorado, Boulder, CO.
- Nizam, S., Dutta, S., Sen, I.S., 2022. Geogenic controls on the high levels of uranium in alluvial aquifers of the Ganga Basin. Applied Geochemistry 143, 105374. https://doi.org/10.1016/j.apgeochem.2022.105374. [CrossRef]
- Nozadi, S.S., Li, L., Luo, L., MacKenzie, D., Erdei, E., Du, R., Roman, C.W., Hoover, J., O’Donald, E., Burnette, C., Lewis, J., 2022. Prenatal metal exposures and infants’ developmental outcomes in a Navajo population. International Journal of Environmental Research and Public Health 19 (45). [CrossRef]
- O’Rear, W.B., 1966. Summary and chronology of the domestic uranium program: U.S. Atomic Energy Commission. Technical Memorandum TM-182, p. 50.
- Papageorgiou, F., McDermott, F., Van Acken, D., 2022. Uranium in groundwaters: Insights from the Leinster granite, SE Ireland. Applied Geochemistry 139, 105236. [CrossRef]
- Pebesma, E.J., 2004. Multivariable geostatistics in S: the gstat package. Computers and Geosciences 30, 683-691. [CrossRef]
- Pebesma, E.J., Bivand, R.S., 2005. Classes and methods for spatial data in R. R News 5 (2), https://cran.r-project.org/doc/Rnews/.
- Phoenix, D., 1959. Part 4. Occurrence and chemical character of groundwater in the Morrison Formation. In (R.M. Garrels and E.S. Larsen 3d, Ed.) Geochemistry and Mineralogy of the Colorado Plateau Uranium Ores. United States Geological Survey Professional Paper 320.
- R Core Team, 2022. R: A Language and Environment for Statistical Computing. Vienna, Austria. https://www.R-project.org/.
- Raymond, P.A., 2017. Temperature vs. hydrologic controls of chemical weathering fluxes from United States forests. Chemical Geology 458, 1-13. [CrossRef]
- Robson, S.G., and E.R. Banta. 1995. Ground Water Atlas of the United States, Arizona, Colorado, New Mexico, Utah. U.S. Geological Survey. HA 730-C.
- Rock, T., Camplain, R., Teufel-Shone, N.I., Ingram, J.C., 2019. Traditional sheep consumption by Navajo People in Cameron, Arizona. International Journal of Environmental Research and Public Health 16, 4195. [CrossRef]
- Rosenzweig, A., Gruner, J.W., Gardiner, L., 1954. Widespread occurrence and character of uranite in the Triassic and Jurassic sediments of the Colorado Plateau. Economic Geology 49, 351-361.
- Sanford, R.F., 1982. Preliminary model of regional Mesozoic groundwater flow and uranium deposition in the Colorado Plateau. Geology 10, 348-352.
- Schneider, A. 2019. GPS Visualizer. https://www.gpsvisualizer.com/elevation.
- Schwinning, S., Belnap, J., Bowling, D.R., Ehleringer, J.R., 2008. Sensitivity of the Colorado Plateau to change: Climate, ecosystems, and society. Ecology and Society 13 (2), 28. http://www.ecologyandsociety.org/vol13/iss2/art28/.
- Udall, B., Overpeck, J., 2017. The twenty-first century Colorado River hot drought and implications for the future. Water Resources Research 53 (3), 2404-2418. [CrossRef]
- United States Department of Health and Human Services (USDHHS), 2013. Toxicological profile for Uranium. Agency for Toxic Substances and Disease Registry: Atlanta, GA, USA, 2013.
- United States Environmental Protection Agency, 2006. Uranium Location and Database Compilation. Office of Radiation & Indoor Air Radiation Protection Division (6608J). Washington, DC, USA.
- United States Environmental Protection Agency, 2018. National Primary Drinking Water Regulations. United States Environmental Protection Agency: Washington, DC, USA.
- Vautier, C., Kolbe, T., Babey, T., Marçais, J., Abbott, B.W., Laverman, A.M., Thomas, Z., Aquilina, L., Pinay, G., de Dreuzy, J.-R., 2021. What do we need to predict groundwater nitrate recovery trajectories? Science of the Total Environment 788, 147661. [CrossRef]
- Webber, Z.R., Webber, K.G.I., Rock, T., St. Clair, I., Thompson, C., Groenwald, S., Aanderud, Z., Carling, G.T., Frei, R.J., Abbott, B.W., 2021. Diné citizen science: Phytoremediation of uranium and arsenic in the Navajo Nation. Science of the Total Environment 794, 148665. [CrossRef]
- Weeks, A.D., Garrels, R.M., 1959. Part 1. Geologic setting of the Colorado Plateau ores. In (R.M. Garrels and E.S. Larsen 3d, Ed.) Geochemistry and Mineralogy of the Colorado Plateau Uranium Ores. United States Geological Survey Professional Paper 320.
- Weller, H., 2019. countcolors: Locates and Counts Pixels Within Color Range(s) in Images. https://CRAN.R-project.org/package=countcolors.
- Wenrich, K.J., Chenoweth, W.L., Finch, W.E., Scarbourough, R.B., 1989. Uranium in Arizona in geological evolution of Arizona, in Jenny, J.P., Reynold, S.J. (Eds.), Arizona Geological Society Digest 17, pp. 259-794.
- Winde, D., 2010. Uranium pollution of the Wonderfonteinspruit, 1997-2008 part 1: Uranium toxicity, regional background and mining-related sources of uranium pollution. Water SA 36 (3), 239-256.
- Zielinski, R.A., Chafin, D.T., Banta, E.R., Szabo, B.J., 1997. Use of 234U and 238U isotopes to evaluate contamination of near-surface groundwater with uranium-mill effluent: a case study in south-central Colorado, U.S.A. Environ Geol 32 (21), 124-136.
Figure 1.
A) The location of the Colorado Plateau shaded in gray within the mountain-west region of the United States. Note the presence of the Navajo Nation and Hopi Reservation (blue) within the Colorado Plateau. B) The location of the study area showing the presence of the Chinle Formation (blue), Morrison Formation (red), and the area where the Coconino-De Chelly aquifer is the surface-most aquifer (gray). Colorado Plateau boundaries are drawn from observation. Navajo Nation outline from the Utah Indian Curriculum Project. C) An exaggerated elevation profile with a geological cross section. Satellite imagery from Google Earth. Geological formation data from Ludington et al. (2007).
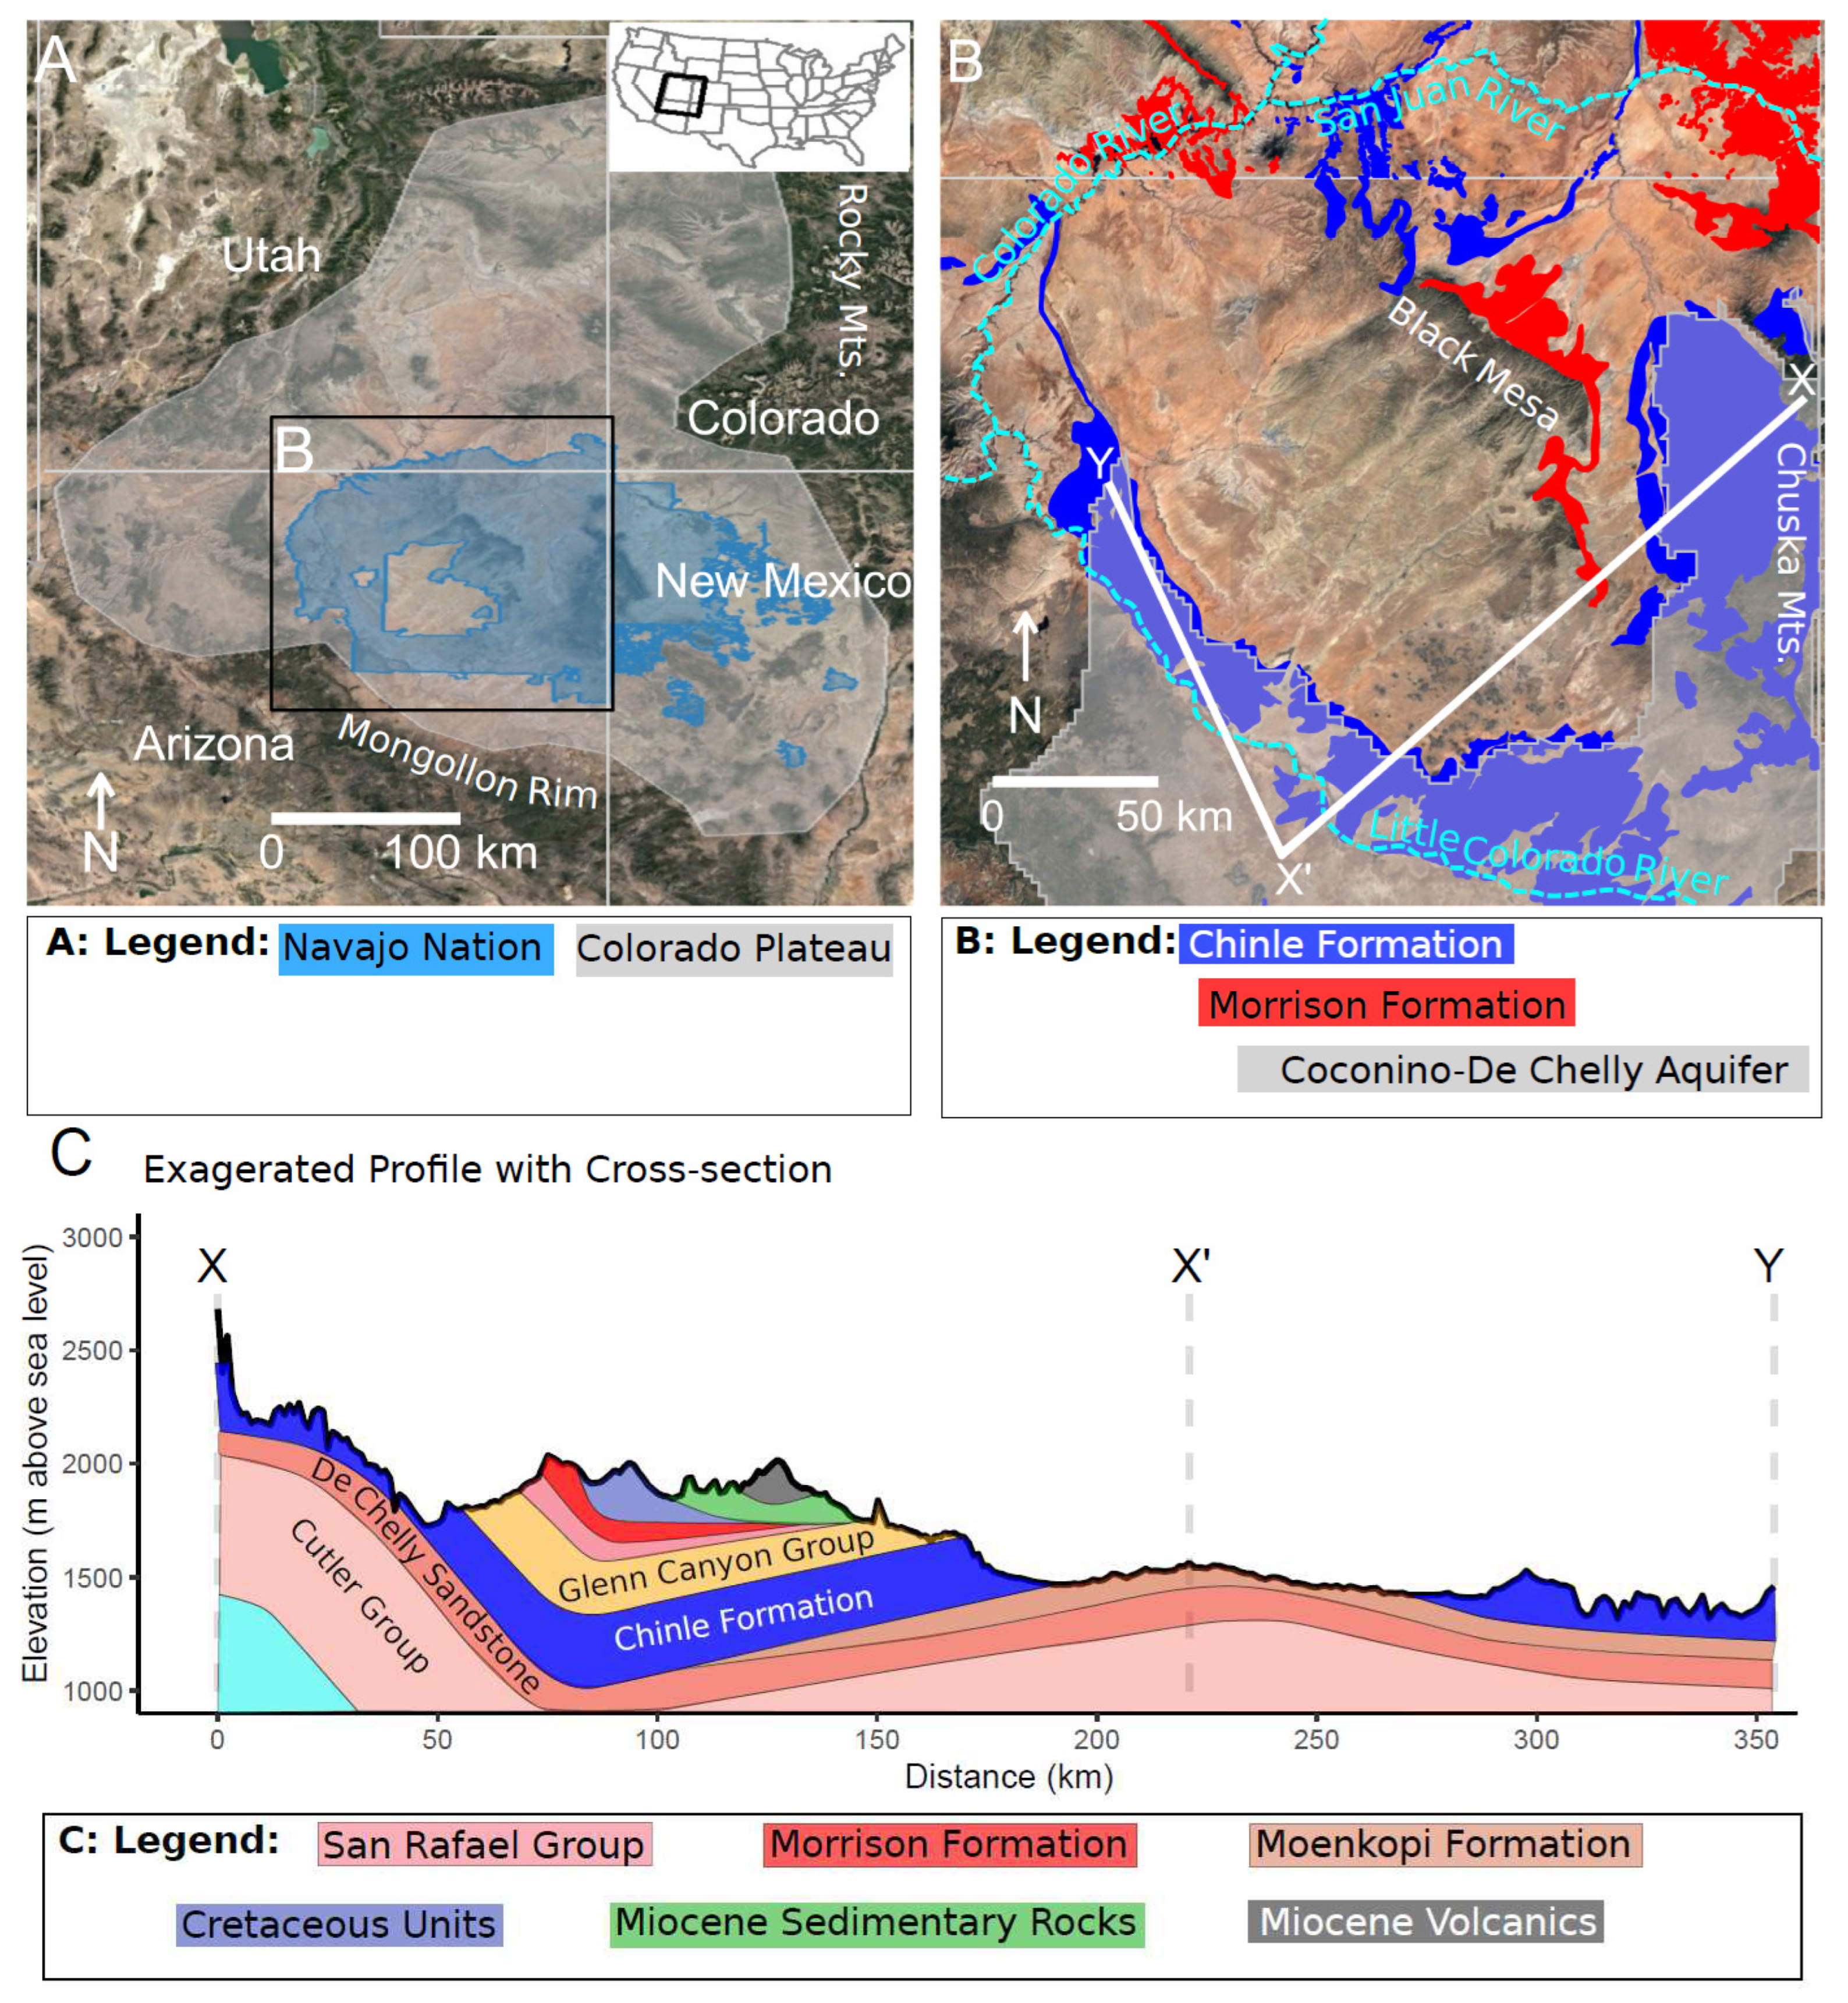
Figure 2.
Visual representation of the concentration of uranium (U) concentration in unregulated water sources across the study region. The range of U concentration in the samples is from 0.047 μg/L to 490 μg/L. The towns of Chinle and Tuba City are shown for reference. Satellite imagery from Google Earth.
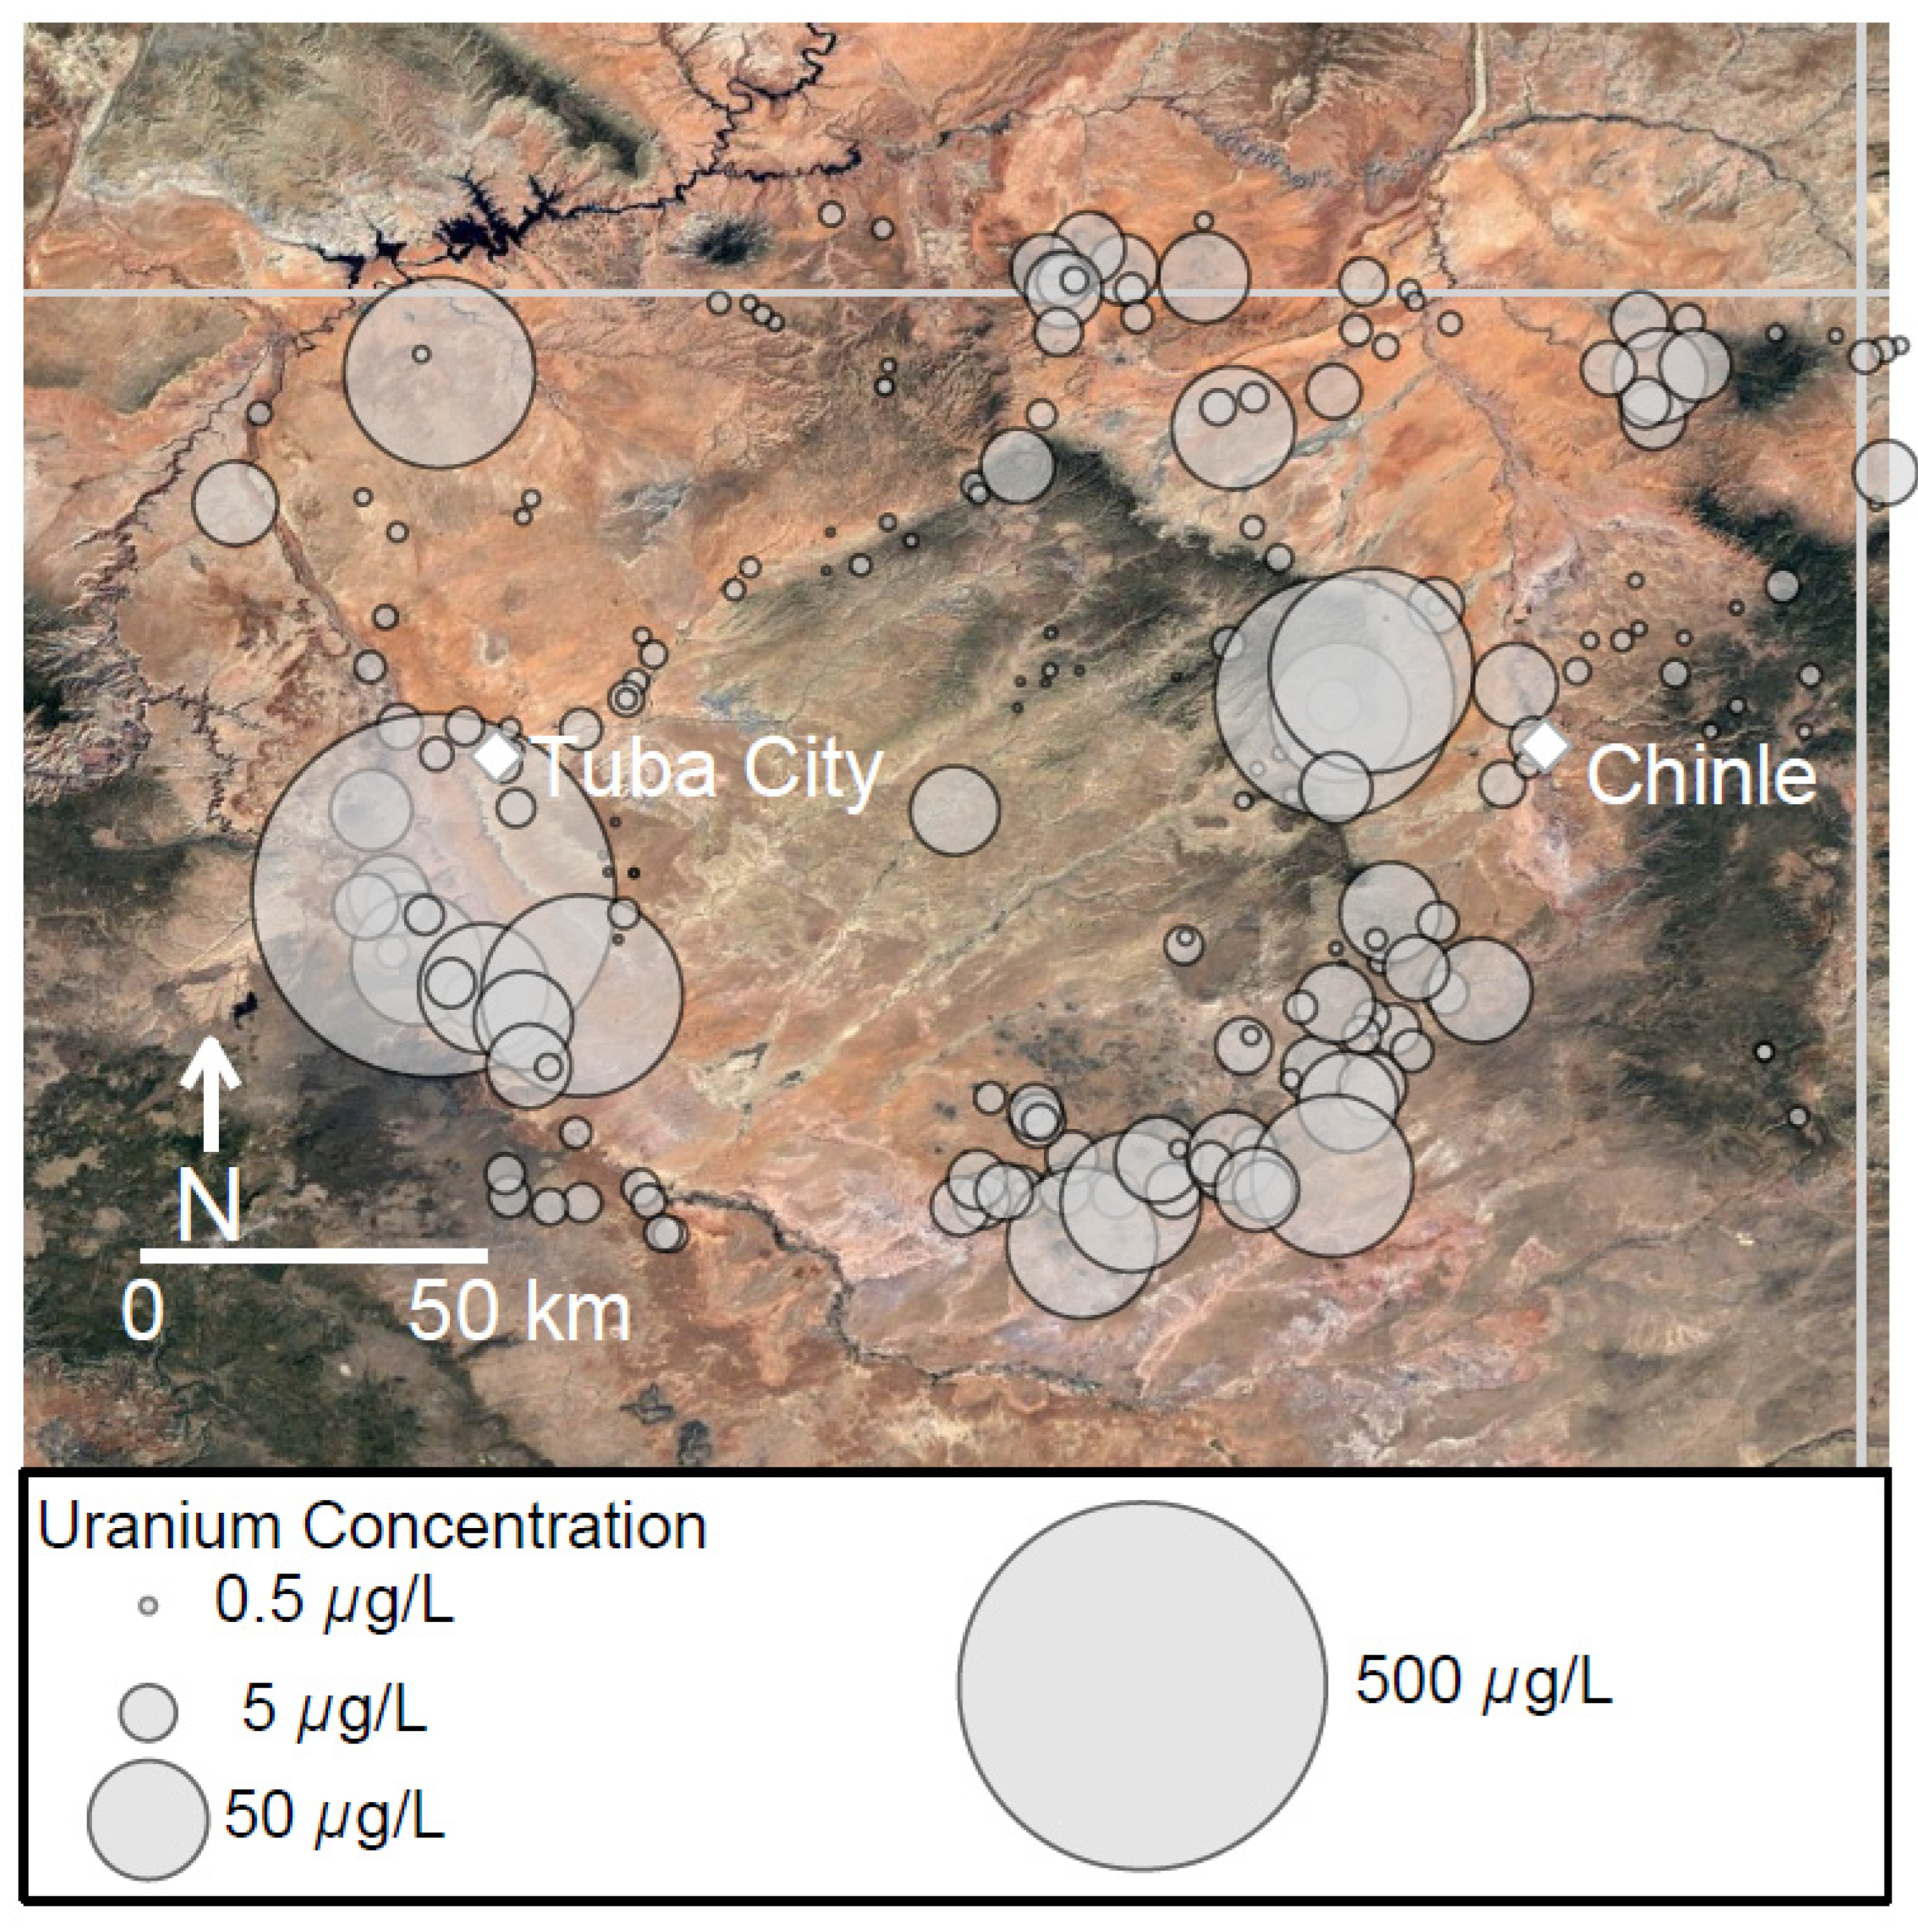
Figure 3.
A) Boxplots showing the relationship between U concentrations in groundwater and Total Dissolved Solids region in the Coconino-De Chelly aquifer. The asterisk indicates that significantly higher U concentrations were observed in regions of the Coconino-De Chelly aquifer where TDS ranges from 3,000 – 25,000 mg/L. B) U concentrations in groundwater plotted against elevation. C) Boxplots showing the relationship between U concentrations in groundwater and whether a water source is located in a location where the Chinle Formation outcrops. The asterisk indicates that significantly higher U concentrations were observed in regions where the Chinle Formation outcrops. D) Boxplots showing the relationship between U concentrations in groundwater and whether a water source is located in a location where the Morrison Formation outcrops. Boxplots follow the format of the lower quartile, median, and upper quartile. Whiskers extend either to the maximum, minimum, or 1.5 times the interquartile range of the data. Note that U concentrations are always expressed on a log10 axis. The US EPA guideline of 30 μg/L is plotted on all figures.
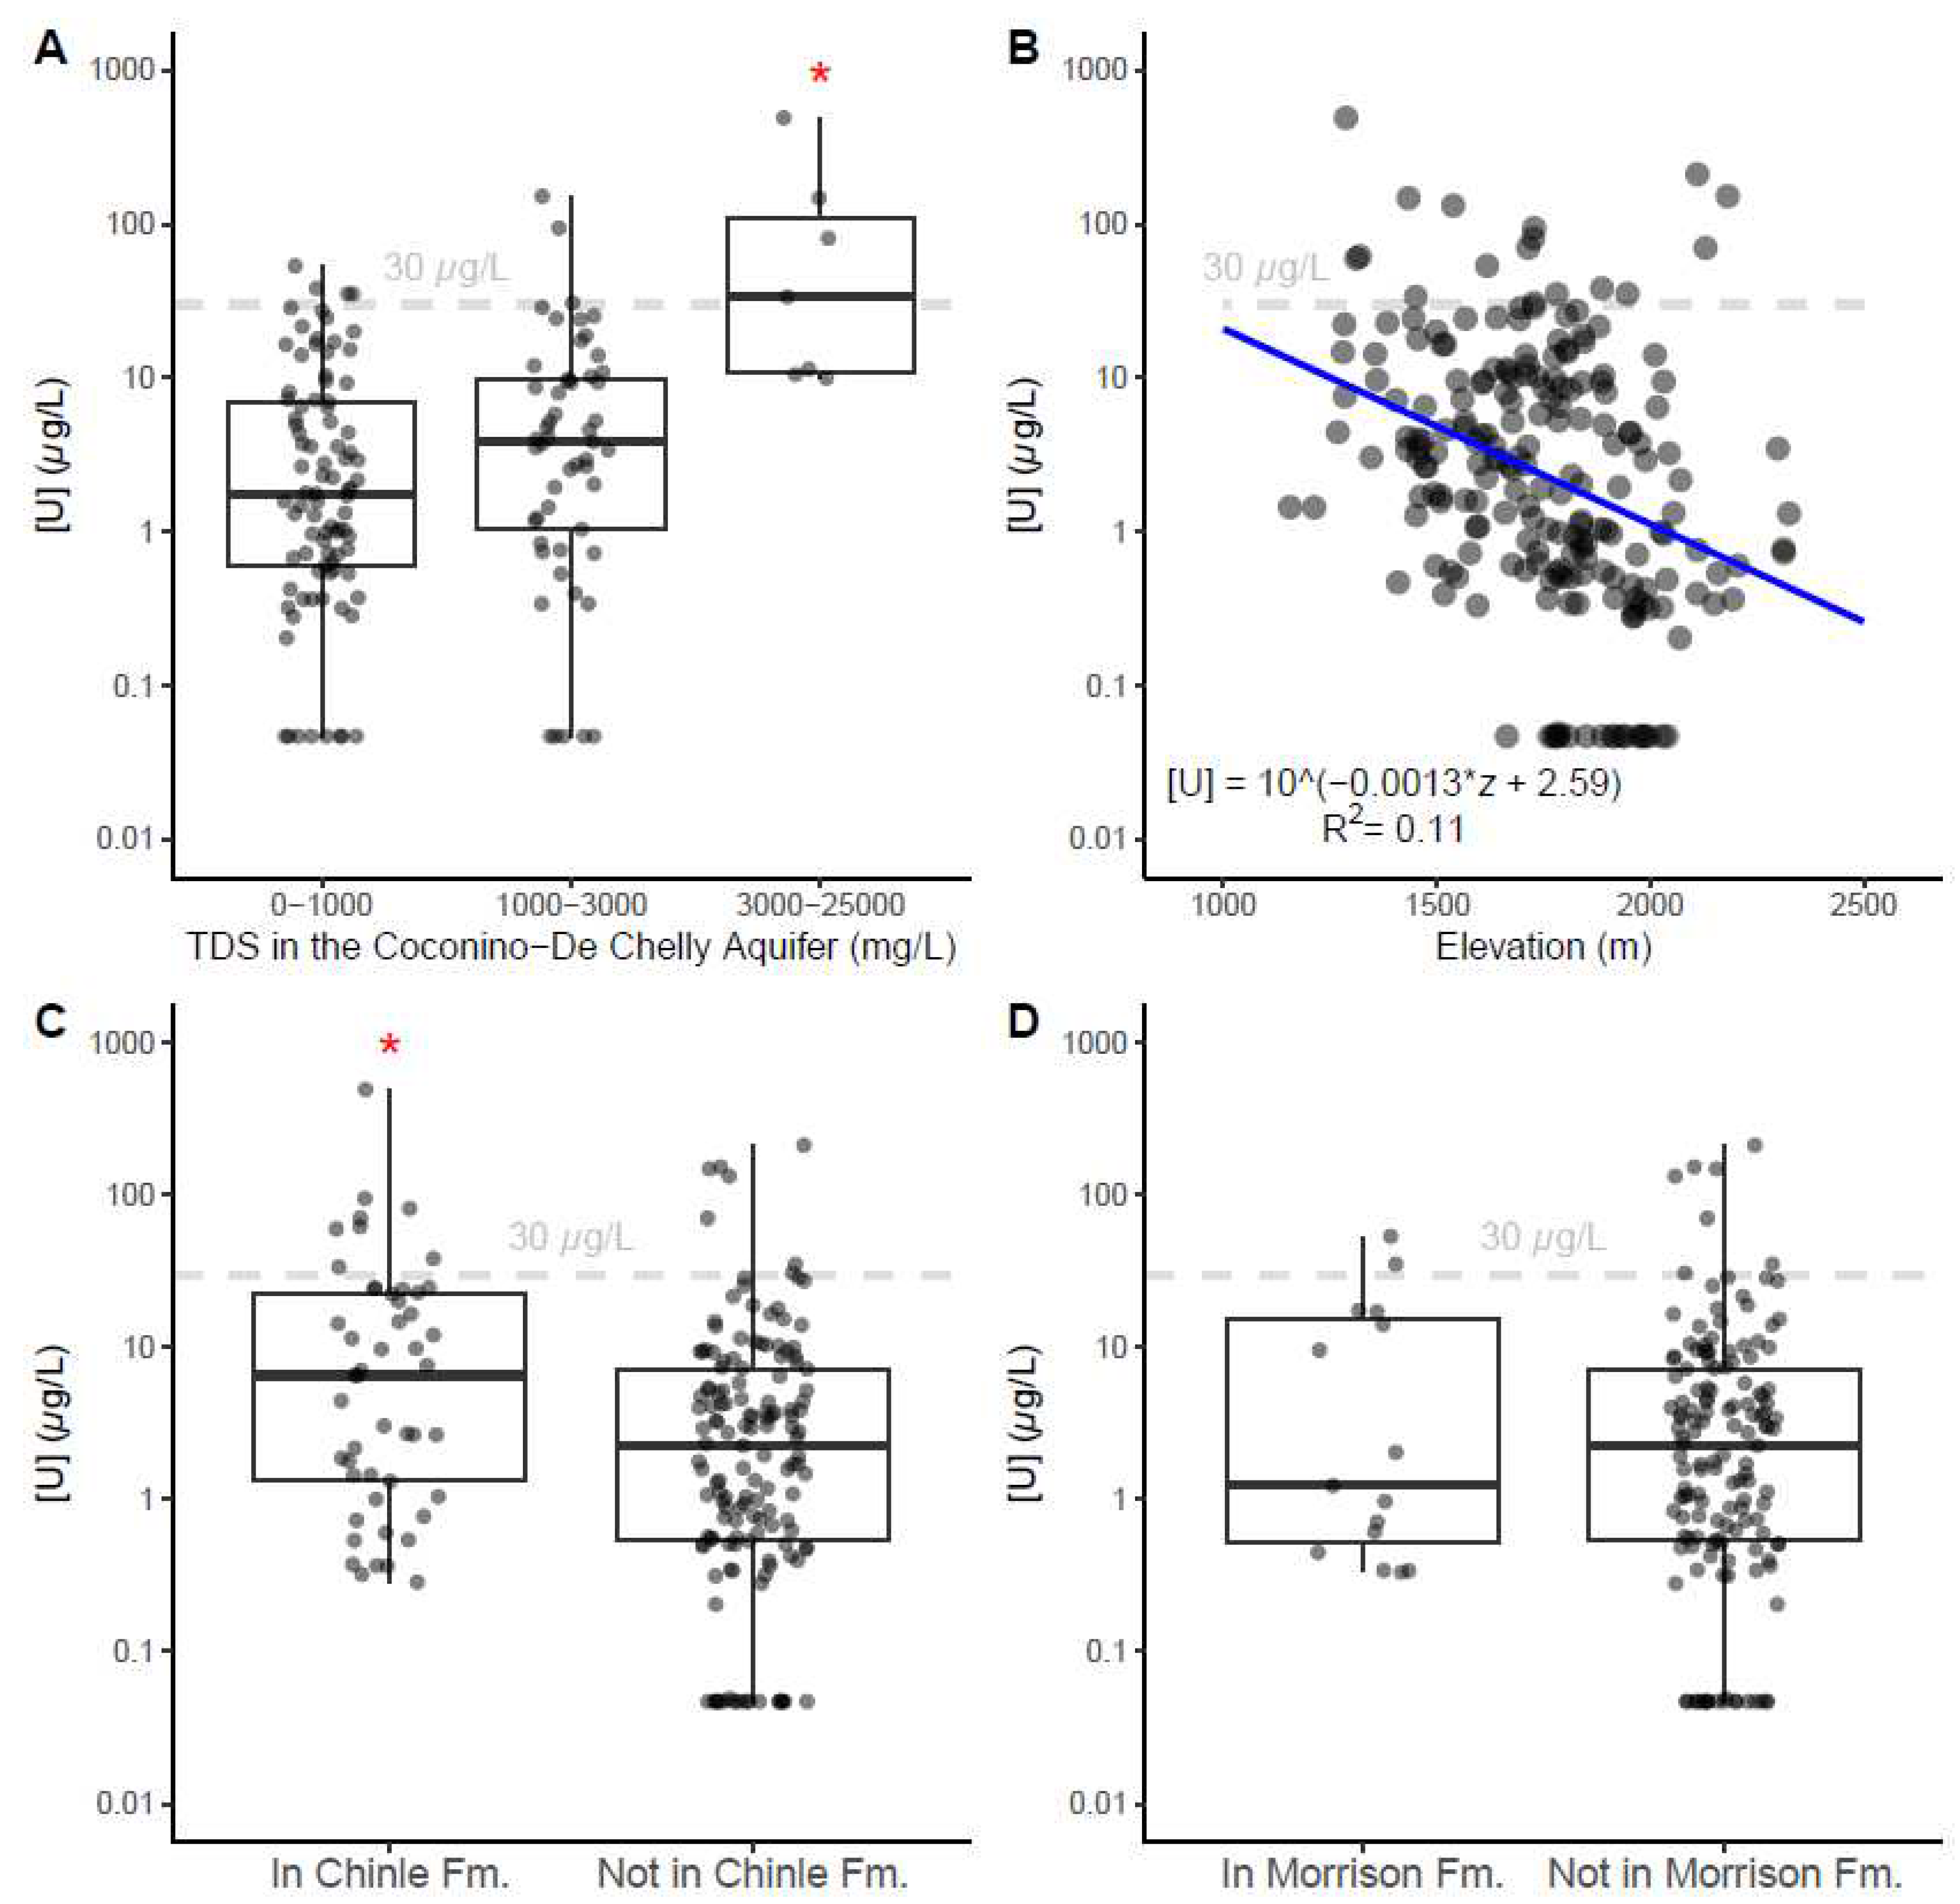
Figure 4.
The distance to the nearest upstream mine is a significant predictor of the U concentration in a water source. Note that U concentrations are always expressed on a log10 axis. The US EPA guideline of 30 μg/L is plotted for guidance.
Figure 4.
The distance to the nearest upstream mine is a significant predictor of the U concentration in a water source. Note that U concentrations are always expressed on a log10 axis. The US EPA guideline of 30 μg/L is plotted for guidance.
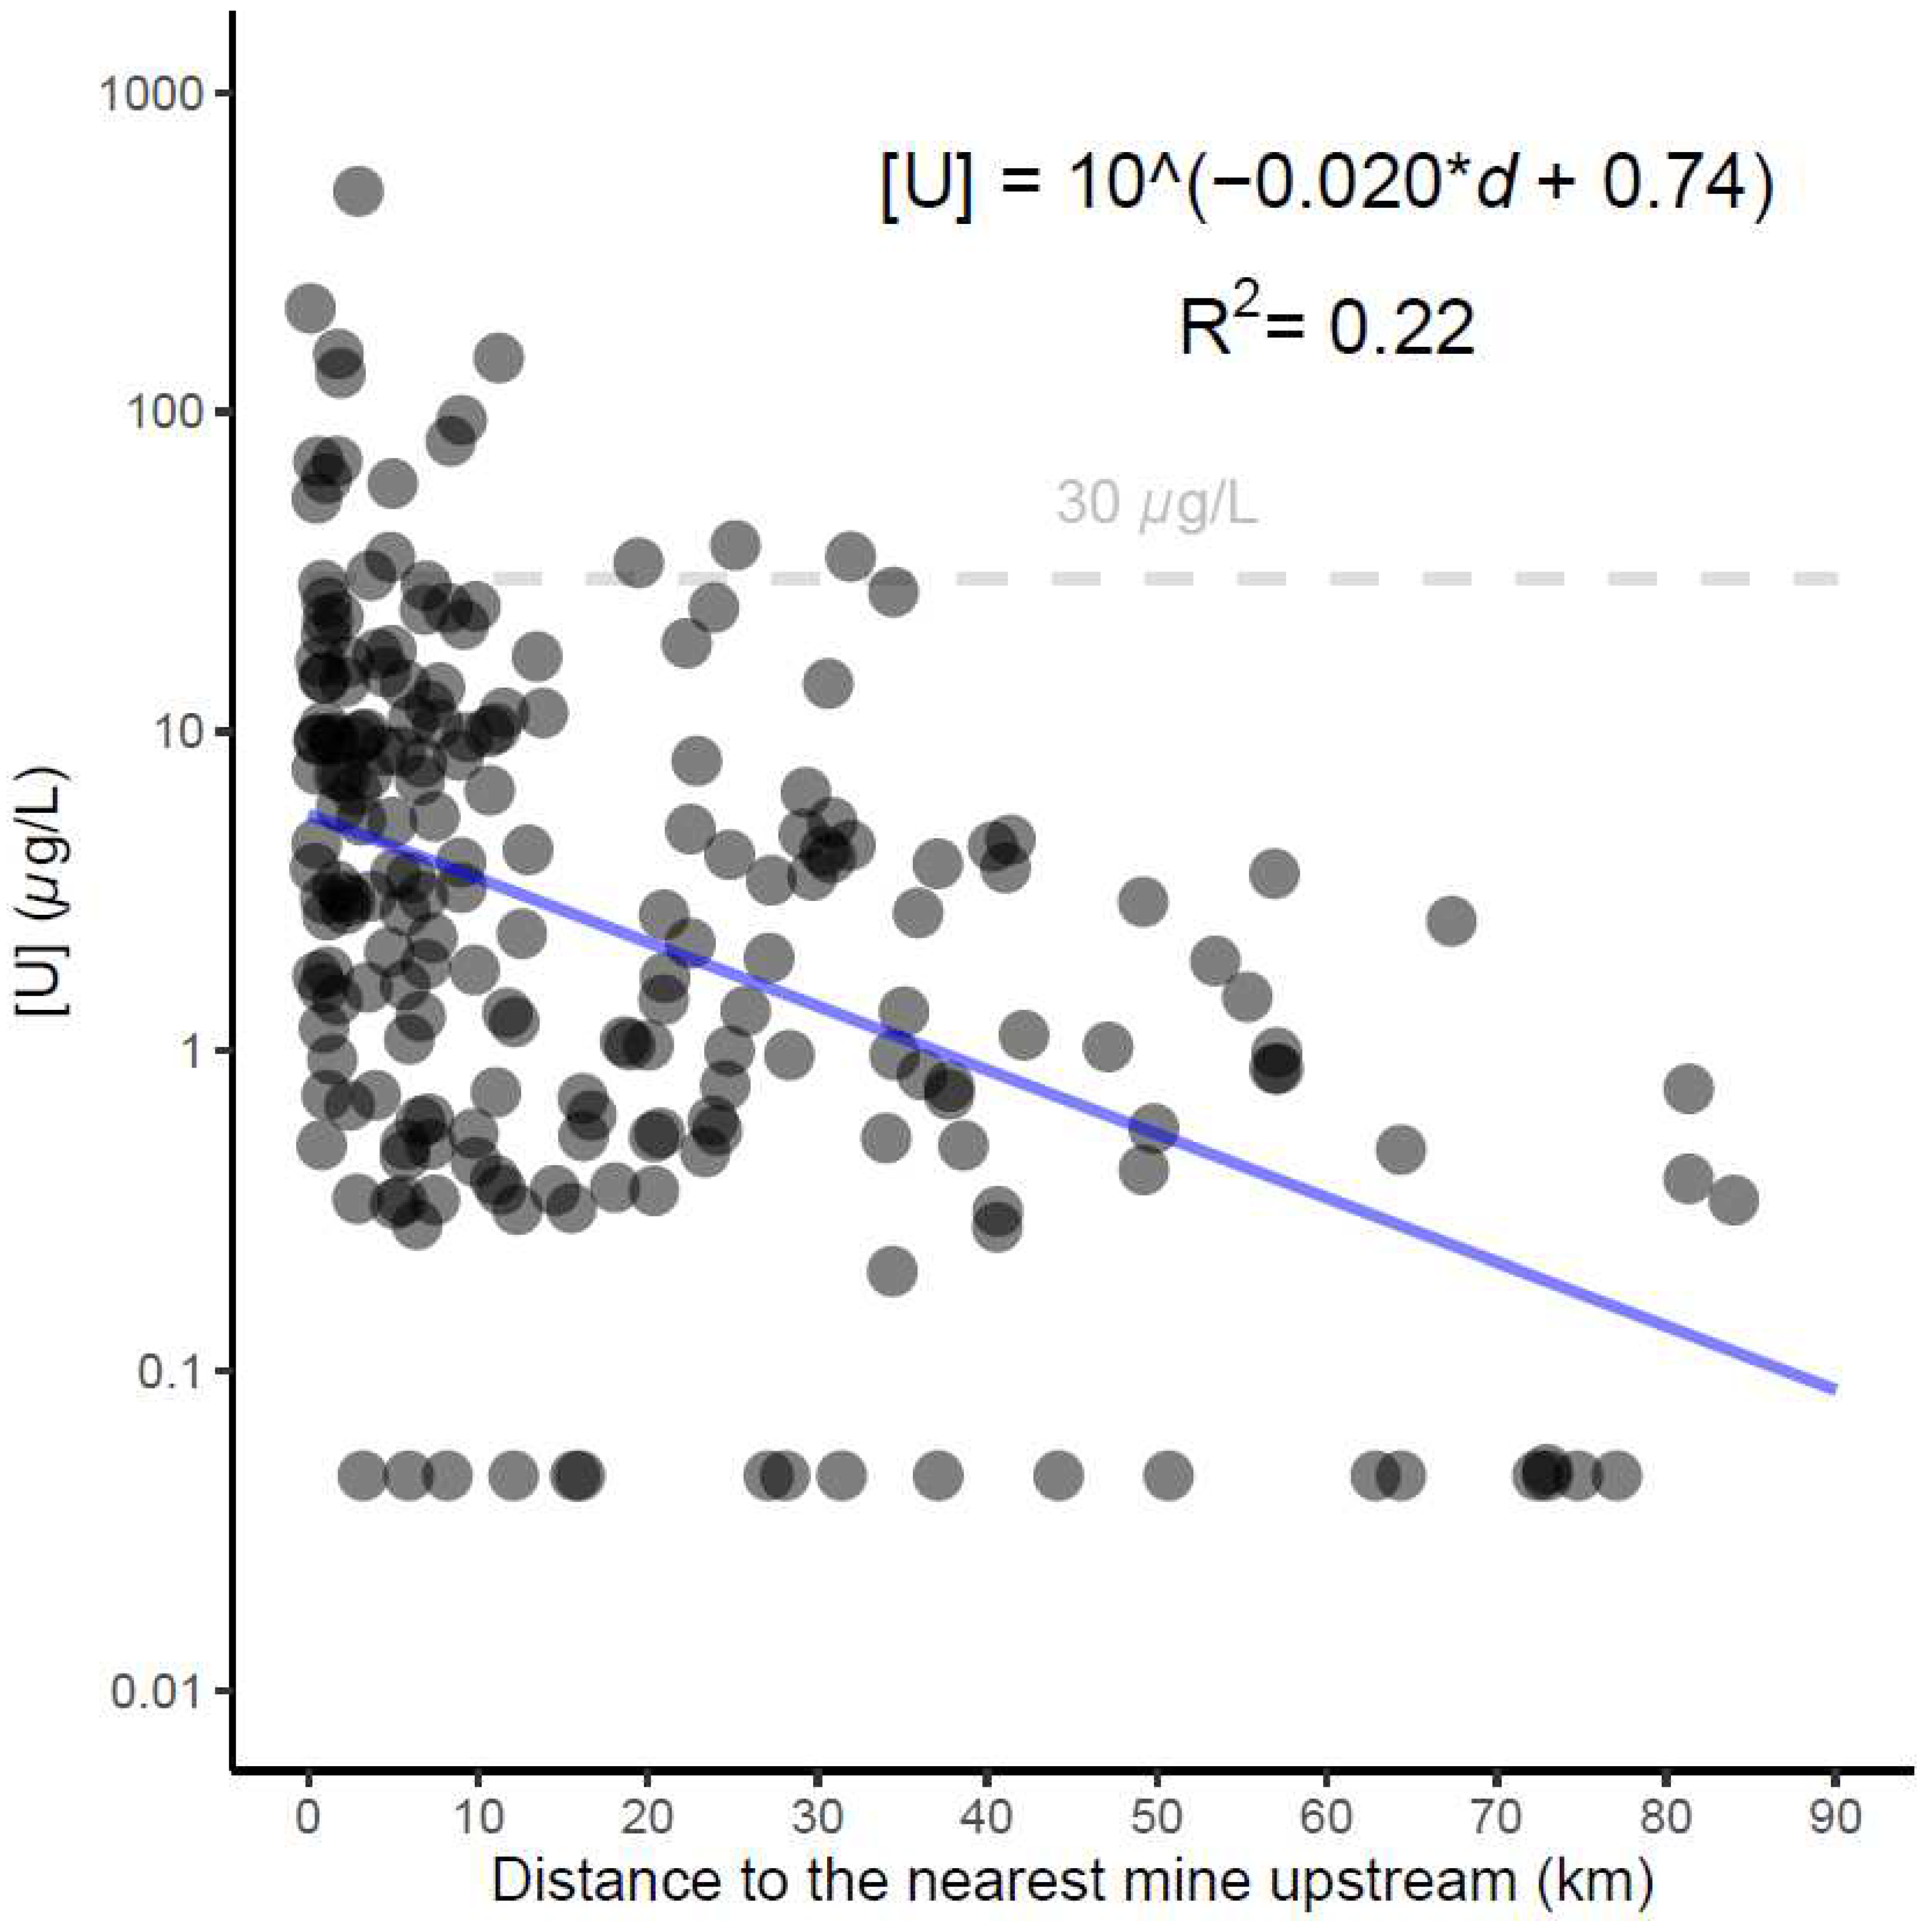
Figure 5.
A) Within the Chinle Fm., the elevation of sample locations is an important predictor of the U concentration in a water source. B) Within the Chinle Fm., the distance to the nearest upstream mine is a significant predictor of the U concentration in a water source. C) The elevation of sample locations is not an important predictor of the U concentration in a water source in locations outside of the Chinle Fm. D) Within the Chinle Fm., the distance to the nearest upstream mine is a significant predictor of the U concentration in a water source. Note that U concentrations are always expressed on a log10 axis. The US EPA guideline of 30 μg/L is plotted on all figures.
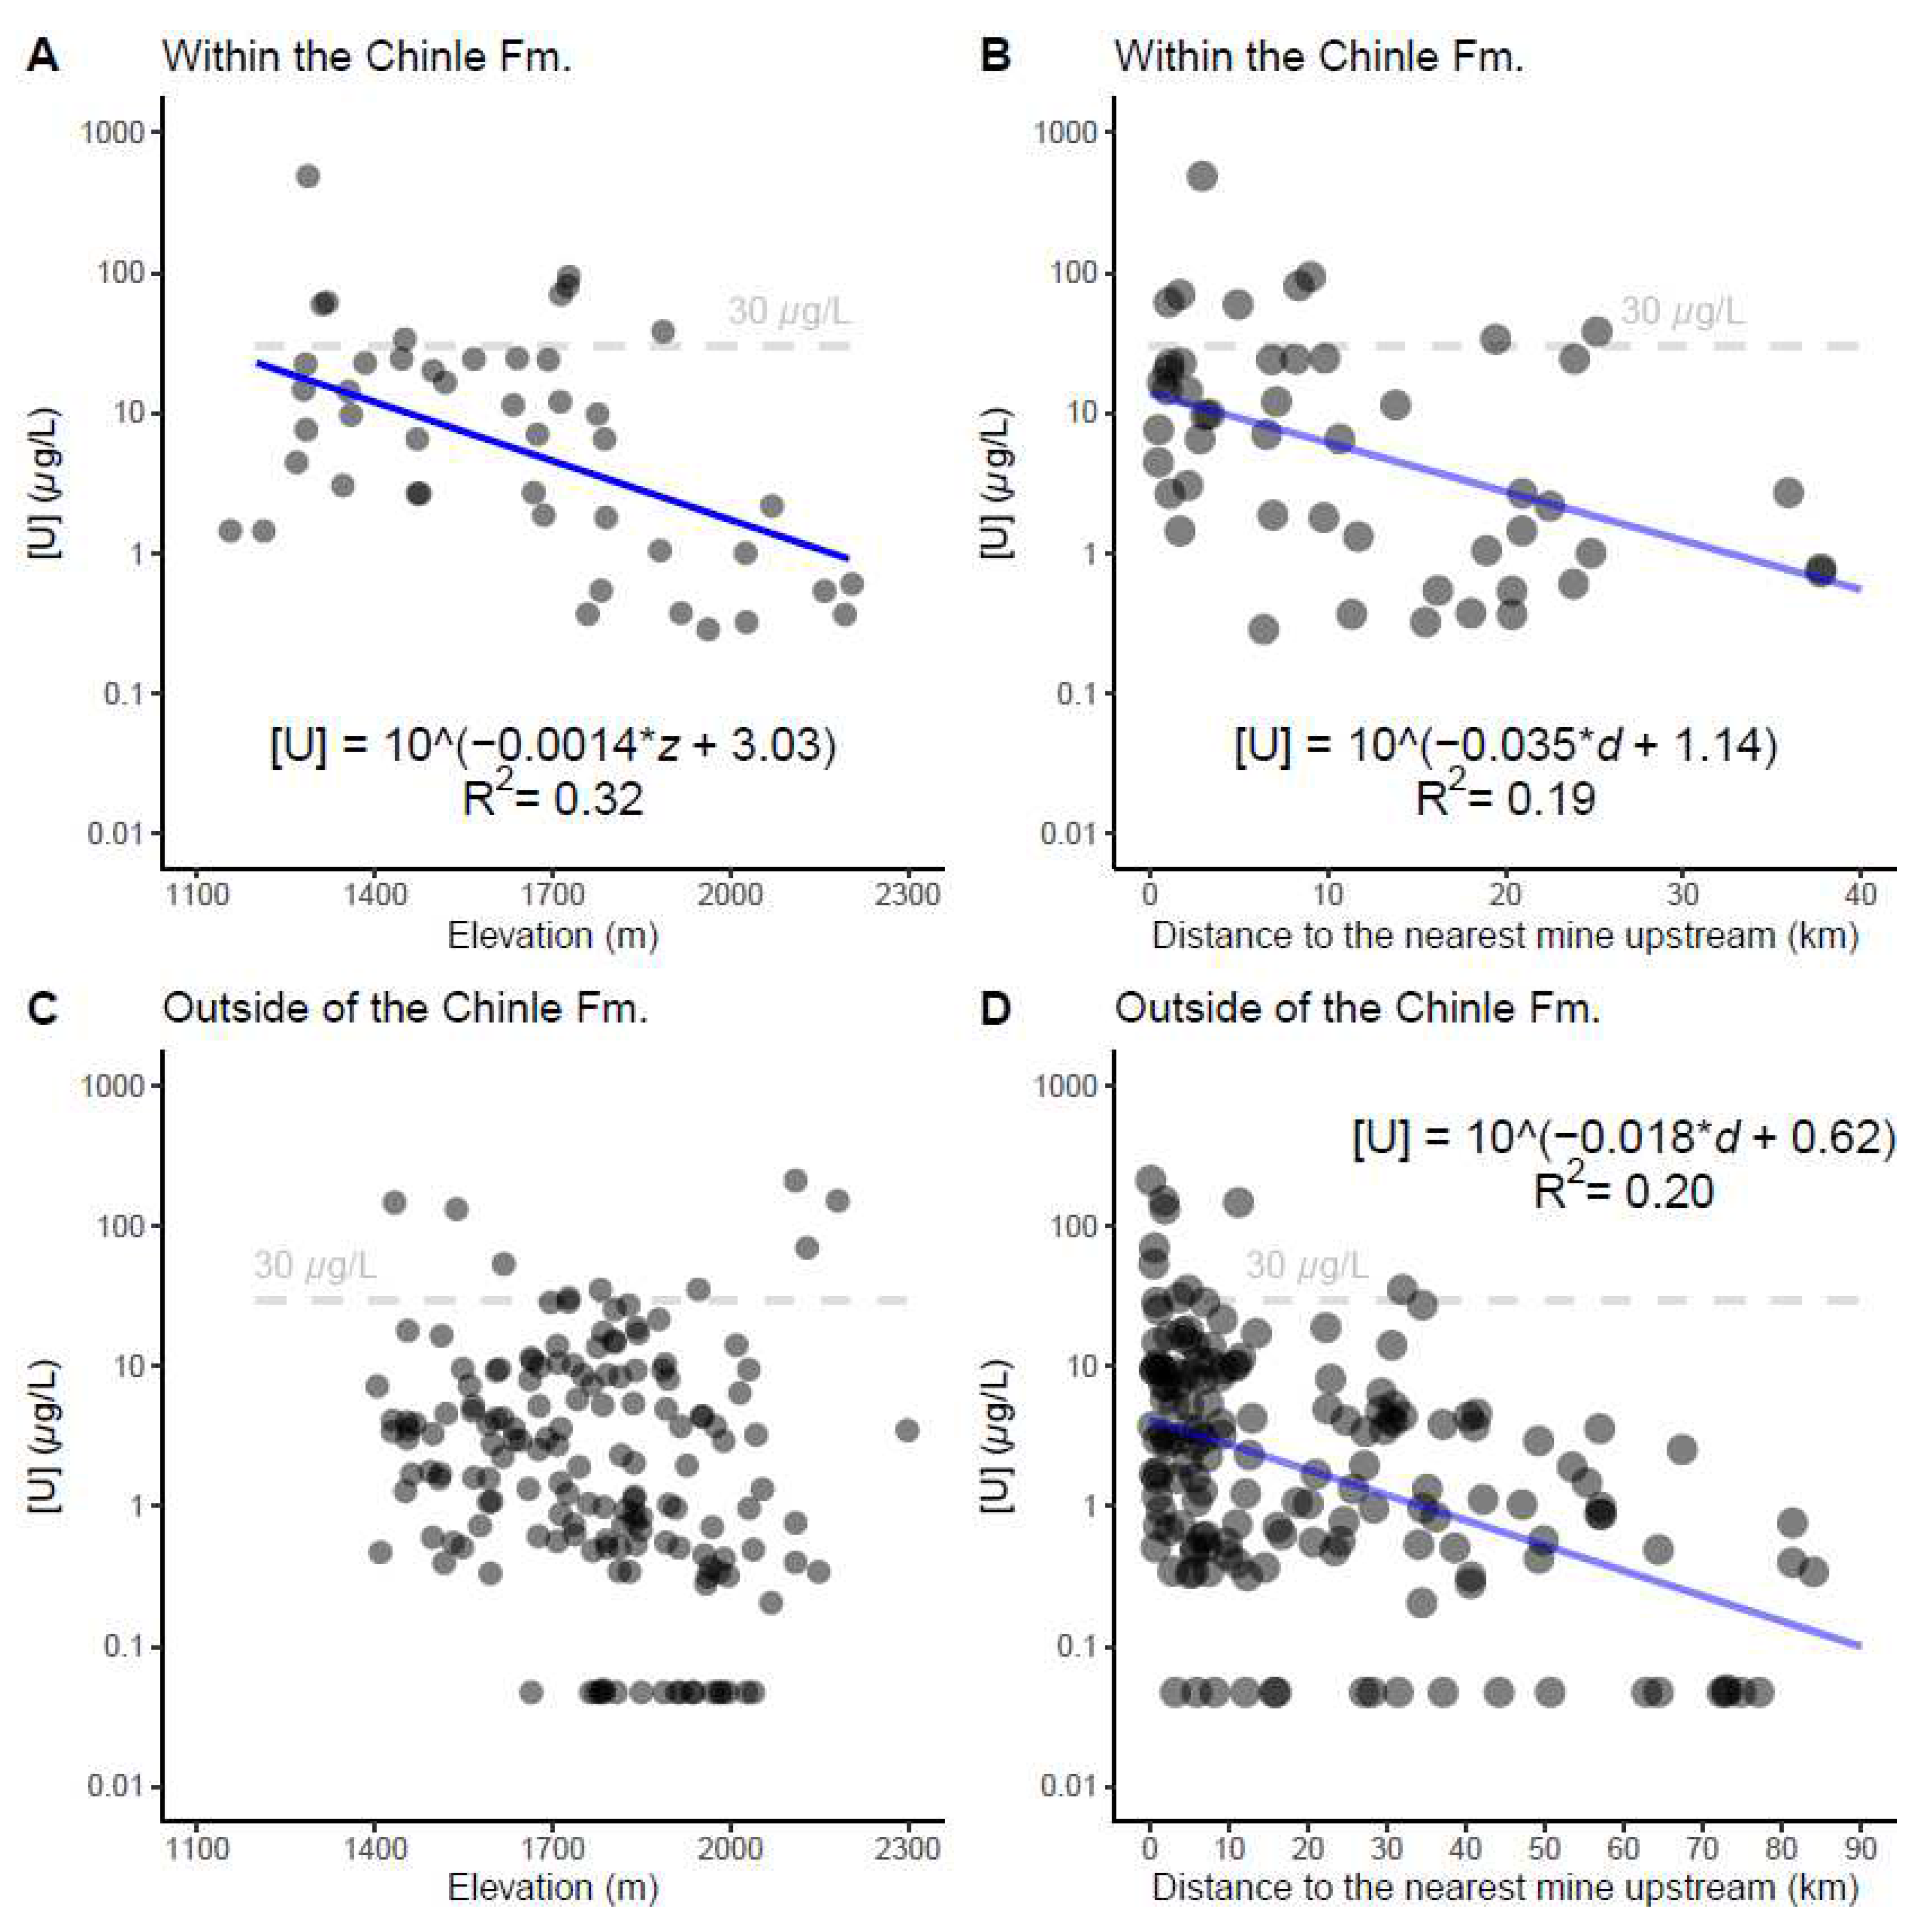

Table 1.
A summary of the datasets analyzed in this manuscript.
| Reference | Data Types |
| Credo et al., 2019 | U concentration in water |
| Robson and Banta, 2005 | Aquifer extent, Aquifer TDS |
| Ludington et al., 2007 | Geological rock units |
| Hill et al., 2009 | Aeromagnetic apparent uranium concentration |
| US EPA, 2006 | Location of abandoned uranium mines |
Table 2.
Medians and sample sizes of water samples from different salinity regions in the Coconino-De Chelly aquifer.
Table 2.
Medians and sample sizes of water samples from different salinity regions in the Coconino-De Chelly aquifer.
| TDS (mg/L) | Q1, Q2, Q3 [U] (μg/L) | No. of samples | p: Dunnetts’s MC 0 – 1 k vs… |
| 0 – 1 k | 0.5, 2.1, 6.4 | 81 | --- |
| 1 – 3 k | 1.0, 4.0, 10.0 | 48 | 0.23 |
| 3 – 25 k | 11.0, 33.7, 109 | 7 | 4⋅10-5 |
Disclaimer/Publisher’s Note: The statements, opinions and data contained in all publications are solely those of the individual author(s) and contributor(s) and not of MDPI and/or the editor(s). MDPI and/or the editor(s) disclaim responsibility for any injury to people or property resulting from any ideas, methods, instructions or products referred to in the content. |
© 2023 by the authors. Licensee MDPI, Basel, Switzerland. This article is an open access article distributed under the terms and conditions of the Creative Commons Attribution (CC BY) license (http://creativecommons.org/licenses/by/4.0/).
Copyright: This open access article is published under a Creative Commons CC BY 4.0 license, which permit the free download, distribution, and reuse, provided that the author and preprint are cited in any reuse.


