Submitted:
04 October 2021
Posted:
08 October 2021
You are already at the latest version
Abstract
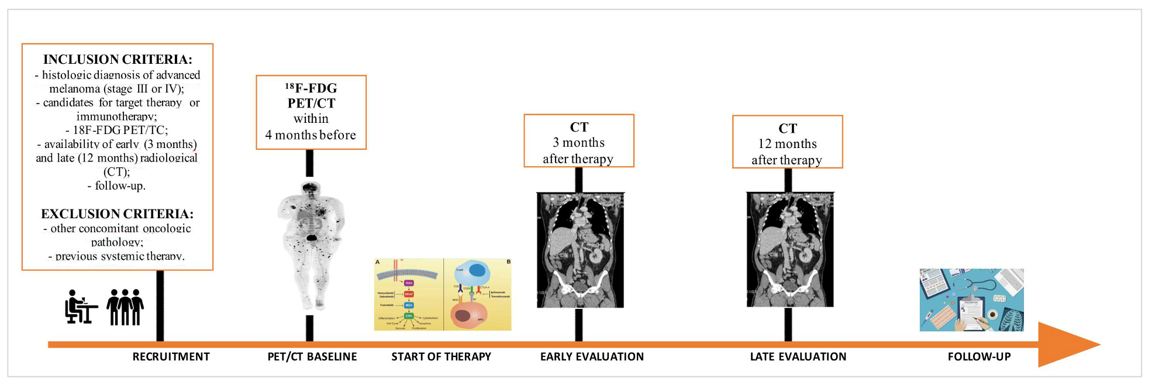
Background/Aim: To evaluate the association between baseline [18F]FDG-PET/CT tumor burden parameters and disease progression rate after first-line target therapy or immunotherapy in advanced melanoma patients. Materials and Methods: 44 melanoma patients who underwent [18F]FDG-PET/CT before first-line target therapy (28/50) or immunotherapy (16/50) were retrospectively analyzed. Whole-body and per-district metabolic tumor volume (MTV) and total lesion glycolysis (TLG) were calculated. Therapy response was assessed according to RECIST 1.1 on CT scan at 3 (early) and 12 (late) months. PET parameters were compared with Mann-Whitney test. Optimal cut-offs for predicting progression were defined using the ROC curve. PFS and OS were studied using Kaplan-Meier analysis. Results: Median(IQR) MTVwb and TLGwb were 13.1 mL and 72.4 respectively. Non-responders patients were 38/44, 26/28 and 12/16 at early evaluation, and in 33/44, 21/28 and 12/16 at late evaluation in the whole-cohort, target and immunotherapy subgroup respectively. At late evaluation, MTVbone and TLGbone were higher in non-responders compared to responder patients (all p<0.037) in the whole-cohort and target subgroup and also MTVwb and TLGwb (all p<0.022) in target subgroup. No significant differences were found for immunotherapy subgroup. No metabolic parameters were able to predict PFS. Controversy, MTVlfn, TLGlfn, MTVsoft+lfn, TLG-soft+lfn, MTVwb and TLGwb were significantly associated (all p<0.05) with OS in both the whole-cohort and target therapy subgroup. Conclusion: Higher values of whole-body and bone metabolic parameters were correlated with poorer outcome, while higher values of whole-body, lymph node and soft tissue metabolic parameters were correlated with OS.
Keywords:
immune checkpoint inhibitors
; PD-1
; PD-L1
; CTLA-4
; immunotherapy
; target therapy
; BRAF
; MET
; melanoma
; [18F]FDG PET/CT
Copyright: This open access article is published under a Creative Commons CC BY 4.0 license, which permit the free download, distribution, and reuse, provided that the author and preprint are cited in any reuse.


