Submitted:
22 April 2023
Posted:
23 April 2023
You are already at the latest version
Abstract
The authors developed a wealth curve (bell curve) that can predict a group of individuals’ wealth based on the composite intelligence score which is calculated based on the sum of the intelligence quotient and emotional awareness score. The intelligence quotient was defined as one's ability to perform, comprehend and learn, and emotional awareness was defined as the emotional ability to recognize and make sense of emotions. To move towards the right on the X-axis of the Kabir wealth curve (e.g., accumulate more wealth), individuals must improve emotional awareness and choose a professional career path that lands higher income, calculated risk-taking, and being connected with individuals that can lead to financial deals. Similarly, those facing social injustice can accumulate more wealth by improving emotional awareness, which will help them navigate challenging environments.
Keywords:
Wealth curve
; Intelligence quotient (IQ)
; Emotional Intelligence (EI)
; Emotional Awareness (EA)
1. Introduction
It is important to understand a predictor that places an individual or a nation ahead or behind others regarding wealth or income. If such predictors can be identified, the country, society or individual can achieve income growth by increasing strength in that dimension. Kabir et al. previous study found the intelligence quotient and emotional awareness to be the most important factor in predicting the rank of countries based on average national income [1]. A previous study also showed the national average intelligence quotient highly correlates with measures of per capita income in a group of 122 countries [2]. The authors' prior study reported the crossover effect of intelligence quotient and emotional awareness on national average income. A very high level of emotional awareness (EA) indicates one can learn from expressed emotions quickly, which helps to solve problems in life by understanding emotions, such as being able to regulate one's emotions and cheer others up when they are feeling low. This emotional awareness (EA) is an essential part of emotional intelligence (EI). The other part of emotional intelligence (EI) is to manage one's emotions to handle interpersonal relationships judiciously and empathically, which was not incorporated in this study. The measuring emotional intelligence scores have unknown psychometric properties (i.e., validity and reliability) and are not well integrated with extant emotional intelligence research. The question remains whether intelligence quotient and emotional awareness will predict a group of individual's income or wealth.
Though the previous study does not prove causality, these variables suggest that a group with a higher intelligence quotient and emotional awareness in a country will predict a reduced value of average income rank, placing a nation higher on the world’s stage. This said intelligence quotient has been shown to be predicted 75% by genetics [4] and the rest by environmental factors. This makes it a hard metric to increase through improvements being reported in prior studies. However, increasing emotional awareness can be done through training and proper education, thus accomplishing three goals: the combined effect of intelligence quotient and emotional awareness will intrinsically increase and prepare individuals to be more tactful and proficient in their workplace. The resource utilized on improving emotional awareness (EA) will also be an increase in the educational expenditure of the country by also funding a direct source of income potential. The emotional awareness of a country is seen to correlate with the corruption perception index, where a country with higher emotional awareness tends to have less corruption [1]. That means the endogenous relationships in the model allow a convenient avenue through which additional funding on emotional awareness education can trickle into the other variables and boost the nations or individual’s average income potential.
The study objective is to develop a bell where the X-axis indicates the wealth or income of a group of individuals, or a nation and Y-axis indicates the chances of being in that place on the corresponding wealth or income (of the X-axis). Such a wealth curve would help a group of individuals or a nation to identify their area of improvement to accumulate more wealth.
2. Methodology
The study method was described elsewhere [1]. Given the study focused on emotional awareness (EA) as one of the most critical determinants of wealth gain, the measurements of emotional awareness (EA) are included here. The study considered the percentage of any country’s population who said they had experienced the full range of positive and negative emotions on the previous day as a measure of emotional awareness (EA) scores. It was a part of Gallup's emotional study, which collected people's positive and negative daily experiences based on more than 151,000 interviews with adults in over 140 countries in 2018 [5]. The exact yes/no questions used in Gallup's positive and negative experience Index were:
1. Did you feel well-rested yesterday?
2. Were you treated with respect all day yesterday?
3. Did you smile or laugh a lot yesterday?
4. Did you learn or do something interesting yesterday?
5. Did you experience the following feelings during a lot of the day yesterday? How about enjoyment?
6. Did you experience the following feelings during a lot of the day yesterday? How about physical pain?
7. Did you experience the following feelings during a lot of the day yesterday? How about worry?
8. Did you experience the following feelings during a lot of the day yesterday? How about sadness?
9. Did you experience the following feelings during a lot of the day yesterday? How about stress?
10. Did you experience the following feelings during a lot of the day yesterday? How about anger? [Gallup 2019 Global Emotional Report].
The emotional awareness (EA) used in this study had a mean value of 47 percent (ranging between 36 to 54) with a standard deviation of 4.5.
The study's final model included a total of 81 countries' average population intelligence quotient (IQ) which was collected from the results of several international studies [IQ data by country; Lynn et. al. (2002); Rindermann H; Khaleefa et. al. (2007); Ahmad et al. (2008); Lynn (2008); Meisenberg et. al. (2011)]. The intelligence quotient used in this study had a mean value of 87.5 points with a standard deviation of 12.6 (range from 60 to 108). The per capita gross national income included in this study was obtained for the year 2019 from the World data website which is simulated from the World Bank, International Monetary Fund and the OECD countries report available in their websites. Average per capita gross national income was calculated by dividing all annual incomes and profits by the size of the country’s population. Income is usually not normally distributed, either at the individual or the aggregate level. It is positively skewed. Therefore, to use parametric statistics, the study used a logarithmic transformation of gross national income to bring it closer to a symmetric Gaussian distribution.
3. Results
The total number of countries included in the study was 102 because the rest of the country’s average intelligence quotient scores were not available. Among those 102 countries, twenty-one (21) were excluded from the analysis because of missing data related to emotional awareness. The final data set had a total of 81 countries. He countries with highest IQ was Singapore (108), Hong Kong (108), Japan (105), Netherland (102), Switzerland (102). All these countries have emotional awareness score of less than 50 with lowest in Singapore being 36. In her contrary, United States, the global superpower, and Canada both have the highest emotional awareness of 54 and IQ of 98 and 101 respectively. This data indicates that geographic location, size of the country and population does impact gross national income. The China despite having lower average emotional awareness score of 46, have higher average intelligence quotient of 104. This possibly places China in a disadvantaged position to take over world superpower status as it needs more of an emotional control than intelligence to lead the world.

Table 1.
Ranked list of countries from 1st to 20th by the average national income: Demonstrating when emotional awareness (EA) increases, intelligence quotient (IQ) decreases and vice versa.
Table 1.
Ranked list of countries from 1st to 20th by the average national income: Demonstrating when emotional awareness (EA) increases, intelligence quotient (IQ) decreases and vice versa.
| Income Rank | EA | IQ | Average Income | Education Expense | CP Index | |
|---|---|---|---|---|---|---|
| 1 | Luxembourg | 50 | 99 | 54254 | 204 | 80 |
| 2 | Switzerland | 49 | 102 | 50054 | 204 | 85 |
| 3 | Denmark | 50 | 99 | 39017 | 204 | 88 |
| 4 | Japan | 47 | 105 | 36784 | 204 | 74 |
| 5 | Sweden | 49 | 99 | 36480 | 204 | 85 |
| 6 | United States | 54 | 98 | 36470 | 204 | 67 |
| 7 | Netherlands | 49 | 102 | 33689 | 204 | 82 |
| 8 | Austria | 47 | 100 | 32004 | 204 | 76 |
| 9 | Finland | 50 | 101 | 31447 | 204 | 85 |
| 10 | United Kingdom | 49 | 100 | 30986 | 204 | 77 |
| 11 | Germany | 47 | 100 | 30892 | 204 | 80 |
| 12 | Belgium | 52 | 100 | 30741 | 204 | 76 |
| 13 | Kuwait | 50 | 85 | 29283 | 204 | 42 |
| 14 | Ireland | 51 | 94 | 28420 | 204 | 72 |
| 15 | Canada | 54 | 101 | 27683 | 204 | 77 |
| 16 | Italy | 47 | 97 | 25889 | 204 | 53 |
| 17 | Australia | 50 | 99 | 25665 | 204 | 77 |
| 18 | Singapore | 36 | 108 | 25561 | 906 | 85 |
| 19 | Hong Kong | 46 | 108 | 25419 | 915 | 77 |
| 20 | Spain | 53 | 97 | 19808 | 884 | 62 |
Role of a country’s culture on wealth: Table 2 shows that there is virtually no correlation between IQ and EA in this sample of countries, with a correlation coefficient of .04. This shows that IQ and EA measure completely different characteristics. However, both are related to gross national income, corruption perception index (CPI), and other measures of good governance such as democracy index, electoral process & pluralism, functioning of government, political participation, educational expenses, and civil liberties. Together, all these measures can be considered as cultural index of a country or a nation.
Table 2.
Correlation matrix of variables of measures of good governance and intelligence.
| LOG GNI | GNI | IQ | EA | IQ*EI | DI | EPP | FG | PP | CL | CPI | EE | |
|---|---|---|---|---|---|---|---|---|---|---|---|---|
| LOG National Income | 1.00 | |||||||||||
| Gross National Income (GNI) | 0.87* | 1.00 | ||||||||||
| Intelligence Quotient (IQ) | 0.77* | 0.59* | 1.00 | |||||||||
| Emotional Awareness (EA) | 0.32* | 0.32* | 0.04 | 1.00 | ||||||||
| Democracy Index (DI) | 0.72* | 0.60* | 0.55* | 0.36* | 0.68* | 1.00 | ||||||
| Electoral process & Pluralism (EPP) | 0.59* | 0.46* | 0.47* | 0.31* | 0.58* | 0.94* | 1.00 | |||||
| Functioning of Government (FG) | 0.71* | 0.59* | 0.59* | 0.39* | 0.72* | 0.93* | 0.84* | 1.00 | ||||
| Political Participation (PP) | 0.67* | 0.57* | 0.51* | 0.31* | 0.61* | 0.90* | 0.81* | 0.80* | 1.00 | |||
| Civil Liberty (CL) | 0.71* | 0.57* | 0.54* | 0.31* | 0.65* | 0.97* | 0.93* | 0.88* | 0.85* | 1.00 | ||
| Corruption Perception Index (CPI) | 0.85* | 0.76* | 0.67* | 0.27* | 0.74* | 0.82* | 0.68* | 0.84* | 0.73* | 0.80* | 1.00 | |
| Educational Expenses (EE) | 0.60* | 0.36* | 0.49* | 0.06 | 0.42* | 0.33* | 0.27* | 0.32* | 0.27* | 0.38* | 0.49* | 1.00 |
Among the top 20 wealthiest countries, only Singapore has emotional awareness less than 40. All other countries have emotional awareness higher than 46 or above. And only 4 countries are in Asia and the rest of the 16 countries are in Europe. This indicates that European nations have higher emotional awareness which is associated with higher wealth building. Given the IQ and EA only explains 67% of the wealth, the rest can be explained by style or culture of a nation as there is continental difference of wealth among all nations. This study defines positive culture by good standing democracy, higher educational expense, lack of corruption, and fair collaboration among individuals. Higher emotional awareness is linked to positive culture as the population with higher emotional awareness tends to have better democracy, and less corruption. Also, individuals might work better together due to lack of jealousy and back stabbings. Higher emotional awareness might help individuals being good at negotiations and achieve better deals which leads to higher wealth. European nations conquered many of the countries in Asia, Africa, and the Americas. This indicates Europeans like to get control of any deals which leads to long term wealth building. It’s possible that negative (jealous) cultures like titles, glory, and prestige are more than control. For example, British empire provides knights and designation of “Sir” title to its subjects. In many countries in Asian cultures, jealousy is predominant which is not seen in western cultures. This jealousy is a manifestation of lower emotional control which leads to lack of collaboration between individuals despite having higher intelligence. Alternatively, jealousy can be explained as backstabbing in western culture but due to higher emotional awareness, people possibly restrain them from exposure. In addition, in western culture, due to higher emotional control, the population are aware of effects of jealousy on business collaborations, hence display humble behavior to avoid jealousy.
The study used Bayesian method to assign weight for factors that can lead to better deal making capacity between cultures. To solve any uncertainty, all the factors associated with decision-making are provided a weight (likelihood ratio). The likelihood ratio is calculated using statistical law. In each culture, these weights can be cultural values, instead of weight. People from different cultures place values differently on different factors leading to different scores for each factor. This leads to different sum totals leading to different decision-making among whites and non-whites.
Table 3 also explains why western (positive) culture can work with all other cultures (negative or semi-negative cultures) leading to wealth building via crafting business deals as they are looking for control over upfront financial value and understands BATNA better. In contrast, negative cultures fail to work with themselves or semi negative cultures as both are looking for prestige, glory, title and upfront financial wealth than long term control. This cultural difference in preferences in crafting deals can explain the difference in wealth distribution in Table 1.
Component of Human Intelligence: Human intelligence cannot be derived from IQ measures alone as it does not reflect all the categories of intelligence needed to gain wealth. There is a significant contribution of emotional awareness to wealth building. In addition, human IQ is measured using multiple different components. It is important to understand different components of IQ components and assess their impact on wealth building. To investigate the composition of human intelligence, we need to look at how computer works (except computers do not have emotional awareness). Like computers, humans have hard drive memory (which is long term memory), and analytic reasoning (which is random access memory, RAM). But in the case of humans, you cannot customize all the components to unlimited value, rather add all the components to 100. If you increase the analytic reasoning capacity of an individual, you will give up long term memory or emotional control. No one can increase any component of intelligence without losing performance in another domain. If the brain development is maximized, everyone will have equal capacity like in a pie chart (the total is 100). The question is who is growing which component of intelligence? If you have better emotional control, you will lose analytic reasoning or long-term memory. If you have a strong memory, you will lose capacity for analytic reasoning or long-term memory. It is well known that A students works for the B students. According to Figure 1, the A student will look like a person with comparatively higher long-term memory than analytic reasoning skills (as long-term memory capacity occupies the space of analytic reasoning). On the contrary, the B student has comparatively higher analytic reasoning than long-term memory (as analytic reasoning capacity occupies the space of long-term memory). Due to strong memory function and higher than average analytic reason, the A student always averts risks. The B students lack memory of historical failures and due to lack of memory, they jump into new (challenging) initiatives leading to success in entrepreneurships. Subsequently, the A students join the B students’ venture if they are successful (work for the B student). However, the C students have very strong emotional control and interpersonal communication skills and lower long-term memory and analytic reasoning as allocated space for intelligence space is occupied by larger emotional control segments. This phenomenon leads to the C students running the country or being in more leadership roles successfully.
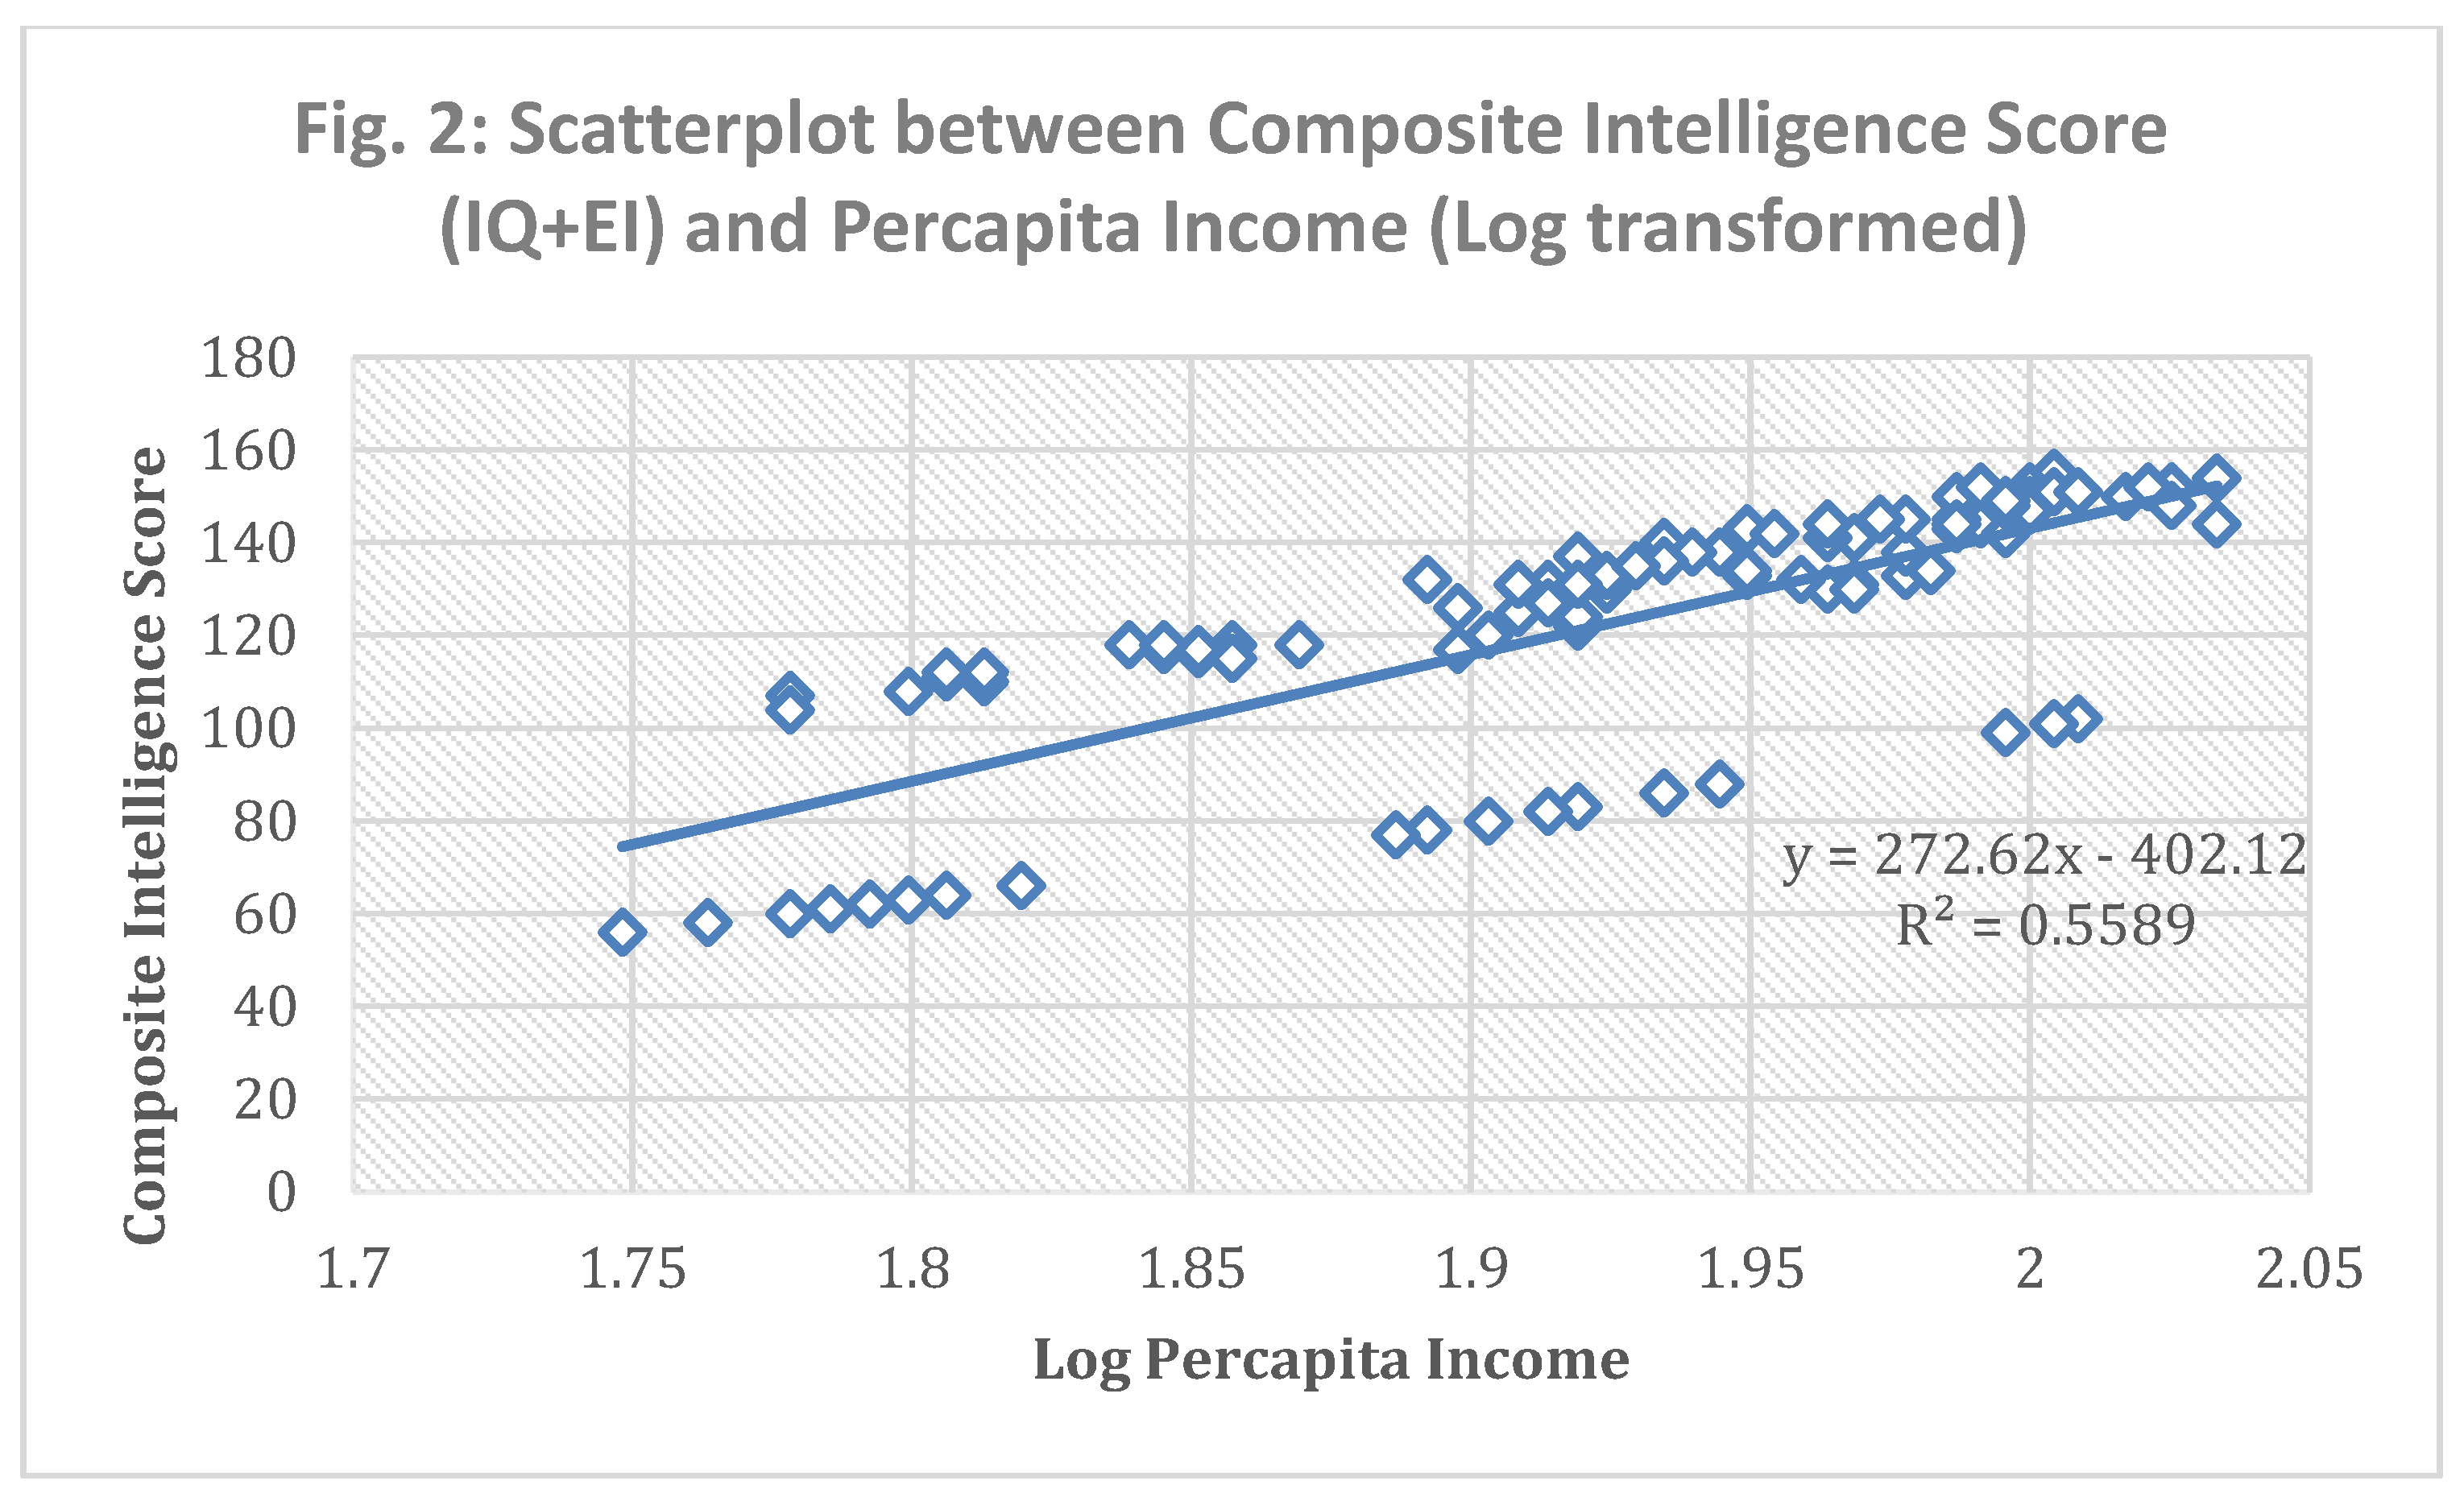
Composite Intelligence Scores: Using univariate analyses, the study found that composite intelligence score (sum of intelligence quotient and emotional awareness score) is highly correlated with log transformed per capita income, yielding a significant p-value (<0.05). This model had an R-square value of 0.56 which indicates 56% variability of income (log transformed) was explained by the composite intelligence score. It is important to note that the R-squared value of intelligence quotient regressed on income rank was 0.44, and the R-squared value of emotional awareness regressed on income rank was merely 0.11. Thus, composite intelligence score has a much stronger effect in determining potential income compared to intelligence quotient alone.
The Author's prior study reported in the multivariate regression analysis, both the intelligence quotient and emotional awareness were individually found significant [1]. In addition, the correlation coefficient between intelligence quotient and emotional awareness was also found not significant, indicating that both are measuring two different characteristics. Collectively, these findings indicate that emotional awareness modulates the effect of intelligence quotient differently. A similar finding was reported at the individual level by Cote and Miners in 2006, where EA can be more important to individuals with low IQ [3].
This effect of composite intelligence score is the hidden code that elucidates the nuanced relationship between income, intelligence quotient and emotional awareness. In a multivariate analysis, the most predictive model included four variables: intelligence quotient and emotional awareness, educational expenditure (e.g., career choice), and the corruption perception index (e.g., social injustice). All four variables were highly significant, and the model had an R-squared value of 0.73, meaning that these four variables were able to explain 73% of the variance in the income ranks. With a country’s average income depending on a countless number of inconceivable variables, it is surprising that just four variables were able to capture so much of the underlying mechanism. That's why just these four variables can be considered as the wealth code for economic success for any given nation. To examine the relationship between the intelligence quotient and emotional awareness, the tertiles of the emotional awareness and intelligence quotient sorted by income were shown in Table 4.
Table 3 shows the impact of wealth increases exponentially when emotional awareness is increased among the group with the highest intelligence quotient tertiles. Among the highest (third) quartile of intelligence quotient, the average income was $10,373, $32,473 and $31,529 for the lowest, middle and highest tertiles of emotional awareness, respectively. However, increase of income due to increase in emotional awareness is not as drastic among the group with lowest intelligence quotient. Among the lowest (first) quartile of intelligence quotient, the average income was $1,122, $1,396 and $3,886 for the lowest, middle and highest tertiles of emotional awareness, respectively. Again, there are increasing trends of income potential among the tertiles of intelligence quotient and emotional awareness separately. The average income for the lowest tertiles of intelligence quotient was $1,582 and highest tertiles was $24,792. Again, the average income for the lowest tertiles of emotional awareness was $4,312 and highest tertiles was $17,680. If all other factors are held constant in each country, this phenomenon of intelligence quotient and emotional awareness on income should also work at an individual group level.
Figure 3.
Changes in composite intelligence over time when surrounded by negative culture. The negative culture is defined by presence of jealousy, lack of democracy, high corruption, and low educational expense.
Figure 3.
Changes in composite intelligence over time when surrounded by negative culture. The negative culture is defined by presence of jealousy, lack of democracy, high corruption, and low educational expense.
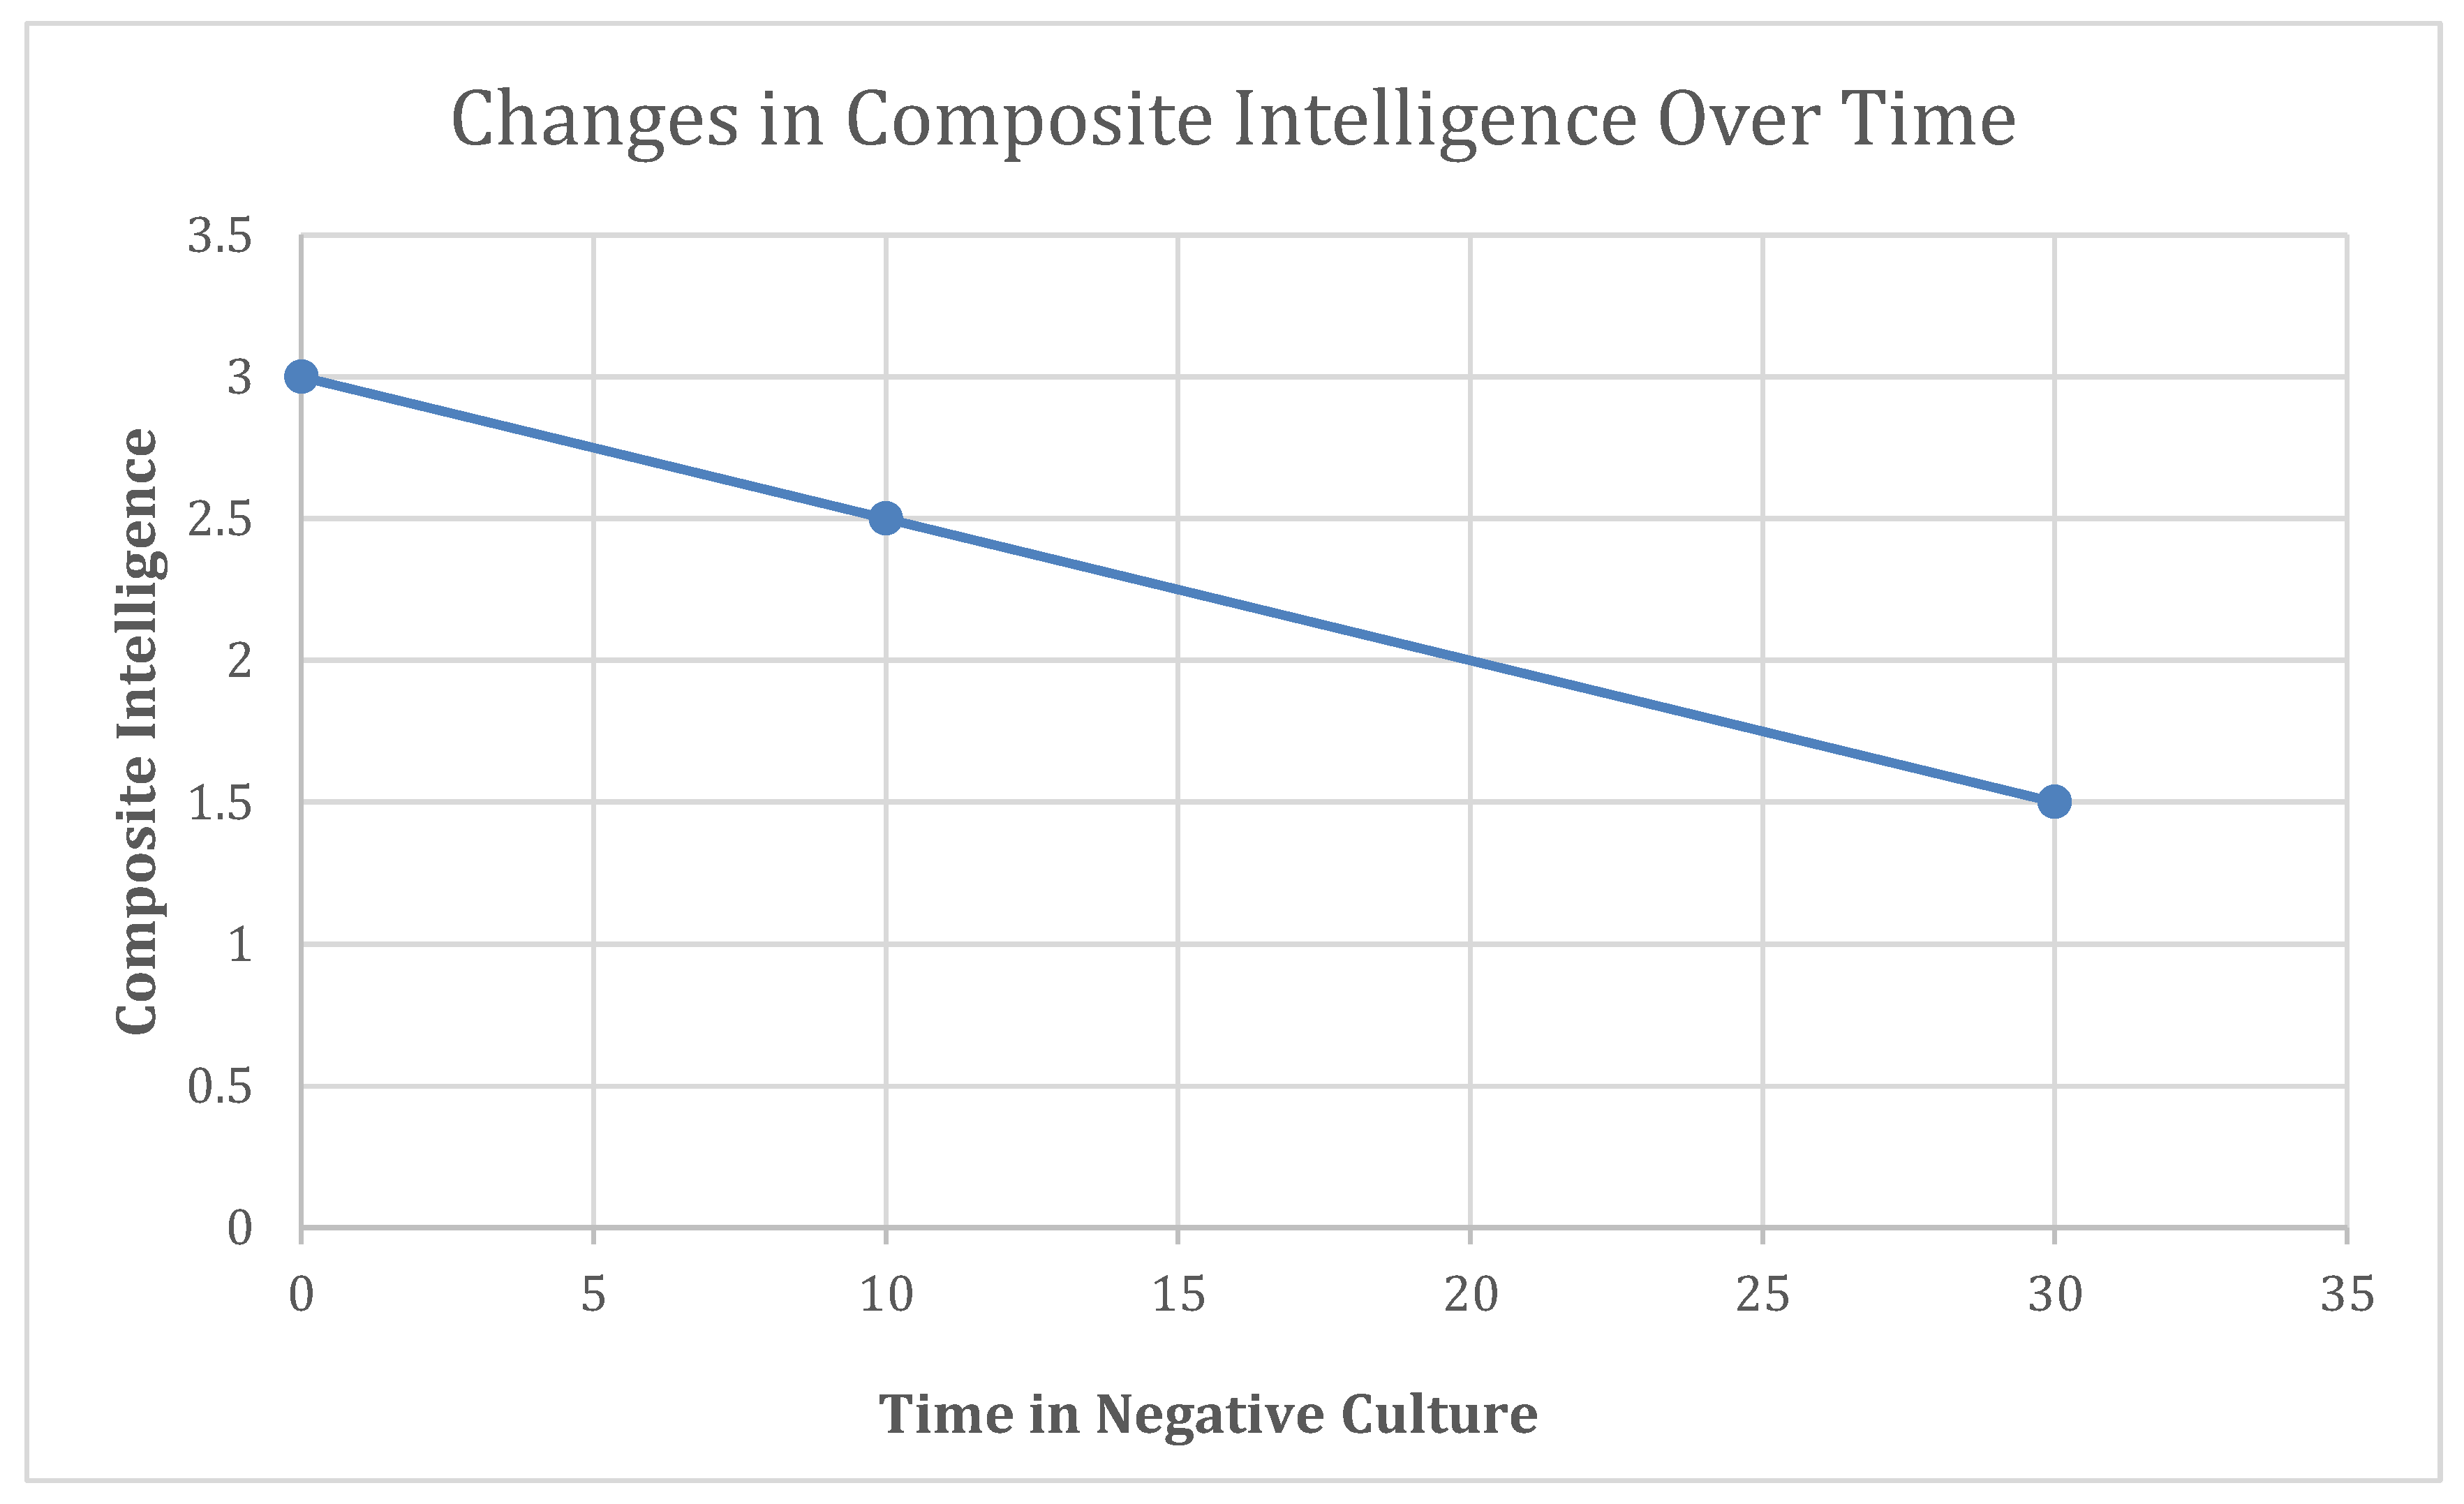
Figure 4.
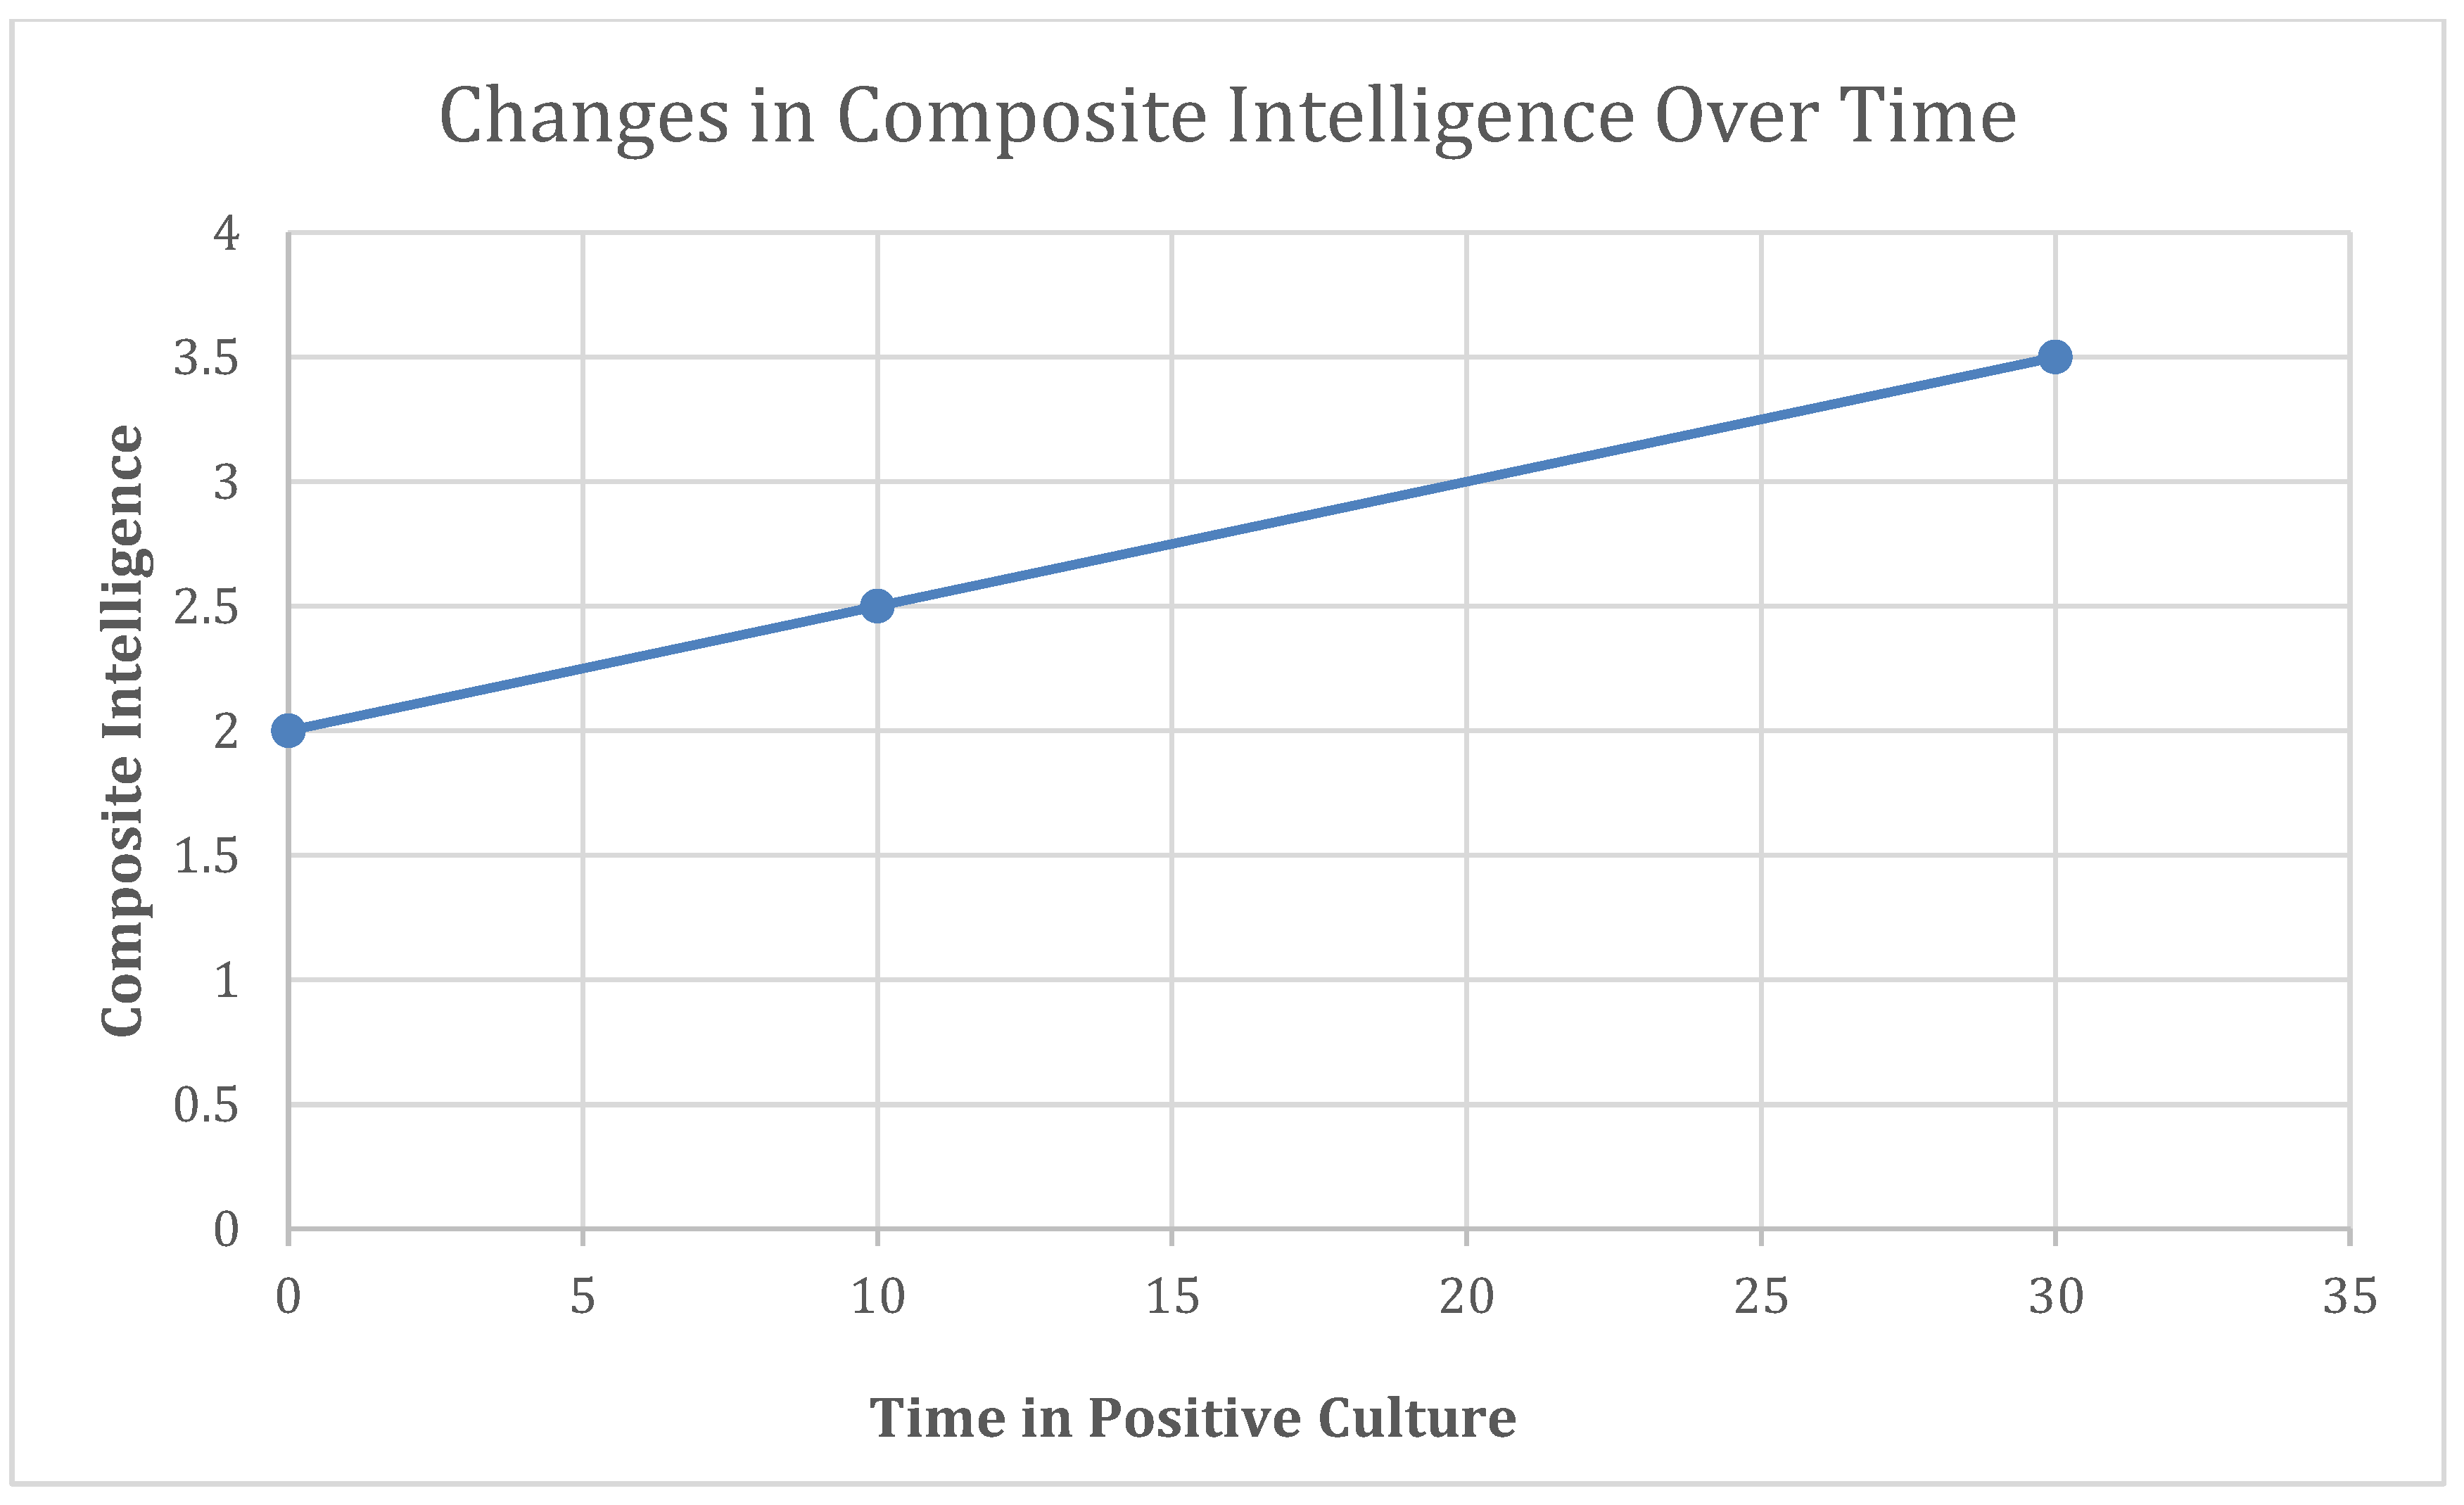
Changes in composite intelligence over time when surrounded by positive culture. A positive culture is defined by democracy, low corruption, and high educational expenses.
Figure 4.
Changes in composite intelligence over time when surrounded by positive culture. A positive culture is defined by democracy, low corruption, and high educational expenses.
4. Discussion
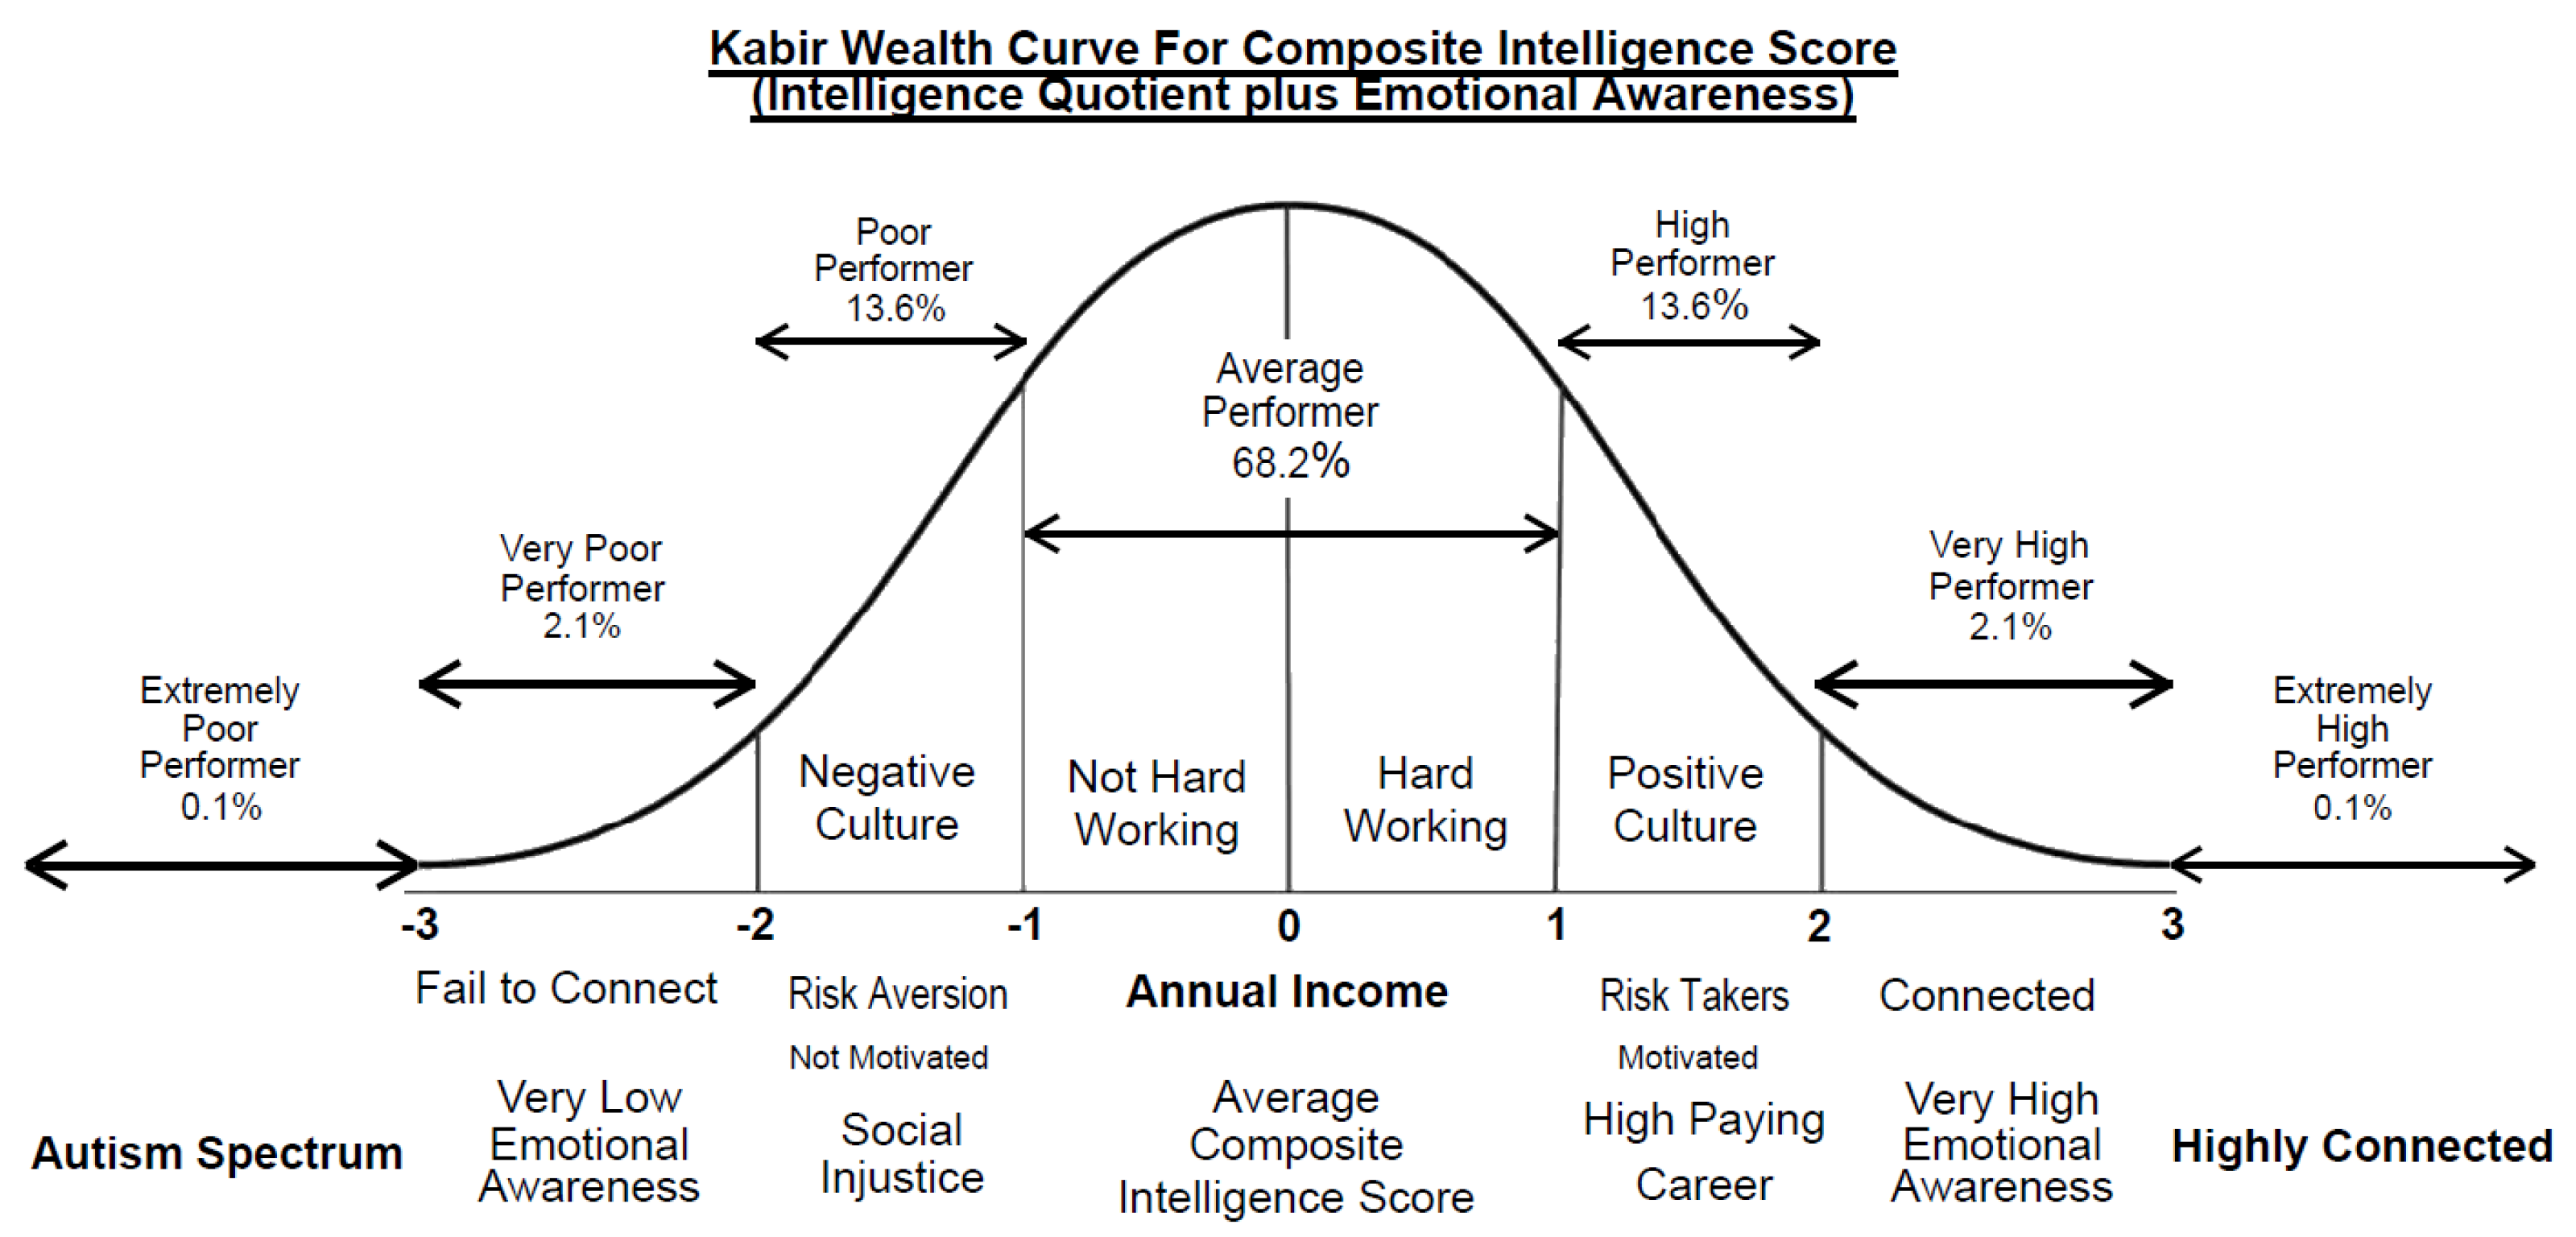
The fundamental principle used in developing the wealth curve is the assumption that a group of individuals or national annual income is normally distributed for a given value of intelligence quotient. The Kabir wealth curve assumption will hold true for any group of individuals with a given intelligence quotient where certain groups may have different scores of emotional awareness leading to different income potential. For the wealth curve, it was assumed that the extremely low emotional awareness belongs to most of the individuals within the autism spectrum (with some exception) and cannot function in society hence leading to very lower annual income. According to the Kabir wealth curve, an individual group with a higher intelligence quotient is associated with higher income even if someone has a comparatively lower emotional awareness. But for any individual group with a higher intelligence quotient, emotional awareness has a higher impact on income changes compared to changes within the lower intelligence quotient. But all the predictions about the income hold true for average performers which constitutes 68.2% of the people with the average emotional awareness for a given intelligence quotient. The authors assumed that the choice of a high paying career is usually associated with higher educational expenses and will lead to higher annual income [1]. Similarly, low, or very low performance in income is associated with social injustice because of corruption perception index [1]. The authors assume an individual group with very low emotional awareness will not be able to tackle social injustice and will lead to further deterioration of income potential [1]. The authors also assume that higher educational expenses may produce high paying jobs that may explain the variability of the income among the very high performers. The authors did not have any data to explain the effect of family inheritance, or connections but it is possible that extremely high performance (outside 95% confidence interval) on the curve may be associated with strong connections (like family inheritance, college alumni, political association, friendships, and other forms of connections etc.). Based on the above assumptions, the authors developed the Kabir wealth curve for a group of individuals or a nation with any intelligence quotient.
Risk taking behavior is the key difference between those who rise to the top versus those did not. What makes someone take higher risk than others? Risk taking behavior is a function of analytic reasoning as those with high analytic reason will take high calculated risk which can be considered as relentless risk to others (who has low analytic reasoning and fail to see future), Those with lower analytic reasoning will avoid risky bet as they will be worried about failing. It’s not gambling where people bet on luck.
Figure 5.
Principles of Kabir Wealth Curve:.
Principle 1: Emotional awareness (emotional ability to recognize and make sense of emotions) is a vehicle for how one delivers the impact of intelligence quotient (one's ability to perform, comprehend and learn). A highly autistic person cannot achieve success with low emotional awareness though autistics may have a higher intelligence quotient. Therefore, the autistics spectrum is placed to the left end of the X-axis of the bell curve.
Principle 2: Emotional awareness and intelligence quotient serves are complementary to each other, but the impact of intelligence quotient is more important on income potential compared to emotional awareness. However, the effect of emotional awareness is exponentially higher in terms of income potential among individual groups with higher intelligence quotient compared to those of lower intelligence quotient groups. To move towards the right in the X-axis of the bell curve (accumulate more wealth), individuals need to increase their emotional awareness scores.
Principle 3: A higher emotional awareness will help anyone navigate in the difficult world, building relationships and maintaining them, which is important for building wealth in the future. Individual income potential may be predicted by emotional awareness with a delay of 10 to 12 years after entering the job market [6]. It indicates long-term relationships, which are critical in building wealth over time. This may be why a cross-sectional study may not reflect income wealth relationship at the individual level due to the presence of different stages of career among study participants.
Principle 4: A lower emotional awareness will prevent anyone from surviving in an adversarial environment like social injustice leading to significantly reduced income potential. That's why countries with lower corruption perception index (positive culture) have overall lower per capita income. To move towards the right on the X-axis of the bell curve, once again, individuals must increase emotional awareness scores to navigate through social injustice.
Principle 5: An individual may have a high emotional awareness and intelligence quotient but will not succeed without everyone in society showing signs of better emotional awareness. The authors' prior study reported higher national emotional awareness is associated with lower corruption or social injustice in any given society [1]. That may be why the effect of emotional awareness and intelligence quotient is more apparent at the national level than individual level. In addition, a nation may go into a disruptive battle among fractions (leading to the reduced income potential for everyone) due to failure to resolve them unless all are equally emotionally intelligent.
Principle 6: The effect of emotional awareness on intelligence quotient will predict the income of a group of individuals but may not explain those who are incredibly successful like billionaires (those who are outside the 95% confidence interval on the X-axis). A strong discipline, connections, family inheritance, etc., may put someone ahead (on the right side of the X-axis) of others in the wealth curve.
Principle 7: A culture with a higher emotional awareness score will build a positive culture for wealth building, which is supported by better democracy, lack of corruption, and lack of jealousy leading to positive collaborative environment. But a lower average population score of emotional awareness helps build a negative culture which will prevent growth and wealth building despite having higher IQ among its population.
5. Limitations
The study could not assess the impact of emotional intelligence (emotional awareness and emotional ability to express and handle interpersonal relationships judiciously and empathically) as it used emotional awareness measurements. And health is traditionally known as wealth, and individual health problems can lead to decreased wealth. However, health is not included in the wealth curve as it is unpredictable. In addition, someone in the autistic spectrum can accumulate enormous amounts of wealth because of the extraordinary intelligence quotient. Still, in general, most of them will make the lowest income, placing them on the left end of the wealth curve X-axis.
6. Conclusion
To move towards the right on the X-axis of the Kabir wealth curve (e.g., accumulate more wealth), individuals must improve emotional awareness, stay in positive culture, connect with individual with business potential and choose a professional career path that lands higher income. Similarly, those facing social injustice can accumulate more wealth by improving emotional awareness, which will help them navigate challenging environments.
Conflict of Interest
The author has no conflict of interest to disclose.
References
- Kabir, R.A.; Nahar, J.; Sengar, R.; Kabir, A.K. Wealth Code Unlocked: The Combined Effect of Emotional Awareness (EA) and Intelligence Quotient (IQ). Preprints 2021, 2021070283. [CrossRef]
- Lynn, R., & Vanhanen, T. (2002). IQ and the wealth of nations. Praeger Publishers/Greenwood Publishing Group. Table 8.10 (page 155-156).
- Côté, S., & Miners, C. T. H. (2006). Emotional Intelligence, Cognitive Intelligence, and Job Performance. Administrative Science Quarterly, 51(1), 1–28. [CrossRef]
- Rode, J.C., Arthaud-Day, M.L., Ramaswami, A., & Howes, S. 2017. A time-lagged study of emotional intelligence and salary. Journal of Vocational Behavior, 101: 77-89. [CrossRef]
- Gallup 2019 Global Emotional Report. https://www.gallup.com/analytics/248906/gallup-global-emotions-report-2019.aspx.
- Bouchard TJ, Lykken DT, McGue M, Segal NL, Tellegen A (October 1990). "Sources of human psychological differences: the Minnesota Study of Twins Reared Apart". Science. 250 (4978): 223–8. [CrossRef]
Figure 1.
Composition of intelligence storage in human brain demonstrating three components: analytic reasoning, long term memory, and emotional control.
Figure 1.
Composition of intelligence storage in human brain demonstrating three components: analytic reasoning, long term memory, and emotional control.
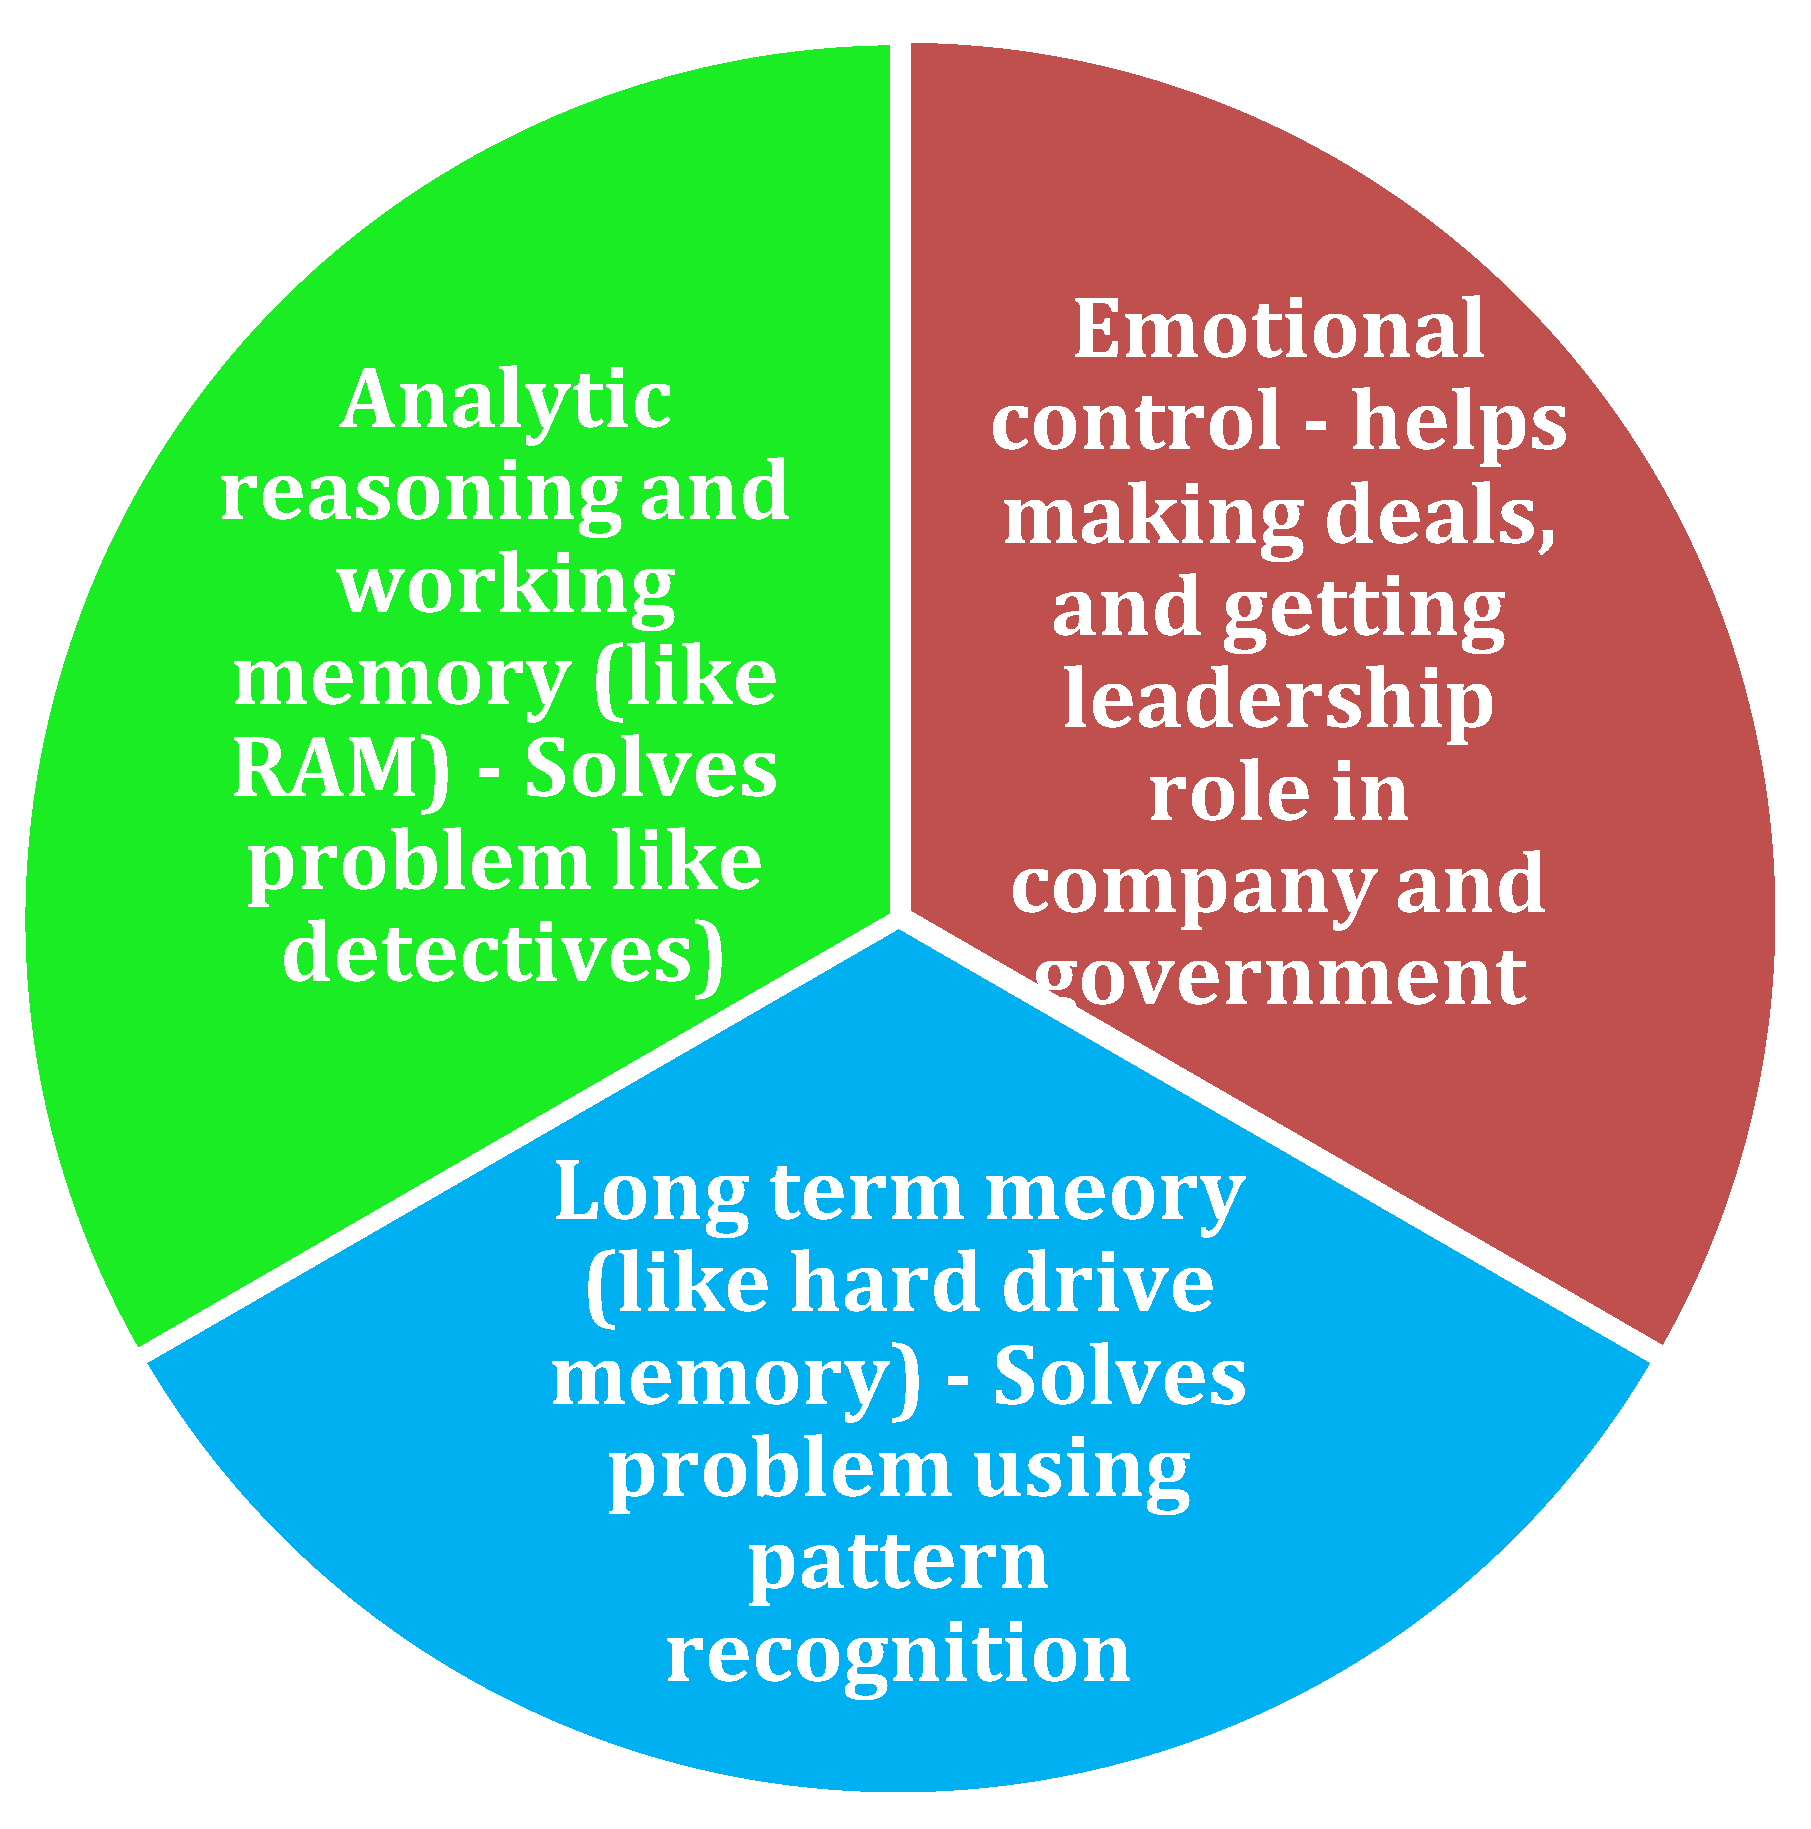
Table 3.
Factors that are considered important by different cultures during the negotiation of any financial decision making.
Table 3.
Factors that are considered important by different cultures during the negotiation of any financial decision making.
| Factors associated with wealth | Multiplier on Wealth |
Positive Culture (Western Culture) | Semi-Negative Culture | Negative Culture (Jealous Culture) |
|---|---|---|---|---|
| Paying $1 million a year potential | +1 | 5 | 10 | 10 |
| Title of the position | - 1 | 0 | 5 | 5 |
| Accept a win-win solution (BATNA)* | +1 | 5 | 0 | - 5 |
| Fear Factor (Paranoia, execution) | - 1 | 0 | 5 | 5 |
| Control on interest | + 1 | 5 | 0 | 0 |
| Prestige and glory | - 1 | 0 | 5 | 10 |
| Jealousy | - 1 | 0 | 0 | 5 |
| Total | 15 | - 5 | - 20 | |
| Cut off for accepting a financial deal | 10 | 10 | 10 |
*BATNA = Best Alternative To Negotiated Agreement (What do you get if you don’t sign the best agreement).
Table 4.
Development of the Kabir wealth curve using the pattern of wealth distribution among the tertials of emotional awareness (EA) and intelligence quotient (IQ).
Table 4.
Development of the Kabir wealth curve using the pattern of wealth distribution among the tertials of emotional awareness (EA) and intelligence quotient (IQ).
| Quartiles | EA Tertile 1 (36-46) |
EA Tertile 2 (46-49) |
EA Tertile 3 (49-54) |
Total |
|---|---|---|---|---|
|
IQ Tertile 1 (60-83) |
$1,122 (n=16) |
$1,396 (n=10) |
$3,886 (n=4) |
$1,582 (n=30) |
|
IQ Tertile 2 (83-95.5) |
$3,923 (n=9) |
$6,104 (n=4) |
$11,365 (n=11) |
$7,698 (n=24) |
|
IQ Tertile 3 (95.5-108) |
$10,373 (n=9) |
$32,473 (n=9) |
$31,529 (n=9) |
$24,792 (n=27) |
| Total |
$4,312 (n=34) |
$14,376 (n=23) |
$17,680 (n=24) |
$11,131 (n=81) |
Disclaimer/Publisher’s Note: The statements, opinions and data contained in all publications are solely those of the individual author(s) and contributor(s) and not of MDPI and/or the editor(s). MDPI and/or the editor(s) disclaim responsibility for any injury to people or property resulting from any ideas, methods, instructions or products referred to in the content. |
© 2023 by the authors. Licensee MDPI, Basel, Switzerland. This article is an open access article distributed under the terms and conditions of the Creative Commons Attribution (CC BY) license (http://creativecommons.org/licenses/by/4.0/).
Copyright: This open access article is published under a Creative Commons CC BY 4.0 license, which permit the free download, distribution, and reuse, provided that the author and preprint are cited in any reuse.


