
Submitted:
12 July 2020
Posted:
12 July 2020
You are already at the latest version
Abstract
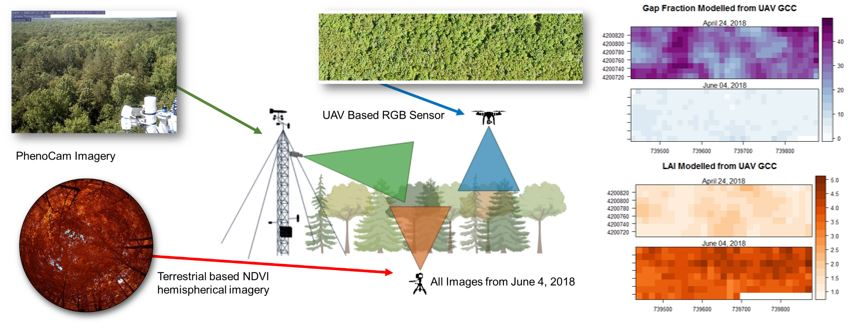
Phenology is one of the ubiquitous fingerprints of climate change on our ecosystems. Monitoring the spatiotemporal patterns of vegetation phenology is thus critical. A wide range of sensors have been used to monitor vegetation phenology. Sensor point of view and resolution can potentially impact estimates of phenology. We compared three different sensors from three different remote sensing platforms—a UAV mounted RGB camera, an under canopy, upward facing hemispherical camera with R, G and NIR capabilities, and a tower mounted RGB PhenoCam—to estimate spring phenological transition in a mixed-species temperate forest in central Virginia, USA. Our study had two objectives: 1) to compare the above- and below- canopy inference of canopy greenness (green chromatic coordinate and normalized difference vegetation index) and canopy structural attributes (leaf area and gap fraction) by matching under-canopy hemispherical photos with high spatial resolution (0.03 m) drone imagery to find the appropriate spatial coverage and resolution for comparison; 2) to compare how each sensor performed in estimating the temporality of the spring phenological transition. We find that a spatial buffer of 20 m radius for UAV imagery is most closely comparable to under-canopy imagery in this system. Sensors and platforms agree within +/- 5 days of when canopy greenness stabilizes from the spring phenophase into the growing season. This work has implications for paring UAV imagery with both tower-based observation platforms, as well as plot-based studies (e.g. long-term monitoring, existing research networks, permanent plots).
Keywords:
UAV
; forest
; ecology
; remote sensing
; phenology
; modis
; rgb imagery
; phenocam
; landsat
Copyright: This open access article is published under a Creative Commons CC BY 4.0 license, which permit the free download, distribution, and reuse, provided that the author and preprint are cited in any reuse.


