
Submitted:
26 September 2018
Posted:
26 September 2018
You are already at the latest version
Abstract
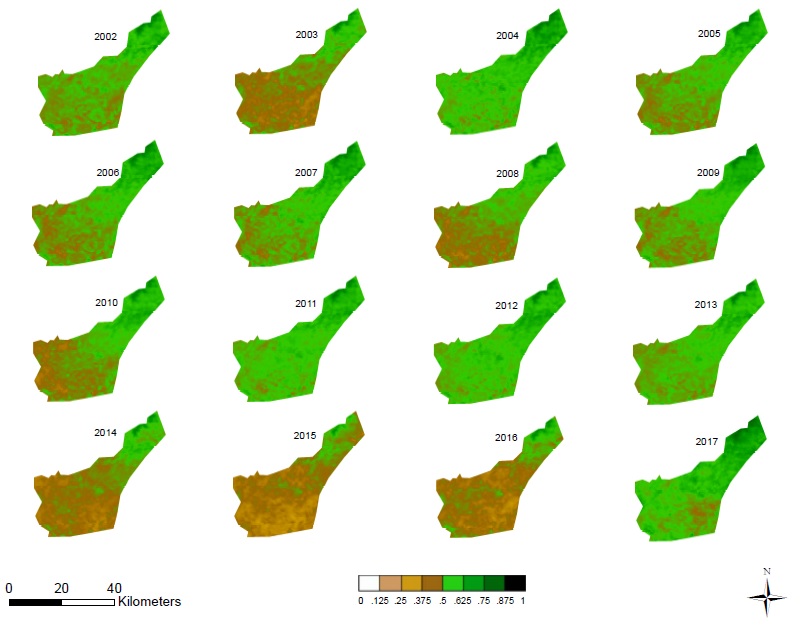
The variability of meteorological parameters such as temperature and precipitation, and climatic conditions such as intense droughts, are known to impact vegetation health over southern Africa. Thus, understanding large-scale ocean–atmospheric phenomena like the El Niño/Southern Oscillation (ENSO) and Indian Ocean Dipole/Dipole Mode Index (DMI) is important as these factors drive the variability of temperature and precipitation. In this study, 16 years (2002–2017) of Moderate Resolution Imaging Spectroradiometer (MODIS) Terra/Aqua 16-day normalized difference vegetation index (NDVI), extracted and processed using JavaScript code editor in the Google Earth Engine (GEE) platform in order to analyze the response pattern of the oldest proclaimed nature reserve in Africa, the Hluhluwe-iMfolozi Park (HiP), during the study period. The MODIS-enhanced vegetation index and burned area index were also analyzed for this period. The area-averaged Modern Retrospective Analysis for Research Application (MERRA) model maximum temperature and precipitation were also extracted using the JavaScript code editor in the GEE platform. This procedure demonstrated a strong reversal of both the NDVI and Enhanced Vegetation Index (EVI), leading to signs of a sudden increase of burned areas (strong BAI) during the strongest El Niño period. Both the Theilsen method and the Mann–Kendall test showed no significant greening or browning trends over the whole time series, although the annual Mann–Kendall test, in 2003 and 2014–2015, indicated significant browning trends due to the most recent strongest El Niño. Moreover, a multi-linear regression model seems to indicate a significant influence of both ENSO activity and precipitation. Our results indicate that the recent 2014–2016 drought altered the vegetation condition in the HiP. We conclude that it is vital to exploit freely available GEE resources to develop drought monitoring vegetation systems, and to integrate climate information for analyzing its influence on protected areas, especially in data-poor counties.
Keywords:
drought
; NDVI
; ENSO
; wavelet
; time series analysis
; Hluhluwe-iMfolozi Park
; Google Earth Engine
Copyright: This open access article is published under a Creative Commons CC BY 4.0 license, which permit the free download, distribution, and reuse, provided that the author and preprint are cited in any reuse.


