
Submitted:
16 November 2026
Posted:
19 November 2026
You are already at the latest version
Abstract
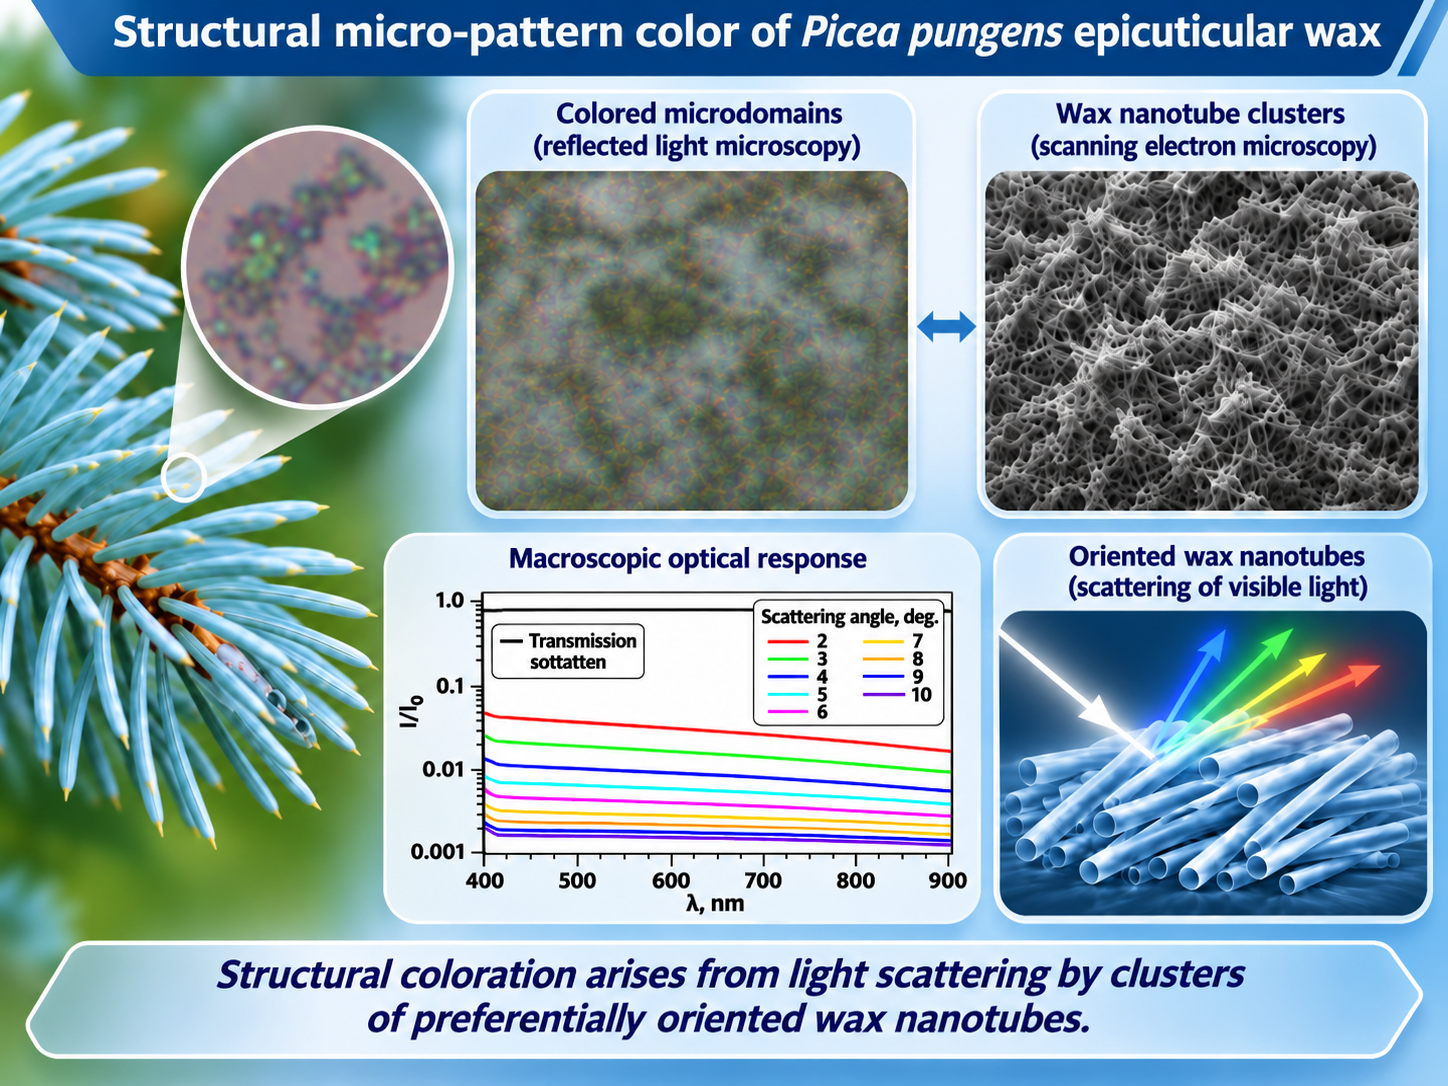
The properties of plant epicuticular waxes which are multifunctional materials governed by their chemical composition and structural organization. The latter is particularly important for the optical response of wax coatings. Here, the optical and structural properties of crystalline epicuticular wax from Picea pungens needles were investigated using optical and scanning electron microscopy. Under reflected-light scheme, we observe brightly colored microdomains ranging from red to blue, with their apparent color varying depending on the illumination and observation geometry. The wax crystallites are nanotubes that form clusters characterized by preferential nanotube alignment. A comparative analysis of optical and scanning electron microscopy of the same wax fragments revealed a relationship between microdomains coloration and the spatial organization of nanotube clusters, including their packing density and preferential orientation. Modifications to cluster morphology are accompanied by changes in the observed microdomain colors. At the macroscopic scale, the transmission and small-angle scattering spectra have neither maxima nor minima across the visible spectral range, whereas the intensity of small-angle scattered light increases towards shorter wavelengths. The results obtained may be promising for the development of natural or bio-inspired materials whose optical and spectral properties are determined by the packing density and spatial orientation of nanocrystals.
Keywords:
epicuticular wax
; Picea pungens
; disordered structural coloration
; wax crystallite clusters
; light scattering
1. Introduction
Epicuticular wax constitutes the outermost component of the cuticular coating covering the aerial organs of plants [1,2]. In addition to reducing uncontrolled water loss, epicuticular waxes contribute to protection against ultraviolet (UV) radiation, biological agents, and surface contamination [3,4,5]. Their chemical composition and morphology vary depending on the plant species and organs covered with wax, as well as plant developmental stage, and the environmental conditions [6,7]. Most plant epicuticular waxes contain long-chain aliphatic compounds [8], including alkanes, primary and secondary alcohols, ketones, aldehydes, fatty acids, and esters [2]. At the microscale, waxes can form amorphous layers or crystalline structures with various morphologies, including nanoplatelets, nanorods, and nanotubes [9]. The formation of these crystalline structures involves molecular self-assembly and crystallization processes that give rise to complex three-dimensional architectures [10]. A systematic classification of epicuticular wax morphologies identified 23 major structural types and established relationships between wax morphology and chemical composition [11].
The dimensions of individual wax crystallites along one or more directions may be comparable to the wavelengths of ultraviolet and visible radiation, making their morphology an important factor governing the optical properties of plant surfaces [12]. The optical functionality of epicuticular waxes includes several protective mechanisms that reduce the light energy reaching the underlying plant cells. One of such mechanisms lets wax coatings absorb UV radiation [5,13]. In certain cases, the UV light absorbed can be transformed into visible emission [14,15]. Another protective mechanism involves the scattering and reflecting incident light, which is particularly effective in structured crystalline wax coatings [16]. The intensity of reflected light depends on the morphology of the constituent wax crystallites, the thickness of the wax layer, and the wavelength of the incident radiation [17,18]. Blue light tends to reflect more strongly than green and red light, which contributes to the blue or whitish appearance of certain plant leaves and fruits. This phenomenon is commonly referred to as structural coloration [19,20].
Structural coloration, including that observed in plants, can arise from the interaction of light with particles whose characteristic dimensions are comparable to the light wavelength [21]. When particles exhibit long-range translational order, forming a photonic crystal, the wavelength of the reflected light depends on the particle dimensions, the spatial period of the structure, and the angle of light incidence [22]. In contrast, photonic glasses exhibit short-range order in particle arrangement and weak angular dependence of reflected color [23]. The color of a photonic glass is governed by the particle size and the refractive indices of both the constituent material and the surrounding [24].
For individual anisotropic particles, such as nanorods, nanotubes, or nanoplates, light scattering additionally depends on the orientation of the particle symmetry axis relative to the incident wave vector and on the angle between this axis and the polarization of the incident light [25,26]. Most of elementary wax crystallites have anisotropic shapes, in some cases exhibiting substantial differences between their largest and smallest dimensions [9]. For instance, the epicuticular wax crystallites of Picea pungens are tubular structures approximately 140 nm in diameter and several micrometers in length [27]. On the needle surface, these wax nanotubes form various micro clusters [28,29], which are expected to influence the reflection and scattering of light.
In the present study, we investigated the reflection micro-patterns of the epicuticular wax of Picea pungens both on the native tree needle surface and isolated onto a glass or quartz substrate. The dependence of the observed optical patterns on the illumination geometry and analyzer orientation was examined. The optical textures were analyzed in relation to the structural organization of the epicuticular wax, as revealed by scanning electron microscopy.
2. Materials and Methods
2.1. Isolation of Native Epicuticular Wax
Epicuticular wax from Picea pungens trees growing in Krasnoyarsk, Russia, was analyzed. The experiments were performed using both intact tree needles and isolated wax fragments. Wax isolation was carried out using a freeze-assisted procedure described previously [14,27]. Needles with the intact wax coatings were immersed in distilled water for 1 h. The container was subsequently placed in liquid nitrogen until the water had completely frozen. The frozen samples were then allowed to thaw slowly in water and return naturally to room temperature, resulting in the detachment of wax fragments from the needle surface. The detached wax floated to the water surface and was transferred onto solid substrates. Indium tin oxide (ITO)-coated glass substrates were used for electron microscopy, whereas quartz substrates were used for optical measurements.
2.2. Optical Microscopy and Spectroscopy
The morphology and structural coloration of isolated wax layers were examined using an Axio Imager.A1m optical microscope (Zeiss) in reflected light with a objective and interference filters centered at wavelengths of 450, 500, 550, 600, and 650 nm (Thorlabs). Observations were performed in bright-field (BF) and dark-field (DF) modes. Transmission and small-angle light scattering spectra were recorded using a CCS200 CCD spectrometer (Thorlabs), with an SLS205 xenon lamp (Thorlabs) as the light source.
2.3. Scanning Electron Microscopy
The morphology and structural organization of the wax were investigated using an SU3500 scanning electron microscope (Hitachi, Japan). The samples were mounted on an aluminum specimen holder using conductive carbon adhesive tape. To facilitate electrostatic charge dissipation from the nonconductive samples, an additional conductive bridge made of carbon tape was placed in direct electrical contact with the sample surface. The specimens were examined without conductive sputter coating under high-vacuum conditions using secondary electron detection at an accelerating voltage of 5 kV with a tungsten electron source. Detailed images were acquired at a magnification of . To assess the three-dimensional morphology of the wax structures, a tilt series of the same region was acquired by varying the specimen stage angle from to in increments.
3. Results
3.1. Micro-Pattern Color of Wax
The epicuticular wax of Picea pungens exhibits UV absorption at wavelengths nm, while no appreciable absorption is observed in the visible spectral range of 400–700 nm (Figure 1a). Under reflected-light optical microscopy, the wax exhibits micro-pattern coloration (Figure 1b,c), consistent with previous observations [27]. The microdomain colors range from red to blue, with characteristic lateral dimensions of approximately 1–m. The morphology and coloration of the microdomains are similar for wax located on the native needle surface (Figure 1b) and wax transferred onto a substrate (Figure 1c), indicating that the structural organization of the wax crystallites is preserved during wax isolation and transfer.
To investigate the origin of the observed microdomain colors, the reflected-light intensity I was measured at monochromatic light of different wavelengths. Measurements were performed on wax deposited onto a quartz substrate. The reflected-light intensities were normalized to the intensity reflected from the bare substrate, , which was approximately of the incident monochromatic light intensity. Four microdomains with distinct colors were examined: red and light green (Figure 1d), and blue and yellow (Figure 1e). The red microdomain exhibits enhanced reflection in the yellow-red spectral region, particularly at 600 nm, with a slight decrease in reflection for blue light (Figure 1d). The yellow color of the microdomain is due to the decrease in reflection for blue (450 and 500 nm) and red (650 nm) light, while reflection increases moderately for green (550 nm) light (Figure 1e). The green and blue microdomains exhibit enhanced reflection in the green and blue spectral ranges, together with substantially reduced reflection of yellow-red light (Figure 1d,e). Despite the variety of colors in the microdomains, these observations suggest that an ensemble of wax microdomains reflects blue-green light more effectively than red light. This trend is consistent with measurements of the reflected light from wax layers composed of tubular crystallites [20].
3.2. Affect Observation Geometry on Microdomain Coloration
The color of wax microdomains depends on the illumination and observation geometry, as we demonstrate later comparing optical images acquired in bright-field and dark-field modes. The numerical aperture of the objective was 0.55, corresponding to illumination and collection angles ranging from to in BF mode. The incident and collected light were within an angular range of 62– in DF mode. Switching from BF to DF mode changes the color of the microdomains from red-yellow to green-blue, and from blue to yellow-orange (Figure 2a). Although the incident light is unpolarized, the reflected and scattered light exhibits polarization-dependent intensity, as evidenced by variations in microdomain brightness upon rotation of the analyzer (Figure 2b–e). However, the microdomain colors remain nearly unchanged and correspond to those observed without an analyzer (Figure 2a), indicating that the polarization-dependent redistribution of intensity has little effect on the spectral appearance of the microdomains.
3.3. Wax Crystallites Clusters
The absence of visible-light absorption and the angular dependence of microdomain coloration indicate that the observed color is structural. Scanning electron microscopy of wax on the needle surface revealed no apparent long-range periodic arrangement of the nanotubes. At the same time, it is clear that the distribution of nanotubes on the surface of the pine needles is uneven. There are clusters that differ in the number, density, and predominant orientation of nanotubes (Figure 3) [28]. These clusters appear on both wax-covered needles (Figure 3a,b) and on needles with sparse wax distribution, which leaves part of the surface exposed (Figure 3c,d). The characteristic dimensions of these clusters range from a few micrometers to a few tens of micrometers. These clusters may correspond to the colored microdomains observed under an optical microscope.
To establish a relationship between colored microdomains and nanotube clusters, the same wax region was examined using optical and scanning electron microscopy (Figure 4a–d). SEM images were acquired at several specimen stage orientations relative to the electron beam (Figure 4d–i). The SEM images reveal that the clusters consist of microregions with a locally preferential nanotube alignment. These microregions correspond to the color microdomains observed under an optical microscope (Figure 4a–d). The microdomain color depends on both the orientation of the nanotubes relative to the observation direction and their packing density. For instance, optical microscopy colors micro areas with nanotubes that are preferentially oriented within the substrate plane light green, while areas with nanotubes tilted relative to the substrate display yellow and blue hues. Micro areas with preferential alignment of nanotubes along a single direction parallel to the substrate plane appear blue. This observation explains the blue color of the thin, elongated microdomains that connect the larger wax fragments on the surface of the tree needle (Figure 2, BF).
4. Discussion
The epicuticular wax of Picea pungens consists of nanotube crystallites several micrometers in length, with outer and inner radii of approximately 70 and 40 nm, respectively [27]. These dimensions correspond to a regime in which light scattering characteristics, including scattering efficiency and the asymmetry factor, depend strongly on the size parameter (where n is the refractive index of the nanocylinder material, a is the cylinder radius and is the wavelength of light) [25,30,31], and on the light incidence angle and the scattered direction [32,33]. Organizing nanotubes into microregions with preferential alignment increases the impact of wavelength and illumination/observation geometry on the light scattering. This provides a physical interpretation of the observed micro-pattern coloration of wax and its dependence on the preferred orientation and packing density of nanotubes. It also explains the polarization sensitivity of scattered light intensity.
The native structure of wax crystallites can be modified by exposure to the electron beam during SEM examination [34], potentially altering the morphology and, therefore, optical response of their clusters. After being exposed to an electron beam for several tens of seconds at an accelerating voltage of 5.00 kV, the dimensions of the wax clusters shown in Figure 4 decreased, accompanied by a change in the alignment of the nanotubes into microregions (Figure 5a,c). These structural changes lead to alterations in microdomain coloration, as revealed by optical microscopy (Figure 5b,d). This correspondence between morphological modification and color variation demonstrates the sensitivity of the optical response of the wax to the geometry and spatial organization of its crystallites.
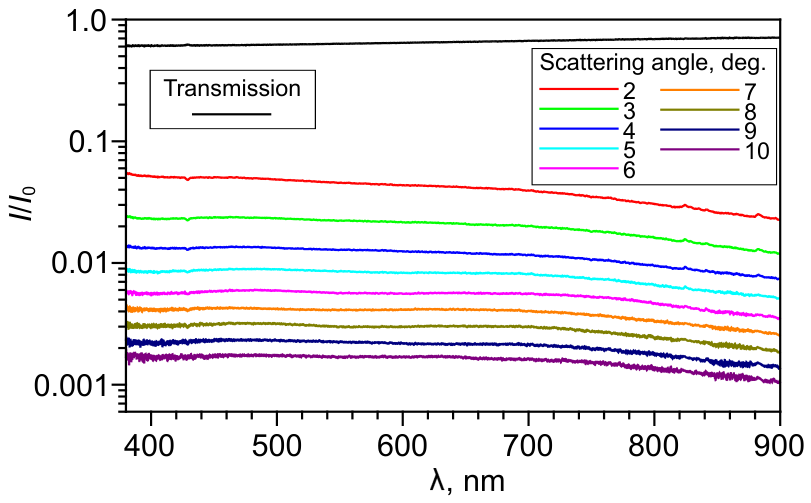
Despite the wide range of colors exhibited by individual microdomains under reflected light observation, the wax appears whitish at the macroscopic scale. Transmission and small-angle light scattering spectra measured for a wax layer deposited on a quartz substrate show no maxima or minima over the visible spectral range (Figure 6). Both the transmission and scattering spectra were normalized to the incident light intensity, . Transmission rises from to as the wavelength increases from 400 to 900 nm. On the other hand, the scattered-light intensity decreases with increasing wavelength, with the intensity at nm being approximately twice the measured at nm. Such a behavior is consistent with wavelength-dependent reflection of light by differently colored microdomains, which preferentially forward transmission of red light and enhanced reflection in the blue-green spectral region (Figure 1d,e). Thus, the local spectral selectivity of light scattering by individual wax clusters is associated with both the diversity of microdomain colors and the macroscopic optical response of the wax layer.
The investigated wax clusters are of particular interest as naturally occurring disordered optical structures whose properties are governed by the geometry and spatial arrangement of anisotropic crystallites. A related class of materials is represented by photonic glasses, in which wavelength-selective scattering originates from short-range structural correlations [23,24]. In periodic photonic structures, the spectral and angular selectivity of Bragg reflection is governed by the spatial periodicity of the dielectric medium, whereas correlated disordered structures can also exhibit pronounced structure-dependent optical responses without long-range order [35]. The significance of spatial correlations is illustrated by the structural classes and corresponding structure factors discussed in Ref. [35], as well as by disordered dielectric-rod assemblies and amorphous networks exhibiting collective photonic effects. The angle-dependent coloration of Picea pungens wax microdomains is consistent with this general relationship between structural organization and optical response, with preferential nanotube alignment introducing an additional source of scattering anisotropy. Unlike conventional photonic glasses, typically composed of spherical particles or pores, Picea pungens wax consists of nonotube crystallites assembled into microdomanes with preferential orientation. The effects of orientational order and the angle between the preferred orientation of anisotropic nanoparticles and the incident illumination direction on the scattering efficiency of two-dimensional disordered media were investigated numerically in Ref. [36]. It was shown that the integrated reflectance increased by approximately 20% as the orientational order parameter of the particles rose from 0 to 1. Meanwhile, increasing the angle between the preferred particle orientation and the direction perpendicular to the incident beam reduced the integrated reflectance by about 60%. Our results suggest that the formation of highly oriented nanocrystalline layers or clusters through controlled recrystallization of natural waxes [20,37,38,39] or the synthesis of branched alkane crystallites [40], can provide a route toward optical materials with tailored spectral and scattering characteristics. In such materials, the optical response would be determined not only by the intrinsic properties of the constituent crystallites but also by their spatial orientation and collective organization.
5. Conclusions
The relationship between the morphology of Picea pungens epicuticular wax and its structural micro-pattern coloration has been investigated using optical and scanning electron microscopy. The wax exhibits colored microdomains whose optical response depends on illumination and observation geometry. Comparative optical and SEM microscopy of the same regions revealed a relationship between microdomain coloration and the packing density and preferential orientation of wax nanotubes within clusters. Electron-beam-induced changes in cluster morphology have been accompanied by changes in microdomain coloration, further supporting the structural origin of the observed colors. Macroscopic optical measurements have revealed wavelength-dependent transmission and preferential scattering of shorter-wavelength light. These findings demonstrate the importance of the spatial organization of anisotropic wax crystallites in determining the optical properties of natural wax coatings and highlight their potential as structural templates for bio-inspired optical materials.
Author Contributions
Conceptualization, E.R.B. and M.N.K.; methodology, M.N.K.; validation, E.R.B., M.N.K.; formal analysis, E.R.B., M.N.K.; investigation, E.R.B., M.N.K., K.V.A.; data curation, E.R.B.; writing—original draft preparation, E.R.B. and M.N.K.; writing—review and editing, K.V.A., M.M.K.; visualization, E.R.B. and M.N.K.; supervision, M.M.K.; funding acquisition, M.M.K. All authors have read and agreed to the published version of the manuscript.
Funding
This work was supported by the state assignment of the Federal Research Center “Krasnoyarsk Science Center” of the Siberian Branch of the Russian Academy of Sciences. No additional grants were received for conducting or supervising this specific study.
Institutional Review Board Statement
Not applicable.
Informed Consent Statement
Not applicable.
Data Availability Statement
The raw data supporting the conclusions of this article will be made available by the authors on request.
Acknowledgments
The studies were performed on the equipment of Resource sharing centre of FRC KSC SB RAS.
Conflicts of Interest
The authors declare no conflicts of interest.
References
- Yeats, T.H.; Rose, J.K.C. The formation and function of plant cuticles. Plant Physiol. 2013, 163, 5–20. [Google Scholar] [CrossRef] [PubMed]
- Samuels, L.; Kunst, L.; Jetter, R. Sealing plant surfaces: Cuticular wax formation by epidermal cells. Annu. Rev. Plant Biol. 2008, 59, 683–707. [Google Scholar] [CrossRef] [PubMed]
- Heredia, A.; Benítez, J.J.; González Moreno, A.; Domínguez, E. Revisiting plant cuticle biophysics. New Phytol. 2024, 244, 65–73. [Google Scholar] [CrossRef] [PubMed]
- Barthlott, W.; Neinhuis, C. Purity of the sacred lotus, or escape from contamination in biological surfaces. Planta 1997, 202, 1–8. [Google Scholar] [CrossRef]
- Long, L.M.; Patel, H.P.; Cory, W.C.; Stapleton, A.E. The maize epicuticular wax layer provides UV protection. Funct. Plant Biol. 2003, 30, 75–81. [Google Scholar] [CrossRef] [PubMed]
- Tunstad, S.A.; Bull, I.D.; Rands, S.A.; Whitney, H.M. The cuticular wax composition and crystal coverage of leaves and petals differ in a consistent manner between plant species. Open Biol. 2024, 14, 230430. [Google Scholar] [CrossRef] [PubMed]
- Shepherd, T.; Wynne Griffiths, D. The effects of stress on plant cuticular waxes. New Phytol. 2006, 171, 469–499. [Google Scholar] [CrossRef] [PubMed]
- Jetter, R.; Kunst, L.; Samuels, A.L. Composition of plant cuticular waxes. In Annual Plant Reviews; John Wiley & Sons, 2006; Volume 23, pp. 145–181. [Google Scholar] [CrossRef]
- Koch, K.; Ensikat, H.J. The hydrophobic coatings of plant surfaces: Epicuticular wax crystals and their morphologies, crystallinity and molecular self-assembly. Micron 2008, 39, 759–772. [Google Scholar] [CrossRef] [PubMed]
- Koch, K.; Neinhuis, C.; Ensikat, H.J.; Barthlott, W. Self assembly of epicuticular waxes on living plant surfaces imaged by atomic force microscopy (AFM). J. Exp. Bot. 2004, 55, 711–718. [Google Scholar] [CrossRef] [PubMed]
- Barthlott, W.; Neinhuis, C.; Cutler, D.; Ditsch, F.; Meusel, I.; Theisen, I.; Wilhelmi, H. Classification and terminology of plant epicuticular waxes. Bot. J. Linn. Soc. 1998, 126, 237–260. [Google Scholar] [CrossRef]
- Gorb, E.V.; Kozeretska, I.A.; Gorb, S.N. Hierachical epicuticular wax coverage on leaves of Deschampsia antarctica as a possible adaptation to severe environmental conditions. Beilstein J. Nanotechnol. 2022, 13, 807–816. [Google Scholar] [CrossRef] [PubMed]
- Sobti, B.; Alnuaimi, K.J.J.; Alneyadi, D.S.B.; Almheiri, O.O.E.; Alefari, M.A.M. Characterization and bioactive potential of epicuticular wax from date fruits. Emir. J. Food Agric. 2024, 36, 1–6. [Google Scholar] [CrossRef]
- Bukhanov, E.; Gurevich, Y.; Krakhalev, M.; Shabanov, D. Modeling optical properties of plant epicuticular wax. In Proceedings of the 2020 International Conference on Information Technology and Nanotechnology (ITNT); IEEE, 2020; pp. 1–7. [Google Scholar] [CrossRef]
- Jacobs, J.F.; Koper, G.J.M.; Ursem, W.N.J. UV protective coatings: A botanical approach. Prog. Org. Coat. 2007, 58, 166–171. [Google Scholar] [CrossRef]
- Das, A.; Polacchi, L.; Fouron, J.Y.; Montaux-Lambert, A.; Billon, L.; Luengo, G.S. Biomimetic UV photo-protection of skin surface by structured epicuticular wax films. Mater. Today Bio 2025, 33, 101991. [Google Scholar] [CrossRef] [PubMed]
- Peters, R.D.; Noble, S.D. Characterization of leaf surface phenotypes based on light interaction. Plant Methods 2023, 19, 26. [Google Scholar] [CrossRef] [PubMed]
- Reicosky, D.A.; Hanover, J.W. Physiological effects of surface waxes: I. Light reflectance for glaucous and nonglaucous Picea pungens. Plant Physiol. 1978, 62, 101–104. [Google Scholar] [CrossRef] [PubMed]
- Nobusawa, T.; Okamoto, T.; Nakano, M.; Kusaba, M. Structural coloration and epicuticular wax properties of the distinctive glaucous leaves of Encephalartos horridus. J. Exp. Bot. 2025, 76, 3577–3592. [Google Scholar] [CrossRef] [PubMed]
- Middleton, R.; Tunstad, S.A.; Knapp, A.; Winters, S.; McCallum, S.; Whitney, H.M. Self-assembled, disordered structural color from fruit wax bloom. Sci. Adv. 2024, 10, eadk4219. [Google Scholar] [CrossRef] [PubMed]
- Chen, G.; Hong, W. Mechanochromism of structural-colored materials. Adv. Opt. Mater. 2020, 8, 2000984. [Google Scholar] [CrossRef]
- Vignolini, S.; Moyroud, E.; Glover, B.J.; Steiner, U. Analysing photonic structures in plants. J. R. Soc. Interface 2013, 10, 20130394. [Google Scholar] [CrossRef] [PubMed]
- Xiao, M.; Stephenson, A.B.; Neophytou, A.; Hwang, V.; Chakrabarti, D.; Manoharan, V.N. Investigating the trade-off between color saturation and angle-independence in photonic glasses. Opt. Express 2021, 29, 21212–21224. [Google Scholar] [CrossRef] [PubMed]
- Demirörs, A.F.; Manne, K.; Magkiriadou, S.; Scheffold, F. Tuning disorder in structurally colored bioinspired photonic glasses. Soft Matter 2024, 20, 1620–1628. [Google Scholar] [CrossRef] [PubMed]
- Mishchenko, M.I.; Travis, L.D.; Macke, A. Scattering of light by polydisperse, randomly oriented, finite circular cylinders. Appl. Opt. 1996, 35, 4927–4940. [Google Scholar] [CrossRef] [PubMed]
- Ramirez-Cuevas, F.V.; Gurunatha, K.L.; Parkin, I.P.; Papakonstantinou, I. Universal theory of light scattering of randomly oriented particles: A fluctuation-electrodynamics approach for light transport modeling in disordered nanostructures. ACS Photonics 2022, 9, 672–681. [Google Scholar] [CrossRef] [PubMed]
- Bukhanov, E.R.; Shefer, A.D.; Shabanov, A.V.; Gurevich, Y.L.; Krakhalev, M.N. Structure, optical and spectral characteristics of epicuticular wax of blue spruce needles. Sib. J. For. Sci. 2024, 97–106. [Google Scholar] [CrossRef]
- Reicosky, D.A.; Hanover, J.W. Seasonal changes in leaf surface waxes of Picea pungens. Am. J. Bot. 1976, 63, 449–456. [Google Scholar] [CrossRef]
- Coward, J.L. A method for selective isolation and aggregation of epicuticular wax nanotubes in Picea pungens. Flora 2007, 202, 462–470. [Google Scholar] [CrossRef]
- Bashkatova, T.A.; Bashkatov, A.N.; Kochubey, V.I.; Tuchin, V.V. Light-scattering properties for spherical and cylindrical particles: A simple approximation derived from Mie calculations. Proceedings of the Saratov Fall Meeting 2000: Optical Technologies in Biophysics and Medicine II SPIE 2001, Vol. 4241, 247–259. [Google Scholar] [CrossRef]
- Cao, L.; Fan, P.; Barnard, E.S.; Brown, A.M.; Brongersma, M.L. Tuning the color of silicon nanostructures. Nano Lett. 2010, 10, 2649–2654. [Google Scholar] [CrossRef] [PubMed]
- Novitsky, A.V. Matrix approach for light scattering by bianisotropic cylindrical particles. J. Phys. Condens. Matter 2007, 19, 086213. [Google Scholar] [CrossRef]
- Novitsky, A.; Ramanovich, M.; Novitsky, D.V. Operator effective medium approximation for inhomogeneous and curvilinear media. Phys. Rev. B 2023, 108, 205401. [Google Scholar] [CrossRef]
- Takehara, S.; Takaku, Y.; Suzuki, H.; Ohta, I.; Shimomura, M.; Hariyama, T. A NanoSuit successfully protects petals of cherry blossoms in high vacuum: Examination of living plants in an FE-SEM. Sci. Rep. 2018, 8, 1685. [Google Scholar] [CrossRef] [PubMed]
- Vynck, K.; Pierrat, R.; Carminati, R.; Froufe-Pérez, L.S.; Scheffold, F.; Sapienza, R.; Vignolini, S.; Sáenz, J.J. Light in correlated disordered media. Rev. Mod. Phys. 2023, 95, 045003. [Google Scholar] [CrossRef]
- Jacucci, G.; Bertolotti, J.; Vignolini, S. Role of anisotropy and refractive index in scattering and whiteness optimization. Adv. Opt. Mater. 2019, 7, 1900980. [Google Scholar] [CrossRef]
- Bhushan, B.; Jung, Y.C.; Niemietz, A.; Koch, K. Lotus-like biomimetic hierarchical structures developed by the self-assembly of tubular plant waxes. Langmuir 2009, 25, 1659–1666. [Google Scholar] [CrossRef] [PubMed]
- Koch, K.; Dommisse, A.; Barthlott, W. Chemistry and crystal growth of plant wax tubules of lotus (Nelumbo nucifera) and nasturtium (Tropaeolum majus) leaves on technical substrates. Cryst. Growth Des. 2006, 6, 2571–2578. [Google Scholar] [CrossRef]
- Dora, S.K.; Koch, K.; Barthlott, W.; Wandelt, K. Kinetics of solvent supported tubule formation of lotus (Nelumbo nucifera) wax on highly oriented pyrolytic graphite (HOPG) investigated by atomic force microscopy. Beilstein J. Nanotechnol. 2018, 9, 468–481. [Google Scholar] [CrossRef] [PubMed]
- Ikedou, K.; Yamamoto, H.; Nagashima, H.; Nemoto, N.; Tashiro, K. Crystal structures of n-alkanes with branches of different size in the middle. J. Phys. Chem. B 2005, 109, 10668–10675. [Google Scholar] [CrossRef] [PubMed]
Figure 1.
Absorption spectrum of Picea pungens wax dissolved in chloroform (a). Bright-field reflected-light images of wax on a Picea pungens needle (b) and on a quartz substrate (c). Relative reflected-light intensities () measured at wavelengths of 450, 500, 550, 600, and 650 nm for red and green (d) and blue and yellow (e) wax microdomains.
Figure 1.
Absorption spectrum of Picea pungens wax dissolved in chloroform (a). Bright-field reflected-light images of wax on a Picea pungens needle (b) and on a quartz substrate (c). Relative reflected-light intensities () measured at wavelengths of 450, 500, 550, 600, and 650 nm for red and green (d) and blue and yellow (e) wax microdomains.
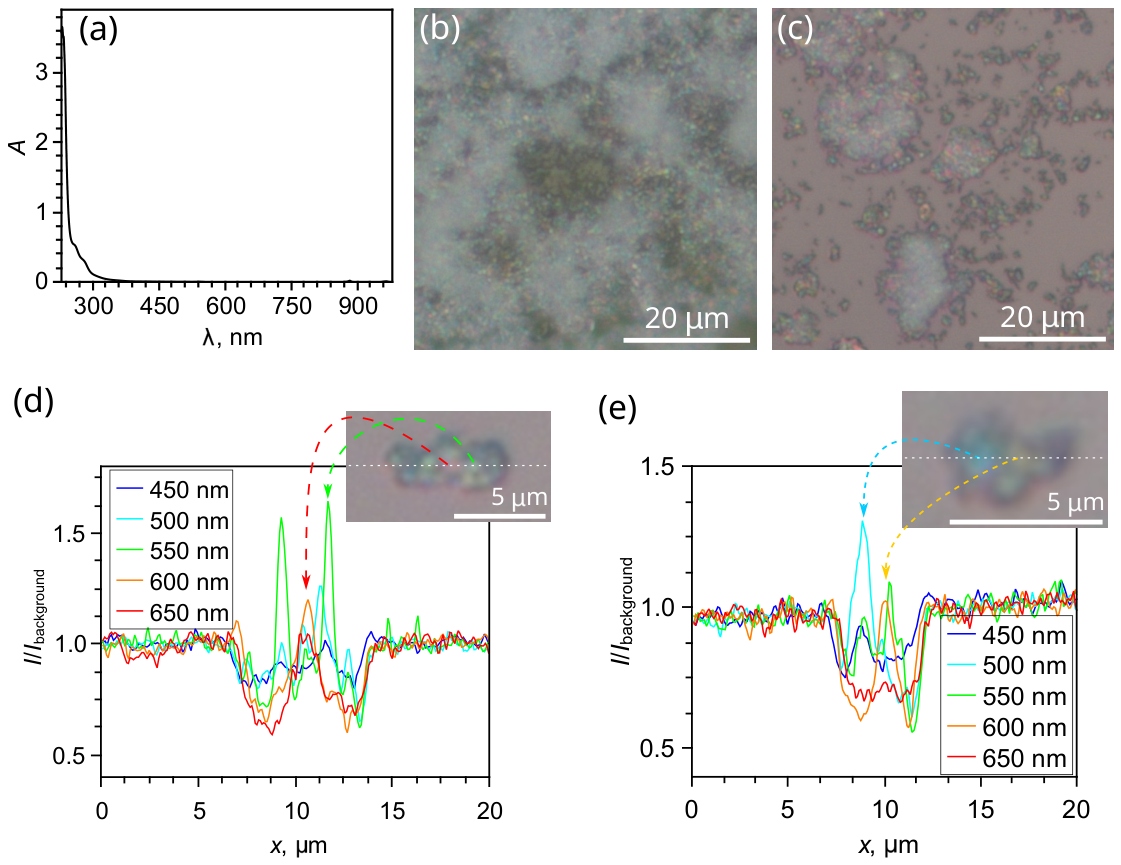
Figure 2.
Reflected-light optical images of wax on a tree needle are taken in bright-field (BF) and dark-field (DF) modes without an analyzer (a), and with analyzer orientations of (b), (c), (d), and (e). The inset shows a magnified region indicated by the red dashed square. The analyzer’s orientation is indicated by the double white arrow.
Figure 2.
Reflected-light optical images of wax on a tree needle are taken in bright-field (BF) and dark-field (DF) modes without an analyzer (a), and with analyzer orientations of (b), (c), (d), and (e). The inset shows a magnified region indicated by the red dashed square. The analyzer’s orientation is indicated by the double white arrow.
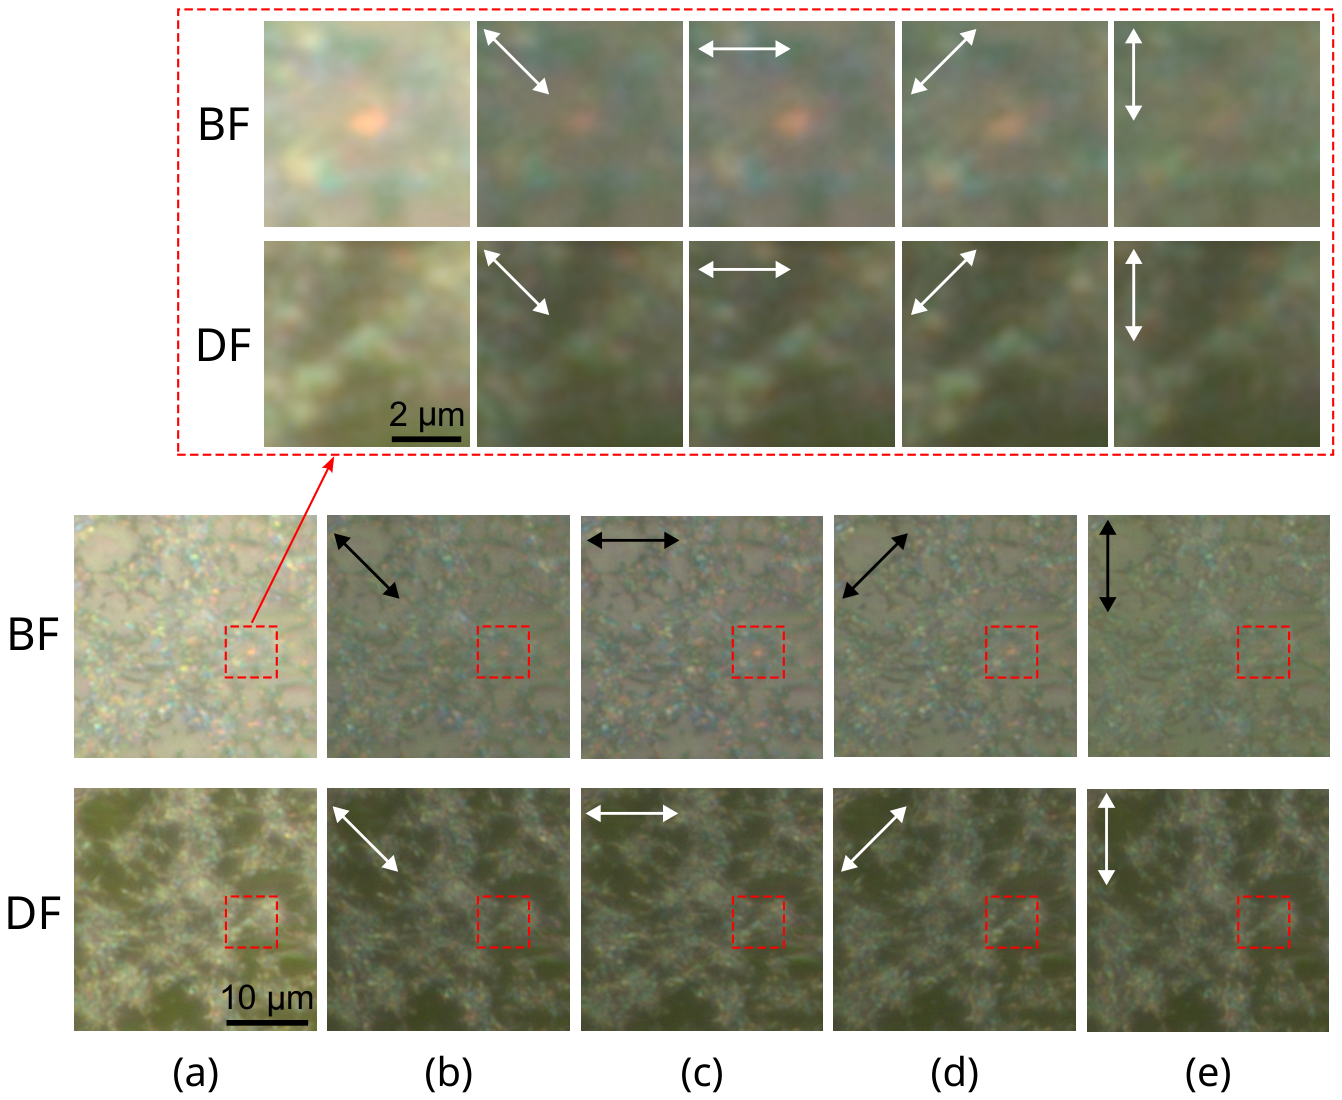
Figure 3.
SEM images of a densely wax-covered region on a Picea pungens needle (a,b) and a region with sparse wax coverage (c,d).
Figure 3.
SEM images of a densely wax-covered region on a Picea pungens needle (a,b) and a region with sparse wax coverage (c,d).
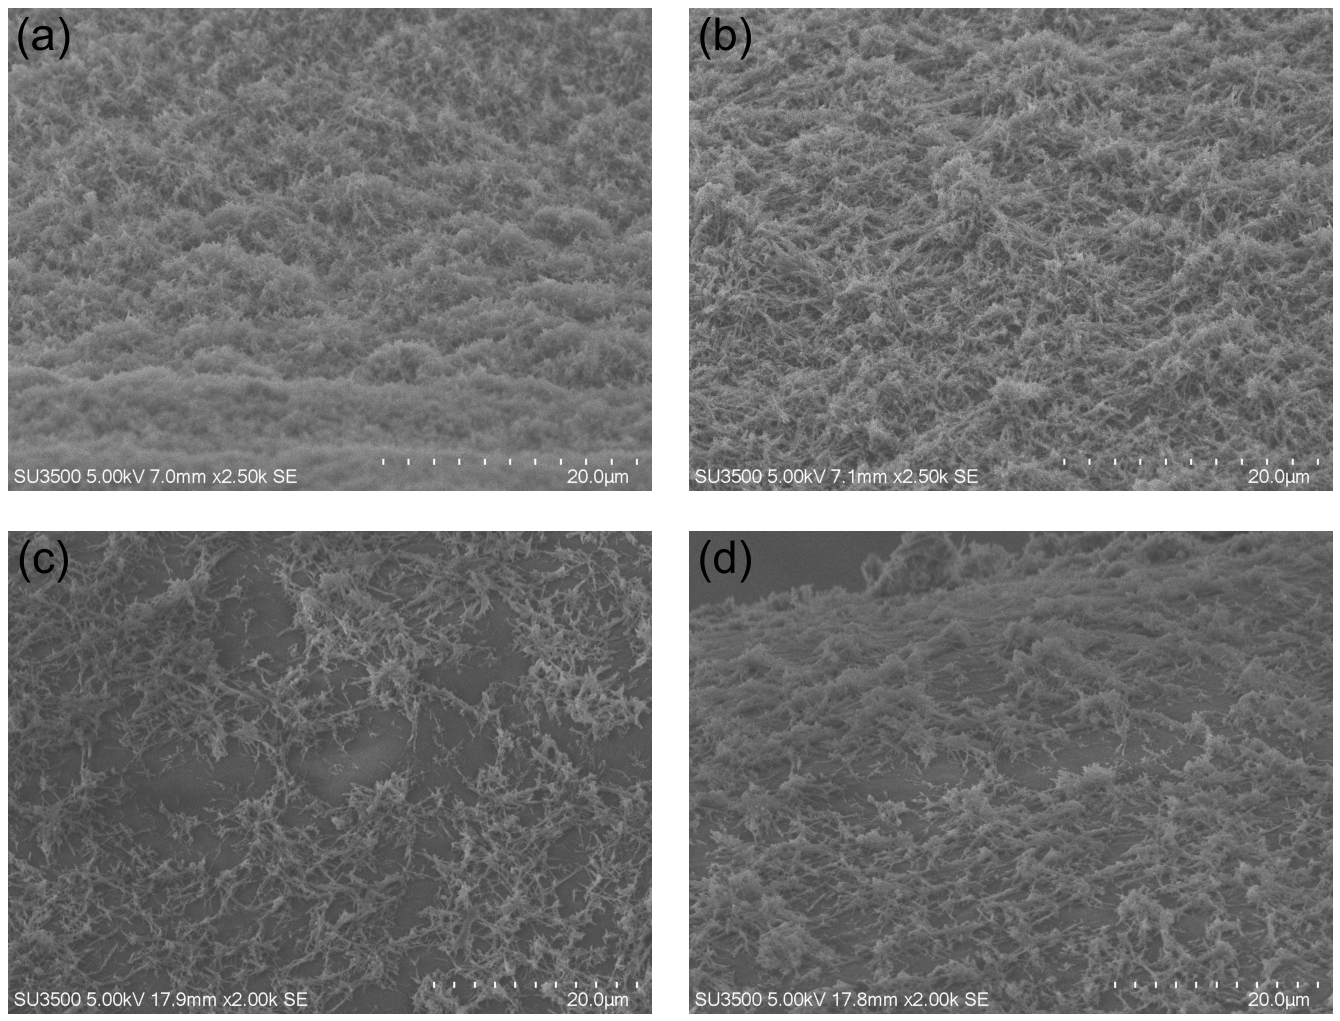
Figure 4.
Superposed optical and SEM images of the same wax area on ITO-coated glass (a–d). The optical image is superimposed on the SEM micrograph with opacities of (a), (b), (c), and (d). SEM images are taken at specimen stage tilt angles of (d), (e), (f), (g), (h), and (i).
Figure 4.
Superposed optical and SEM images of the same wax area on ITO-coated glass (a–d). The optical image is superimposed on the SEM micrograph with opacities of (a), (b), (c), and (d). SEM images are taken at specimen stage tilt angles of (d), (e), (f), (g), (h), and (i).
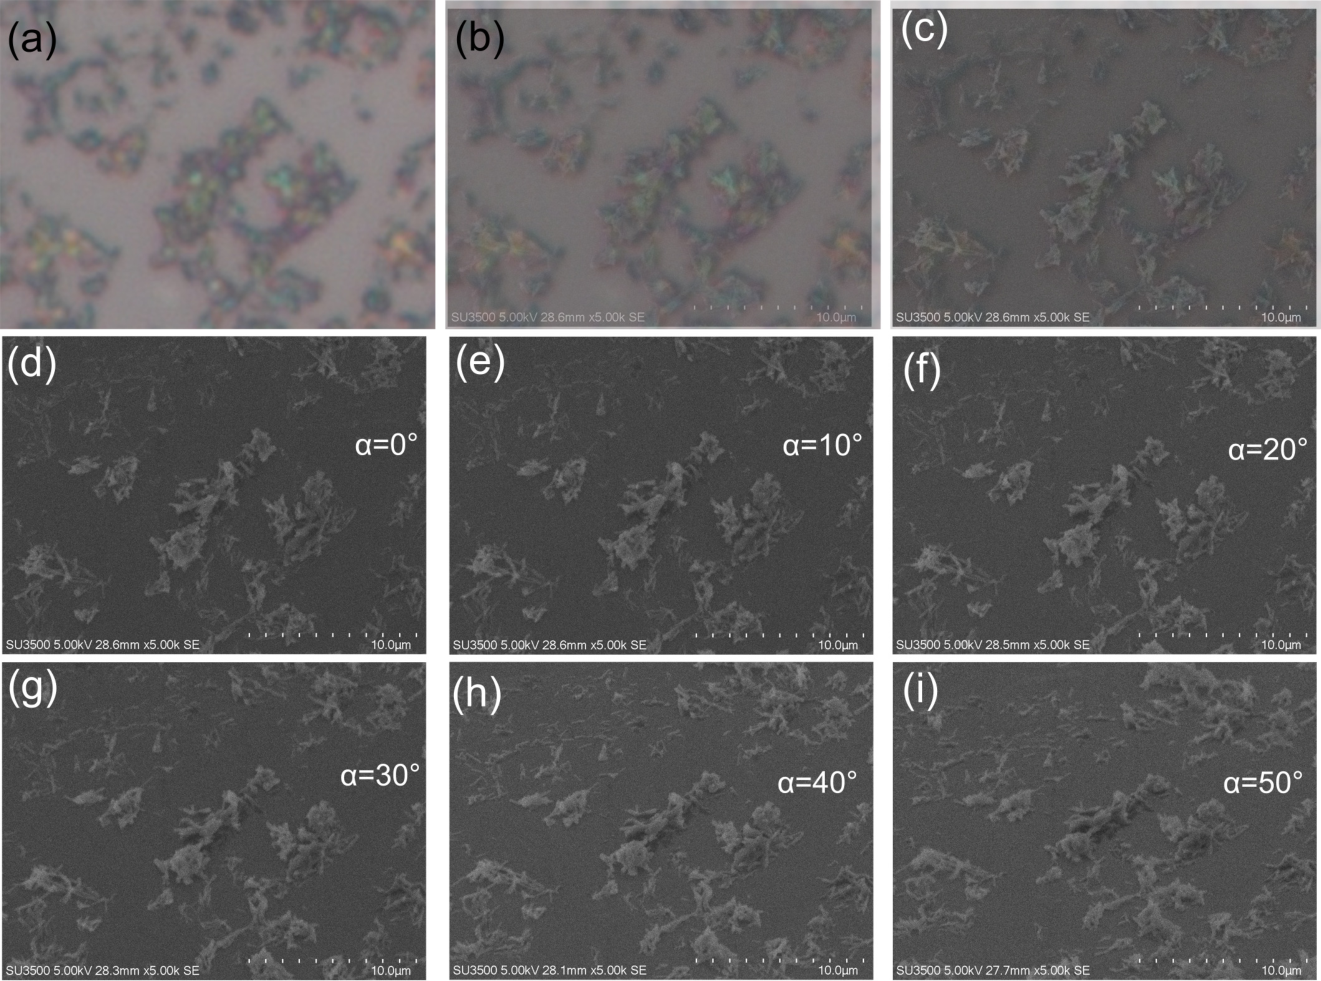
Figure 5.
SEM images of a wax-covered region on ITO-coated glass before (a) and after (c) electron-beam exposure. Optical images of the same region are taken before (b) and after (d) electron-beam exposure.
Figure 5.
SEM images of a wax-covered region on ITO-coated glass before (a) and after (c) electron-beam exposure. Optical images of the same region are taken before (b) and after (d) electron-beam exposure.
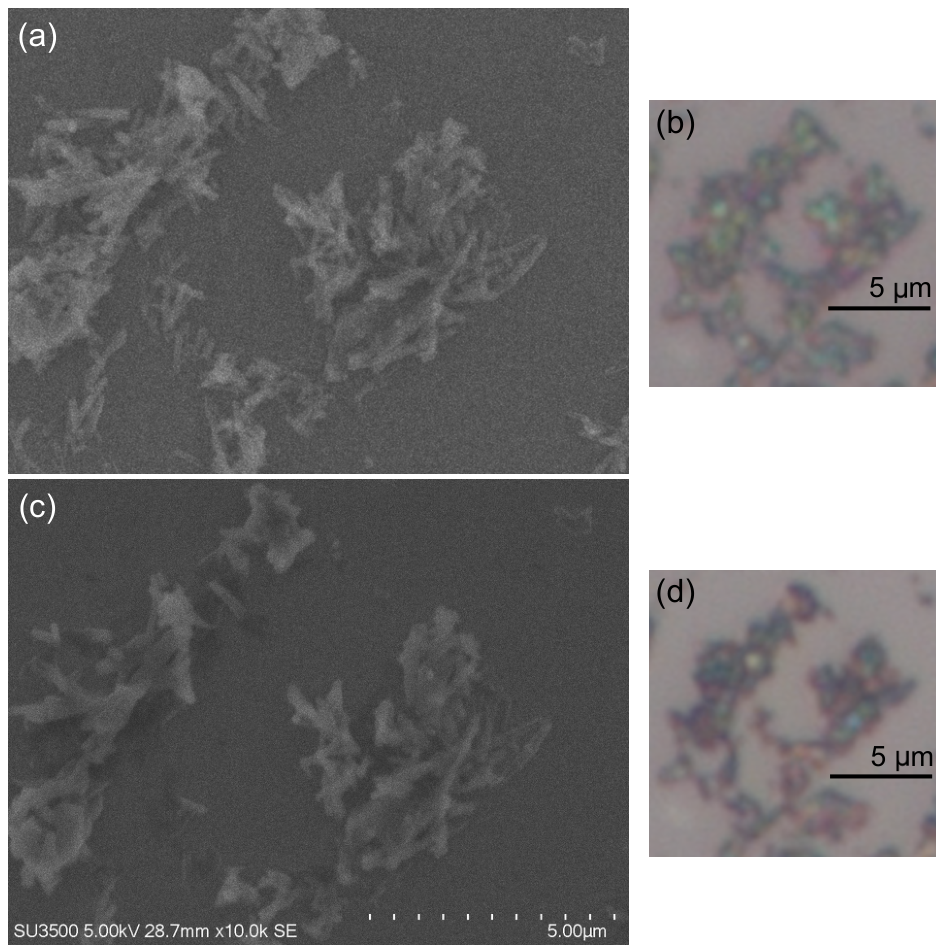
Figure 6.
Transmission and small-angle light scattering spectra of Picea pungens wax deposited on a quartz substrate.
Figure 6.
Transmission and small-angle light scattering spectra of Picea pungens wax deposited on a quartz substrate.
Disclaimer/Publisher’s Note: The statements, opinions and data contained in all publications are solely those of the individual author(s) and contributor(s) and not of MDPI and/or the editor(s). MDPI and/or the editor(s) disclaim responsibility for any injury to people or property resulting from any ideas, methods, instructions or products referred to in the content. |
© 2026 by the authors. Licensee MDPI, Basel, Switzerland. This article is an open access article distributed under the terms and conditions of the Creative Commons Attribution (CC BY) license.
Copyright: This open access article is published under a Creative Commons CC BY 4.0 license, which permit the free download, distribution, and reuse, provided that the author and preprint are cited in any reuse.