
Submitted:
13 November 2026
Posted:
18 November 2026
You are already at the latest version
Abstract
This focused critical review examines how pavement roughness, surface texture, and road classification relate to reported energy outcomes in battery-electric road vehicles. The evidence set comprises 55 publications—including original investigations, methodological comparators, reviews, conference proceedings, and datasets—purposively assembled from existing project records rather than selected through formal systematic screening. Studies are compared by pavement exposure, vehicle type, energy-accounting boundary, measured or simulated outcome, and validation target. Skar et al. report a 3.4% increase in normalized energy for each 1 m/km increase in the International Roughness Index (IRI), but this outcome is not directly measured battery-terminal electricity. Jonas et al. calculate energy from measured battery current and voltage across functional road classes without isolating pavement roughness. Beckers et al. estimate tire and suspension energy dissipation using a model validated for suspension motion on a diesel bus and subsequently applied to a battery-electric bus. Wang et al. (2023) and Singh et al. (2025) model losses associated with road irregularities rather than directly measure roughness-related battery-pack energy demand. The 704% figure reported by Singh et al. concerns modeled mechanical dissipation; the corresponding electricity estimates depend on an assumed drivetrain efficiency. Two related publications from 2025–2026 share tire finite-element model specifications, raising questions about study independence. Earlier pavement–electric-vehicle reviews also limit claims of originality. Differences in pavement exposure, energy-accounting boundaries, and validation prevent the derivation of a defensible pooled roughness-to-battery-energy coefficient from this evidence set. This article is a focused critical review, not a completed PRISMA systematic review.
Keywords:
pavement roughness
; battery-electric vehicles
; road surface texture
; rolling resistance
; suspension energy dissipation
; energy consumption
; model validation
; critical review
1. Introduction
The transition from internal-combustion vehicles to battery-electric road vehicles changes how vehicle energy use is measured and modeled, but does not remove the mechanical interaction between tires, suspensions and road surfaces. Road-induced rolling resistance, vertical motion and wheel slip are physically relevant to propulsion energy demand. Their contribution, however, can be estimated at different points in the energy pathway. Power dissipated in a suspension damper is not necessarily equal to the additional electrical energy drawn from a traction battery, because drivetrain conversion efficiency, regenerative braking, auxiliary loads and operating conditions intervene.
Pavement-related energy questions therefore require more than a comparison of reported percentage changes. Surface roughness may be represented by the International Roughness Index (IRI), measured longitudinal elevation profiles or synthetic roughness classes. Texture may be represented using different surface metrics, while rolling resistance can be measured through tires, whole-vehicle coast-down tests or indirectly identified model parameters. These exposures and outcomes are not interchangeable. A study quantifying tire rolling-resistance coefficients may support a physical mechanism without demonstrating a battery-electricity saving or change in driving range.
Prior reviews have already examined pavement–electric-vehicle interactions and pavement rolling resistance [1,2]. The original full text of Mattinzioli et al. [1] synthesizes pavement loading, EV-related energy mechanisms, operating costs and environmental effects in a 25-year research roadmap; Sun et al. [2] review asphalt-pavement rolling-resistance factors and measurement approaches. A later review also addresses pavement roughness, energy and emissions [3]. Therefore, this manuscript does not claim to be the first pavement–EV review or to have discovered all relevant research gaps. Its bounded contribution is a structured comparison of where road exposure is specified, where mechanical or electrical energy is quantified, which validation targets are supported, and whether seemingly similar numerical effects are physically commensurable.
Existing primary work illustrates why this distinction is necessary. Skar and colleagues compared standardized road-profiler measurements with a normalized traction-energy measure calculated from connected electric vehicles and reported a positive association with IRI [4]. Their normalized quantity should not be recast as direct battery-terminal energy. Wang, Besselink and Nijmeijer instead constructed a whole-vehicle battery-energy model including surface-dependent rolling resistance and tested model predictions against road-driving observations, without establishing a calibrated IRI-to-battery-electricity effect [5]. Beckers and colleagues investigated bus suspension-damper dissipation on road profiles including simulated ISO 8608 classes; the reported dissipation is a mechanical-model result and is not itself a measured increment in traction-battery consumption [6]. These studies address complementary, but not numerically identical, questions.
The purpose of this focused critical review is to interpret the existing 55-publication evidence set through explicit pavement-exposure, vehicle-type, energy-boundary and validation distinctions. The previously drafted full systematic-review protocol is preserved in the project record, but this manuscript does not claim that the full identified record set has been screened.
Figure 1 provides a conceptual view of the mechanisms by which road condition may alter vehicle losses. The effect on measured battery electricity must be established separately, after controlling for operating conditions; grade, inertia and aerodynamic drag in the schematic are general road-load terms, not effects caused by pavement roughness.
1.1. Review Questions
Primary review question: Within the fixed set of 55 previously identified publications, what can be concluded about pavement characteristics and battery-electric vehicle energy use when original measurement boundaries, model assumptions and validation strength are separated?
- Which quantified pavement measures and road-profile models have been applied to battery-electric vehicles?
- At what energy-system boundary are outcomes measured or modeled: tire or suspension, traction or motor, or battery electricity?
- How have studies controlled speed, road grade, acceleration, weather, vehicle load, tire state and repeated observations?
- How strong is the supporting verification, calibration, independent validation, uncertainty reporting and transferability evidence?
2. Methods
2.1. Review Design and Reporting Boundary
This paper is a focused, non-exhaustive critical review of 55 purposively assembled publications from prior database searches and source curation. The bibliography includes five additional records used for reporting guidance, published corrections or related methodological comparison, but these are not five extra independently appraised studies. The search histories were not reconciled into a verified screening flow. Independent eligibility screening, a PRISMA flow diagram and exhaustive full-text quality appraisal were not completed; therefore, neither systematic-review completeness nor PRISMA 2020 compliance is claimed [7,8].
2.2. Scope and Relevance Criteria (Not Formal Systematic Screening)
Analytic relevance, not formal screening eligibility: this review prioritizes original research on road-going battery-electric vehicles with quantified pavement roughness, surface texture/profile or standardized road excitation and a quantitative mechanical or electrical energy outcome. The fixed reference pool additionally contains supporting tire, suspension and driving-energy methods, road-type comparators, contextual reviews and datasets. A supporting paper is not recast as directly eligible BEV roughness–battery evidence merely because it is among the 55 references.
Exposure: A quantitatively measured or explicitly specified pavement longitudinal roughness, IRI, road elevation profile, macrotexture, surface texture or recognized road-roughness profile/class (for example, ISO 8608). Road category, traffic, slope or a generic use of the word “roughness” alone does not demonstrate a qualifying exposure.
Outcome: A quantified outcome physically linked to the defined exposure. Outcomes may include battery electrical energy, motor or traction energy/power, tire rolling-resistance quantities, suspension dissipation and road-induced slip losses, but will be classified separately by measurement boundary. Studies of suspension-energy recovery will be separated from studies of losses; recovery potential will not be equated with measured battery savings.
The available prior search log identifies a final discovery date of 6 November 2026. The purposively assembled review includes earlier and recent research; publication-date and language-access limitations are described as interpretive constraints, not as formal eligibility exclusions.
2.3. Information Sources and Search Strategy
Earlier project records document literature discovery using Scopus TITLE-ABS-KEY searches, with search expressions reproduced in Appendix A. The original native exports, exact export settings and final cross-database record counts have not been independently reconciled for this focused review. Accordingly, the source-search history describes how papers were found, not a reproducible, exhaustive selection process yielding 55 studies.
The prior project also searched TRID; however, a native export and complete Scopus–TRID deduplication audit were not independently available for this manuscript. Historical retrieval and duplicate figures remain internal audit information, not formal PRISMA identification or screening counts. Future conversion to a systematic review would require retrieval of the native exports, dated interface filters, deduplication logs and full documented eligibility decisions.
The complete Scopus and TRID Boolean expressions are provided verbatim in Appendix A for reproducibility and historical provenance. The two search histories document broad literature discovery; they were not retrospectively used as formal inclusion decisions for the purposively consolidated 55-reference set.
Methodological safeguard: no historical source-retrieval or screening total is presented here as a verified systematic-review count. Reproducing a search expression does not validate a past export or demonstrate screening completeness.
2.4. Record Management and Screening
The fixed comparison bibliography contains 55 purposively assembled publications from earlier searches, citation tracking and curated source records. This is not a documented eligibility-screened yield from a fully reconciled database search.
Preliminary AI-assisted triage and a small number of earlier screening notes were retained for audit purposes only. They are not independent dual-reviewer assessment, a completed single-reviewer eligibility process or a formal screened yield. The unit of synthesis in this focused review is the identifiable publication, with original findings, reviewer arithmetic and interpretation recorded separately.
2.5. Data Extraction and Engineering Quality Appraisal
For original-source appraisal, extraction fields include vehicle/test unit; quantitative pavement exposure and measuring instrument; observed or simulated sample; outcome definition, energy accounting boundary and units; operating conditions; source page/table/figure; validation target; uncertainty and confounding; and study-family independence. Author statements, independently calculated quantities and critical interpretations are kept separate. Eight qualitative appraisal domains cover road-input fidelity, vehicle/tire/suspension characterization, boundary correctness, confounding, arithmetic verification, validation outcome, study independence/uncertainty, and reporting transparency. This targeted follow-up checked specific original-text claims in [4,6,9,10,11,12,13,14,15,16] and [1]; it is not a claim of comprehensive full-text critical appraisal of all 55 papers.
The review distinguishes original full texts, accepted manuscripts, publisher abstracts, bibliographic records and secondary indexes. A correct DOI is not confirmation of a paper’s numerical results or independent study family. Targeted source checks examined the BEV-related vehicle and road input models [9,10], suspension-validation transfer [6], field road exposure and normalized energy [4], regenerative recovery [11], measured BEV electricity by road category [12], rolling-resistance testing [13,14] and FE tire-model lineage [15,16]. Similar model inputs are treated as a possible dependence signal, not misconduct or duplicate findings. The corrected full text of [17] and complete original chapter text of [18] were not available for exhaustive numerical appraisal; no alternative publication is substituted for them.
2.6. Narrative Synthesis and Reference Roles
A structured narrative comparison was performed within the fixed 55-publication pool. Papers were allocated to five roles: closest pavement–EV evidence (11), tire rolling resistance/road load (12), suspension losses/recovery (12), EV energy measurement/modeling (12) and reviews/methods/context (8). The 11 close-to-topic cases are examined in greater detail; the remaining 44 help explain mechanisms, measurement validity and prior review coverage. No effect-size pooling is attempted because exposures, vehicles, outcome boundaries and model validations differ materially. The role-group reference map in Section 3.10 identifies where the other 44 papers inform the interpretation; topic-level reference use is not evidence that all 44 underwent full-text critical appraisal.
Bibliographic and access checks extend over the 55-reference comparison set, but the depth differs. Four merged source bundles now support a targeted original-full-text methods-and-claims check for [4,6,9,10,11,12,13,14,15,16] and [1]. The source register differentiates full original text from alternative publications, corrections and metadata-only records. It does not establish that all 55 unique studies are supplied, independently appraised or eligible under a complete systematic-review protocol. The analysis below preserves author-reported energy quantities and their measurement or simulation boundaries.
2.7. Outcome-Boundary Harmonization and Effect Comparability
For comparison, extracted outcomes were grouped by the physical boundary at which they were measured or calculated: (i) traction-battery-terminal electrical energy, (ii) motor or wheel traction energy and power, and (iii) intermediate tire, wheel-slip, suspension or other mechanical dissipation. Each value retained its author-reported units, distance or time normalization, source of measurement or simulation, and conversion assumptions. Changes in rolling-resistance coefficient, modeled damper loss and battery Wh/km were not pooled as equivalent outcomes.
Pavement exposure was classified as measured IRI, measured texture or macrotexture, measured road elevation, simulated PSD/ISO 8608 profile, or a categorical road description. Vehicle type, speed, grade, acceleration, tire state, temperature, loading and repeated-trip dependence were considered as potential confounders or effect modifiers. The evidence did not meet the comparability conditions needed for quantitative pooling.
Figure 2 defines the accounting boundaries used for comparing studies. In particular, accessory electricity is not wheel traction, and gross energy recovered at a damper cannot be equated to net battery savings.
2.8. Review Preparation and Audit Trail
Earlier database searches informed discovery, followed by purposive selection and targeted full-text appraisal. The underlying search exports and cross-source reconciliation were not verified for this article, and database retrieval totals are not converted into formal screening statistics. Internal extraction and source-to-claim records preserve known limitations and corrections.
Automated suggestions and human review notes were used only for prioritization and verification. They are not claimed as independent formal screening. Uncertain records were not treated as excluded solely because of preliminary automated labels.
2.9. Prescreening Data-Quality Safeguards
A prescreening quality-control review found cases where provisional automated document-type or relevance labels were insufficiently supported by the recorded metadata. Those records were returned to an uncertain state pending human inspection rather than treated as excluded studies. This conservative correction is documented in the internal audit and does not establish formal title/abstract screening or a systematic included-study count.
Exact-title matching and identifier normalization helped detect distinct records, repeated reports and false-negative exclusion risks during preliminary source triage. Where publication status, original-source access or study independence was uncertain, the claim was retained with an explicit limitation instead of assuming that a missing record represented a negative finding.
2.10. AI-Assisted Review Preparation and Human Verification
OpenAI ChatGPT-5.5 supported search-term suggestions, bibliographic triage, provisional study notes, numerical spot checks, synthesis organization, drafting and language revision, and preparation of conceptual figures. Suggested claims and calculations were treated as provisional and checked selectively against accessible primary-source materials, with relevant verification limitations acknowledged. AI-assisted work was not used for formal independent screening, original experimentation or independent peer review. The sole author is responsible for checking, revising and approving all final claims, citations and figures, and retains full responsibility for the manuscript's scientific content.
2.11. Source Corrections, Study Independence and Arithmetic Verification
Targeted full-text checks across four uploaded PDF batches distinguished measured battery energy, normalized driving-energy residuals, coastdown or rolling-resistance evidence, simulated mechanical dissipation, and device-level recovered electricity. Published corrections were considered for [19] and [20]. For [17], publisher version history confirms a June 2026 change to Table 1 images and a Greek symbol in the Table 3 caption, without establishing a numerical-result correction. The original [18] conference chapter remains paywalled, but its publisher abstract describes route-wise BEV energy comparisons across urban, rural and motorway conditions, drawing on onboard diagnostics, calculations based on traction-battery capacity and grid electricity, and GPS information; detailed methods and numerical effect sizes are not independently checked. Possible study-family overlap was noted for [21] and a later article, and model-parameter similarity for [15] and [16]. Numerical spot checks recalculated selected reported slopes and unit conversions without substituting reviewer estimates for authors’ data. The separately maintained source-to-claim audit records these qualifications; no supplementary Tables S1–S3 are asserted for this manuscript. The work remains incomplete where original corrected full texts or independent model reruns were unavailable.
3. Findings — Engineering Evidence from the Focused Corpus
The five reference-role categories describe organization of the fixed corpus, not database-screening or final eligibility strata.
3.1. Recorded Search-Ledger Provenance (Not PRISMA Counts)
Earlier Scopus and TRID discovery records informed the purposive source library, but complete native exports and reconciled database-screening records were not independently available for this article. No retrieval, deduplication or PRISMA study-selection totals are reported as verified results. Appendix A records the historical search expressions and their limitations.
3.2. Exploratory Evidence Map — Examples Only
Early critical reading of selected primary reports suggests that studies differ considerably in their road-input definition and energy-system boundary (Table 1). This targeted mapping illustrates why the review needs boundary-aware synthesis. These reports were read or indexed outside the formal selection sequence and should not be described as the complete, systematically included evidence base [4,5,6,9,10,12,17].

Table 1.
Representative source examples comparing pavement exposure, BEV energy outcome and the permissible inference. Illustrative source mapping, not a formally screened set of studies.
Table 1.
Representative source examples comparing pavement exposure, BEV energy outcome and the permissible inference. Illustrative source mapping, not a formally screened set of studies.
| Primary study | Pavement exposure and BEV | Physical energy outcome | Evidence boundary / caution |
|---|---|---|---|
| Skar et al. (2023) [4] | Measured IRI; BEV field fleet | Normalized traction-energy residual | 3.4% per +1 m/km IRI reported for normalized metric; not battery DC kWh. |
| Wang et al. (2017) [5] | Road-surface rolling-resistance classes; BEV | Whole-BEV battery-energy prediction | DC battery observations support validation; no paired measured IRI exposure. |
| Beckers et al. (2025 online) [6] | Simulated ISO 8608 A–D; model applied to BEB after validation on diesel bus | Modeled combined vertical tire/suspension dissipation at 40 km/h | 0.0027–0.17 kWh/km are modeled mechanical losses. Validation checks diesel-bus suspension motion; no measured BEB battery penalty. |
| Jonas et al. (2022) [12] | Categorical road functional classes; BEV passenger cars | Onboard battery voltage/current; electricity per mile | Road type includes speed/traffic effects; no calibrated IRI, pavement texture or roughness causal coefficient. |
| Wang et al. (2023) [9] | Simulated non-stationary road roughness; EV | Simulated damper-power and driving-wheel slip-energy losses from a 7-DOF half-EV model | Original full text now checked ([9], §§3–6); synthetic nonstationary road input, not battery-pack field metering. |
| Singh et al. (2025) [10] | Synthetic 1-km road profiles, IRI 1.03/1.74/2.84 m/km; 21-DOF semitrailer model | Modeled road-induced mechanical dissipation; efficiency-converted roughness-specific electricity | Original full text checked ([10], Figure 5, Figure 12, Table 2); 704% pertains to modeled dissipation, not measured total pack energy. |
| Gravante et al. (2026) [17] | Measured pavement texture/roughness; BEV | Measured tire rolling resistance | June 2026 version corrects Table 1 images and Table 3 caption symbol; original quantitative coefficients are not independently verified. |
A high-value engineering question emerging from these close-to-topic examples is whether calibrated same-trip pavement roughness and battery-terminal electricity have been quantified together under adequate control of grade, speed, tire state and driving behavior. This focused corpus cannot establish the presence or absence of such studies across the entire literature; it motivates a specified future validation design.
3.3. Regenerative-Suspension Energy: An Analytically Separate Exploratory Strand
Some original electric-vehicle studies quantify electricity recovered from suspension motion rather than energy dissipated in passive dampers. Such studies were prespecified as a separate mechanism in the internal protocol because gross generator output cannot be equated with net battery-electricity savings. Preliminary source inspection identified model-based IRI scenarios, simulated ISO 8608 roughness classes, and controlled shock-absorber bench tests [11,22,23,24]. The studies in Table 2 are identification-stage examples only; no final eligibility or appraisal judgments have been made.
In a 2026 simulation study available in the supplied source collection, Demir and Savran report modeled recovery for ISO 8608 Class A and B roads of 57.1 and 70.4 Wh over 1 km at 2 km/h, respectively [11, Table 5 and Table 6]. The corresponding tabulated modelled vehicle consumption is 29.6 Wh over 1 km for each road class. This numerical comparison identifies an energy-boundary verification requirement: gross suspension-generation energy for Class B exceeds the separately listed vehicle consumption at that speed. It does not show that a battery was recharged by 70.4 Wh/km in real driving or that net traction electricity fell by that amount. Although the source describes electromechanical damping feedback and compares its longitudinal model against an NEDC reference, this does not independently validate harvested output or demonstrate battery-level energy-balance closure. Traction-power feedback, generator and storage losses, and actual net pack delivery therefore remain unverified.
For comparison, Abdelrahman et al. report simulated RMS generator power of 1.84 W on ISO Class A and 6.34 W on Class B at 50 km/h in an electric-bus regenerative-damper study; a separate prototype test yielded 10.29 W peak at 12 mm and 3 Hz [23]. An earlier experimental regenerative device generated 6.591 W average under a 7.5 mm, 2.5 Hz sinusoidal bench excitation [24]. These watt values describe device-level performance under distinct conditions, not metered BEV pack demand. A new original-full-text check of Vergura [22] finds three modeled IRI scenarios and small cumulative electrical-energy outputs; the numerical and validation boundaries are appraised below. No cross-study pooling is defensible on this evidence.
Table 2.
Regenerative suspension studies and their reported energy quantities. Simulated or device-level recovery does not establish net traction-battery savings.
Table 2.
Regenerative suspension studies and their reported energy quantities. Simulated or device-level recovery does not establish net traction-battery savings.
| Study | Road / excitation input | Authors’ quantitative boundary | Evidence qualification |
|---|---|---|---|
| Vergura (2020) [22] | IRI = 2, 5, 11 m/km; three simulated road categories | Max cumulative load output = 2.507, 21.247, 59.100 J (paper Table 3) | Full-text checked; J are generator-load simulation output, NOT Wh/km or battery savings |
| Demir & Savran (2026) [11] | ISO 8608 A and B, 2 km/h | Modeled gross recovery, 57.1 vs 70.4 Wh/km | Gross recovery 57.1/70.4 Wh/1 km vs separately modeled 29.6 Wh/1 km; no measured net pack effect |
| Abdelrahman et al. (2024) [23] | ISO A vs B, 50 km/h; separate bench | Modeled RMS output, 1.84 vs 6.34 W | Peak bench power 10.29 W under 12 mm / 3 Hz; not net battery |
| Abdelrahman et al. (2023) [24] | Bench sinusoid 7.5 mm, 2.5 Hz | Measured generator output, 6.591 W average | Electric-bus road validation and specific pavement-effect estimate absent |
3.4. Quantitative Verification and Energy-System Boundary Checks
Two original full texts were re-examined against the numerical results reported in their source tables. Vergura [22, Table 2 and Table 3] assigned three modeled roads IRI values of 2, 5 and 11 m/km. Maximum cumulative electrical energy at the external shock-absorber load was reported as 2.507, 21.247 and 59.100 W s, respectively (1 W s = 1 joule). Independent unit conversion yields 0.000696, 0.005902 and 0.016417 Wh per reported modeled case. The roughest-to-smoothest model-output ratio is 59.100/2.507 = 23.57. These values are not measured electricity entering a BEV traction battery, and the published data do not establish a full-vehicle net electrical benefit.
Demir and Savran [11, Table 5 and Table 6] simulated two ISO 8608 road classes over 1-km journeys. At 2 km/h, the authors reported modeled gross suspension energy recovery of 57.1 Wh (Class A) and 70.4 Wh (Class B), a difference of 13.3 Wh. The separately tabulated longitudinal-vehicle consumption at the same speed was 29.6 Wh for both classes. The numerical quotient 70.4/29.6 = 2.38 compares two separately tabulated modeled outputs; it is neither a conversion efficiency nor a measured net energy balance. The reported recovery exceeding modeled propulsion consumption flags a system-boundary reconciliation question, not a demonstrated battery-energy gain. This comparison warrants verification of any traction-power penalty due to road excitation, generator losses, system-level feedback and actual storage. It does not by itself violate energy conservation or demonstrate net pack recharge.
The latter study also compared its longitudinal virtual-BEV consumption with a cited NEDC reference of 0.1175 kWh/km: the simulated value was 0.1167 kWh/km, a reviewer-calculated absolute relative difference of 0.68% [11, p. 346]. This supports agreement with that reference driving-cycle metric, not independent validation of suspension-harvesting electricity, road roughness attribution, or battery-terminal energy savings. The former study is IRI-defined; the latter uses prescribed ISO 8608 PSD classes. The exposure metrics and reported outcomes are not quantitatively interchangeable.
These independent arithmetic checks are described to clarify the reported energy boundaries; they are not meta-analytic pooled estimates.
Each numeric inference is limited to its author-reported physical energy boundary and investigated scenario; unverified measurements are not inferred from modeled quantities.
3.5. Comparability of Pavement Exposures, Energy Boundaries and Validation Evidence
A cross-study engineering comparison of six methodologically distinct primary research examples was undertaken as an exploratory quality-control exercise (Table 3). The observations do not constitute the results of PRISMA-based eligibility selection. The key distinction is whether a study validates a pavement-specific effect on measured vehicle-battery DC energy, rather than independently validating only a vehicle model, road-force estimator, quarter-car vertical dynamics or tire rolling-resistance measurement.
Skar et al. [4, Figure 9a] report a 3.4% increase in normalized energy for 1 m/km higher IRI based on grouped means. The association arises from nominally identical EVs on observed roads, but the normalized residual is not a direct causal estimate of battery-terminal electricity. Jonas et al. [12, Methods §2.2] report logged battery current and voltage at 1 Hz and derived energy by functional road class; the categories are not physical roughness measurements. The validation/attribution contrast between these studies is more informative than directly comparing their energy percentages.
For intermediate mechanisms, Beckers et al. [6] validate quarter-car suspension deflections using road-bump and Belgian-block measurements on an instrumented articulated diesel bus. Their model is then parameterized for a battery-electric bus; road-class A–D estimates, including the Class D 0.17 kWh/km example at 40 km/h, represent modeled combined shock-absorber and tire-damping dissipation, not independently measured BEB battery consumption. Ejsmont et al. [13] show that smooth-drum tire tests can produce different rolling-resistance coefficients and rankings from representative road tests, while Hamilton et al. [14] perform field rolldown testing on a Class 8 electric truck to identify road-load components. Neither paper directly quantifies an IRI-conditioned pack-DC penalty.
An additional engineering risk is double counting. If a reported whole-vehicle rolling-resistance coefficient or road-load measurement already includes suspension hysteresis, adding a separately modeled damper-loss term to that coefficient may count the same mechanical energy twice. Similarly, an electric energy-recovery potential cannot be subtracted from a propulsion estimate as net battery saving unless the model includes the added tire/suspension excitation, motor and generator losses, auxiliary demand and electricity actually delivered to the pack. These accounting choices are analysis-level appraisal questions, not conclusions that any of the cited papers necessarily double counted losses.
Table 3.
Cross-study pavement exposure, energy outcome and validation limitations. Exploratory critical appraisal, not a final systematic-review eligibility table.
Table 3.
Cross-study pavement exposure, energy outcome and validation limitations. Exploratory critical appraisal, not a final systematic-review eligibility table.
| Original study | Pavement input | Reported outcome boundary | Major validation/attribution limit |
|---|---|---|---|
| Skar 2023 [4] | Measured IRI; surveyed before repeated field passes | Normalized traction-energy residual; association +3.4% per 1 m/km | Not metered battery DC; IRI survey/pass separation and repeated-site dependence |
| Jonas (2022) [12] | Six functional road classes (not quantitative IRI) | Measured BEV energy from battery current and voltage | Grade and traffic unmeasured; road class cannot isolate a pavement roughness effect. |
| Wang 2017 [5] | Surface-specific coast-down Crr classes, not measured IRI | Measured pack DC/AC trip demand vs vehicle model | Whole-model prediction validation not isolated IRI-to-pack effect |
| Beckers 2025/26 [6] | Measured profiles / modeled ISO 8608 classes | Modeled road-induced tire/suspension energy dissipation in a battery-electric bus model | Validation of suspension deflection on a diesel bus; later BEB transfer is assumed. Class D 0.17 kWh/km is modeled mechanical dissipation, not BEB pack DC. |
| Singh 2025 [10] | Synthetic IRI = 1.03/1.74/2.84 m/km; 21-DOF semitrailer truck; 1-km road | 704% modeled increase in roughness-induced dissipation; 0.00548 vs 0.04400 kWh/km modeled roughness-specific electricity, DA case | Original [10] text: golden-car IRI check on synthetic profiles, not direct instrumented battery validation; modeled roughness-only energy must not be called total pack energy. |
| Gravante 2026 [17] | Test-track measured IRI / MPD | Measured tire rolling-resistance coefficient | Publisher revision: Table 1 photo/MPD/IRI images and Table 3 caption symbol; numerical tire effects not independently extracted. No measured pack-DC response established. |
This exercise does not establish a literature-wide absence of direct IRI–battery evidence; that question can only be answered after the final searchable record population, study-family links and full-text eligibility are resolved. No meta-analysis or summary of causal effects is justified by these heterogeneous preliminary outcomes.
3.5.1. Full-Text Checks Enabled by Newly Supplied Source Documents
The complete original article by Wang et al. [9, pp. 1–12] describes modulated-white-noise road-profile generation, a distance-to-road-elevation lookup under variable speed and a coupled half-EV model with four vertical/pitching and three longitudinal driving degrees of freedom. Its reported outputs are shock-absorber power consumption and wheel-slip energy, with larger losses under selected lower frequency exponents, higher speeds and accelerations. The authors do not supply a directly metered battery-DC comparison across measured pavement segments. The term “real-time” in the title concerns modeled time-varying calculations, not proof of on-road battery-metering.
The complete Singh et al. [10, Methods, Figure 5, Figure 12, Table 2, Eqs. 10–11] study models a 21-DOF semitrailer on 1-km synthetic roughness profiles with IRI 1.03, 1.74 and 2.84 m/km. The generated profiles were checked using the standard golden-car IRI calculation. The authors then convert simulated road-induced energy dissipation to roughness-related electricity with an assumed 70% EV drivetrain efficiency. Their 704% good-to-poor change applies to modelled mechanical dissipation; the resulting electricity figure is not measured overall battery-pack use. Mattinzioli et al. [1] had already synthesized pavement–EV loading, rolling resistance, operating costs and environmental effects, limiting any first-ever-review claim.
3.5.2. Validation Transfer, Energy Measurement and Related-Study Independence
Beckers et al. [6, §§3.1–3.3 and 4.1–4.2] should be described as an experimentally informed model, not a battery-electric-bus pack-energy test: suspension displacement was recorded on a diesel articulated bus, and the calibrated modeling approach was subsequently applied to a parameterized electric bus. In the random-road comparisons, 0.0027 kWh/km (Class A) and 0.17 kWh/km (Class D) refer to modeled mechanical dissipation at 40 km/h. Their approximate 13% comparison uses a cited representative bus consumption of 1.3 kWh/km; it is not an observed experimental battery-energy fraction. Validity therefore transfers across vehicle platforms and outcome boundaries only by assumption. The distinction does not negate the damper model’s useful response validation.
The primary texts of [15] and [16] document closely matching model foundations: a 235/50R19 radial tire, 99,600 mesh elements and 117,003 nodes, identical reported tire-rubber Mooney–Rivlin parameters, the same 5-kN loading and static tire-contact figures (approximately 17,188 mm² measured and 17,266 mm² simulated contact patches). [15] reports experimental tire deflection/contact-patch checks and a chassis-dynamometer rolling-resistance comparison (maximum reported simulation–experiment discrepancy 3.3%; [15] original PDF, pp. 4–5). [16] reports static tire contact validation and a full-vehicle Simulink energy/range modeling stage ([16] original PDF, pp. 4 and 7). Their scopes differ, but matched model properties and contact-patch results prevent us from treating the reports as independent replications of a pavement-to-battery energy effect. In [16], Table 8 reports pressure-specific predicted range-loss values of 83.65 km (230 kPa) and 79.95 km (270 kPa), a decrease of 3.70 km over four 10-kPa increments, or 0.925 km per 10 kPa based solely on those endpoints. This endpoint calculation does not reproduce the authors' separate 1.34-km-per-10-kPa summary. Moreover, the [16] results describe decreasing rolling resistance and range loss with increasing inflation pressure, whereas conclusion (2) states the opposite direction before itself reporting a decrease in range loss. These internal discrepancies are retained as source-reporting limitations; the endpoint calculation is a reviewer check, not a replacement for the authors' dataset or a corrected study result. Shared test records or simulation reuse cannot be determined from the text alone; author confirmation or model-data provenance would be needed. Neither paper directly establishes a controlled IRI-to-pack-DC electricity coefficient.
Method triangulation also requires careful placement of measurements. Jonas et al. [12, §2.2] use battery current and voltage obtained from the test car’s CAN gateway at 1 Hz, allowing observed energy comparison across road functional classes, but neither IRI nor surface texture is quantified. Ejsmont et al. [13, §§2–4] compare field and laboratory tire-resistance measurement methods, identifying large method-dependent differences; Hamilton et al. [14, Methods] estimate rolling and aerodynamic resistance from field rolldown data on an electric truck. These provide useful measurement evidence at road-load or battery levels, but are not interchangeable paired pavement-IRI/battery dose-response datasets.
3.6. Focused 55-Publication Evidence Set
The fixed selection has five complementary roles: 11 closest road–vehicle energy publications, 12 tire/road-load mechanism publications, 12 suspension dissipation/recovery publications, 12 vehicle energy measurement/modeling publications, and eight contextual reviews, datasets or methods papers. These are bibliography roles rather than formal eligibility strata. In particular, the first 11 are NOT all direct roughness-to-battery studies: some analyze GHG scenarios, regenerative shock absorbers or road functional classes rather than measured pavement IRI. Table 4 preserves that distinction. [4,6,9,10,11,12,17,18,22,25,26]
3.7. Cross-Strand Findings and Outcome Harmonization
The 55 publications use non-equivalent road exposures: measured IRI or texture, synthetic ISO/PSD road profiles, nonstationary road-irregularity time series, or broad functional road classes. Likewise, reported outcomes include tire rolling-resistance coefficients, modeled suspension or wheel-slip energy, normalized traction-energy measures, generator-load recovery, and measured or modelled battery electricity. [9,10,17] and [6] address distinct mechanical pathways; [4] reports an observed IRI-associated normalized traction-energy signal; [18] and [12] address electricity consumption across traffic or functional-road categories, without separately measured pavement roughness or an isolated IRI-to-pack response; the original [18] publisher abstract identifies energy-metering approaches, but its full methods and numeric results remain unverified; [25] contributes an emissions scenario. [1] supplies prior critical-review context. The outcome types should not be numerically pooled as though they measured the same battery-energy penalty.
3.8. Original-Study Findings Versus Review Interpretation
Skar et al. [4] report a 3.4% rise in normalized energy for each 1 m/km greater IRI from grouped means (Figure 9a), rather than an observed battery-terminal Wh/km effect. Singh et al. [10] report a 704% increase in modeled roughness-induced truck dissipation from good to poor road classes and convert that component to modeled roughness-specific electricity using a 70% drivetrain efficiency assumption; this is not total measured pack consumption. Wang et al. [9] model nonstationary road excitation, damper power and wheel-slip energy. Beckers et al. [6] validate diesel-bus suspension response then extrapolate a model to battery-electric-bus mechanical energy loss. Jonas et al. [12] measure battery voltage/current on real EV routes by functional road class, not controlled IRI. [15] and [16] share key tire-model specifications and may not represent independent replication. These are physically different outcomes and evidence bases, not competing estimates of a universal road-roughness penalty.
3.9. Claim-Level Strength of the Engineering Evidence
Table 5 separates claims the original studies support from claims they do not establish. “Source checked” refers to the cited publisher article or previously inspected full text; it is not a formal systematic risk-of-bias grade. Each strength judgment applies only to the particular outcome and design shown, not to the entire 55-paper field.
Table 5.
Claim-level assessment of source-supported observations and interpretations that are not justified.
Table 5.
Claim-level assessment of source-supported observations and interpretations that are not justified.
| Engineering claim | Original-study observation | Verification strength / source access | Claim not justified |
|---|---|---|---|
| Measured IRI ↔ normalized traction energy | Skar 2023 [4]: 3.4% per IRI m/km from grouped means (Figure 9a) | Publisher full text; field association across ten electric cars | Does not isolate causal pack-terminal Wh/km or support a universal fleet slope |
| Roughness ↔ modeled E-truck loss | Singh 2025 [10]: 704% modeled increase in roughness-induced dissipation; Table 2 reports DA modeled roughness-specific electricity 0.00548 vs 0.04400 kWh/km | Original full text checked: 21-DOF model; IRI-specific generated road profiles (golden-car checked); assumed conversion factor for electricity, no measured pack draw | Neither 704% higher total pack electricity nor independently field-validated IRI-to-battery demand can be inferred. |
| Pavement ↔ tire resistance | Gravante 2026 [17]: roughness/texture-related tire rolling resistance | Corrected numerical tables not accessible for independent effect extraction | Wheel-level resistance must not be presented as measured battery saving |
| Road profile ↔ suspension loss | Beckers 2026 [6]: ISO 8608 profile and modeled damper losses | Original [6] experiments validate suspension motion on a diesel bus; BEB rough-road dissipation results are modeled after parameter transfer | Full original [6] text: test-vehicle/platform and outcome boundaries verified; direct BEB battery-DC validation absent |
| Road class ↔ battery/whole-vehicle electricity | Jonas 2022 [12] and Wang 2017 [5] have battery-related measurements/model validation; original Sproch 2026 [18] publisher abstract checked (full chapter restricted) | Battery-side road-category evidence exists in [12], but [18] reports traffic-route energy comparisons using multiple estimation approaches; neither provides an independently verified IRI-to-pack coefficient here | Functional road classes do not isolate physical roughness; unverified [18] metrics must not be reported as original-source results. |
| Road excitation ↔ recoverable suspension electricity | Vergura 2020 [22]; Demir & Savran 2026 [11] | Numerical recovery values checked at model/load boundaries | Gross generator output cannot establish net battery savings or range gain |
Across the assembled corpus, the strongest claims must remain attached to the quantities the source authors actually measured or simulated. The examined source reports document an association between measured IRI and a normalized energy indicator, battery-current/voltage-derived energy comparisons by functional road category, and model-derived mechanical loss pathways. However, neither modeled BEB damper energy nor efficiency-converted E-truck dissipation is an independently metered IRI-to-battery effect. Overlapping tire-model specifications also limit any argument that similar simulations provide independent confirmation. No common battery-DC effect can be pooled from these heterogeneous studies.
3.10. How the 44 Supporting Publications Inform the Argument
Supporting references constrain engineering claims rather than enlarging the count of direct IRI-to-battery measurements. Their use is documented by publication identity, available original text, earlier verifications and citation purpose. This map is not a second eligibility-screening procedure. Original full-text access has improved for some references, especially [1], but those additions to the evidence library do not mean the entire supporting set underwent full independent appraisal.
Tire and road-load evidence (12 references). Ejsmont et al. [13] found that smooth steel-drum tire rolling-resistance tests do not necessarily reproduce road-surface results or tire rankings; they recommend road-representative pavement replicas for more realistic drum testing. Hamilton et al. [14] identified rolling and aerodynamic resistance together using a field roll-down test with a heavy-duty electric truck, but their study was not a paired pavement-roughness/pack-energy experiment. Song [27] reports that cold tire conditions increased rolling resistance relative to warmed tires; temperature therefore requires explicit control. Beckers et al. [28] used repeated data from a 12-m electric bus to identify position-dependent road resistance and grade together: the reported power-request prediction error decreased from 8.3% to 6.6% when the estimated road-resistance profile was used. This is an existing vehicle-level estimation/validation counterexample, not an isolated measured IRI-to-battery penalty. Other studies address cold-weather tire models, tire properties, resistance-aware routing, contact stresses, and chassis-dynamometer versus battery measurement boundaries [15,16,29,30,31,32,33,34]. [16] contains apparently inconsistent tire-pressure-direction statements in its public text; that specific trend should not be numerically synthesized without reconciling the original tables and definitions. The quantitative tire/contact and estimation results must not automatically be recast as battery-terminal Wh/km. Specifically, online rolling-resistance-aware route estimation [30], tire design aimed at lowering rolling resistance [31], road-roughness-related tire–pavement contact stresses [32] and heavy-duty EV contact forces [33] are retained as contextual mechanisms by publication topic. Their presence in the bibliography does not establish that all four directly measure an IRI-related pack-electricity effect; no quantitative findings are imported from unverified full-text passages.
Suspension recovery and device-level comparators (12 references). Integrated BEV suspension simulations [35] and regenerative shock-absorber mechanisms [19,23,24,36,37,38,39,40,41] provide device- and component-level evidence, while a two-wheeler conference chapter [42] and road-surface-dependent regenerative-braking simulation [43] extend the mechanism context. The now-supplied full-text copy of Abdelrahman et al. [23] reports modeled RMS generator outputs of 1.84 W on simulated ISO Class A and 6.34 W on Class B at 50 km/h, together with a separate 10.29 W peak device result at 12 mm and 3 Hz; source version/figure details still require final author sign-off. These are harvester outputs, not measured net battery savings. The 2016 supercapacitor-harvesting study [19] must be read with its 2019 corrigendum [44], addressing model-section sourcing and citation attribution without a reported withdrawal of its main conclusions. None of the recovery findings can be subtracted from propulsion demand without a whole-vehicle energy balance. Distinct device/model contexts within this strand include quarter-, half- and full-vehicle harvesting-model comparisons [37], a barrel-cam regenerative shock-absorber bench experiment [39] and a helical-gear harvester [40]. The original [39] paper reports a maximum experimental device output of 3.85 W under 7.5-mm, 2-Hz sinusoidal excitation; that is not whole-vehicle battery savings. The other two records are retained here for mechanism/method scope rather than assigned unverified numerical effect sizes. A 2026 passenger-vehicle regenerative-suspension conference paper [38] is retained as design context only; its full results were not independently appraised.
Whole-vehicle energy modeling and measurement comparators (12 references). Wang et al. [5] examined a whole-BEV energy-consumption model with surface-dependent rolling resistance, while papers on driving cycles, thermal conditions, traffic and operational models [20,21,45,46,47,48,49,50,51] help define confounders and measurement boundaries. Selvakumar et al. [52] is identifiable as an IEEE conference paper on multi-terrain EV energy forecasting (2026 ICICCS, pp. 434–440), but detailed predictor definitions, numerical performance and independent validation have not been checked from its original full text. Burud and Desai [53] report a sensor-equipped EV prototype and linear-regression/random-forest range prediction in a Springer conference chapter; its accessible abstract does not specify paired calibrated IRI or texture and battery-terminal Wh/km. These two papers therefore remain methods-context citations rather than validated pavement-specific energy-effect estimates. Lightweighting and driving-condition effects [45] are a further vehicle-operating-condition comparator; the citation alone is not an isolated quantitative pavement-to-battery outcome. A 2025 SAE model-based driving-suggestion paper [50] is retained as a component-preservation context source, without inferring a validated pavement-roughness battery effect.
Prior reviews, road-condition context and dataset references (eight references). The newly accessible full text of Mattinzioli et al. [1] explicitly provides a pavement–EV research roadmap that already discusses pavement roughness, texture, rolling resistance and operating impacts; this forecloses a claim that these pathways were never previously reviewed. Sun et al. [2] survey rolling-resistance determinants and measurements, while further energy and pavement-emissions reviews provide context [3,54]. The before/after pavement rehabilitation study [55] concerns fleet fuel use and emissions, not direct BEV battery electricity. The LiRA-CD dataset paper [56] describes publicly accessible vehicle and road-condition data useful for independent methods testing but is not itself a pavement-related battery-energy effect estimate. Vehicle sensing [57] and battery-pack vibration [58] supply additional methods context.
The 55-reference compilation contains original experiments, numerical studies, methodological comparators, prior reviews and datasets. Citation presence alone does not mean each item has undergone complete full-text appraisal.
3.11. Further Outcome-Boundary Checks Using Original Articles and Reviews
Three comparator designs strengthen interpretation without establishing a common roughness-to-pack coefficient. Phophongviwat et al. [34, Batch 2 pp. 277–290] combine coastdown-derived road-load coefficients with WLTP/EPA chassis-dynamometer and OBD-II measurements, reporting instrumentation-dependent energy quantities. Yuan et al. [20, Batch 2 pp. 193–204] report a 3.84% mean absolute percentage error across 26 laboratory validation observations representing 13 distinct cycle types, and 7.12% across 106 real-world trips ([20] original article, pp. 6–7; Batch 2 pp. 197–199). These validate driving-cycle energy prediction rather than an IRI or pavement-texture effect. The 2025 erratum [59] reports that the model used a 15 m/s threshold whereas the original text stated 15 km/h; affected documentation and code were corrected, and no independent rerun is claimed here. Montanino et al. [46, Batch 2 pp. 38–60] demonstrate why traffic-flow variation matters. These are measurement/model-validation comparators, not pavement-treatment experiments.
For pavement evidence, Llopis-Castelló et al. [55, Batch 2 p. 102 and pp. 103–117] compare before–after pavement rehabilitation observations with untreated-road controls and connected-fleet data. Their reported average 27% reduction in pavement roughness and approximately 10% decreases in fuel consumption and CO₂ emissions concern an internal-combustion-vehicle fleet, not a measured BEV pack-electricity response. Sun et al. [2] and Tarout et al. [54] are prior reviews, while the road-condition dataset [56] is a methods resource rather than an independent roughness-to-pack validation. This design contrast prevents extrapolation of [55] fuel figures into battery-specific percentage savings.
Patrone and Paffumi [21] reported an EVS38 conference study (meeting in June 2025; official JRC repository registration in 2026) using battery discharge during laboratory and on-road test campaigns on an aged mid-size BEV. Their later 2026 open-access journal article [60] (Batch 2, pp. 339–357; DOI 10.3390/wevj17050254) describes related experiments and further methodological discussion, including measurement points and battery-energy outcomes. The two publication identities must be retained, but the overlapping vehicle and campaign history precludes counting them as independent experimental confirmations. Neither publication is a paired, controlled IRI-to-battery-electricity experiment.
Table 6.
Additional original-source comparisons: study identity, energy boundary and independence limitations.
Table 6.
Additional original-source comparisons: study identity, energy boundary and independence limitations.
| Study identity / role | Author-reported input and design | Observed or modeled outcome | Evidence-boundary / independence qualification |
|---|---|---|---|
| [34]; Phophongviwat 2025 | Coastdown-calibrated WLTP/EPA tests; OBD-II and dynamometer EV energy | Energy readings depend on instrumentation, transient loads and cycle | No measured IRI-to-pack slope; instrumentation/cycle comparator |
| [20]; Yuan 2024 | BEV lab and real-world driving-cycle energy modeling; 3.84% MAPE on 26 laboratory validation observations across 13 distinct cycle types | Predictive performance against evaluated cycles | Not pavement-specific validation; correction/version checks remain |
| [46]; Montanino 2025 | Traffic-flow-dependent BEV energy model; speed/acceleration variability | Macroscopic energy under traffic-dynamics assumptions | Do not interpret traffic effect as a road-surface roughness effect |
| [2]; Sun 2024 | Review of pavement texture, rolling resistance and environmental impact | Secondary literature synthesis | Context and novelty comparator; not new independent test evidence |
| [54]; Tarout 2025 | Systematic/bibliometric review of EV energy optimization | Secondary energy-management synthesis | Context-only for pavement-specific causation |
| [55]; Llopis-Castelló 2026 | Connected-fleet before/after pavement rehabilitation with controls; 27% lower roughness | Approximately 10% lower *fuel* use / CO2 in analyzed ICE fleet | Not direct BEV battery electricity; control-period assumptions matter |
| [56]; Skar et al. 2023 | LiRA-CD dataset; 50 sensor channels, 230 km, road IRI and MPD | Published data resource and potential validation inputs | Not independent exposure–battery effect; [4] shared project lineage |
| [60]; Patrone–Paffumi 2026 (expanded version of [21]) | On-road and dynamometer battery usable-energy measurements | Usable battery energy across route, speed, grade and load | Separate journal article, not fixed [21] proceedings; no isolated pavement exposure |
| [15,16]; Wang 2025 / Qiang 2026 | Matching 235/50R19 tire model and 99,600-cell/117,003-node mesh | Related finite-element tire and inferred range outputs | Independence/overlap unverified; do not count as two experimental replications |
4. Discussion — Critical Synthesis and Engineering Implications
The 55-paper evidence set can be organized more reliably by what each study measures than by whether its title mentions energy consumption. The central interpretive finding is that pavement-induced tire hysteresis, suspension damping, traction-force residuals, recovered electrical output and measured battery DC are distinct physical quantities. They can support a mechanistic chain, but are not interchangeable treatment effects. The following subsections identify what this evidence does and does not support.
4.1. What the Observed Energy Pathway Supports
The fixed set establishes several pieces of a road-to-vehicle energy pathway, not one transferable IRI-to-battery coefficient. Gravante et al. [17] report an instrumented BEV tire-rolling-resistance experiment. The publisher documents a 25 June 2026 revision replacing the Table 1 Photo, MPD and IRI images and correcting a Greek symbol in the Table 3 caption. Without the revised full text, this review cannot verify coefficients or whether the changed exposure illustrations affect interpretation; it makes no claim that author-reported numerical effects were corrected. Beckers et al. [6] validate suspension response and compare modeled damper losses with measured rolling-resistance information, an existing partial bridge between road input and mechanical loss. Wang et al. [9] quantify modeled road-excited damper and wheel-slip losses under nonstationary inputs; Singh et al. [10] quantify modeled E-truck roughness-induced dissipation and infer roughness-related electricity through an assumed conversion efficiency. Their original full texts now make these boundaries clear. None of the four establishes an independently measured, same-trip battery-terminal IRI dose-response. This remains a bounded comparison within the 55-paper set rather than proof of a universal literature gap.
4.2. Why Observed Road-Type Electricity Is Not Isolated Roughness Electricity
Skar et al. [4] associate laser-profiler IRI with a normalized energy residual from ten nominally identical electric cars; their 3.4% per m/km figure is not a causal pack-DC coefficient. Jonas et al. [12] provide a real BEV battery-measurement counterexample: a 2017 e-Golf was observed using battery voltage and current at 1 Hz and compared across road functional classes. But grade and traffic were not separately measured, and functional class is not calibrated IRI or texture. The original [18] chapter is not available in full text; its publisher abstract instead identifies OBD-network data, calculations based on battery capacity and electricity drawn from the grid, and GPS as approaches for comparing urban, rural and motorway routes. The abstract does not establish direct terminal-current/voltage metering or a quantitative pavement roughness measurement. That abstract does not disclose sufficient quantitative pavement-exposure or battery-terminal methods to establish an IRI-specific effect, and findings from a separate free Sproch article are not attributed to [18]. The specific unresolved bridge in the sources checked is a paired quantified pavement exposure and battery-terminal measurement under defensible controls, not an asserted absence from all published research.
Related full-text checks underscore two complementary failure modes: inconsistent battery-side instrumentation [34] and unmodeled traffic acceleration variance [46]. Neither can be re-described as a physical road roughness effect without matched exposure data. [55] provides a useful pavement intervention design with controls but in ICE fuel outcomes; the published LiRA-CD measurements [56] suggest a possible reproducible pairing of sensed road condition and vehicle signals, not an already validated causal battery effect.
4.3. Avoiding Double Counting and Invalid Energy Savings
A whole-vehicle road-load coefficient derived from coast-down measurement can already contain tire hysteresis, suspension losses and other resistive contributions. Adding a modeled damper coefficient to it without defining disjoint terms risks double counting. Likewise, recovered electricity at a shock-absorber generator is gross output unless generator conversion losses, changed damping forces, changed wheel road load and actual storage/battery delivery have been reconciled. Demir and Savran [11, Table 5 and Table 6] report gross model recovery of 70.4 Wh/km on ISO Class B at 2 km/h against separately modeled consumption of 29.6 Wh/km. These quantities cannot be subtracted to claim a 40.8 Wh/km net battery gain: they are not demonstrated at a closed and common system boundary. The apparent mismatch calls for an energy-budget audit and does not by itself prove a violation of physics.
4.4. Evidence-Supported Limitations and Testable Research Questions
The gap audit below distinguishes (a) a documented non-equivalence between the selected studies, (b) a method already partly addressed by existing work, and (c) an unverified proposition that might be overturned by fuller source reading. Consequently, we do not claim that IRI-to-battery studies, mechanical-loss partitioning or regenerative-suspension validation have never been performed. Instead, we specify a falsifiable question, name the strongest counterexample and identify which additional measurement would resolve the issue. This prevents converting a limitation of our purposive 55-paper set into an unsupported literature-wide novelty claim.
In particular, the measured-data road-resistance estimator of Beckers et al. [28] is a concrete prior example of across-trip estimation and model validation, while the open LiRA-CD dataset [56] supplies infrastructure for additional independent comparisons. These prior contributions narrow any defensible novelty claim to outcome-boundary reconciliation and pavement-specific attribution, rather than general absence of estimation methods or accessible datasets.
Table 7.
Falsifiable engineering research opportunities identified within the selected corpus; not evidence of literature-wide absence.
Table 7.
Falsifiable engineering research opportunities identified within the selected corpus; not evidence of literature-wide absence.
| Candidate opportunity | Supporting evidence and closest counterexample | Bounded conclusion within selected 55 | What would test or overturn the proposal |
|---|---|---|---|
| G1. Pavement exposure to battery electricity | Skar [4] measures IRI + normalized energy; Jonas [12] measures 1 Hz pack current/voltage + road class; Wang [5] validates battery-model boundaries. | The compared studies do not establish a common, controlled same-trip IRI/texture-to-pack-DC effect. Existing battery measurements are acknowledged. | Verify full methods of [4,5,12,18] for paired IRI/MPD and pack-terminal V/I; compare repeated road segments with grade, speed and traffic covariates; test on held-out vehicles. |
| G2. Across-scale roughness representation | Beckers [6] uses ISO 8608 profiles and road-frequency-dependent damper losses; Skar [4] uses IRI; Gravante [17] examines IRI and pavement texture. | IRI, texture and spectral profile are not interchangeable merely because all concern pavement condition. Quantitative mapping remains design-dependent. | Test whether the original sources report co-measured IRI, texture and spectral descriptions on the same surfaces and whether their loss estimates generalize across frequencies. |
| G3. Mechanical-to-electrical loss closure | Beckers [6] already compares validated suspension simulations with measured rolling resistance; Gravante [17] measures tire resistance; Beckers et al. [28] estimate road-load terms. | Do not claim that tire/suspension partitioning is absent. A stronger opportunity is vehicle-level reconciliation without counting the same road-load losses twice. | Identify and audit the loss terms in [6,17,28]; require energy-balance closure against independent road-load and pack data with clear control-volume boundaries. |
| G4. Gross harvested energy versus net range benefit | Vergura [22] and Demir & Savran [11] report simulated recovered suspension electricity; regenerative devices in [19,23,24,35,36,37,38,39,40,41,42,43] offer further mechanisms. | Gross device output is not proven net battery savings; additional damping forces, conversion losses and changed vehicle dynamics may alter the outcome. | Trace generator-to-storage power and added mechanical road load in available full texts; measure net battery DC with matched active/inactive recovery control. |
| G5. Attribution, uncertainty and transferability | Skar [4] uses repeated road data across ten electric cars; Jonas [12] measures battery energy but lacks slope/traffic observations; truck and bus models [6,10] have distinct platforms. | Confounding, nested observations and model validation at different outputs constrain causal interpretation and transfer to other vehicle classes. | Look for road-/vehicle-blocked holdouts and sensitivity analyses in each original paper; report effect uncertainty and investigate reproducibility across vehicle types and roads. |
A focused review without new author-run experiments can evaluate these hypotheses through exact source-level evidence comparisons. In particular, a proposed novel effect must be stated as a testable increment over [4,12] and [6] rather than as a universal pavement energy coefficient. The archive contains enough comparative material to frame these questions but not to declare all alternatives disproven.
Figure 3 contrasts the distinct exposure and energy-outcome boundaries of representative primary studies. The comparison illustrates why observed road-class electricity, IRI-associated normalized traction energy and modeled component losses cannot be pooled as direct estimates of the same pavement-to-battery effect.
4.5. Practical Implications for Pavement Agencies and EV Engineers
For road asset managers, these papers motivate linking surface-condition monitoring to EV use-phase energy models, but they do not justify applying a universal percent battery saving for a 1 m/km IRI improvement. For vehicle engineers, the minimum reproducible comparison should report the actual measured road profile (IRI and/or texture with locations, resolution and method), tire and damper parameters, vehicle identity and payload, operating speed/grade/traffic/weather, energy-meter location and sign convention, and uncertainty across independent road segments and vehicles. For energy researchers, model calibration and evaluation should use non-overlapping roads or vehicles rather than random portions of repeated passes through the same conditions. These are recommended research-reporting practices; this review does not require or claim new physical experiments by its authors.
4.6. Limits of This Focused Review
This focused critical review analyzes a purposive, non-exhaustive set of 55 publications, not a formally screened systematic sample. The four compiled PDF batches support targeted original-source verification, but full-text appraisal of every cited paper and all related datasets has not been demonstrated. Papers include related model families, multiple publication types, prior reviews and correction notices; the count of citations is not a count of independent experiments. Consequently, this article identifies method-dependent differences among selected studies but neither estimates the prevalence of deficiencies across all publications nor proves a literature-wide absence of paired pavement-to-battery experiments.
Corrected and related-source material changes interpretation in specific ways. Corrections to [19,20] require version-aware use; [15,16] share tire-model characteristics, so their outputs cannot be treated as independent physical replication. The EVS38 conference record [21] and later journal article [60] concern related study work. The corrected full numerical text of [17] and complete original conference chapter [18] have not been verified; only study-design and outcome-boundary statements documented in original publisher abstracts or correction notices are used; quantitative effect-size verification remains outstanding. Discrepant author-reported range-loss trends in [16] are identified, not resolved by editorial inference.
The primary limitation is the source-selection and outcome-comparability boundary. The review does not provide a universal battery Wh/km effect, a pooled IRI coefficient or a complete formal risk-of-bias assessment. Demonstrating that these outcomes are non-equivalent is an interpretive contribution, while estimates of causal pavement-to-battery effects would require independent, sufficiently controlled measurements and model reconciliation. Author-level verification of the source-to-claim register and of original figure rights remains outstanding.
5. Conclusions
Across the studies examined, pavement roughness and texture are linked to tire, suspension and vehicle-dynamics energy-loss mechanisms, while road-class observations and normalized traction-energy measures concern broader EV energy demand. These results occur at different physical boundaries. Neither a modeled component dissipation increase nor gross suspension-generator output establishes the corresponding change in battery-terminal Wh/km or practical vehicle range. Heterogeneous road exposures, operating conditions and validation targets do not justify a pooled, transferable IRI-to-battery effect estimate.
In the selected papers, Skar et al. [4] associate IRI with normalized energy, while Jonas et al. [12] measure battery current and voltage but classify roads functionally rather than measuring IRI. Wang et al. [9] and Singh et al. [10] establish modeled irregularity-induced pathways, with the latter converting mechanical losses under an assumed drivetrain efficiency. Beckers et al. [6] validate suspension response on a diesel bus, then model a battery-electric bus; they do not directly measure pack-energy loss from road class. Ejsmont et al. [13] and Hamilton et al. [14] illustrate method-dependent rolling-resistance estimation. [15] and [16] provide related FE tire-model evidence, with source-internal numerical/directional questions in [16] that require resolution before using its pressure or range-loss coefficients. Mattinzioli et al. [1] already reviewed broad pavement–EV interactions, narrowing our contribution to outcome-boundary and validation comparability.
Additional original-source comparisons document EV energy instrumentation [20,21,34,60], traffic-related confounding [46], and a before–after pavement intervention evaluated through internal-combustion-vehicle fuel and emissions outcomes [55]. These studies narrow, rather than erase, the evidence question: whether quantitatively matched pavement exposure explains independently observed BEV battery electricity after controlling competing road and vehicle conditions. This is a bounded research question within the reviewed sources, not a claim that such research is absent everywhere.
The principal research implication is a falsifiable validation question: does adding independently measured pavement roughness or texture improve out-of-sample prediction of battery-terminal Wh/km beyond speed, acceleration, road grade, traffic, payload, tire conditions and weather? Two linked questions concern whether modeled tire and suspension losses can be reconciled with on-road battery measurements without double counting, and whether regenerative damping produces a net battery benefit when its complete mechanical–electrical energy budget is evaluated. These are proposed future tests, not validated gaps across the entire literature. The present article can make a critical methodological contribution without the review authors conducting physical experiments, provided its source limitations and author confirmations are transparently completed.
Author Contributions
K. Singh is the sole author and is responsible for the manuscript content, scientific interpretations and journal correspondence.
Funding
This research received no funding.
Ethics Approval and Consent to Participate
Not applicable. This literature review did not recruit human participants, conduct animal experiments, or collect new personal information.
Consent for Publication
Not applicable. No identifiable individual participant data are presented in this review.
Availability of Data and Materials
No new author-run experiments or observational datasets were generated for this critical review. The source-derived evidence discussed in the article is contained in the cited publications and presented comparison tables. The internal bibliographic and extraction audit records have not been deposited in a public repository; access to original third-party papers remains subject to their publishers’ terms.
Acknowledgments
During the process of preparing this manuscript, the author utilized ChatGPT (OpenAI, GPT-5.5) for academic language editing, grammatical enhancement, boosting read-ability, and layout of the paper. The author reviewed and edited the AI- assisted material and is entirely accountable for the correctness, soundness, and contents of this publication.
Conflicts of Interest
The author declares that there are no competing financial or non-financial interests.
List of Abbreviations
BEV, battery-electric vehicle; DC, direct current; EV, electric vehicle; GHG, greenhouse gas; IRI, International Roughness Index; ISO, International Organization for Standardization; MPD, mean profile depth; OBD, on-board diagnostics; PSD, power spectral density; PRISMA, Preferred Reporting Items for Systematic Reviews and Meta-Analyses; RMS, root mean square; TRID, Transportation Research International Documentation; Wh/km, watt-hours per kilometre.
Appendix A. Recorded Database-Specific Search Strategies
These expressions are reproduced from the previously documented project search log for the searches recorded on 6 November 2026. They describe source discovery, not the later selection of the focused 55-publication bibliography. As a critical literature review, this manuscript reports the searches transparently without asserting a completed PRISMA screening process.
A.1. Scopus — TITLE-ABS-KEY Search
TITLE-ABS-KEY("electric vehicle*" OR "battery electric vehicle*" OR "battery-electric vehicle*" OR "electric car*" OR "electric bus*" OR "electric truck*" OR BEV)ANDTITLE-ABS-KEY(pavement* OR "road roughness" OR "pavement roughness" OR "road irregularit*" OR "road unevenness" OR "road profile*" OR "road surface*" OR "surface texture" OR "international roughness index" OR "ISO 8608")
A.2. TRID — Recorded Boolean Expression
("electric vehicle*" OR "battery electric vehicle*" OR "electric bus*" OR "electric truck*" OR BEV)AND(pavement* OR "road roughness" OR "road irregularit*" OR "road profile*" OR "surface texture")
A.3. Search-Record Provenance and Limits
- Recorded execution date: 6 November 2026 for both Scopus and TRID; source discovery occurred before the fixed 55-paper manuscript decision (8 November 2026).
- Scopus: the historical TITLE-ABS-KEY search was used to discover candidate publications; original exports and duplicate-resolution records have not been independently reconstructed for this article. No certified database yield is inferred.
- TRID: a recorded Boolean expression informed discovery; native export settings and complete cross-database deduplication were not independently reconstructed. No PRISMA count or eligibility rate is inferred.
- The historical strategy did not establish a fully reproduced eligibility protocol for this review. Search interface settings, database coverage and export parameters would require a new prospective search to support a formal systematic-review claim.
- The fixed comparison pool comprised 55 purposively assembled publications from previous database searches, citation tracking and source curation. This is not a systematically screened or independently adjudicated eligible-study set.
References
- Mattinzioli, T.; Butt, A.A.; Harvey, J. Literature review on pavements and electric vehicle interaction: a research roadmap. Transp. Res. Part D. Transp. Environ. 2023, 122, 103886. [Google Scholar] [CrossRef]
- Sun, Z.; Premarathna, W.A.A.S.; Anupam, K.; Kasbergen, C.; Erkens, S.M.J.G. A state-of-the-art review on rolling resistance of asphalt pavements and its environmental impact. Constr. Build. Mater. 2024, 411, 133589. [Google Scholar] [CrossRef]
- Sukhija, M.; Coleri, E.; Baran, S.; Gibson, S.P. Impact of pavement roughness on user costs and carbon emissions: a review of insights and challenges. Sustainability 2026, 18(20), 10488. [Google Scholar] [CrossRef]
- Skar, A.; Vestergaard, A.; Pour, S.M.; Pettinari, M. Internet-of-Things (IoT) platform for road energy efficiency monitoring. Sensors 2023, 23(5), 2756. [Google Scholar] [CrossRef] [PubMed]
- Wang, J.; Besselink, I.J.M.; Nijmeijer, H. Battery electric vehicle energy consumption modelling for range estimation. Int. J. Electr. Hybrid. Veh. 2017, 9(2), 79–102. [Google Scholar] [CrossRef]
- Beckers, C.J.J.; Besselink, I.J.M.; Nijmeijer, H. Quantification of energy losses in suspension dampers and its effects on rolling resistance. Veh. Syst. Dyn. 2026, 64(8), 1399–1419. [Google Scholar] [CrossRef]
- Page, M.J. The PRISMA 2020 statement: an updated guideline for reporting systematic reviews. BMJ 2021, 372, n71. [Google Scholar] [CrossRef] [PubMed]
- Rethlefsen, M.L. PRISMA-S: an extension to the PRISMA Statement for Reporting Literature Searches in Systematic Reviews. Syst. Rev. 2021, 10, 39. [Google Scholar] [CrossRef]
- Wang, J.C.; Wang, F.H.; Wang, Y.X.; Chen, S.A. Analysis of real-time energy losses of electric vehicle caused by non-stationary road irregularity. Energy 2023, 282, 128444. [Google Scholar] [CrossRef]
- Singh, A.; Khan, A.A.R.; Cardenas, J.J.; Al-Qadi, I.L. Effect of road roughness on E-truck energy consumption. Int. J. Pavement Eng. 2025, 26(1), 2528982. [Google Scholar] [CrossRef]
- Demir, V.G.; Savran, E. The role of regenerative suspension in energy-efficient and comfortable electric vehicle driving. Eng. Perspect. 2026, 6(3), 344–353. [Google Scholar] [CrossRef]
- Jonas, T.; Wilde, T.; Hunter, C.D.; Macht, G.A. The impact of road types on the energy consumption of electric vehicles. J. Adv. Transp. 2022, 2022, 1436385. [Google Scholar] [CrossRef]
- Ejsmont, J.; Ronowski, G.; Ydrefors, L.; Owczarzak, W.; Sommer, S.; Świeczko-Żurek, B. Comparison of tire rolling resistance measuring methods for different surfaces. Int. J. Automot. Technol. 2024, 25(4), 965–976. [Google Scholar] [CrossRef]
- Hamilton, D.; Sessions, J.; Langevin, C. Identifying rolling resistance and air resistance simultaneously for an electric truck. Int. J. For. Eng. 2026, 37(2), 225–239. [Google Scholar] [CrossRef]
- Wang, Q.; Li, A.; Yan, J. Study on the relationship between the steady-state rolling resistance of radial tires and energy consumption of electric vehicles. Sci. Rep. 2025, 15, 45406. [Google Scholar] [CrossRef] [PubMed]
- Qiang, W.; Ao, L.; Zhuoxi, Z.; Yanxu, Z.; Jiani, Y. Research on the effects of low-temperature and multiple operating conditions on tire rolling resistance and range. Experimental Techniques. published online. 2026. [CrossRef]
- Gravante, G.; Santos, J.; Es-Sabar, A.; Louis, S.; Cerezo, V. Unveiling the relationship between pavement surface texture and roughness and the energy loss of a tire: the rolling resistance in a battery electric vehicle. Proc. Inst. Mech. Eng. Part J. J. Eng. Tribol. 2026, 240(7), 1388–1400. [Google Scholar] [CrossRef]
- Sproch, M.; Graba, M.; Hennek, K.; Mamala, J. The impact of road conditions on energy consumption in the electric drive system of a passenger car – experimental analysis in the RDE cycle. In Smart and Environmentally Friendly Contemporary Road Traffic and Transportation Engineering Solutions, Lecture Notes in Networks and Systems; 2026; Volume 1769, pp. 138–153. [Google Scholar] [CrossRef]
- Zhang, Z.; Zhang, X.; Chen, W.; Rasim, Y.; Salman, W.; Pan, H.; Yuan, Y.; Wang, C. A high-efficiency energy regenerative shock absorber using supercapacitors for renewable energy applications in range extended electric vehicle. Appl. Energy 2016, 178, 177–188. [Google Scholar] [CrossRef]
- Yuan, X.; He, J.; Li, Y.; Liu, Y.; Ma, Y.; Bao, B.; Gu, L.; Li, L.; Zhang, H.; Jin, Y.; Sun, L. Data-driven evaluation of electric vehicle energy consumption for generalizing standard testing to real-world driving. Patterns 2024, 5(4), 100950. [Google Scholar] [CrossRef] [PubMed]
- Patrone, G.L.; Paffumi, E. Usable battery energy measurement on road on an aged mid-size battery electric vehicle. EVS38 conference proceedings, Gothenburg, Sweden, 15–18 June 2025; 2025; p. JRC142137. Available online: https://publications.jrc.ec.europa.eu/repository/handle/JRC142137.
- Vergura, S. Simulink model of a regenerative shock absorber. Renew. Energy Power Qual. J. 2020, 18. [Google Scholar] [CrossRef]
- Abdelrahman, M.; Fan, C.; Yi, M.; Zhang, Z.; Ali, A.; Xia, X.; Mohamed, A.A.; Mugheri, S.A.; Ahmed, A. Variable damping energy regenerative damper for self-powered sensors and self-sensing devices in smart electric buses. Smart Mater. Struct. 2024, 33, 105009. [Google Scholar] [CrossRef]
- Abdelrahman, M.; Liu, G.; Fan, C.; Zhang, Z.; Ali, A.; Li, H.; Azam, A.; Cao, H.; Mohamed, A.A. Energy regenerative shock absorber based on a slotted link conversion mechanism for application in the electrical bus to power the low wattages devices. Appl. Energy 2023, 347, 121409. [Google Scholar] [CrossRef]
- Chun, J.; McKeown, J.; Kang, S. Impact of vehicle electrification on road roughness induced greenhouse gas (GHG) emissions. Sustain. Energy Technol. Assess. 2024, 64, 103701. [Google Scholar] [CrossRef]
- Zhou, Z.; Shi, Z.; Ding, X. Multi-mode switching control strategy for IWM-EV active energy-regenerative suspension based on pavement level recognition. World Electr. Veh. J. 2023, 14(11), 317. [Google Scholar] [CrossRef]
- Song, J. Evaluation of driving resistance and energy consumption in electric vehicles under various ambient and tire temperatures using real-world driving data. eTransportation 2025, 25, 100454. [Google Scholar] [CrossRef]
- Beckers, C.J.J.; Besselink, I.J.M.; Nijmeijer, H. Combined rolling resistance and road grade estimation based on EV powertrain data. IEEE Trans. Veh. Technol. 2023, 72(3), 3201–3213. [Google Scholar] [CrossRef]
- Arat, M.; Bolarinwa, E.O. Rolling resistance effect of tire road contact in electric vehicle systems. SAE Tech. Pap. 2015, 2015-01-0624. [Google Scholar] [CrossRef]
- Trigui, O.; Mejri, E.; Dube, Y.; Kelouwani, S.; Agbossou, K. Energy efficient routing estimation in electric vehicle with online rolling resistance estimation. 2017 IEEE Vehicle Power and Propulsion Conference (VPPC), 2017; p. 8330912. [Google Scholar] [CrossRef]
- Guo, L.; Hu, D.; Shen, Z.; Wang, W.; Jiang, Z.; Zhang, J.; Ren, F.; Cui, Z.; Li, F. Refined analysis and zonal design method for reducing EV tire rolling resistance under a hybrid deformation framework. Results Eng. 2026, 30, 110461. [Google Scholar] [CrossRef]
- Cardenas, J.J.; Al-Qadi, I.L. Impact of road roughness on tire–pavement contact stresses during vehicle maneuvering. J. Eng. Mech. 2025, 151(2), 04024115. [Google Scholar] [CrossRef]
- Hernandez, J.; Jayme, A.; Cardenas Huaman, J.J.; Al-Qadi, I.L. Effect of heavy-duty electric vehicles on tire–pavement contact forces. J. Eng. Mech. 2025, 151(1), 04024104. [Google Scholar] [CrossRef]
- Phophongviwat, T.; Poopanya, P.; Sivalertporn, K. Quantitative assessment of EV energy consumption: applying coast down testing to WLTP and EPA protocols. World Electr. Veh. J. 2025, 16(7), 360. [Google Scholar] [CrossRef]
- Pham, T.H.; Jacob, J.; Wilkins, S.; Lauwerys, C.; Dhaens, M. Integrated model for battery electric vehicles with energy harvesting active suspension system. 12th International Conference on Ecological Vehicles and Renewable Energies (EVER), 2017; pp. 1–10, article 7935863. [Google Scholar] [CrossRef]
- Salman, W.; Zhang, X.; Li, H.; Wu, X.; Li, N.; Azam, A.; Zhang, Z. A novel energy regenerative shock absorber for in-wheel motors in electric vehicles. Mech. Syst. Signal Process. 2022, 181, 109488. [Google Scholar] [CrossRef]
- Zhang, R.; Zhao, L.; Qiu, X.; Zhang, H.; Wang, X. A comprehensive comparison of the vehicle vibration energy harvesting abilities of the regenerative shock absorbers predicted by the quarter, half and full vehicle suspension system models. Appl. Energy 2020, 272, 115180. [Google Scholar] [CrossRef]
- Adude, S.B.; Bhosalepatil, N.S.; Shivankar, O.S.; Sonwalkar, R.A.; Satpute, A.V. Design and development of a regenerative suspension system for passenger vehicles. 2026 International Conference on Sustainable and Futuristic Technologies (ICSFT), 2026; pp. 1–4. [Google Scholar] [CrossRef]
- Ali, A.; Qi, L.; Zhang, T.; Li, H.; Azam, A.; Zhang, Z. Design of novel energy-harvesting regenerative shock absorber using barrel cam follower mechanism to power the auxiliaries of a driverless electric bus. Sustain. Energy Technol. Assess. 2021, 48, 101565. [Google Scholar] [CrossRef]
- Salman, W.; Qi, L.; Zhu, X.; Pan, H.; Zhang, X.; Bano, S.; Zhang, Z.; Yuan, Y. A high-efficiency energy regenerative shock absorber using helical gears for powering low-wattage electrical device of electric vehicles. Energy 2018, 159, 361–372. [Google Scholar] [CrossRef]
- Wang, Z.; Zhang, T.; Zhang, Z.; Yuan, Y.; Liu, Y. A high-efficiency regenerative shock absorber considering twin ball screws transmissions for application in range-extended electric vehicles. Energy Built Environ. 2020, 1(1), 36–49. [Google Scholar] [CrossRef]
- Matharou, G.S.; Kaur, S.; Raj, V.; Dhawan, R. Electricity generation by an innovative suspension system in a two-wheeler electric vehicle. In Recent Advances in Intelligent Manufacturing, Lecture Notes in Mechanical Engineering; Springer: Singapore, 2023; pp. 357–369. [Google Scholar] [CrossRef]
- Vodovozov, V.; Raud, Z. Modelling of energy recovery in electric vehicles for various braking scenarios on changing road surfaces. Renew. Energy Power Qual. J. 2020, 18. [Google Scholar] [CrossRef]
- Zhang, Z.; Zhang, X.; Chen, W.; Rasim, Y.; Salman, W.; Pan, H.; Yuan, Y.; Wang, C. Corrigendum to “A high-efficiency energy regenerative shock absorber using supercapacitors for renewable energy applications in range extended electric vehicle”. Appl. Energy 2019, 254, 113634. [Google Scholar] [CrossRef]
- Choi, M.; Cha, J.; Song, J. Impact of lightweighting and driving conditions on electric vehicle energy consumption: in-depth analysis using real-world testing and simulation. Energy 2025, 323, 135746. [Google Scholar] [CrossRef]
- Montanino, M.; Natale, I.; Fiori, C.; Punzo, V. A traffic-flow-dependent macroscopic model of electric vehicle energy consumption. Transp. Res. Part C Emerg. Technol. 2025, 178, 105220. [Google Scholar] [CrossRef]
- Nguyen, H.P.; Lu, H.P.; Van, D.D.; Vo, H.C.; Ngo, M.H. Quantitative analysis of energy flow in electric vehicle subsystems for enhanced energy efficiency. Int. Rev. Mech. Eng. 2025, 19(10), 538–548. [Google Scholar] [CrossRef]
- Skar, A.; Levenberg, E. Road profile inversion from in-vehicle accelerometers. J. Transp. Eng. Part B Pavements 2024, 150(1), 04023040. [Google Scholar] [CrossRef]
- Dembitskyi, V.; Samostian, V.; Kotenko, V.; Sitovsky, O. Modeling and analysis of electric bus energy consumption considering topography and driving modes. In TRANSBALTICA XVI: Transportation Science and Technology, Lecture Notes in Intelligent Transportation and Infrastructure; Springer: Cham, 2026; pp. 132–141. [Google Scholar] [CrossRef]
- Bernardi, M.L.; Capasso, C.; Iannucci, L.; Sequino, L. Use of model-based datasets and neural-networks to support real-time driving suggestions system for components preservation in battery electric vehicles. SAE Tech. Pap. 2025, 2025-24-0115. [Google Scholar] [CrossRef]
- Stano, P.; Lazzarini, D.; Santoro, S.; Mihalkov, M.; Montanaro, U.; Vigliani, A.; Ferrara, A.; Dhaens, M.; Sorniotti, A. On-board electric powertrain control for the compensation of the longitudinal acceleration oscillations caused by road irregularities. Mech. Mach. Theory 2024, 202, 105759. [Google Scholar] [CrossRef]
- Selvakumar, R.; Pavan, P.; Syed Khalid Ahmed, H.; Madhanagopal, P.; Suriya, J.; Yogesh Arvind, V. ML-driven energy consumption forecasting for multi-terrain electric vehicle operation. 2026 9th International Conference on Intelligent Computing and Control Systems (ICICCS), 2026; pp. 434–440. [Google Scholar]
- Burud, A.; Desai, K. IoT-enabled machine learning approach for predicting battery behavior in electric vehicles under varying road conditions. In Artificial Intelligence and Sustainable Computing, Lecture Notes in Networks and Systems; Springer: Cham, 2026; Volume 1938, pp. 156–164. [Google Scholar] [CrossRef]
- Tarout, H.; Zaki, H.; Chahbouni, A.; Ennajih, E.; Louragli, E.M. Optimizing energy consumption in electric vehicles: a systematic and bibliometric review of recent advances. World Electr. Veh. J. 2025, 16(10), 577. [Google Scholar] [CrossRef]
- Llopis-Castelló, D.; Arce-Blanco, C.; Valdecantos-Álvarez, J.C. Before–after study of pavement roughness impact on vehicle fuel consumption and emissions. Transp. Res. Part D. Transp. Environ. 2026, 151, 105131. [Google Scholar] [CrossRef]
- Skar, A.; Vestergaard, A.M.; Brüsch, T.; Pour, S.; Kindler, E.; Alstrøm, T.S.; Schlotz, U.; Larsen, J.E.; Pettinari, M. LiRA-CD: An open-source dataset for road condition modelling and research. Data Brief. 2023, 49, 109426. [Google Scholar] [CrossRef] [PubMed]
- Levenberg, E.; Skar, A.; Pour, S.M.; Kindler, E.; Pettinari, M.; Bajic, M.; Alstrøm, T.S.; Schlotz, U. Live road condition assessment with internal vehicle sensors. Transp. Res. Rec. 2021, 2675(10), 1442–1452. [Google Scholar] [CrossRef]
- Firmansyah, M.A.; Feriyanto, D.; Firdaus, H.; Pranoto, H.; Istiqomah, I. An FFT-based vibration characterization on road profile of two-wheeler electric vehicle. Sinergi 2025, 29(3), 833–844. [Google Scholar] [CrossRef]
- Yuan, X.; He, J.; Li, Y.; Liu, Y.; Ma, Y.; Bao, B.; Gu, L.; Li, L.; Zhang, H.; Jin, Y.; Sun, L. Erratum: Data-driven evaluation of electric vehicle energy consumption for generalizing standard testing to real-world driving. Patterns 2025, 6(2), 101173. [Google Scholar] [CrossRef] [PubMed]
- Patrone, G.L.; Paffumi, E. On-road measurement of the usable battery energy of an electric vehicle. World Electr. Veh. J. 2026, 17(5), 254. [Google Scholar] [CrossRef]
Figure 1.
Conceptual pavement–vehicle energy pathways in a battery-electric commercial vehicle. The diagram illustrates plausible mechanisms and operating-condition confounders; it does not report measured effect sizes or a universal change in battery energy. AI-assisted conceptual illustration using OpenAI ChatGPT (see Section 2.10).
Figure 1.
Conceptual pavement–vehicle energy pathways in a battery-electric commercial vehicle. The diagram illustrates plausible mechanisms and operating-condition confounders; it does not report measured effect sizes or a universal change in battery energy. AI-assisted conceptual illustration using OpenAI ChatGPT (see Section 2.10).
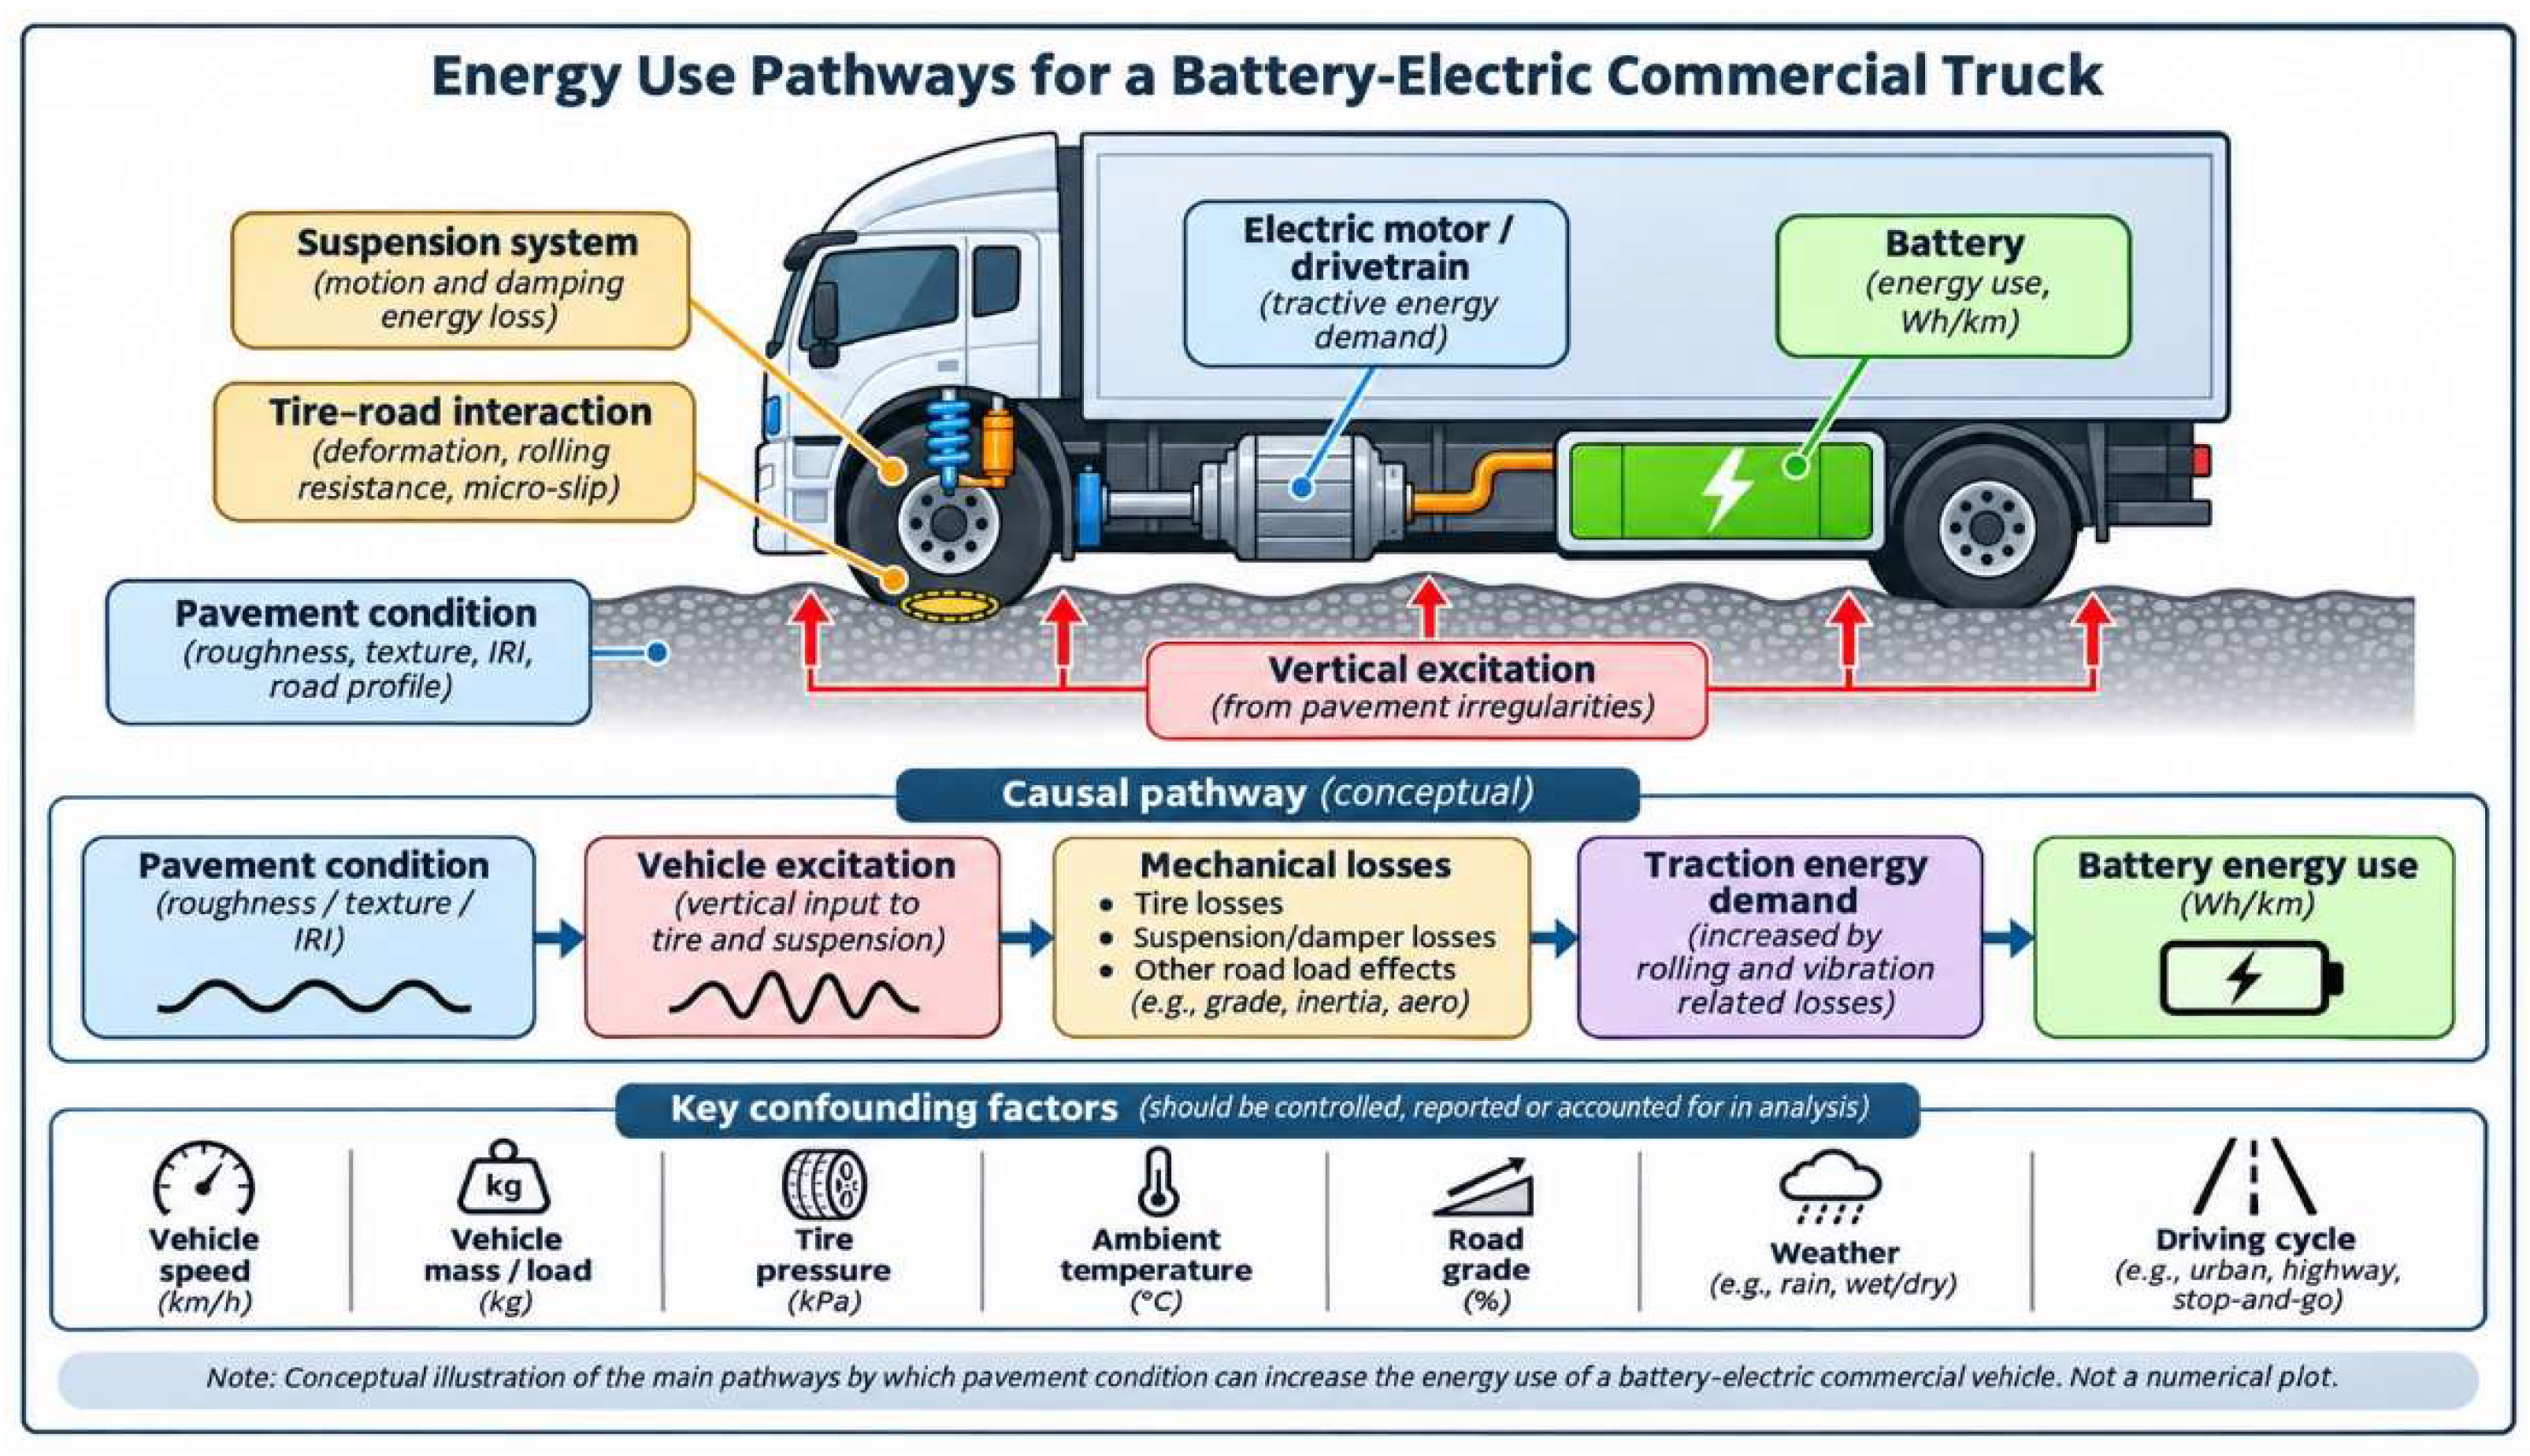
Figure 2.
Distinct energy-accounting boundaries in battery-electric road vehicles. Battery-terminal electricity, wheel work, component dissipation, auxiliary demand and gross recovered electricity are not directly interchangeable. AI-assisted conceptual illustration using OpenAI ChatGPT (see Section 2.10).
Figure 2.
Distinct energy-accounting boundaries in battery-electric road vehicles. Battery-terminal electricity, wheel work, component dissipation, auxiliary demand and gross recovered electricity are not directly interchangeable. AI-assisted conceptual illustration using OpenAI ChatGPT (see Section 2.10).
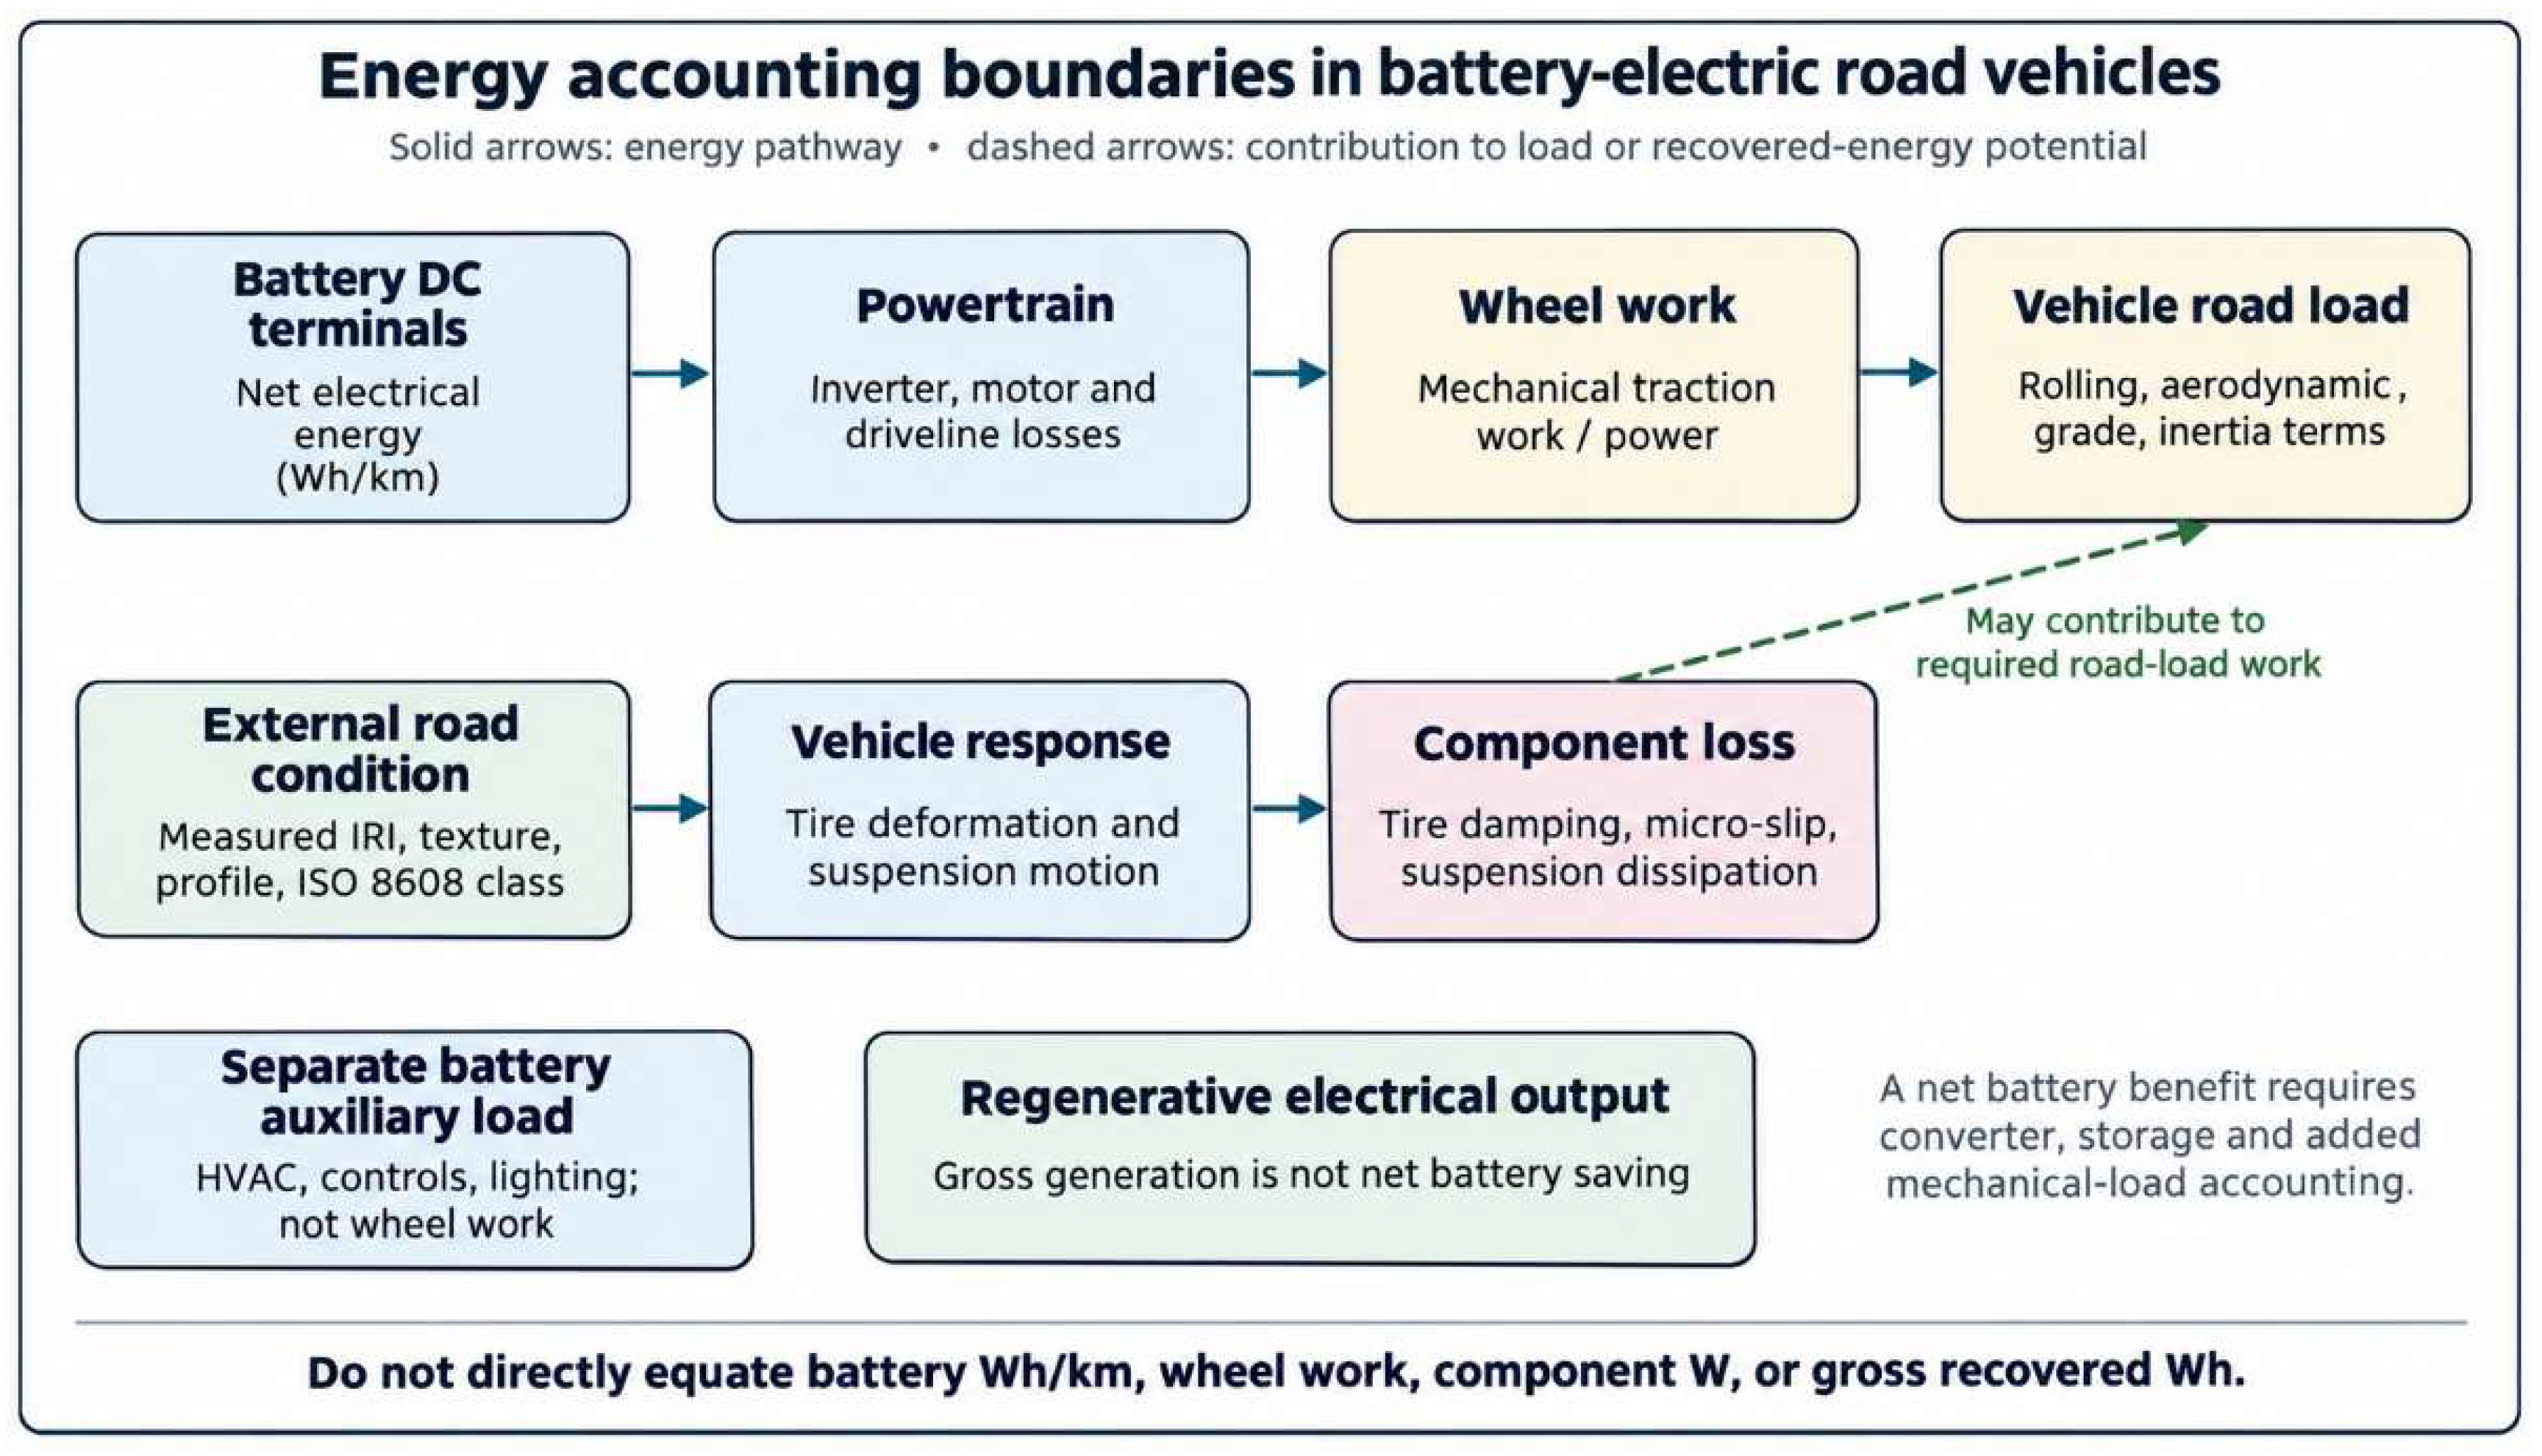
Figure 3.
Examples of pavement-exposure and energy-outcome boundaries in the selected studies [4,6,9,10,12]. These comparisons are illustrative, not a PRISMA evidence map or a study-quality ranking. AI-assisted conceptual illustration using OpenAI ChatGPT (see Section 2.10).
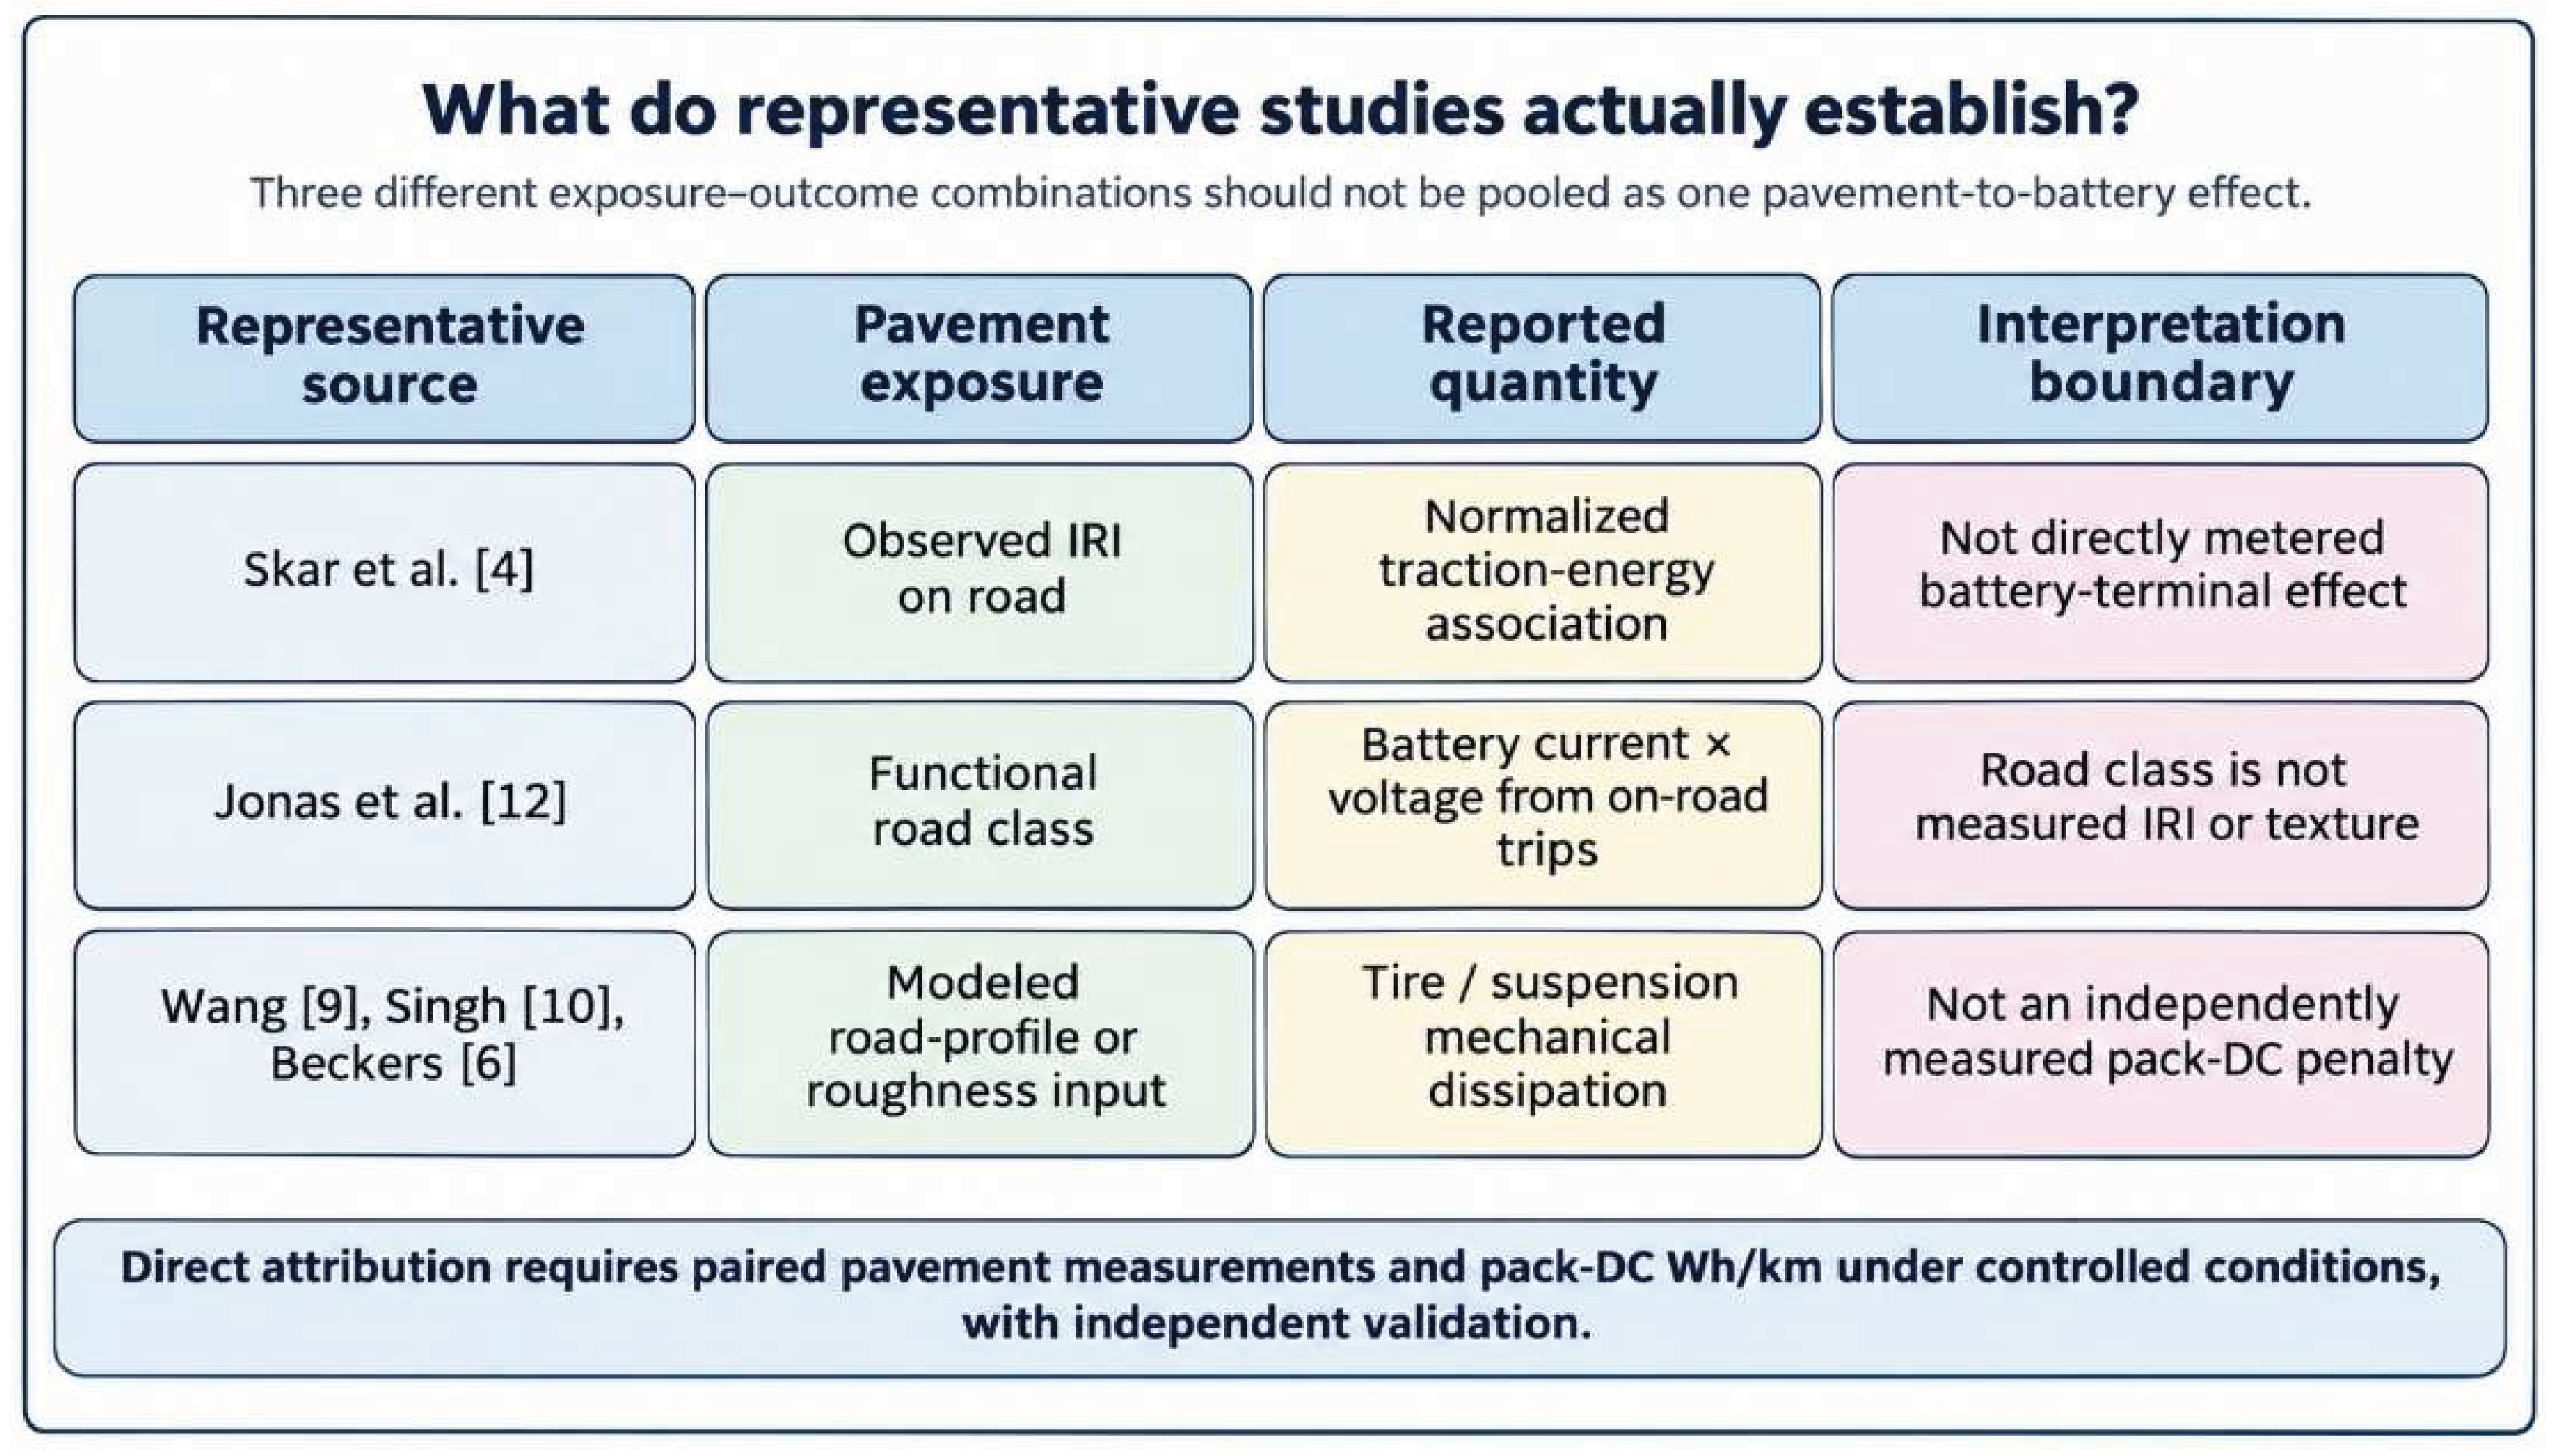
Table 4.
Eleven publications closest to the pavement–BEV energy question: reported outcomes and critical interpretation boundaries.
Table 4.
Eleven publications closest to the pavement–BEV energy question: reported outcomes and critical interpretation boundaries.
| Paper | Road input / vehicle | Authors’ outcome boundary | Critical reading / inference limit |
|---|---|---|---|
| [17] Gravante 2026 | Measured IRI / texture on test-track asphalt; instrumented BEV | Measured tire rolling-resistance coefficient | Publisher June version corrects Table 1 images and a Table 3 caption symbol; no numerical correction claimed. Full corrected numeric-effect extraction remains unavailable; pack-DC impact unmeasured. |
| [9] Wang et al. 2023 | Synthetic nonstationary PSD road profiles; speed-varying 7-DOF half-EV | Calculated shock-absorber power and wheel-slip energy | Original [9] article inspected; model-based outcome, no direct pack-DC or independent EV road energy measurement established. |
| [10] Singh et al. 2025 | IRI-specific synthetic 1-km roads; 21-DOF electric semitrailer model | Modeled roughness-induced dissipation; converted roughness-related electricity | 704% modeled good-to-poor dissipation; does not mean 704% higher measured total battery electricity ([10], Figure 12, Table 2). |
| [6] Beckers et al. 2025/26 | ISO 8608 A–D synthetic profiles; quarter-car model used for electric bus after diesel-bus response validation | Modeled damper and vertical-tire dissipation; compared with separate road-load information | 0.17 kWh/km on Class D at 40 km/h is modeled mechanical dissipation. Recorded response validation used a diesel bus; no metered BEB battery effect. |
| [4] Skar et al. 2023 | Independent laser-profile IRI; connected EV field passes | Measured/normalized traction-related energy | 3.4% per +1 m/km IRI on normalized residual; not direct pack DC causality. |
| [25] Chun et al. 2024 | Scenario-level pavement roughness and electrified fleet | Modeled GHG/emissions and related use-stage energy | Life-cycle/grid outcomes depend on energy mix; not controlled single-BEV battery measurement. |
| [11] Demir & Savran 2026 | ISO 8608 A/B and discrete bumps; quarter-car BEV simulations | Modeled harvested suspension electrical energy, Wh/km | Gross recovery, not battery net savings; low-speed energy balance needs cross-check. |
| [22] Vergura 2020 | Simulated road irregularity with IRI values 2, 5, 11 m/km | Modeled electrical load recovery in shock absorber, joules | External-load output not pack charging; model outcomes not vehicle-range effects. |
| [26] Multi-mode strategy 2023 | Pavement-level recognition; active-regenerative suspension control | Controller/suspension recovery and control performance | Pavement classification and modeled control response; pack DC effect unverified. |
| [18] Sproch et al. 2026 | Road conditions in the original RDE-related conference chapter; quantified physical roughness exposure not verified | Publisher abstract: urban/rural/motorway BEV energy compared using OBD data, calculations from battery capacity/grid input, and GPS; no independently checked battery-DC definition or effect sizes | Urban/rural/motorway route categories are not measured IRI; do not assign results from a separate Sproch journal article to this chapter or claim an isolated pavement coefficient. |
| [12] Jonas et al. 2022 | Six functional road classes; real-world EV routes | Battery V×I-based energy per distance | Observed class differences mix speed, traffic and grade; not IRI effect. |
Disclaimer/Publisher’s Note: The statements, opinions and data contained in all publications are solely those of the individual author(s) and contributor(s) and not of MDPI and/or the editor(s). MDPI and/or the editor(s) disclaim responsibility for any injury to people or property resulting from any ideas, methods, instructions or products referred to in the content. |
© 2026 by the author. Licensee MDPI, Basel, Switzerland. This article is an open access article distributed under the terms and conditions of the Creative Commons Attribution (CC BY) license (http://creativecommons.org/licenses/by/4.0/).
Copyright: This open access article is published under a Creative Commons CC BY 4.0 license, which permit the free download, distribution, and reuse, provided that the author and preprint are cited in any reuse.