
Submitted:
16 November 2026
Posted:
18 November 2026
You are already at the latest version
Abstract
Retinopathy of Prematurity (ROP) remains one of the leading causes of preventable childhood blindness, yet automated detection remains challenging due to variations in retinal fundus image quality, contrast, acquisition device characteristics, and disease representation, which proposes a deep learning pipeline for binary classification of healthy and ROP cases using the recently introduced ROPReLes dataset, which contains 6004 retinal images from188 subjects. To mitigate bias and prevent data leakage, a patient-wise data split was performed. Multiple preprocessing strategies were tested, including three normalization methods, contrast enhancement techniques (CLAHE & histogram equalization) and color-space transformations. Several data augmentation and class-balancing strategies were also evaluated, including weighted sampling, on-the-go augmentation, offline augmentation, and ratio-based augmentation. Performance was assessed using both baseline and state-of-the-art architectures, including a custom 2D convolutional neural network, ResNet18, Inception-v1, Inception-v3, EfficientNet, and Swin Transformer. The results show that model performance is strongly influenced by the combined effects of preprocessing, augmentation, class balancing, batch size, and model architecture. Ratio-based augmentation, applied only on the minority class, was the most effective class- balancing strategy. Among the evaluated models, Inception-v3 achieved the highest AUC (88.5%) and an accuracy of 91.3%. These findings highlight the importance of optimizing preprocessing, data balancing, and model selection as a unified pipeline for developing reliable automated ROP screening systems.
Keywords:
CLAHE
; convolutional neural networks
; data augmentation
; deep learning
; EfficientNet
; image preprocessing
; inception-v3
; retinopathy of prematurity (ROP)
; swin transformer
1. Introduction
Retinopathy of Prematurity is a neurovascular disease that affects premature infants, having a low gestational age. This disease, if not treated at an early stage, could lead to severe blindness and impairment. This blindness is usually caused by an incomplete vascular development on the retina. Multiple studies indicated that a large number of infants experience irreversible vision loss related to ROP, and the disease remains a major cause of childhood blindness worldwide, particularly in regions with limited access to specialized ophthalmology care [1,2].
Clinical screening and diagnosis of ROP are complex because the disease is not defined by a single image modality. It involves several characteristics, including the retinal zone, disease stage, and the presence of pre-plus or plus disease. This diagnostic variability makes ROP a suitable but challenging target for model-based detection and Artificial Intelligence (AI) classification.
Traditional screening depends on the expert’s examination, often using binocular indirect ophthalmoscopy or wide-field digital retinal imaging [3,4,5]. Although screening programs have expanded, delayed diagnosis and misclassification remain important concerns. In addition, images acquired from different devices can differ in resolution, color profile, brightness, and contrast. These differences are critical for deep learning because models may learn acquisition-specific features rather than disease-specific features if preprocessing and validation are not properly designed.
Artificial intelligence and deep learning strategies have been increasingly applied in multiple disease related classifications, especially when it comes to medical image classification. In the case of ROP, previous literature review studies have explored the detection and severity classification with model accuracies and plus severity, focusing less on the preprocessing pipeline applied before the implementation of deep learning models. The preprocessing pipeline like class balancing, normalization, contrast enhancement, class balancing, and batch size change directly influence how well the model learns and generalizes. For medical image classification, these factors are not secondary details; they directly influence which features the model learns and how well it generalizes. This study aims to establish an effective deep learning pipeline for binary classification of Retinopathy of Prematurity (ROP) using the ROPReLes dataset by systematically evaluating preprocessing techniques, data augmentation strategies, class-balancing methods, and deep learning architectures to identify the most reliable configuration. Studies have also discussed the application of artificial intelligence in ophthalmology and digital health for retinal diseases [6,7]. More broadly, the use of artificial intelligence in medicine and intelligent systems has been explored in the literature [8,9,10]. The increasing attention toward healthcare-related artificial intelligence has also been reflected in industry investment and commercial activity [11].
1.1. Clinical Background and Retinal Image Acquisition
Retinopathy of Prematurity (ROP) is a neurovascular disorder that affects premature infants whose normal retinal vascular development is incomplete. Abnormal vascular growth may develop as the disease progresses, potentially leading to retinal detachment and permanent visual blindness if severe cases are not identified and treated appropriately [12,13]. ROP is clinically described according to retinal zones, and stages. The three zones indicate the location of the disease relative to the optic nerve, progressing from Zone I, the most posterior region, through Zone II, to the peripheral Zone III. Disease staging ranges from Stage 1, characterized by a demarcation line between vascularized and avascular retina, to Stage 2, characterized by a ridge; Stage 3, involving extraretinal fibrovascular proliferation; Stage 4, involving partial retinal detachment; and Stage 5, involving total retinal detachment. Aggressive posterior ROP is a particularly severe, rapidly progressive form that requires prompt clinical assessment [14,15,16]. Digital imaging enables retinal fundus photographs to be stored for documentation, tele-screening, and computer-assisted analysis. The ROPReLes dataset used in this study contains images acquired using three imaging systems: Clarity RetCam III, Phoenix ICON, and Natus RetCam Envision [17,18,19]. Differences in image appearance across acquisition devices can introduce variation in color, contrast, brightness, and resolution, making preprocessing and robust model evaluation important considerations in automated ROP classification [20].
1.2. Related Deep Learning Work
Deep learning has been widely investigated for several tasks related to retinopathy of prematurity (ROP), including plus disease detection, disease staging, and the classification of retinal abnormalities. Convolutional neural networks (CNNs) have demonstrated promising performance in analyzing retinal fundus images [21]. However, these tasks differ in their clinical objectives, datasets, and evaluation protocols. Therefore, reported performance should be interpreted within the context of each study rather than compared directly.
Deep learning has been investigated for several ROP-related tasks. Brown et al. [22] developed a convolutional neural network for automated plus disease diagnosis, achieving AUC values of 0.94 and 0.98 for distinguishing normal, pre-plus, and plus disease images. However, their work focused specifically on plus disease rather than binary ROP classification. Li et al. [6] reviewed AI applications in ophthalmology, reporting AUC values ranging from 0.889 to 0.991 across different systems, although the review covered multiple ophthalmic conditions rather than ROP classification specifically. Similarly, Karri et al. [23] applied transfer learning with GoogLeNet for OCT classification, achieving 94% test accuracy and up to 96% in the best experiment, but focused on AMD and DME rather than ROP. Chen et al. [24] investigated CNN-based ROP stage detection, achieving AUROC values of 0.99 and 0.97, although performance dropped to 0.62 during cross-population evaluation, highlighting generalization challenges. Furthermore, Hasal et al. [25,26] explored ROP image enhancement and U-Net-based retinal vessel segmentation. However, these studies focused on image enhancement and segmentation rather than comprehensive ROP classification pipelines.
Beyond conventional CNN architectures, transformer-based approaches, including Vision Transformers and Swin Transformers, have also been explored for medical image analysis [27,28]. Nevertheless, model performance depends not only on architecture but also on preprocessing, class distribution, dataset characteristics, and validation strategies. The differences in clinical objectives and evaluation protocols across previous studies also make direct performance comparisons difficult. Therefore, this study addresses these considerations through a systematic evaluation of preprocessing techniques, class-balancing strategies, batch sizes, and six deep learning architectures using patient-wise data splitting for binary ROP classification.
Preprocessing is an important consideration in retinal fundus image analysis because variations in illumination, contrast, color, and the image as a whole may affect the features learned by deep learning models [29]. Contrast-limited adaptive histogram equalization (CLAHE) can enhance local contrast, while normalization methods such as Min–Max and Z-score normalization modify the intensity distribution of images. Previous studies have also investigated image enhancement and retinal vessel segmentation techniques in the context of ROP-related image analysis [25,26]. However, the effectiveness of a preprocessing method should be assessed in relation to the classification task and model architecture rather than assumed to improve performance in every setting [25,26]
The ROPReLes dataset introduced provides an opportunity to investigate these factors using retinal fundus images acquired with three imaging systems: Clarity RetCam III, Phoenix ICON, and Natus RetCam Envision. The dataset contains 6,004 images from 188 infants, together with clinical and image acquisition metadata. Its multi-device composition provides a useful basis for studying variability in retinal fundus images. Because multiple images may originate from the same infant, patient-level data separation is important to reduce the risk of information leakage between training, validation, and test sets. The present study investigates deep learning-based binary classification of healthy and ROP-affected cases using the ROPReLes dataset. It examines different preprocessing configurations, including color-space transformations, intensity normalization, and contrast enhancement, and compares the performance of several convolutional neural network and transformer-based architectures. A patient-wise data split is used to reduce the risk of information leakage between the training, validation, and test sets. The study aims to identify effective combinations of preprocessing methods and model architectures for the classification task.
2. Materials and Methods
This section explains the methodology adopted for automated binary classification of ROP using the ROPReLes dataset. The proposed methodology, seen in Figure 1, consists of four main stages: data preprocessing, patient-wise data split, data augmentation for class-balancing, and deep learning model training and evaluation. For preprocessing, three normalization techniques (Z-score, Min-Max, and Mean normalization) and two contrast enhancement methods (Contrast Limited Adaptive Histogram Equalization (CLAHE) and Histogram Equalization) were investigated. To prevent data leakage, a patient wise split was performed followed by several data augmentation strategies and batch sizes to address class imbalance. Finally, baseline and state-of-the-art deep learning architectures were trained and evaluated using the standard evaluation metrics: Area Under the Receiver Operating Characteristic Curve (AUC) and accuracy.
2.1. Dataset Description
The dataset used in this study is the ROPReLes dataset, consisting of 6004 retinal fundus images from 188 infant subjects [30]. The images were collected at the University Hospital Ostrava in the Czech Republic during clinical screening for infants at risk of ROP. The screening process included infants born under 32 weeks of gestational age or with birth weight lower than 1500 g.
The fundus images were collected by specialists using three different modalities, the Clarity RetCam III, Natus RetCam Envision, and Phoenix ICON [30].
The dataset includes, as seen in Figure 2, metadata of the patient ID, sex, gestational age, birth weight, post-conceptual age, diagnosis code, plus form, device type, and series number. For example, each image has a name such as 001_F_GA41_BW2905_PA44_DG11_PF0_D1_S01_1.jpg which describes the patient identifier, sex, gestational age, birth weight, post-conceptual age, diagnosis code, plus form, device, series, and image number.
Although the dataset contains more detailed diagnosis codes, as seen in Table 1, binary classification was selected as the first stage because it provides a foundation for later multiclass ROP staging and plus disease classification.
2.2. Patient-Wise Data Splitting
To prevent data leakage between the training, validation, and testing phases, a patient-wise stratified splitting strategy was adopted to ensure that images belonging to the same patient were assigned exclusively to one subset. The dataset, with the removed unrelated diagnosis groups, consisted of 4,330 images from 148 patients. These were divided into three subsets, placed in the pie chart in Figure 3: 105 patients (3,406 images) for training, 21 patients (488 images) for validation, and 22 patients (436 images) for testing. This approach ensured that no patient appeared in more than one subset, reducing the risk of the models learning patient-specific patterns rather than disease-generalizable features.
2.3. Image Preprocessing
Before model training, validation or testing, retinal fundus images were preprocessed to limit variability introduced by differences in imaging devices and acquisition conditions. Variations in color, illumination, brightness and contrast are essential in ROP fundus images, knowing that they often exhibit uneven brightness, low contrast, blur, or color differences introduced by the different imaging modalities. If improper preprocessing is established, a deep learning model may learn device artifacts rather than clinically relevant patterns, leading to poor diagnostic performance.
In addition, normalization was applied to bring image values into a consistent numerical range and stabilize model optimization. Contrast enhancement was used to improve visibility like vessel structures, retinal texture, and ROP-related changes. The optimal preprocessing pipeline was chosen according to its classification performance.
2.3.1. Normalization
The three-difference type of normalization techniques that were applied on the ROPReLes dataset separately were the min-max normalization, z-score normalization, and mean normalization. Min-max normalization changes the pixel values into a fixed range, usually between 0 and 1. Z-score normalization standardizes the image intensity distribution by subtracting the mean and dividing by the standard deviation. Mean normalization centers images around their average intensity and reduces global differences [31,32].
As shown in the table below, preliminary comparison showed that the different normalization methods produced similar visual outputs for many retinal images. Therefore, the final selection of the normalization technique was based on its impact on deep learning model performance rather than on visual appearance alone.

Table 2.
Representative standard deviation values for normalization trials.
| Image Filename | Original (std) | Min-Max (std) | Z-score (std) | Mean Norm (std) |
|---|---|---|---|---|
| 001_F_GA41_BW2905_PA44_DG11_PF0_D1_S01_1.jpg | 40.23 | 42.99 | 42.99 | 42.99 |
| 001_F_GA41_BW2905_PA44_DG11_PF0_D1_S01_10.jpg | 32.25 | 36.27 | 36.27 | 36.27 |
| 001_F_GA41_BW2905_PA44_DG11_PF0_D1_S01_11.jpg | 40.90 | 42.48 | 42.48 | 42.47 |
| 001_F_GA41_BW2905_PA44_DG11_PF0_D1_S01_12.jpg | 37.79 | 40.22 | 40.22 | 40.22 |
2.3.2. Contrast Enhancement
Some ROP images have issues with the visibility of vessels, ridges and abnormal patterns which directly affect the feature extraction process, worsening the overall performance. Here comes the importance of Histogram equalization, which redistributes global intensity values based on a single image histogram. Although this can increase contrast, it may also amplify noise and create unnatural brightness changes., Contrast-Limited Adaptive Histogram Equalization (CLAHE) solves this issue by applying local histogram equalization to smaller regions and limits excessive contrast amplification through a clipping threshold [33].
There are different types of color spaces, Figure 4, when it comes to Histogram Equalization and CLAHE like: Greyscale, LAB (CIELAB), YCrCb (Luma (Y), red-difference chroma (Cr), and blue-difference chroma (Cb), and HSV (Hue, Saturation, and Value) color spaces. For LAB, enhancement was applied to the L channel, which represents lightness. For YCrCb, enhancement was applied to the Y channel, which represents luminance. For HSV, enhancement was applied to the V channel, which represents brightness. Table 3 illustrates that standard histogram equalization increased contrast, while CLAHE provided more moderate enhancement. For example, seen in the table below, for S01_1.jpg, the standard deviation increased from 40.23 in the original image to 80.32 after grayscale HE, whereas grayscale CLAHE resulted in a lower value of 44.42.
2.4. Data Augmentation and Class Balancing
The training set exhibited a substantial class imbalance, with 2,120 healthy images (DG0) compared with 1,286 images across the diseased categories (DG1, DG2, DG3, DG4, and DG8). To reduce the risk of bias toward the majority class, class-balancing strategies were investigated by augmenting training images, while keeping the validation and test sets unchanged. Geometric transformations, including horizontal flipping and rotations of approximately ±10° to ±15°, were considered to introduce variability while preserving the overall retinal structures relevant to classification.
2.4.1. Weighted Sampling and On-the-Go Augmentation
The first augmentation method tested combined weighted sampling with on-the-go augmentation. Weighted sampling modifies the probability of selecting training samples, allowing images from the minority class to be sampled more frequently during training. This improves batch-level representation of the minority class without changing the original dataset. On-the-go augmentation transforms images during training, enabling the model to observe multiple augmented versions of the same retinal image on multiple epochs, improving robustness and generalization.
2.4.2. Standard Offline Augmentation by a Factor of Two
After trying out the weighted sampling and on the go augmentation, the second augmentation strategy was the standard offline augmentation by the multiplication of a factor. In this trial, the ROP images available in the training set were augmented by the factor of two. This strategy increases the set size from 3406 images to 6812 images. An augmentation factor of two was chosen to address the moderate class imbalance while avoiding excessive augmentation of the minority class.
2.4.3. Ratio-Based Augmentation
The third augmentation strategy involved ratio-based augmentation, in which different augmentation factors were assigned to the healthy and diseased classes to address class imbalance. The augmentation factor for the diseased groups was calculated based on the ratio between the number of healthy images (2,120) and the total number of diseased images (1,286), resulting in a factor of approximately 1.65. Two configurations were investigated: ratio-based augmentation with and without augmentation of the healthy class. In the first configuration, the diseased diagnosis groups (DG1, DG2, DG3, DG4, and DG8) were augmented by a factor of approximately 1.65, while the healthy group (DG0) was doubled. This increased the healthy group from 2,120 to 4,240 images and the combined diseased groups from 1,286 to approximately 2,120 images, resulting in a total of 6,360 training images. In the second configuration, the same ratio-based augmentation was applied exclusively to the diseased groups, while the healthy group remained unchanged at 2,120 images. The combined diseased groups increased to approximately 2,120 images, resulting in a total of 4,240 training images. This configuration avoided further augmentation of the majority healthy class. Both configurations were evaluated experimentally. Based on the experimental evaluation, ratio-based augmentation without healthy-class augmentation was retained as the final class-balancing strategy.
2.4.4. Conditional Generative Adversarial Network (cGAN) Trial
A generative network was also investigated as a potential augmentation approach. Retinal images were introduced into a Conditional Generative Adversarial Network (cGAN) architecture with the objective of generating additional synthetic images for the minority (ROP) class. In principle, this approach could help address class imbalance by increasing the number of minority-class samples. However, the generated outputs were not sufficiently reliable for use in the classification pipeline, as they exhibited low image quality, pixelation, and insufficient visual detail, as illustrated in Figure 5 and Figure 6. These limitations are consistent with challenges reported in GAN-based biomedical image generation, including training instability, mode collapse, and the production of blurry or unrealistic synthetic images [34]. Similar limitations have also been reported in ophthalmic image generation, where GAN-generated images may exhibit spatial distortions, unintended changes, and visual artifacts [35]. Consequently, the generated images were excluded from the final training dataset.
2.5. Deep Learning Architectures
When it comes to the evaluation process and classification, multiple architectures were tried comparing different architectures for the same approach. All models were given the task of binary classification separating healthy and diseased ROP cases in the data set. The images, as mentioned previously, underwent the three normalization techniques, contrast enhancement (CLAHE) in different color spaces, with ratio-based augmentation.
Starting with the 2D-CNN, it served as the initial baseline model where it used convolutional layers accompanied by pooling layers, flattening layers and a fully connected layer to finally give an output dependent on the learned patterns and edges in the retinal images [36]. Knowing that this model is relatively simple, it was useful to determine if the classification task was feasible, especially in the case of easy architectures.
ResNet-18 was the second used architecture, known for its skip connections that allows the model to observe deeper networks and unlocks its ability to detect more patterns and edges in the process of learning [37,38]. In the case of ROP images, this is useful because vessel information and disease patterns must both be preserved by the model in order to accurately classify between healthy or ROP.
Inception-v1 was chosen because it processes features that are available in the images at multiple scales through multiple parallel convolutional branches [38]. Whereas, the Inception-v3 extends the Inception family using factorized convolutions and more efficient feature extraction, making it suitable for detecting both subtle local texture and larger structural patterns [39].
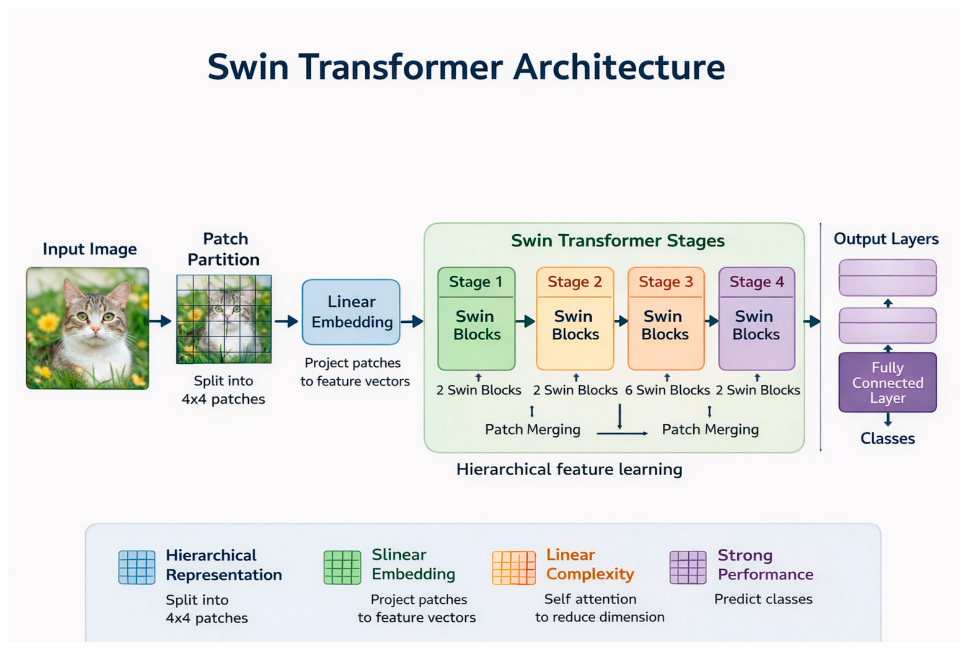
Finally, the last two architectures and models that were tried, were the EfficientNet and Swin Transformer. The EfficientNet model uses compound scaling to balance network depth, width, and input resolution [40]. It was included because it can achieve strong performance while maintaining computational efficiency. Swin Transformer was included to test a vision transformer architecture based on shifted-window attention [28]. Unlike CNNs, it can model relationships between image patches and may capture broader spatial dependencies in retinal images.
Figure 7.
2D-CNN Architecture with four convolutional layers, batch normalization, ReLU, max-pooling, adaptive pooling, dropout and the classification layer.
Figure 7.
2D-CNN Architecture with four convolutional layers, batch normalization, ReLU, max-pooling, adaptive pooling, dropout and the classification layer.
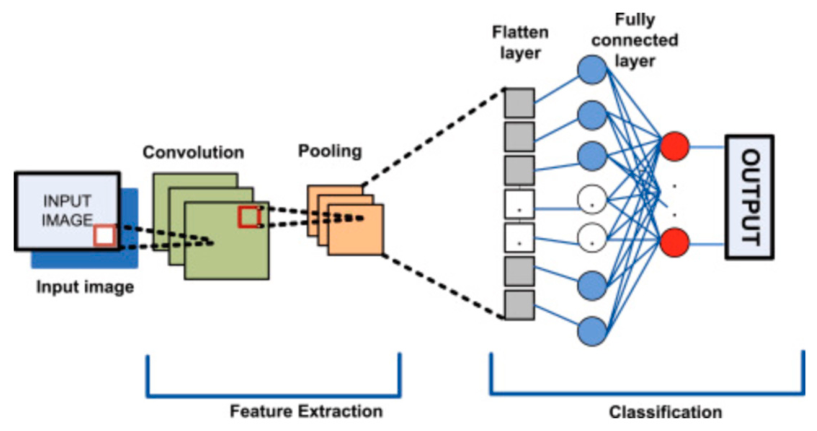
Figure 8.
ResNet-18 architecture with the convolution and max-pooling layers, four residual stages with skip connections, global pooling, and the classification layer..
Figure 8.
ResNet-18 architecture with the convolution and max-pooling layers, four residual stages with skip connections, global pooling, and the classification layer..
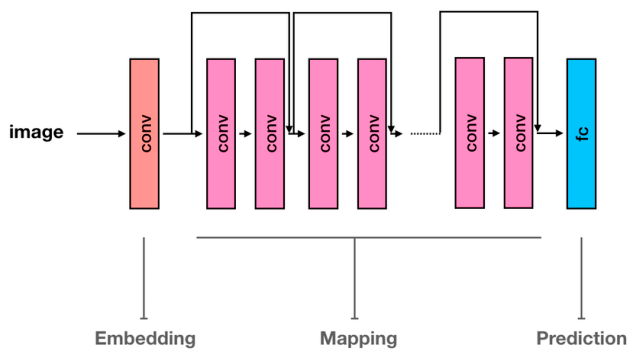
Figure 9.
Inception-v1 (GoogLeNet) architecture showing the initial convolutional layers, multi-scale Inception modules, pooling layers, and classification head..
Figure 9.
Inception-v1 (GoogLeNet) architecture showing the initial convolutional layers, multi-scale Inception modules, pooling layers, and classification head..
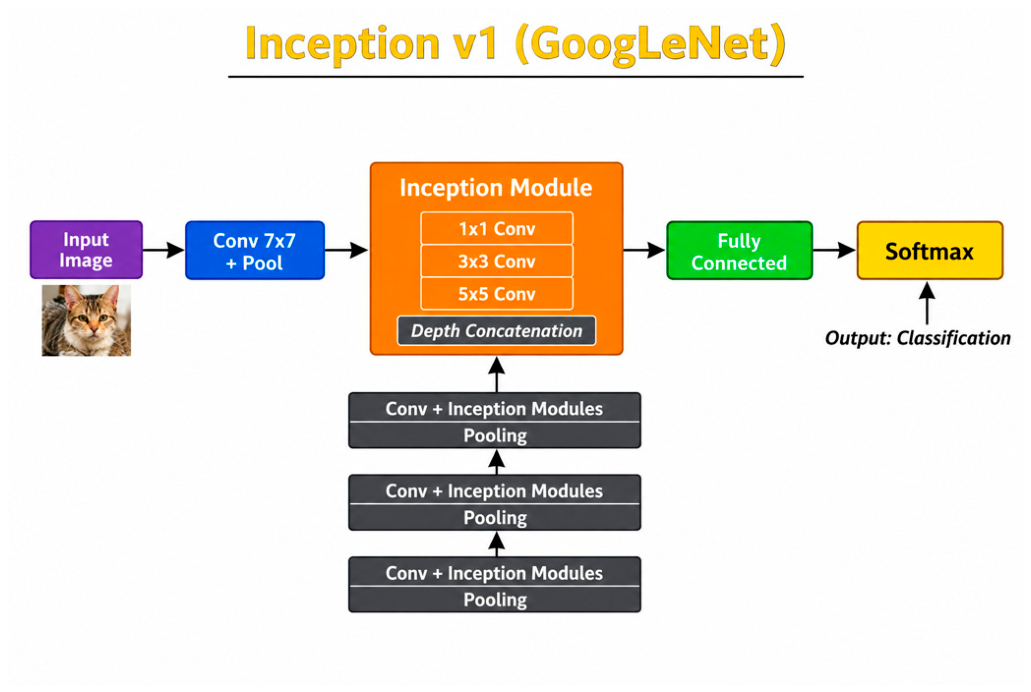
Figure 10.
Inception-v3 architecture with factorized convolutional modules, global pooling and classification layer.
Figure 10.
Inception-v3 architecture with factorized convolutional modules, global pooling and classification layer.
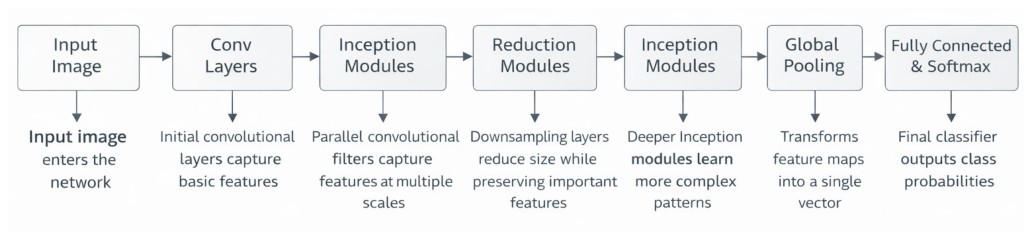
Figure 11.
EfficientNet showing the convolutional stem, MBConv blocks with squeeze-and-excitation modules, global average pooling, and classification head..
Figure 11.
EfficientNet showing the convolutional stem, MBConv blocks with squeeze-and-excitation modules, global average pooling, and classification head..
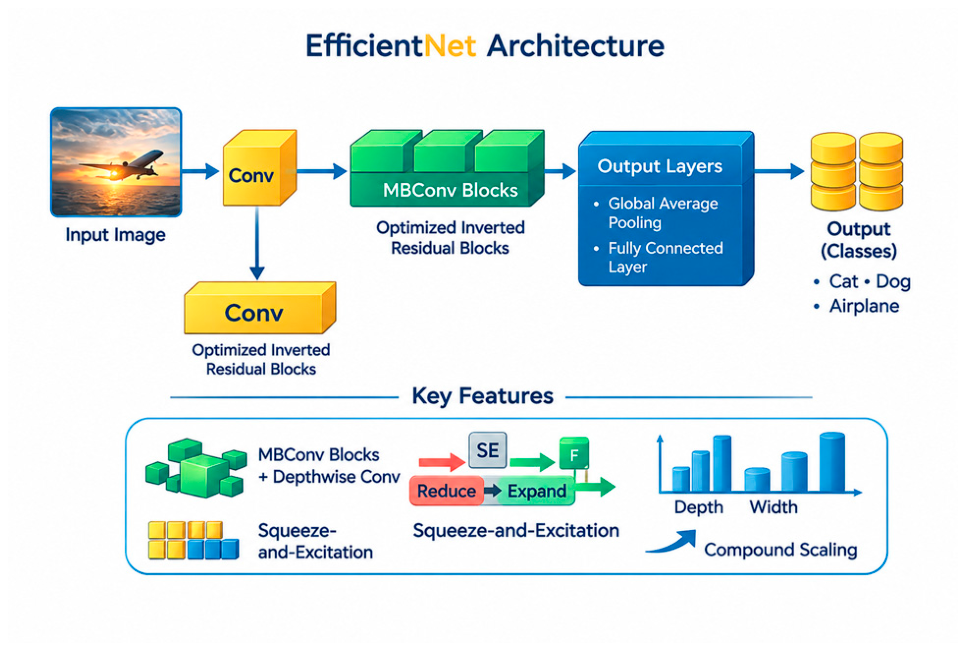
Figure 12.
Swin Transformer architecture showing patch embedding, hierarchical Transformer stages, shifted-window attention, patch merging, and classification head.
Figure 12.
Swin Transformer architecture showing patch embedding, hierarchical Transformer stages, shifted-window attention, patch merging, and classification head.
To further investigate the effect of training parameters on model performance, three batch sizes were evaluated: 32, 64, and 128.This batch size change affects the number of images used before each weight with the class composition available inside each training batch
3. Evaluation Metrics
Model performance was evaluated using two primary metrics: accuracy and AUC. Accuracy measures the proportion of correctly classified images and provides an overall assessment of classification performance, as seen in equation 1. However, accuracy alone may be misleading when class imbalance is present, as a classifier can achieve high accuracy by favoring the majority class. Therefore, AUC, seen in equation 2, was also used to evaluate the model’s ability to discriminate between healthy and diseased retinal images across different classification thresholds. This metric is important for ROP classification, where the diseased class is underrepresented.
Equation 1. Accuracy Equation
where TP, TN, FP, and FN represent true positives, true negatives, false positives, and false negatives, respectively.
Equation 2. AUC equation
Where the ROC curve is constructed by plotting the True Positive Rate (TPR) against the False Positive Rate (FPR).
4. Results
4.1. Preliminary Baseline Results
The preliminary results were obtained using the 2D-CNN and ResNet-18 models without data augmentation. These experiments aimed to assess the feasibility of binary classification using preprocessed retinal images. The preprocessing pipeline evaluated CLAHE in combination with three normalization techniques (Min-Max, Z-score, and Mean normalization) across different color spaces. The results showed that CLAHE improved classification performance compared with conventional Histogram Equalization (HE). For ResNet-18, the best test performance was obtained using LAB color space with Min-Max normalization, achieving an accuracy of 95.0% and an AUC of 80.5%. For the 2D-CNN, LAB color space with Z-score normalization achieved the highest AUC of 89.5%, while YCrCb with Min-Max normalization achieved the highest accuracy of 93.6%. These results demonstrate that both models could learn discriminative retinal features, while also highlighting their sensitivity to preprocessing choices.
4.2. Augmentation Strategy Comparison
After the preliminary results of both models, the performance of the three different types of augmentation was compared: weighted sampling with on-the-go augmentation, standard augmentation by a factor of two, and ratio-based augmentation. The results, seen in the tables below, indicated that the effectiveness of each augmentation strategy varied across the evaluated models. While weighted sampling and standard augmentation improved performance in certain cases, ratio-based augmentation consistently provided the best overall balance between the healthy and diseased classes. Consequently, it was selected as the final augmentation strategy, as it effectively reduced class imbalance while preserving the original class distribution and mitigating bias toward the majority class.
Table 4.
Best weighted sampling and on-the-go augmentation results.
| Model | Setting | Best preprocessing | Test Accuracy | Test AUC |
|---|---|---|---|---|
| ResNet | Patient-wise CLAHE | HSV + Mean | 0.846 | 0.817 |
| 2D-CNN | Patient-wise CLAHE | LAB + MinMax | 0.906 | 0.754 |
| ResNet | Patient-wise HE | HSV + Mean | 0.647 | 0.722 |
| 2D-CNN | Patient-wise HE | YCrCb + Z-score | 0.922 | 0.826 |
Table 5.
Best standard augmentation results using a factor of two.
| Model | Setting | Best preprocessing | Test Accuracy | Test AUC |
|---|---|---|---|---|
| ResNet | CLAHE | LAB + MinMax | 0.950 | 0.800 |
| 2D-CNN | CLAHE | LAB + Z-score | 0.920 | 0.890 |
| ResNet | Patient-wise CLAHE | Grey + Z-score | 0.917 | 0.813 |
| 2D-CNN | Patient-wise CLAHE | HSV + Mean | 0.846 | 0.803 |
| ResNet | Patient-wise HE | YCrCb + Z-score | 0.904 | 0.823 |
| 2D-CNN | Patient-wise HE | YCrCb + Mean | 0.853 | 0.779 |
Table 6.
Best ratio-based augmentation results.
| Model | Ratio setting | Best preprocessing | Test Accuracy | Test AUC |
|---|---|---|---|---|
| ResNet | Ratio without normal augmentation by two | LAB + Z-score | 0.890 | 0.860 |
| 2D-CNN | Ratio without normal augmentation by two | HSV + Mean | 0.880 | 0.730 |
| ResNet | Ratio with normal augmentation by two | Grey + Z-score | 0.920 | 0.870 |
| 2D-CNN | Ratio with normal augmentation by two | YCrCb + Z-score | 0.910 | 0.870 |
Although ratio-based augmentation with normal-class augmentation achieved a high AUC, it was not selected for the final strategy because the normal class was already overrepresented. The goal is not dedicated to achieving the best performance in a single experiment, but to choose a clinically meaningful balancing approach that improves representation of diseased classes without further strengthening the model’s bias toward the majority class. For this reason, ratio-based augmentation without normal-class augmentation was used in the final broader architecture comparison.
4.3. Batch Size Effect
These multiple experiments were repeated with the first preliminary models, the 2D-CNN and the ResNet-18 with the three different batch size changes 32, 64, and 128. The results have shown that the batch size changes effects were more dependent on the architectures selected. In the case of the ResNet-18, the accuracy improved when the batch size increased, but its AUC did not improve. The 2D-CNN became less stable with larger batch sizes, especially at batch size 128. As seen in the table below, it can be concluded that larger batches do not improve classification performance in general; and a smaller batch size of 32 may support the architectures better. To conclude, smaller batches provided more frequent weight updates and higher variability between batches. Since increasing the batch size didn’t improve the classification performance, a batch size of 32 was selected for all subsequent experiments across the evaluated architectures.
Table 7.
Effect of batch size on selected weighted and multiplication settings.
| Model | Augmentation setting | Preprocessing | Batch | Accuracy | AUC |
|---|---|---|---|---|---|
| ResNet | CLAHE (Weighted) | LAB MinMax | 32 | 0.90 | 0.75 |
| ResNet | CLAHE (Weighted) | LAB MinMax | 64 | 0.91 | 0.76 |
| ResNet | CLAHE (Weighted) | LAB MinMax | 128 | 0.92 | 0.67 |
| 2D-CNN | CLAHE (Weighted) | LAB Mean | 32 | 0.86 | 0.77 |
| 2D-CNN | CLAHE (Weighted) | LAB Mean | 64 | 0.85 | 0.70 |
| 2D-CNN | CLAHE (Weighted) | LAB Mean | 128 | 0.59 | 0.75 |
| 2D-CNN | CLAHE (Multiplication) | HSV Mean | 32 | 0.84 | 0.80 |
| 2D-CNN | CLAHE (Multiplication) | HSV Mean | 64 | 0.69 | 0.78 |
| 2D-CNN | CLAHE (Multiplication) | HSV Mean | 128 | 0.67 | 0.67 |
| ResNet | Patient-wise CLAHE (Multiplication) | LAB MinMax | 32 | 0.91 | 0.73 |
| ResNet | Patient-wise CLAHE (Multiplication) | LAB MinMax | 64 | 0.93 | 0.73 |
| ResNet | Patient-wise CLAHE (Multiplication) | LAB MinMax | 128 | 0.93 | 0.68 |
4.4. Final Different Baseline and State-of-the-Art Architectures Performance Comparison
The final comparison, seen in Table 8, included 2D-CNN, ResNet18, Inception-v1, Inception-v3, EfficientNet, and Swin Transformer. The models were evaluated images undergoing CLAHE preprocessing with different colorspaces, ratio-based augmentation that excluded normal-class augmentation, and the three normalization techniques. The goal was to compare architectures after selecting a preprocessing without bias and without having dominance in the classes.
As seen in the table above, Inception-v3 achieved the highest AUC, reaching 88.5%, with an accuracy of 91.3%. This made it the strongest model in terms of binary classification. EfficientNet achieved the highest accuracy, reaching 93.3%, but its AUC was lower than that of Inception-v3 and ResNet18. This difference is important because high accuracy does not always indicate strong distinguishing ability.
ResNet18 achieved a high performance with an accuracy of 89.7% and an AUC of 86.0%. Inception-v1 and Swin Transformer also achieved strong accuracies above 92%, but their AUC values were lower than the top two models. The baseline 2D-CNN achieved the weakest AUC, confirming that while simple architectures can learn useful ROP features, more advanced models are better suited for the final ROP classification.
5. Discussion
The results mentioned previously showed that ROP classification has significant potential, yet the model performance was not solely influenced by the choice of model’s architecture. Instead, it was strongly influenced by the combined effects of the imaging modality, preprocessing pipeline, data augmentation technique and batch size selection. One of the main findings of this study is the critical role of image preprocessing in achieving reliable classification performance. In medical imaging, particularly when datasets are acquired using different imaging devices and modalities, substantial variations in illumination, contrast, color distribution, and image quality can affect model performance. Consequently, establishing a robust preprocessing pipeline before model training is essential to reduce acquisition-related variability and enable the model to learn clinically relevant retinal features rather than device-specific artifacts.
The preprocessing experiments showed that contrast enhancement must be controlled carefully. Standard histogram equalization increased contrast, but created unnatural brightness changes and did not assist in the classification process overall. CLAHE offered a more moderate enhancement and was more suitable for ROP medical images. Applying contrast enhancement in different color spaces also affected the results because retinal color preservation is clinically meaningful. Some applications and machines may output images with different color spaces and this makes the architecture more reliable to real world issues.
The augmentation experiments highlighted the difference between increasing dataset size and correcting class imbalance. Standard augmentation by a fixed factor increased the number of training images and, but it preserved the relative imbalance between classes. Weighted sampling addressed batch composition but did not permanently change the dataset. Ratio-based augmentation was more targeted because it increased underrepresented pathological categories while avoiding further expansion of the majority normal class. This explains why it was retained as the final balancing direction.
The batch size change showed how changing details in architectures can influence the performance, where the ResNet-18 benefitted in accuracy from a larger batch size, it lost its ability to directly target ROP with its AUC.
Inception-v3 achieved the best AUC, and the EfficientNet had the highest accuracy, its lower AUC shows that accuracy alone is not enough for medical screening. The Swin Transformer also performed well, but it may need larger, more balanced datasets to fully benefit from attention-based learning.
Overall, convolutional models seemed better suited to this dataset accompanied by the right preprocessing pipeline and augmentation technique compared to other previous studies, as seen in Table 9.
5.1. Limitations
Some limitations are found in our study. First, the proposed approach was limited to binary classification (healthy versus diseased), whereas clinical ROP diagnosis involved a more comprehensive stage-based assessment. Therefore, the proposed framework should be considered an initial step toward more clinically representative ROP analysis. Second, although the ROPReLes dataset used is a heterogenous dataset including images acquired by three different imaging modalities, the proposed framework was evaluated on a single dataset. Validation on external datasets would be necessary. Finally, the accompanying patient metadata were not incorporated into the proposed model. As a result, the classification relied solely on retinal fundus images, whereas integrating clinical metadata with imaging information may further improve diagnostic performance in future work.
5.2. Future Work
Future work should extend the proposed framework beyond binary classification to address clinically relevant ROP tasks, including disease staging, zone classification, and plus disease detection. In addition, the clinical metadata provided with the ROPReLes dataset should be incorporated to develop multimodal models that combine retinal fundus images with patient-specific information, potentially improving diagnostic accuracy and robustness. Furthermore, the proposed preprocessing pipeline could be extended with out-of-distribution (OOD) detection techniques to identify images that differ significantly from the training distribution, such as images acquired using unseen imaging devices, low-quality retinal photographs, or retinal abnormalities unrelated to ROP. Finally, validating the proposed framework on external datasets would further assess its generalizability and applicability in real-world clinical settings. Future clinical implementation should also consider ethical aspects of artificial intelligence-assisted retinal diagnosis, including transparency and informed-consent requirements [41].
6. Conclusion
This study proposed and evaluated a comprehensive deep learning pipeline for the binary classification of Retinopathy of Prematurity (ROP) using retinal fundus images from the ROPReLes dataset. Rather than focusing solely on network architecture, the proposed framework systematically investigated the combined effects of image preprocessing, data augmentation, class balancing, batch size, and model selection on classification performance.
The experimental results showed that classification performance was strongly influenced by the full preprocessing pipeline, not only on the models’ architectures. In particular, ratio-based augmentation without normal-class augmentation provided the most clinically meaningful balancing strategy by improving the representation of diseased cases while avoiding additional bias toward the already dominant healthy class. Furthermore, a batch size of 32 generated the most consistent performance across the evaluated architectures. Among the tested models, Inception-v3 achieved the highest AUC (88.5%) with an accuracy of 91.3%, while EfficientNet achieved the highest classification accuracy (93.3%. Overall, the findings emphasize that reliable automated ROP screening depends not only on the choice of deep learning architecture but also on the careful design of the preprocessing and training pipeline. The proposed framework provides a strong baseline for future research and can be extended toward clinically relevant applications through multiclass ROP classification, multimodal learning incorporating patient metadata, out-of-distribution detection, and validation on external datasets.
Author Contributions
Conceptualization, M.Z.N.; methodology, M.Z.N.; software, M.Z.N.; validation, M.Z.N.; formal analysis, M.Z.N.; investigation, M.Z.N.; data curation, M.Z.N.; writing-original draft preparation, M.Z.N.; writing-review and editing, M.D. and M.G.; supervision, M.D. and M.G. All authors have read and agreed to the published version of the manuscript.
Funding
This research received no external funding.
Institutional Review Board Statement
Not applicable for this secondary analysis because the study used a publicly available anonymized dataset. Ethical approval for the original data collection should be reported according to the ROPReLes dataset documentation [30].
Informed Consent Statement
Not applicable for this secondary analysis. Consent and ethical considerations related to the original image collection should be reported according to the original dataset documentation [30].
Data Availability Statement
The ROPReLes dataset used in this work is publicly available through the source described by Timkovic et al. [30]. The derived preprocessing and training scripts may be made available upon reasonable request.
Conflicts of Interest
The authors declare no conflict of interest.
References
- Hong, E. H.; Shin, Y. U.; Cho, H. Retinopathy of prematurity: A review of epidemiology and current treatment strategies. Clin. Exp. Pediatr. 2022, 65(3), 115–126. [Google Scholar] [CrossRef] [PubMed]
- Sabri, K.; Ells, A. L.; Lee, E. Y.; Dutta, S.; Vinekar, A. Retinopathy of prematurity: A global perspective and recent developments. Pediatrics 2022, 150(3), e2021053924. [Google Scholar] [CrossRef] [PubMed]
- Vinekar, A. Screening for retinopathy of prematurity: An update. Indian J. Ophthalmol. 2006, 54(10). Available online: https://journals.lww.com/ijo/fulltext/2006/54010/Screening_for_retinopathy_of_prematurity_a.7.aspx.
- Hillrom. Binocular indirect ophthalmoscope. Available online: https://www.hillrom.ca/en/products/binocular-indirect-ophthalmoscope/.
- Gupta, M.; et al. Color fundus imaging in retinopathy of prematurity. Indian Journal of Ophthalmology. 2023. Available online: https://journals.lww.com/ijo/fulltext/2023/05000/color_fundus_imaging_in_retinopathy_of_prematurity.18.aspx.
- Li, J. O.; Liu, H.; Ting, D. S. W.; et al. Game-theoretic artificial intelligence in ophthalmology. JAMA Netw. Open 2022, 5(7), e2223284. [Google Scholar] [CrossRef]
- Ting, D. S. W.; et al. Digital health for retinal disease. Lancet Digit. Health 2023, 5(5). [Google Scholar] [CrossRef] [PubMed]
- Buch, V. H.; Ahmed, I.; Maruthappu, M. Artificial intelligence in medicine: Current trends and future possibilities. Br. J. General. Pract. 2018, 68(668), 143–144. [Google Scholar] [CrossRef] [PubMed]
- Velasquez, J. D. Artificial intelligence for the future of medicine. ResearchGate. 2022. Available online: https://www.researchgate.net/profile/Juan-Velasquez-3/publication/363926877_Artificial_Intelligence_for_the_Future_of_Medicine/links/645ba02a2edb8e5f094db365/Artificial-Intelligence-for-the-Future-of-Medicine.pdf.
- Sajja, A. K.; et al. Intelligent systems review. Eng. Appl. Artif. Intell. 2025. [Google Scholar] [CrossRef]
- Insights, C.B. Healthcare remains the hottest AI category for deals. 2017. Available online: https://www.cbinsights.com/research/artificial-intelligence-healthcare-startups-investors/.
- Hellström, A.; Ley, D.; Hansen-Pupp, I.; et al. New insights into ROP. Dev. Med. Child Neurol. 2022. [Google Scholar] [CrossRef] [PubMed]
- Retinopathy of prematurity: The clinical picture. British Medical Journal. 1986. Available online: https://pmc.ncbi.nlm.nih.gov/articles/instance/1678671/pdf/bmj00039-0006.pdf.
- Chan, C.-C. Retinal anatomy and pathology. ResearchGate. 2015. Available online: https://www.researchgate.net/profile/Chi-Chao-Chan/publication/283260442_Retinal_Anatomy_and_Pathology/links/5653499908ae4988a7af80e4/Retinal-Anatomy-and-Pathology.pdf.
- ZEISS. ROP atlas. Available online: https://www.zeiss.co.in/meditec/c/rop-atlas.html.
- Rio-Tsonis, K. Eye anatomy. ResearchGate. Available online: https://www.researchgate.net/profile/Katia-Rio-Tsonis/publication/228017827_Eye_Anatomy/links/54c3fe750cf219bbe4ece0db/Eye-Anatomy.pdf.
- Wilkinson-Berka, J. L. Vasoactive factors and diabetic retinopathy. Eye Brain 2016. [Google Scholar] [CrossRef] [PubMed]
- ResearchGate. RetCam 3 retinal examination system [Figure]. Available online: https://www.researchgate.net/figure/Complex-system-RetCam-3-for-retinal-examination_fig2_332153120.
- NeoLight. Phoenix ICON retinal imaging system. Available online: https://theneolight.com/product-pages/phoenix-icon.
- Natus Medical Incorporated. RetCam Envision. Available online: https://natussensory.com/products/retcam-envision/.
- Mahee, N.; Ejaz, M. S. Identification of diabetic retinopathy using deep learning and ensemble model approach. J. Undergrad. Res. Int. 2025, 1(2), 39–44. [Google Scholar] [CrossRef]
- Brown, J. M.; Campbell, J. P.; Beers, A.; Chang, K.; Ostmo, S.; Chan, R. V. P.; Dy, J.; Erdogmus, D.; Ioannidis, S.; Kalpathy-Cramer, J.; Chiang, M. F. Automated diagnosis of plus disease in retinopathy of prematurity using deep convolutional neural networks. JAMA Ophthalmol. 2018, 136(7), 803–810. [Google Scholar] [CrossRef] [PubMed]
- Karri, S. P. K.; Chakraborty, D.; Chatterjee, J. Transfer learning-based classification of diabetic retinopathy. Int. J. Intell. Syst. 2020, 35(12), 1940–1962. [Google Scholar] [CrossRef] [PubMed]
- Chen, J. S.; Coyner, A. S.; Ostmo, S.; Sonmez, K.; Kalpathy-Cramer, J.; Chiang, M. F. Deep learning for the diagnosis of stage in retinopathy of prematurity. Ophthalmol. Retin. 2021, 5(4), 394–402. [Google Scholar] [CrossRef] [PubMed]
- Hasal, M.; Nowaková, J.; Hernández-Sosa, D.; Timkovič, J. Image enhancement in retinopathy of prematurity. In Advances in Intelligent Networking and Collaborative Systems (INCoS 2022); Lecture Notes in Networks and Systems; Springer: Cham, 2022; Vol. 527. [Google Scholar] [CrossRef]
- Hasal, M.; Pecha, M.; Nowaková, J.; Hernández-Sosa, D.; Snášel, V.; Timkovič, J. Retinal vessel segmentation by U-Net with VGG-16 backbone on patched images with smooth blending. In Advances in Intelligent Networking and Collaborative Systems (INCoS 2023); Lecture Notes on Data Engineering and Communications Technologies; Springer: Cham, 2023; Vol. 182. [Google Scholar] [CrossRef]
- OpenAI. A survey of vision transformers. arXiv 2023, arXiv:2302.07730. [Google Scholar]
- Liu, Z.; Lin, Y.; Cao, Y.; Hu, H.; Wei, Y.; Zhang, Z.; Lin, S.; Guo, B. Swin Transformer: Hierarchical vision transformer using shifted windows. In Proceedings of the IEEE/CVF International Conference on Computer Vision, 2021; pp. 9992–10002. [Google Scholar] [CrossRef]
- Akhtar, S.; Aftab, S.; Ali, O.; Ahmad, M.; Khan, M. A.; Abbas, S.; Ghazal, T. M. A deep learning-based model for diabetic retinopathy grading. Sci. Rep. 2025, 15, 3763. [Google Scholar] [CrossRef] [PubMed]
- Timkovič, J.; Nowaková, J.; Kubíček, J.; et al. Retinal image dataset of infants and retinopathy of prematurity. Sci. Data 2024, 11, 814. [Google Scholar] [CrossRef] [PubMed]
- Patro, S. G. K.; Sahu, K. K. Normalization: A preprocessing stage. arXiv. 2015. Available online: https://arxiv.org/pdf/1503.06462.
- Laska, R. R.; Yolanda, A. M. A comparative study of Z-score and min-max normalization for rainfall classification in Pekanbaru. Journal of Data Science. 2024. Available online: http://eprints.intimal.edu.my/1916/1/jods2024_04.pdf.
- Alwazzan, M. J.; Ismael, M. A.; Ahmed, A. N. A hybrid algorithm to enhance colour retinal fundus images using a Wiener filter and CLAHE. J. Digit. Imaging 2021, 34. Available online: https://pmc.ncbi.nlm.nih.gov/articles/PMC8329119/. [CrossRef] [PubMed]
- Saad, M. M.; O’Reilly, R.; Rehmani, M. H. A survey on training challenges in generative adversarial networks for biomedical image analysis. Artif. Intell. Rev. 2024, 57, 19. [Google Scholar] [CrossRef]
- You, A.; Kim, J. K.; Ryu, I. H.; Yoo, T. K. Application of generative adversarial networks (GAN) for ophthalmology image domains: A survey. Eye Vis. 2022, 9, 6. [Google Scholar] [CrossRef] [PubMed]
- Krizhevsky, A.; Sutskever, I.; Hinton, G. E. ImageNet classification with deep convolutional neural networks. Advances in Neural Information Processing Systems, 2012; Available online: https://proceedings.neurips.cc/paper_files/paper/2012/file/c399862d3b9d6b76c8436e924a68c45b-Paper.pdf.
- ResearchGate. ResNet architecture diagram [Figure]. Available online: https://www.researchgate.net/figure/A-schematic-view-of-ResNet-architecture-15-decomposed-into-three-blocks-embedding_fig1_333475917.
- Kalluri, H. K.; et al. Deep learning and transfer learning approaches for image classification. ResearchGate. 2019. Available online: https://www.researchgate.net/profile/Hemantha-Kumar-Kalluri/publication/333666150_Deep_Learning_and_Transfer_Learning_Approaches_for_Image_Classification/links/5cfbeeb9a6fdccd1308d6aae/Deep-Learning-and-Transfer-Learning-Approaches-for-Image-Classification.pdf.
- Szegedy, C.; Vanhoucke, V.; Ioffe, S.; Shlens, J.; Wojna, Z. Rethinking the Inception architecture for computer vision. In Proceedings of the IEEE Conference on Computer Vision and Pattern Recognition, 2016; pp. 2818–2826. [Google Scholar] [CrossRef]
- Tan, M.; Le, Q. V. EfficientNet: Rethinking model scaling for convolutional neural networks. In Proceedings of the 36th International Conference on Machine Learning, 2019; PMLR; pp. 6105–6114. [Google Scholar]
- Ursin, F.; Timmermann, C.; Orzechowski, M.; Steger, F. Diagnosing diabetic retinopathy with artificial intelligence: What information should be included to ensure ethical informed consent? Front. Med. 2021, 8, 695217. [Google Scholar] [CrossRef] [PubMed]
- Elsevier. Article S240584402414978X. ScienceDirect. 2024. Available online: https://www.sciencedirect.com/science/article/pii/S240584402414978X.
Figure 1.
General preprocessing and training workflow used in this study.
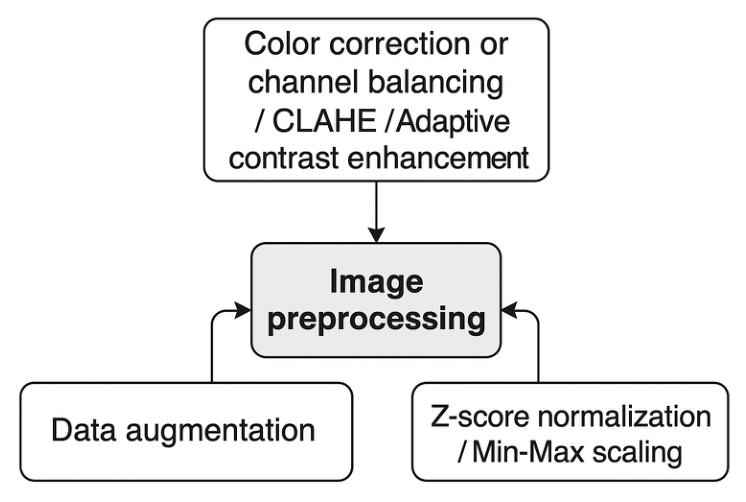
Figure 2.
Snapshot of the dataset metadata variables used for patient and image labeling.
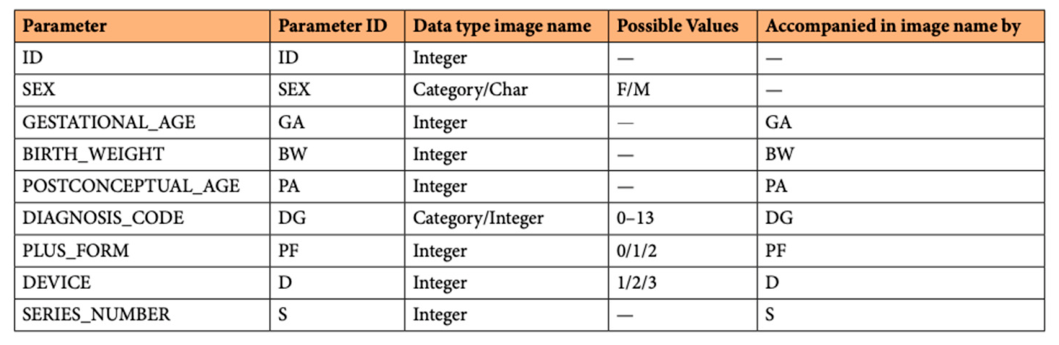
Figure 3.
Patient-wise dataset split used for training, validation, and testing.
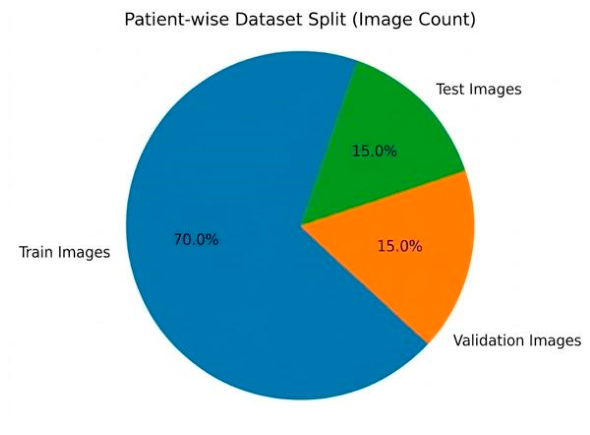
Figure 4.
Visual comparison between histogram equalization and CLAHE variants.
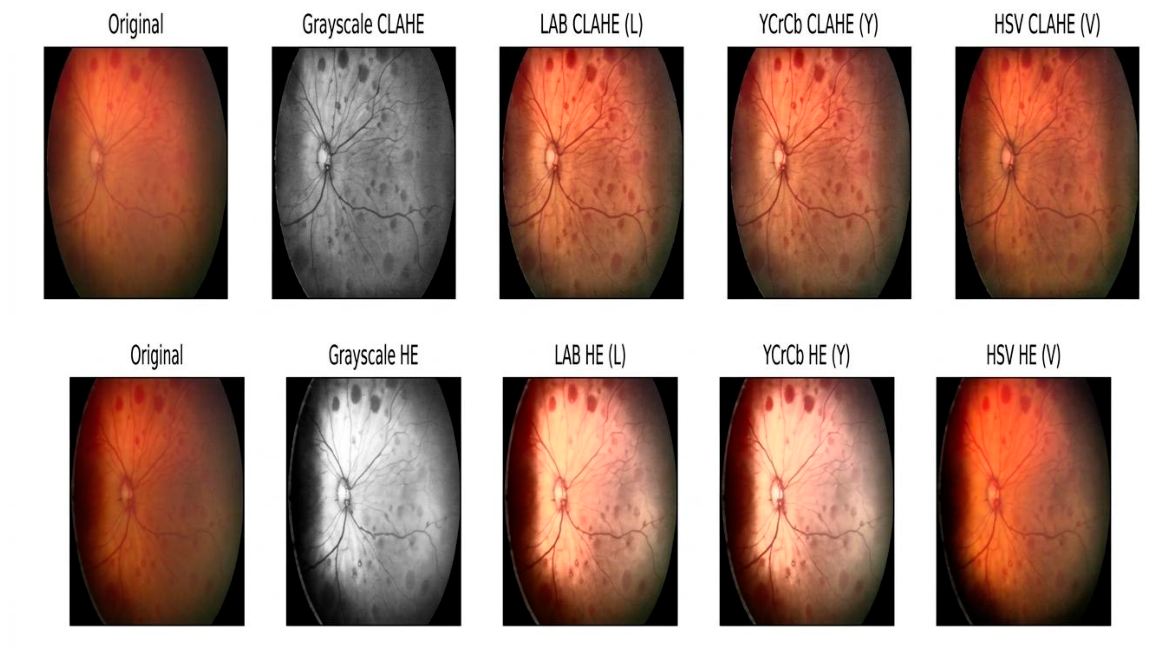
Figure 5.
Example of a cGAN output generated during the synthetic augmentation trial.
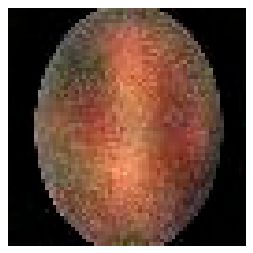
Figure 6.
Additional cGAN-generated output illustrating limited clinical reliability.
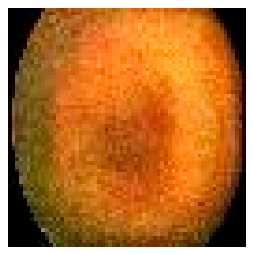
Table 1.
Training image count by diagnosis group before ratio-based balancing.
| Diagnosis Group | |
|---|---|
| Diagnosis Group | Training Image Count |
| DG0 | 2120 |
| DG1 | 33 |
| DG2 | 200 |
| DG3 | 458 |
| DG4 | 125 |
| DG8 | 470 |
Table 3.
Representative standard deviation values for HE and CLAHE trials.
| Image Filename | Original | Gray HE | LAB HE | YCrCb HE | HSV HE | Gray CLAHE | LAB CLAHE | YCrCb CLAHE | HSV CLAHE |
|---|---|---|---|---|---|---|---|---|---|
| ...S01_1.jpg | 40.23 | 80.32 | 74.56 | 76.73 | 50.63 | 44.42 | 44.10 | 44.41 | 37.77 |
| ...S01_10.jpg | 32.25 | 80.67 | 75.68 | 77.74 | 49.18 | 40.55 | 39.97 | 40.54 | 33.92 |
| ...S01_11.jpg | 40.90 | 80.46 | 75.26 | 77.13 | 52.03 | 45.88 | 45.09 | 45.83 | 38.92 |
| ...S01_12.jpg | 37.79 | 80.68 | 75.68 | 77.58 | 51.47 | 44.81 | 43.93 | 44.76 | 37.51 |
Table 8.
Final comparison of deep learning architectures.
| Rank | Model | Accuracy | AUC |
| 1 | Inception-v3 | 91.3% | 88.5% |
| 2 | ResNet18 | 89.7% | 86.0% |
| 3 | EfficientNet | 93.3% | 84.5% |
| 4 | Inception-v1 | 92.8% | 83.6% |
| 5 | Swin Transformer | 92.0% | 82.6% |
| 6 | 2D-CNN | 88.0% | 73.88% |
Table 9.
Summary of related work and relation to the present study.
| Reference | Task / Approach | Dataset / Data Type | Reported Result | Main Limitation / Relevance |
|---|---|---|---|---|
| Brown et al. [22] | CNN for plus disease diagnosis | RetCam images; internal and external evaluation | AUC values up to 0.98 internally and strong external RetCam performance | Performance decreased on non-RetCam images, showing device sensitivity |
| Li et al. [6] | AI methods in ophthalmology; occurrence and severity analysis | Ophthalmic imaging datasets | High AUC values in internal and external settings | Low specificity and clinical variability remained concerns |
| Karri et al. [23] | Transfer learning with retinal images | Retinal fundus image classification | High accuracy using pretrained models | Limited attention to ROP-specific metadata and imbalance |
| Chen et al. [24] | Deep learning for ROP stage diagnosis | ROP fundus images | Stage diagnosis with strong reported performance | Staging is harder than binary classification and remains data-dependent |
| Hasal et al. [25,26] | Enhancement and segmentation tools | ROPReLes-related images and retinal vessels | Recommended enhancement and segmentation approaches | Preprocessing helps but must be linked to final classification performance |
| This work | Preprocessing, augmentation, batch size, and model comparison | ROPReLes: 6004 images, 188 subjects | Inception-v3 AUC 88.5%; EfficientNet accuracy 93.3% | Binary task; future work needed for staging and external validation |
Disclaimer/Publisher’s Note: The statements, opinions and data contained in all publications are solely those of the individual author(s) and contributor(s) and not of MDPI and/or the editor(s). MDPI and/or the editor(s) disclaim responsibility for any injury to people or property resulting from any ideas, methods, instructions or products referred to in the content. |
© 2026 by the authors. Licensee MDPI, Basel, Switzerland. This article is an open access article distributed under the terms and conditions of the Creative Commons Attribution (CC BY) license.
Copyright: This open access article is published under a Creative Commons CC BY 4.0 license, which permit the free download, distribution, and reuse, provided that the author and preprint are cited in any reuse.