

Submitted:
14 November 2026
Posted:
18 November 2026
You are already at the latest version
Abstract
Cognitive workload models now draw on eye movements, brain activity, cardiovascular variation, electrodermal responses, and patterns of interaction. Their accuracy can be impressive, yet accuracy alone says little about whether the model has captured workload, memorized a participant or task, or produced an explanation that a person can safely use. This critical narrative review examines that problem across cognitive science, neuroergonomics, physiological computing, and explainable artificial intelligence (XAI). Particular attention is given to construct definition, signal-specific confounding, participant-wise validation, and the gap between plausible and faithful explanations. The review develops TRACE-WL: Theoretical alignment, Reliable validation, Attribution fidelity, Cognitive usability, and Ecological robustness. These five requirements link the psychological claim to the validation design and, ultimately, to the conditions of use. The literature indicates that predictive performance and explanation quality must be tested separately. It also cautions against treating feature importance as evidence of a cognitive mechanism without convergent measurements or intervention. TRACE-WL offers a structured way to judge workload systems intended for education, healthcare, transportation, and other human-machine settings.
Keywords:
cognitive workload
; explainable artificial intelligence
; physiological computing
; human-centered AI
; neuroergonomics
; model validation
1. Introduction
Cognitive workload is usually described as the relation between what a task demands and the resources a person can bring to it. That concise definition hides a measurement difficulty: workload cannot be observed directly. Researchers infer it from manipulated task difficulty, self-report, performance, and physiological change. None of these is an unambiguous readout. A larger pupil may accompany effort, emotional arousal, or a change in illumination. Heart-rate variability responds to respiration, posture, and stress as well as mental demand. EEG power is likewise affected by fatigue, movement, and stable individual physiology. Thus, workload is useful precisely because it connects several levels of analysis, but it is not a single, settled biological quantity (Young et al., 2015). Cognitive load theory, multiple-resource theory, and applied workload research overlap in important respects, although they do not make identical claims about why effort rises or performance fails (Paas et al., 2003; Sweller, 1988; Wickens, 2008).
The case for measuring workload is nevertheless strong. Excessive demand in a control room, vehicle, or clinical environment may precede attentional narrowing, slow responses, and error. Too little demand brings a different risk: vigilance and engagement can fall. In education, a difficult activity may either promote productive effort or exceed the learner's capacity; a single performance score rarely distinguishes the two. These practical concerns explain the move from retrospective, group-level studies toward continuous estimates for an individual user (Charles & Nixon, 2019; Fairclough, 2009). Current systems combine EEG, eye tracking, electrocardiography, photoplethysmography, electrodermal activity, respiration, or fNIRS with engineered features and learned representations. The attraction is not simply a new sensor. It is the possibility of responding before an overt failure occurs - by changing an interface, pacing instruction, reallocating a task, or suppressing a poorly timed alert.
Machine learning introduces a less visible source of error. A classifier can separate experimental conditions for the wrong reason. Participant identity, device noise, repeated stimuli, motor responses, and the autocorrelation between adjacent windows may all be easier to learn than workload itself. The familiar random split is especially troublesome here: when windows from one recording occur on both sides of the split, the test data are not genuinely new. Leakage can also enter through normalization, feature selection, imputation, oversampling, or tuning performed before the folds are defined. Physiological studies often combine thousands of windows with only a few dozen independent people, so the resulting precision can be deceptive (Kapoor & Narayanan, 2023; Saeb et al., 2017; Varoquaux, 2018). Wilson and Russell (2003) showed early that real-time neural classification was technically feasible. The present question is more demanding: does the estimate survive separation by person, session, and context, with uncertainty that reflects the true sampling unit?
XAI is often introduced at this point as a way to open the black box. A feature-attribution display can show that a prediction depended on frontal theta, pupil diameter, or an HRV index; a local explanation can focus on one interval, whereas a global summary describes the fitted model more broadly. Recent workload studies have used Shapley values, attention maps, and related importance measures with EEG and multimodal data (Chaturvedi & Ahirwal, 2026; Hendi et al., 2026; Xu et al., 2026). These analyses are useful, but their visual coherence should not be mistaken for validation. An attribution may change under a small perturbation, depend heavily on the chosen background sample, or divide credit arbitrarily among correlated signals. Even a faithful explanation can be cognitively unhelpful, and a physiologically familiar pattern does not establish causation (Miller, 2019; Mohseni et al., 2021; Rudin, 2019). In other words, explanation adds another object that requires evaluation; it does not remove the need for it.
Several reviews already map the sensor and modeling landscape. They cover physiological measures, multimodal fusion, EEG classification, deep networks, and real-time or unobtrusive assessment (Basnet & Zahabi, 2025; Charles & Nixon, 2019; Debie et al., 2021; Hassan et al., 2025; Tao et al., 2019; Vishnu & Gupta, 2024). Much of that work quite reasonably asks which signals are responsive and which algorithms perform well. The newer explainable-workload literature poses a related, but not identical, question. Before interpreting a heat map or a ranked feature list, one must know what counted as workload, how independence was protected, and who is expected to act on the explanation. The gap addressed here is therefore the whole evidential path - from construct, through prediction and attribution, to use - rather than a catalogue of another set of algorithms.
I pursue three aims. The first is to bring cognitive theory, physiological measurement, machine-learning validation, and XAI evaluation into one account. The second is diagnostic: the review examines label circularity, subject leakage, attribution among correlated features, unstable explanations, and the frequent slide from prediction to mechanism. The third is constructive. I propose TRACE-WL, whose five elements are Theoretical alignment, Reliable validation, Attribution fidelity, Cognitive usability, and Ecological robustness. TRACE-WL is meant as an argument-and-evidence framework, not a scoring device or a new classifier. Its purpose is to make visible which claims a study can support, which remain provisional, and what a user would need before treating an explanation as actionable.
2. Review Approach and Scope
A critical narrative review was chosen because the literature does not provide a common effect that can be pooled without strong assumptions. Studies vary in task, label, sensor, sampling rate, feature construction, validation unit, and performance metric. I searched PubMed and publisher databases using combinations of cognitive or mental workload with physiological measurement, eye tracking, EEG, multimodal fusion, machine learning, deep learning, interpretability, explainability, feature attribution, human-centered evaluation, generalization, and leakage. Reference lists and forward citations from major reviews and foundational papers were then checked for relevant work. Peer-reviewed journal articles were preferred. Conference papers were retained only where they introduced an XAI method or evaluation idea that has become foundational and lacked an adequate journal substitute. This approach supports conceptual comparison; it should not be read as a systematic-review search capable of estimating prevalence or pooled effect size.
The evidence base includes workload theory and measurement, representative studies using ocular, neural, autonomic, and multimodal signals, and methodological work on validation and interpretable machine learning. Studies directly joining workload assessment with XAI were considered through August 2026. Coverage is deliberately selective: a complete inventory of sensor-specific architectures would add length without resolving the inferential question. Instead, I read each claim against five linked questions. What construct is the label meant to represent? Is the predictive result reliable at the level claimed? Does the explanation reflect the fitted model and remain reasonably stable? Does it improve a person's understanding or decision? Finally, does either prediction or explanation remain useful outside the development task? These questions became the basis of TRACE-WL.
Accuracy values are not treated here as if they came from one competition. A value obtained after randomly dividing overlapping windows is not comparable with a value obtained after holding out participants, even when the same metric is reported. Nor does a balanced, two-condition laboratory task resemble rare-event monitoring in practice. I therefore gave more interpretive weight to participant- or session-wise separation, a clearly ordered preprocessing pipeline, convergence across measures, uncertainty estimates, and tests across tasks or settings. This weighting is important because the largest number in a review table can easily become a surrogate for evidential strength. In workload research, it may instead reflect an easier proxy label, participant overlap, or a more favorable class distribution.
3. Cognitive Workload as a Latent and Context-Dependent Construct
Any explanation begins with an awkward question: what, exactly, is the model explaining? Task demand, felt workload, invested effort, stress, arousal, fatigue, and performance are connected, but they are not interchangeable. Increasing the level of an n-back task changes nominal demand. One participant may respond by concentrating harder, another by slowing down, and a third by abandoning an ineffective strategy. Performance can remain stable because compensatory effort has risen; it can also decline without a monotonic physiological change. If task level is called ground-truth workload, the analysis risks becoming circular. The model learns which experimental condition was presented, and successful recovery of that condition is then used to claim that workload was measured. Such a study may still be useful, but its claim is condition recognition unless additional evidence closes the gap.
The theoretical traditions reinforce this caution in different ways. Cognitive load theory distinguishes intrinsic, extraneous, and germane aspects of load in learning, although both the boundaries and their measurement remain debated (de Jong, 2010; Paas et al., 2003). Multiple-resource theory predicts interference according to overlap in perceptual, cognitive, and response resources, not simply according to a single amount of demand (Wickens, 2008). Applied workload accounts place similar emphasis on the interaction among task, operator, strategy, and context (Galy et al., 2012; Longo, 2018; Young et al., 2015). A scalar label is therefore a pragmatic compression. The compression may work within arithmetic trials and fail in visual search or clinical decision-making because a different resource is constrained and a different behavior protects performance.
No available measurement resolves the problem by itself. Self-report is close to experienced demand and effort, yet it is retrospective, sensitive to wording, and too sparse for many real-time applications. Performance is objective but tied to the task; skilled people may preserve it by working harder. Physiology offers temporal detail, but each channel has several determinants. For that reason, disagreement is often more informative than a forced average. A rise in subjective workload with unchanged primary-task performance and greater secondary-task cost may indicate successful compensation. Divergent physiological channels may expose strategy change or poor signal quality. A defensible label can combine an ordered manipulation, rating, performance, secondary-task measure, and more than one physiological source, while keeping each component visible enough to examine why they agree or diverge.
The intended decision should determine the target. An adaptive display may need a short-lived estimate of perceptual demand. A tutor may care about sustained effort that contributes to learning. A safety system may be better served by the probability of a workload-related error than by a three-level workload class. These are different outcomes, with different windows and costs. Without specifying the action, an attribution answers a vague question. Suppose pupil diameter contributes strongly to a high-workload score. The finding says that the fitted function used pupil information relative to its training distribution. It does not reveal whether the underlying reason was effort, luminance, emotion, or their interaction. That last step is a psychological interpretation, and it requires evidence beyond the attribution.
I therefore treat construct validity as accumulated evidence rather than a box checked by the task manipulation. Content evidence concerns whether the selected task and signals represent the stated dimension of workload. Convergence asks whether measures that should agree actually do so; discrimination asks whether workload can be separated from fatigue, stress, emotion, movement, and sensory change. Predictive evidence links the estimate to a consequential outcome such as error or delay. Ecological evidence asks whether the relationship survives work outside the laboratory. An explainable model becomes scientifically informative when its attribution can be located within this chain. Without that location, the same explanation may be a useful debugging clue but a weak statement about cognition.

Table 1.
Major signal families for cognitive-workload modeling and their interpretive constraints.
| Signal family | Typical measures | What the measures may indicate | Important alternative explanations |
| Ocular | Pupil size; fixation and saccade measures; blink rate; PERCLOS | Effort, allocation of visual attention, search behavior, or fatigue | Luminance, gaze position, display content, emotion, medication, dry eye, camera loss, and preprocessing choices |
| EEG | Theta, alpha, and beta power; band ratios; connectivity; event-related potentials | Neural recruitment, attention, and working-memory demand | Eye and muscle artifacts, movement, reference choice, individual anatomy, and task-specific spectral structure |
| Cardiovascular | Heart rate; RMSSD; SDNN; LF/HF; nonlinear HRV indices | Autonomic response accompanying demand or effort | Respiration, posture, physical activity, circadian state, stress, window duration, and disputed interpretation of LF/HF |
| Electrodermal | Tonic level; phasic response frequency and amplitude | Sympathetic arousal that may accompany demand | Temperature, humidity, emotion, motion, recovery time, and electrode placement; the response is not specific to workload |
| Respiratory | Rate, depth, variability, and inspiratory-expiratory timing | Effort and autonomic activation | Speech, posture, exertion, voluntary control, and coupling with HRV |
| fNIRS | Changes in oxygenated and deoxygenated hemoglobin over prefrontal sites | Cortical hemodynamic response during cognitive demand | Motion, systemic physiology, hair and optode contact, response lag, and restricted spatial coverage |
| Behavior and interaction | Response time; errors; mouse, keyboard, speech, and control-input patterns | Difficulty, strategy, performance, and compensatory behavior | Strong dependence on task and interface; the features may identify the condition instead of latent workload |
| Multimodal | Early, intermediate, late, or hybrid fusion across two or more signal families | Complementary evidence and resilience to loss of one channel | Synchronization, unequal sampling, missing modalities, correlated evidence, dimensionality, and added privacy burden |
4. Physiological and Behavioral Evidence
4.1. Ocular Measures
Pupillometry is among the oldest physiological approaches to mental demand. Pupil diameter increased with memory load in early experimental work, and subsequent studies connected the task-evoked response with effort and cognitive control (Beatty, 1982; Kahneman & Beatty, 1966; van der Wel & van Steenbergen, 2018). Contemporary eye trackers add fixation, saccade, and blink measures, which are especially attractive when a remote camera can be used without attaching electrodes. These signals also preserve a link to the interface: they show where visual inspection occurred as well as how ocular behavior changed. Ahlstrom and Friedman-Berg (2006) related eye-movement activity to workload in display monitoring, while Recarte and Nunes (2003) showed that cognitive demand in driving can narrow visual search. The evidence supports sensitivity, but the meaning of any one feature remains conditional on what the person was looking at.
Pupil-based explanations are particularly easy to overread. The pupil responds to luminance and near focus, not only to arousal and effort (Mathot, 2018). Display brightness, gaze position, emotional content, and the handling of blinks may each produce a change larger than the workload effect of interest. Preprocessing is consequently part of the substantive claim: the result depends on which samples were rejected, how gaps were interpolated, where the baseline was placed, and how trial boundaries were treated. The reproducible workflow described by Kret and Sjak-Shie (2019) is useful here because it makes those decisions inspectable. If a classifier assigns importance to pupil diameter during a bright-to-dark display transition, the explanation may be perfectly faithful and cognitively irrelevant. Illumination control and sensitivity analyses across plausible preprocessing settings are therefore necessary before interpreting the attribution as effort.
Fixations, saccades, and blinks present a similar ambiguity. A long fixation can indicate deeper processing, confusion, difficulty, or merely a larger item on the screen. High scanpath entropy may reflect productive exploration in one task and disorganized search in another. Blink rate is influenced by fatigue, eye discomfort, and speech. These measures become interpretable only when the visual input, area of interest, task phase, and missingness are described together. This is also why a cross-task test is more revealing than a random window split. If the same ocular relation predicts workload after the layout and stimulus sequence have changed, stimulus recognition becomes a less convincing alternative explanation.
4.2. Electroencephalography and Cortical Hemodynamics
EEG dominates much of the workload-classification literature because its temporal resolution matches rapid cognitive events. Frontal theta often rises and parietal alpha often falls as working-memory or supervisory demand increases, but neither direction nor scalp location is invariant. Brouwer et al. (2012) used spectral and event-related measures to estimate workload in an n-back task; the STEW dataset later made simultaneous-task comparisons more reproducible (Lim et al., 2018). The methodological literature now spans support-vector machines, convolutional and recurrent networks, and hybrid models. At the same time, recent reviews keep returning to two weaknesses: small participant samples and validation schemes that do not consistently protect person-level independence (Craik et al., 2019; Hassan et al., 2025; Vishnu & Gupta, 2024). The sophistication of the architecture has advanced faster than the independence of the evidence in many studies.
EEG explanations appear as ranked channels, frequency-band contributions, temporal saliency, attention weights, or relevance maps. Their apparent anatomical precision is appealing, but a scalp electrode records a mixture of neural sources, eye activity, muscle, reference choice, and noise. Filtering, rereferencing, artifact rejection, epoch duration, baseline definition, and spectral estimation can all move the attribution. A smooth topographic map is therefore an aesthetic property, not a fidelity test. At minimum, the explanation should respond to parameter and label randomization and should show a defensible level of stability across folds or resamples. Borghini et al. (2014) provide a further reason for restraint: in operational neuroergonomics, workload, drowsiness, and fatigue often affect overlapping signal properties. A familiar frontal or parietal pattern narrows the interpretation, but it does not settle it.
fNIRS offers a useful contrast. It tracks cortical hemodynamics rather than electrical activity and can tolerate more movement than conventional neuroimaging. In complex operator training, Ayaz et al. (2012) found that prefrontal oxygenation followed changes in workload and skill. The slower hemodynamic response, however, complicates alignment with short task events. Motion, optode contact, scalp blood flow, and systemic cardiovascular change also enter the signal. Channel-level explanations should acknowledge that lag and test whether peripheral or systemic measures account for the same pattern. Otherwise, a contribution assigned to a prefrontal channel may be temporally precise in the model while physiologically too coarse for the claim.
4.3. Autonomic and Multimodal Measures
Cardiovascular, electrodermal, and respiratory signals fit wearable systems well, but their availability should not be confused with specificity. Heart rate and HRV respond to mental demand, posture, respiration, movement, and stress. Electrodermal activity indexes sympathetic arousal; respiration changes with effort, speech, and task rhythm. In their review of 58 empirical journal articles, Charles and Nixon (2019) found no single physiological measure that satisfied every requirement of workload measurement. Tao et al. (2019) reached a similar conclusion across a wider group of measures. The practical implication is not that autonomic signals are unhelpful. It is that sensor choice must be made against the application's time scale, mobility, and confounds, and that an explanation should remain at the level supported by the channel.
Combining modalities can improve discrimination because the channels capture partly different responses. Hogervorst et al. (2014), for example, reported an advantage from combining EEG with peripheral and ocular measures, and Debie et al. (2021) noted the potential for redundancy when one sensor deteriorates. Recent studies have added explicit attribution. Hendi et al. (2026) evaluated HRV and electrodermal features with participant-wise splits and used Shapley analysis to examine nonlinear contributions. Xu et al. (2026) combined speech, ECG, and eye tracking in simulated flight and likewise reported Shapley-based feature effects. Such studies demonstrate what attribution can contribute to model inspection. They do not yet guarantee that the same modality will remain dominant for another participant, device, or task; those are empirical transport questions rather than properties of the explanation method.
Fusion also creates dependencies that a simple importance ranking may hide. With early fusion, correlated channels occupy one feature space and can trade attribution. Late fusion makes the modality contributions easier to display, but interactions may disappear from view. Sensor failure adds another complication. Missingness is often tied to movement, perspiration, task phase, or user characteristics, so a model may learn from the absence of a signal. That can be predictively useful while making a cognitive interpretation untenable. A credible multimodal study should therefore show what happens to both predictions and explanations when a modality is removed, synchronization is shifted, or realistic artifacts are introduced. The explanation should also say when missingness, rather than the recorded physiology, carried the decision.
5. Machine-Learning Pipelines and Threats to Validity
The analytic pipeline is not a neutral prelude to modeling. Synchronization, filtering, artifact handling, segmentation, feature extraction, normalization, feature selection, fitting, calibration, and explanation each change what the final estimate means. Windowing is a common source of false confidence. Dividing one session into hundreds of overlapping segments increases the row count, not the number of independent people. When those segments are split at random, the classifier may recognize a person's baseline or a particular session. Participant-grouped evaluation is thus the minimum design for a claim about new users. A claim about a new day, task, device, or hospital requires the corresponding session-, task-, device-, or site-level separation. The split should follow the intended use, not whichever arrangement yields the most observations.
Operations that learn from data belong inside the resampling loop. Scaling parameters, imputation values, selected features, synthetic examples, and tuned hyperparameters must be estimated without access to the held-out fold. Otherwise, the test set has influenced the fitted system even if its labels were never passed directly to the model. Leakage of this kind is a documented contributor to irreproducible machine-learning results (Kapoor & Narayanan, 2023). The mobile-sensing analysis by Saeb et al. (2017) is instructive because record-wise performance fell when evaluation became person-independent. Varoquaux (2018) similarly showed how unstable cross-validation can be in small samples. These observations matter acutely for workload datasets: a study may report many thousands of epochs, but its inferential sample is still the participants and sessions from which those epochs came.
Validation should report variability and use metrics appropriate to the decision. Nested, grouped cross-validation separates tuning from evaluation; grouped bootstrap intervals show how much the result depends on the sampled participants. When an independent dataset exists, it provides a stronger test than another random division of the original data. Accuracy alone is rarely adequate under imbalance. Balanced accuracy, macro-F1, sensitivity, specificity, and Matthews correlation coefficient each reveal different errors, while precision-recall curves are more informative when overload is uncommon (Chicco & Jurman, 2020; Saito & Rehmsmeier, 2015). If a probability will trigger an action, calibration matters as much as ranking. Brier score and calibration plots can expose confident misestimation that an AUROC conceals (Van Calster et al., 2019). Thresholds should be chosen on training data and justified by the costs of missed and unnecessary intervention.
The word generalization needs a stated boundary. A within-participant model may work well after personal calibration but say nothing about a new user. Cross-participant testing addresses that next step; cross-session testing asks whether the person's relation is stable over time. Holding out a task, device, or site poses progressively different questions about transport. These levels should not be collapsed into a single claim that the model is generalizable. Performance loss across a boundary is also informative. It can indicate that the model relied on a task cue, a sensor characteristic, or a population-specific response. Treating that loss only as an inconvenient limitation misses a chance to identify what the representation actually learned.
Explanations must respect the same boundary as predictions. Computing global importance once on the complete dataset blends held-out observations with fitted decisions and conceals the variation among fold-specific models. A stronger workflow explains predictions from each outer test fold, harmonizes feature definitions, and then summarizes signed attribution with uncertainty. Results should be checked across folds, random seeds, participants, and plausible preprocessing alternatives. A single polished plot can otherwise suggest agreement where the leading feature, or even its direction, changes from one resample to another. That instability is not merely graphical noise; it limits whether the explanation can support a general physiological claim.
5.1. Model Families and the Accuracy-Interpretability Trade-Off
Transparent models remain useful benchmarks because their assumptions are exposed to direct inspection. With standardized inputs, logistic regression displays the direction of an association; regularization can reduce variance but cannot solve collinearity. Generalized additive models allow nonlinear effects without hiding every relationship inside a large interaction structure. Small trees and rule lists can express conditional patterns in a form a domain expert can inspect. None is intrinsically correct. Coefficients remain associational, and tree thresholds can change after modest resampling. Their advantage is narrower: it is easier to see how the prediction was produced and to challenge that behavior against theory. This makes them important comparators even when a more flexible model ultimately performs better.
Kernel machines, forests, boosting, and deep networks can capture nonlinear and high-dimensional structure that simpler models miss. EEG applications, in particular, use convolutional filters for spatial-temporal patterns and recurrent or attention-based models for sequences. Greater flexibility, however, expands the set of shortcuts available to the learner. The reviews by Hassan et al. (2025) and Vishnu and Gupta (2024) document the rapid growth of deep workload models while noting comparatively limited interpretability and uneven evidence for cross-task or real-time use. Post-hoc explanation does not repair an unfair model comparison. If the transparent baseline was poorly tuned, used weaker features, or was tested under a different split, superiority of the black box has not been established.
A staged comparison is more informative. First, establish a transparent model with the same preprocessing, folds, and metrics planned for the full study. Then add flexibility and report the incremental benefit with uncertainty. A small gain in accuracy may be worthwhile when it prevents a costly error, but not when it creates substantial latency, poor calibration, and an explanation that nobody can audit. The opposite can also be true: raw temporal information may justify a deep architecture if the gain is practically important and its representation can be interrogated faithfully. The actual trade-off is therefore not a slogan about accuracy versus interpretability. It is a decision about added benefit relative to error, opacity, computation, maintenance, and the burden placed on users.
5.2. Temporal Resolution, Non-Stationarity, and Personalization
Workload changes continuously, although most models carve the stream into fixed windows and attach a discrete label. Window size encodes a compromise. Short intervals permit quicker adaptation but produce noisy HRV and spectral estimates; long intervals stabilize features at the cost of delay and may blend unlike task phases. Overlap adds dependence and can make the apparent sample size much larger than the information content. These details are often treated as implementation choices, yet they determine what event a prediction can plausibly describe. Authors should report the window, overlap, edge handling, label alignment, and complete latency from acquisition through preprocessing and explanation. A model is not real time merely because inference on an already prepared feature vector is fast.
The relation between physiology and demand also drifts. Learning, habituation, fatigue, circadian state, sensor placement, and strategy can change the feature distribution within one person and across visits. A skilled participant may show a smaller response to the same task because performance has become efficient, not because the task has become irrelevant. A fixed population model can misread such adaptation as underload. Continuous updating poses the reverse risk: it may absorb a meaningful deterioration into the new baseline. Personal calibration, hierarchical models, domain adaptation, and abstention can help, but each requires prospective evaluation. Calibration observations must be separated from later testing, and the amount of personal data needed should be reported rather than hidden inside the training set.
Personalization changes the interpretation of XAI output as well. An average importance plot can conceal a participant whose predictions are mainly ocular and another whose model relies on cardiovascular variation. Such differences may reflect real strategy, unequal sensor quality, or a confound. Participant-level attributions should consequently be presented as a distribution and linked to signal quality, not compressed into one universal ranking. For a personalized model, the explanation should also separate the stable baseline from the current deviation. Language matters here: a person's departure from a population mean is not, by itself, an abnormal physiological response. Explanations that imply a normative standard require evidence that most workload datasets do not yet provide.
5.3. Subgroup Validity, Fairness, and Privacy
Sensor performance is unlikely to be uniform across age, skin characteristics, visual ability, neurodiversity, medication use, cardiovascular health, and prior expertise. Some differences affect the quality of the measurement; others change how a person responds to demand. Overall accuracy can therefore remain acceptable while false alarms or probability calibration differ systematically across groups. Most workload studies are too small for precise subgroup estimates, and an underpowered parity test can be as misleading as no test at all. Even so, participant characteristics and expertise should be reported. Where the data permit, discrimination, calibration, signal rejection, and abstention should be estimated by subgroup with intervals that show the uncertainty. Where they do not, the limitation should constrain the population claim.
Fairness cannot be reduced to matching one error rate. A false high-workload label in a tutor may prompt unnecessary help; the same label in employee monitoring may carry stigma or affect task allocation. A missed high-workload state has different consequences again. Thresholds and explanations should be assessed in light of who experiences each error and whether that person can challenge the resulting action. Attribution can reveal that a model relies on a subgroup-specific proxy, but it can also give that proxy a persuasive technical story. This is one area where domain specialists and affected users are needed before deployment, not only after the accuracy analysis. Acceptable use is a normative decision informed by evidence; it is not an output of the classifier.
Physiological streams also create privacy risks beyond the stated workload purpose. Raw EEG, gaze, cardiovascular, or interaction data may reveal identity, health, fatigue, or affective state. Data minimization therefore favors local processing, short retention, or derived features when raw signals are unnecessary. Access control, encryption, retention schedules, and purpose limits should be designed before field collection. The explanation itself can be sensitive: telling a supervisor that autonomic activity drove a high-workload estimate exposes more than a generic alert. Consent should specify the inferences to be made, the people who can see them, and the consequences of the estimate. A meaningful right to pause sensing, withdraw, or contest an action is part of system validity because it changes how the system can be used.
6. What Explainability can and Cannot Establish
Interpretability and explainability are used inconsistently, but a practical distinction helps. An interpretable model exposes a decision structure that can be examined directly; an explanation is often a second representation placed around a more complex predictor. Sparse regression, small trees, additive models, and rule lists belong mainly to the first group. Local surrogates, feature attributions, saliency maps, and counterfactuals usually belong to the second. The boundary is not absolute - even a coefficient can be difficult to interpret under strong dependence - yet it clarifies what must be validated. Existing surveys classify methods by local or global scope, model specificity, and intrinsic or post-hoc operation (Adadi & Berrada, 2018; Arrieta et al., 2020; Guidotti et al., 2018; Vilone & Longo, 2021). For workload research, the important point is that each class answers a different question.
Feature importance is the most familiar answer. Permutation importance asks how held-out performance changes after a feature is disrupted. If two features contain nearly the same information, disrupting either one may have little effect, so both appear unimportant. Shapley additive explanations instead allocate a prediction relative to a selected background using a cooperative-game formulation (Lundberg & Lee, 2017). Their values are conditional on that background and on how feature dependence is represented. Physiological features are rarely independent: adjacent EEG channels, neighboring frequency bands, and HRV indices overlap heavily. Under a naive perturbation scheme, importance may be divided among proxies or calculated for combinations that could not occur in a person. A ranked list should therefore be read as one allocation under stated assumptions, not as a unique decomposition of workload.
Other methods introduce different choices. A local surrogate depends on what counts as the neighborhood around the case; change the perturbation distribution and the simple boundary may change. Gradient and saliency maps offer fine temporal or spatial resolution for neural networks, but saturation and model-insensitive visual patterns remain well-documented concerns (Samek et al., 2021). Attention weights expose an architectural component, not necessarily the features causally responsible for an output. Counterfactuals are attractive because they ask what would change the prediction. For physiology, however, feasibility is a demanding constraint. A suggestion to reduce an EEG band or HRV measure is not an actionable explanation; it is only a numerical change unless a credible intervention, temporal pathway, and causal relation connect the feature to the person's state.
The right explanation also depends on who is asking. A model developer may need evidence of leakage, a cognitive scientist may want a hypothesis about a channel or time interval, and an operator may need only the reason an interface changed. A safety reviewer will ask about trace, uncertainty, and failure. Liao and Varshney (2022) emphasize this relation between explanation and user need. In practice, a global Shapley summary can be valuable during development and useless in a cockpit; a dense EEG map may interest a neuroscientist without telling a supervisor whether to redistribute a task. Choosing the visualization first reverses the design problem. The user, contrast, and available action should be specified before selecting the explanation method and level of detail.
Most importantly, attribution is not causal discovery. If pupil diameter receives a large positive value, the fitted model relied on pupil information under the observed distribution. The result does not imply that manipulating the pupil would alter workload, or even that effort is the process producing the association. Luminance and stimulus content remain plausible common causes. Miller (2019) notes that explanations people find useful are selective, contrastive, and social; scientific explanation adds the need for controlled comparison and convergent evidence. In high-stakes use, Rudin (2019) argues for an interpretable model when it can achieve the required performance, rather than an opaque model followed by an uncertain reconstruction. For workload research, this implies modest language: model reliance can generate a mechanistic hypothesis, but an intervention or independent design must test it.
Table 2.
Explainability methods, appropriate uses, and principal failure modes in workload assessment.
Table 2.
Explainability methods, appropriate uses, and principal failure modes in workload assessment.
| Method | Question it can address | Main advantage | Failure that still needs testing |
| Coefficients or additive effects | How is the fitted score related to a feature? | Direction and size are visible under the model assumptions | Scaling, nonlinearity, interaction, multicollinearity, and unstable selection |
| Tree rules or small decision sets | Which combinations of conditions lead to a workload state? | Conditional structure can be read directly | Unstable splits, brittle thresholds, and accuracy lost through excessive simplification |
| Permutation importance | Which inputs sustain performance on held-out data? | A model-agnostic global audit | Correlated substitutes, implausible permutations, and dependence on the selected metric |
| Shapley additive explanations | Which features contributed to this case relative to a background sample? | A local decomposition that can be summarized globally | Background sensitivity, dependence assumptions, correlated proxies, and causal overinterpretation |
| Local surrogate | What simple boundary approximates the predictor near this case? | Flexible case-level inspection | A poorly chosen neighborhood, unstable perturbations, or weak local fit |
| Gradient, saliency, or relevance map | Which samples or channels influence a neural-network output? | Fine temporal or spatial resolution | Noise, saturation, model-insensitive patterns, and persuasive but artifactual maps |
| Attention display | Where did an attention component allocate weight? | Direct view of one architectural component | Attention weight may not be causal influence or a sufficient explanation |
| Counterfactual | What feasible change would alter the predicted state? | A contrastive result that may suggest action | Physiologically impossible, temporally incoherent, or non-causal changes |
| Prototype or example | Which observed cases most resemble this one? | A concrete comparison for human review | Privacy exposure, unrepresentative examples, and sensitivity to the distance measure |
7. Evaluating Explanation Quality
Prediction and explanation are separate evaluation targets. A classifier may predict a label accurately while its heat map is misleading; a faithful explanation may instead reveal that an accurate model used a confound. Explanation quality thus needs computational, domain, and human evidence. The three-level scheme reviewed by Mohseni et al. (2021) is helpful: a functionally grounded test uses formal properties, a human-grounded test uses people on a simplified task, and an application-grounded test uses intended users in the real decision. No one level substitutes for the others. A deletion test cannot show that a nurse understands an alert, and user preference cannot demonstrate that an attribution represents the model. Workload applications, perhaps more than many XAI settings, need all three because the explanation itself can add cognitive demand.
Fidelity concerns correspondence with the fitted model. Deletion, insertion, perturbation, and retraining tests ask whether information ranked highly by an explanation affects output more than information ranked low. The perturbation must be credible. Independently shuffling EEG channels or autonomic indices can create a sample outside the physiological data manifold and make an importance method look more decisive than it is. Parameter and label randomization provide a different check: an explanation that survives destruction of the learned model is not explaining that model. Local surrogates should report how well they fit the original predictor in the stated neighborhood. A counterfactual should be rerun through the classifier and rejected if its physiological trajectory or task sequence is impossible.
Stability is related to fidelity but should be reported separately. Physiological inputs vary, so an invariant explanation is neither expected nor necessarily desirable. The relevant issue is whether a small, inconsequential change causes an implausibly large attribution shift, and whether refitting the same analysis produces a similar scientific conclusion. Stability can be examined across folds, seeds, bootstrap samples, adjacent windows, and defensible preprocessing alternatives. Rank correlation, top-k overlap, signed agreement, and distribution distance capture different aspects of the result. Averages alone hide the problem. If frontal theta ranks first in half the folds and has little or reversed influence in the remainder, that heterogeneity should be shown and related to participants, task phases, or signal quality.
Physiological plausibility has a narrower role. Agreement with an established workload pattern can flag a result as worth investigating, while a surprising attribution can reveal artifact or a genuinely new relation. Plausibility does not tell which of those possibilities is correct. A model may use eye-muscle contamination in frontal channels and still produce a familiar-looking map. Conversely, a faithful result can challenge an oversimplified expectation. The strongest interpretation combines attribution with ablation, controlled manipulation, cross-modal convergence, and replication. Direction must also be retained. Reporting that frontal theta was important is incomplete unless the reader can see whether higher theta raised or lowered the score, for whom, during which task phase, and relative to what background.
Human evaluation should ask whether the explanation helps a person understand the model's uncertainty, detect an error, or choose an appropriate action. Satisfaction is a weak proxy. Better outcomes include predicting model behavior, identifying a deliberately introduced failure, decision accuracy, response time, and calibrated reliance. A long feature list can be faithful and still impede the user. Buçinca et al. (2021) showed that cognitive forcing can sometimes curb overreliance, while Zhang et al. (2024) found in an EEG-based study that decision difficulty and induced workload shaped appropriate reliance and that explanation did not automatically improve it. The practical lesson is uncomfortable but important: an XAI display can become another workload source. Evaluation should measure the combined burden of the task, recommendation, and explanation rather than assuming that more information is safer.
Safety becomes visible when the explanation is late, unstable, wrong, or absent. Consider a closed loop: a system detects high workload, simplifies the interface, observes a lower signal, and treats that change as confirmation. The adaptation may have helped, but it may also have disrupted a useful strategy or changed the very evidence used for evaluation. Repeated adaptation can even raise workload. A user-facing explanation should therefore identify the observation interval, confidence, and intended action without overwhelming the person at a critical moment. Consequential adaptations need an override and a route for contesting the estimate. For later audit, the system should preserve the model version, preprocessing state, prediction, explanation, sensor-quality status, and action as one traceable event.
7.1. Failure-Centered Evaluation
Mean accuracy and aggregate importance direct attention away from the cases that matter most. Failure-centered evaluation starts by naming the error and its consequence. A false overload alarm may interrupt a stable work strategy or remove needed information. A missed overload state may withhold timely support. An explanation that is confident and wrong can be more harmful than no explanation because it gives the error a reason. These outcomes should not be collapsed into one score. Confusion matrices and calibration plots can be stratified by task phase, participant, signal quality, and relevant subgroup. Selected cases should follow a declared rule - for example, high-confidence errors or threshold-adjacent decisions - and be reviewed alongside their raw signal quality and local explanation.
Explanations are most valuable in error analysis when they lead to a test. Repeated false alarms driven by pupil features at display transitions suggest luminance; errors late in a session attributed to blink or alpha features suggest fatigue; dependence on device-quality measures for unseen users suggests fragile transfer. Each is a hypothesis, not a diagnosis. The next analysis might remove transition periods, include an illumination measure, hold out the device, or add an independent fatigue assessment. If the error pattern changes as predicted, the explanation has helped isolate a mechanism in the pipeline. If no confirmatory analysis is possible, the account should remain a possible confound rather than a polished post-hoc story.
Stress tests should resemble failures that the deployed system will actually face. For ocular models, these include changing illumination, off-axis gaze, glasses, and blink-related gaps. Wearable autonomic sensors should be tested with movement, speech, and degrading contact. EEG and fNIRS tests can introduce controlled artifacts or remove channels, while temporal systems can vary synchronization and window boundaries. Prediction and explanation must be compared before and after the stressor. Unchanged labels accompanied by a completely different explanation may indicate compensating shortcuts. Stable attribution with deteriorating calibration points to another problem, perhaps a shifted prevalence or threshold. Reporting both responses distinguishes robustness of the decision from robustness of its rationale.
Refusing to predict is sometimes the appropriate result. A system should be allowed to state that eye visibility is poor, a sensor is outside its training range, or modalities disagree. Performance must then be reported together with coverage. A model that appears safe because it abstains on most difficult intervals may have little practical value; a model that never abstains may remain dangerously confident under shift. The explanation for abstention should be concise and matched to the audience - insufficient eye visibility may be useful, whereas a detailed physiological profile is neither necessary nor privacy preserving. This is another reason to include signal-quality status as part of the output rather than hiding it in preprocessing.
7.2. Reproducibility and Reporting
A reproducible workload paper needs enough detail to reconstruct the ordering of the analysis, not merely a software list. At a minimum, that record includes participant flow, task timing, hardware and placement, sampling and synchronization, filters, artifact criteria, missing-data handling, windows, label timing, feature definitions, normalization, and the exact unit used to split the data. The independent sample - people and sessions - should be shown next to the much larger number of windows. Fold assignments, seeds, and the order of learned transformations should be retained. When privacy prevents release of physiology, code can still be demonstrated on a small synthetic example that exposes pipeline order. The example should test execution, not imitate empirical findings or imply that synthetic accuracy validates the model.
XAI reporting has its own reproducibility requirements. Authors should state which fitted model and cases were explained, the background or baseline distribution, implementation and parameters, the rule for aggregating local values, the handling of correlated features, and the method used to quantify uncertainty. A global importance result should retain direction when direction matters scientifically. Local examples need a selection rule declared before visual inspection; otherwise, an attractive, representative-looking case can be chosen after the fact. Null results deserve space. If a plausible feature fails the fidelity test or changes rank in every fold, that instability is evidence about the model and should not be removed to simplify the figure.
Terminology is a final, inexpensive safeguard. A predictor is not a biomarker without separate validation. Attribution describes model reliance, not causal effect. Subject-independent means that the test participants were absent from preprocessing, tuning, and model selection as well as training. Real time covers acquisition, preprocessing, inference, explanation, and delivery, not just a timed prediction function. External validation requires a genuinely separate population, setting, device, or collection process; a held-out random subset from the same experiment is internal validation. These distinctions can sound pedantic, but they set the evidential ceiling of a study. Precise language prevents a visually convincing explanation from receiving more scientific weight than the design can bear.
8. The TRACE-WL Framework
TRACE-WL brings the preceding concerns into five connected requirements: Theoretical alignment, Reliable validation, Attribution fidelity, Cognitive usability, and Ecological robustness. It is not an algorithm and does not assign a composite quality score. It is better understood as a chain of questions that a manuscript or deployment report should be able to answer. Evidence at one stage constrains the next. A rigorous attribution analysis cannot rescue a proxy label that does not represent the stated construct; a faithful attribution does not become useful until an intended user can interpret and act on it. Figure 1 presents this dependency, and Table 3 turns it into minimum and stronger forms of evidence.
8.1. Theoretical Alignment
Theoretical alignment begins with a plain construct statement. It should distinguish nominal task demand from experienced workload, effort, stress, fatigue, and risk of performance failure. The statement also fixes the time scale, population, task, and action to which the estimate applies. When task level is used as a proxy, that limitation belongs in the label description, not only in the discussion. Sensor selection should follow this target. Luminance, movement, speech, respiration, time-on-task, and device state are then planned as measurements or controls where relevant. Finally, the explanation vocabulary should stop at a defensible level: a feature can be described as contributing to a model output without being named as the cognitive cause of that output.
8.2. Reliable Validation
Reliable validation asks whether the separation in the data is as broad as the claim. New-user claims require participant-grouped testing; transport to another session, task, device, or site requires that boundary to be held out. Learned preprocessing and resampling remain inside the training folds, and tuning is separated through nested validation or an untouched development set. Results include intervals, metrics sensitive to class imbalance, and calibration whenever probabilities determine action. A transparent baseline is evaluated on the same folds. A complex model earns its additional burden only through a practically meaningful improvement, not through comparison with a weak baseline or a more favorable split.
8.3. Attribution Fidelity
Attribution fidelity concerns both correspondence and analytical dependence. The report should specify the explanation method, background distribution, perturbation mechanism, and rule used to combine local results. Explanations are produced for held-out predictions, not for the same observations used to fit the model. Fidelity, parameter randomization, resampling stability, and signed direction are then examined. Highly correlated features may need grouping or a conditional analysis rather than a naive independent perturbation. Agreement with known physiology adds convergent support, but it is not proof. Unless an intervention establishes a mechanism, the language should remain model reliance rather than cognitive cause.
8.4. Cognitive Usability
Cognitive usability moves the evaluation from the developer's display to the user's question. An explanation might need to answer why adaptation occurred now, why confidence is low, or what evidence should be checked before acting. Tests should measure comprehension, error detection, decision quality, reliance, response time, and the workload added by the explanation. Density and timing matter as much as visual form. A clinician, instructor, learner, pilot, and model engineer will not benefit from the same level of physiological detail. TRACE-WL therefore does not prescribe one visualization; it requires evidence that the chosen representation helps its intended audience without imposing a disproportionate cognitive cost.
8.5. Ecological Robustness
Ecological robustness addresses what happens after the controlled study. Population shift, task change, new hardware, sensor artifact, missing modalities, and feedback from adaptation may alter the prediction or its explanation. Monitoring should therefore cover input drift, calibration, and attribution patterns. A safe design degrades visibly or abstains when a critical channel is lost. External validation should examine explanation transport as well as discrimination; an unchanged area under the curve can coexist with an entirely different basis for prediction. Governance belongs in this component because raw physiological and behavioral data can reveal identity, health, fatigue, and affect beyond workload. A technically robust system that cannot be used with appropriate privacy and oversight is not robust in practice.
Table 3.
Minimum TRACE-WL evidence recommended for manuscripts and deployment studies.
| TRACE-WL component | Minimum evidence | More persuasive evidence |
| Theoretical alignment | Defined construct, proxy label, time scale, intended decision, and confound plan | Convergent and discriminant evidence from subjective, performance, and physiological measures |
| Reliable validation | Participant-grouped split, training-only preprocessing, uncertainty, and class-sensitive metrics | Nested grouped evaluation plus a held-out task, session, device, site, or external dataset; calibration and decision analysis |
| Attribution fidelity | Reported method settings, held-out explanations, signed direction, and local cases | Fidelity and randomization tests, realistic perturbation, correlated-feature analysis, and bootstrap stability |
| Cognitive usability | A named user, question, and action, with a readable representation | Application-grounded testing of comprehension, reliance, task performance, and explanation-induced workload |
| Ecological robustness | Stated limits for shift, artifact, missingness, privacy, and adaptive feedback | Prospective field testing, modality-dropout stress tests, drift monitoring, explanation transport, and a safe fallback |
9. Domain-Specific Implications
9.1. Education and Training
Education illustrates why lower estimated workload is not always the desired outcome. A learner who is building a difficult schema may show longer fixations and greater effort while learning effectively. An automatic conclusion that the learner is struggling would confuse productive engagement with overload. Workload estimates should be interpreted with prior knowledge, strategy, performance, and delayed learning outcomes. Adaptation should be evaluated for what the learner retains, not only for an immediate physiological decrease. The explanation also changes with audience. An instructor may need a trend with uncertainty across activities; a learner needs non-deterministic language and an action that can be controlled, such as taking a pause or reviewing a prerequisite. Neither audience benefits from a categorical label presented as a fixed cognitive trait.
9.2. Healthcare and Clinical Work
In healthcare, workload monitoring could inform alarm design, interface testing, simulation, staffing, or team support. The stakes make prospective validation and an interpretable baseline particularly important, consistent with multidisciplinary guidance on medical XAI (Amann et al., 2020; Holzinger et al., 2019; Tjoa & Guan, 2021). Age, medication, sleep, illness, and shift work may alter physiology, so evidence from healthy laboratory participants cannot simply be transferred to clinicians during care. Explanations should support safety at the team or system level rather than become a tool for individual blame. Governance needs to state who sees raw signals and inferred states, how long they are retained, and whether they may influence employment or scheduling. Those decisions are not administrative details; they shape consent, behavior, and the validity of any field evaluation.
9.3. Transportation and Complex Operations
Driving, aviation, and industrial control expose workload models to conditions largely absent from laboratory datasets: vibration, speech, movement, rapidly changing illumination, and rare but consequential events. A classifier may recognize a route segment or simulation phase rather than the operator's state, which makes scenario- and task-held-out evaluation essential. Explanations shown in real time should be sparse, and sometimes delayed, if immediate display would distract the operator. A supervisor can receive a richer trend including confidence and sensor quality. Adaptive automation must also be studied as a closed loop. Transferring a task changes the demand being measured; it can improve performance, create underload, or disrupt a strategy. Evaluation that stops at the first prediction misses that interaction.
9.4. Everyday Human-Computer Interaction
Low-cost cameras and wearables bring workload inference into office software, virtual reality, and collaboration tools. They also bring uneven cameras, lighting, posture, network delay, and user behavior. A software redesign can change the input distribution even when the model file is untouched, so prediction and explanation should be monitored across product versions. User control is particularly important in everyday settings. People should know what is inferred, be able to pause sensing, and understand what an estimate can trigger. A faithful technical explanation does not by itself justify continuous cognitive surveillance. The ethical question is not only whether the estimate is accurate, but whether collecting and acting on it is proportionate to the benefit.
10. Research Agenda
A useful benchmark should make participant and context recognition difficult rather than reward it. Public datasets need multiple sessions and tasks, variation in devices, and realistic artifacts, together with identifiers that permit grouped evaluation. Documentation should include demographics, expertise, sensor placement, synchronization, missingness, task timing, and label construction. Separate within-person, cross-person, cross-session, and cross-task tracks would make the supported claim visible. Leaderboards should also move beyond one discrimination score. Calibration, computational cost, coverage under abstention, and explanation stability would reveal whether an apparent improvement is usable or merely better at recognizing the benchmark's repeated structure.
Intervention offers a second priority. Demand can be varied independently of luminance, motor response, and time-on-task, while likely sensor confounds are randomized or measured. An adaptive intervention can then test whether the estimated state identifies a moment at which support improves a consequential outcome. This design distinguishes acting on workload from acting on a correlated cue. It also gives counterfactual explanation a firmer basis: the proposed change can be constrained by physiology, task sequence, and an intervention that a person could actually undertake. Observational attribution will remain valuable for hypothesis generation, but stronger causal language should be reserved for studies that manipulate the relevant path.
Explanation uncertainty should become a reported result rather than a hidden nuisance. Bootstrap distributions, fold-specific signs and ranks, and participant-level variation can show whether an explanation supports a stable conclusion. Method agreement is not proof of truth: two attribution techniques may agree because they share a background distribution or an unrealistic independence assumption. Disagreement is not automatically failure either. It may expose non-identifiability, correlated proxies, or several predictive strategies used by different participants. Future work should determine what degree of stability is sufficient for debugging, scientific interpretation, and operational action, since those purposes carry different consequences when an attribution changes.
Human-centered studies should compare explanation strategies as interface interventions. Useful conditions include no explanation, a concise uncertainty message, an intrinsic-model summary, and a richer post-hoc display. The evaluation should record appropriate reliance, error detection, decision quality, time, trust calibration, and the workload generated by the display itself. User preference can be included but should not be the main outcome. In a time-critical setting, the best explanation may be a short statement that confidence is low or sensor quality is poor. More detail can be deferred to review. This possibility is easy to overlook when XAI research equates informativeness with the number of features shown.
Multimodal models require evaluation under the missingness that wearables actually produce. Modality-dropout training may improve resilience, yet the system must indicate when it has switched to a fallback channel or when absence itself influenced the decision. A stable AUROC after a device change does not show that feature reliance has transported. Firmware, electrode contact, camera placement, and user behavior can all alter the attribution while leaving discrimination superficially intact. Prospective tests should therefore pair performance with modality contribution, signal-quality status, and calibration across devices and populations. The design goal is graceful degradation that is visible to the user, not an apparently seamless prediction whose evidential basis has quietly changed.
Finally, reporting guidance should join cognitive validity, machine-learning rigor, XAI evaluation, and governance instead of treating them as separate checklists. TRACE-WL is a starting structure and will need empirical testing and community revision. Preregistering the construct, split, primary metrics, and explanation tests could reduce analytical flexibility. Sharing code, preprocessing order, and fold assignments enables verification even when raw physiology cannot be released. Dataset documentation and model cards should state intended use, exclusions, known confounds, subgroup limits, fallback behavior, and who is permitted to act on the output. A reporting standard will be useful only if it makes weak links visible rather than encouraging authors to produce another polished summary score.
11. Limitations of This Review
This is a critical narrative review, not an exhaustive systematic review or meta-analysis. The included literatures use incompatible tasks, labels, sensors, and validation schemes, so I did not estimate pooled effects or rank algorithms numerically. The direct literature on explainable workload assessment is developing quickly; studies appearing after the August 2026 boundary may change the balance of evidence. A small number of foundational XAI papers were retained from conference proceedings despite the journal-focused search. TRACE-WL itself is a conceptual proposal grounded in the methodological literature. Its inter-rater reliability, usability, and ability to predict reproducibility or deployment success have not yet been tested. The framework should therefore be evaluated as a set of claims about good evidence, not treated as a validated instrument or a proof that one sensor or model family is superior.
12. Conclusion
Adding a feature-importance plot does not make a workload classifier explainable in the sense needed for science or practice. Workload remains latent and context dependent, with observable signals that overlap effort, arousal, stress, fatigue, movement, and task structure. Windowing, preprocessing, participant overlap, and device context can produce a highly accurate model whose success does not survive a new person or task. XAI can expose that reliance, guide debugging, and generate cognitive hypotheses. Its output, however, needs its own tests of fidelity, direction, stability, and usefulness. The question is not whether an explanation looks physiologically familiar, but whether the model, analysis, and intended user support the interpretation being made.
TRACE-WL summarizes that obligation in five linked parts: align the construct, validate at the level of the claim, test attribution, evaluate the explanation with its audience, and examine robustness under actual conditions of use. The standard is deliberately stricter than high predictive accuracy because an adaptive system acts on people, not on an abstract test set. For education, healthcare, transportation, and everyday human-computer interaction, a useful workload model must reveal when its evidence is weak, when a sensor has failed, and when a person should ignore or challenge its recommendation. Meeting those requirements would move the field from persuasive explanation graphics toward instruments that can be audited, compared, and used with appropriate restraint.
Author Contributions
N.S. performed the conceptualization, literature synthesis, framework development, visualization, and writing of the original and revised manuscript.
Funding
This research received no specific grant from any funding agency in the public, commercial, or not-for-profit sectors.
Acknowledgments
The author thanks the scholarly communities in cognitive science, neuroergonomics, human factors, and explainable artificial intelligence whose methodological work informed this synthesis.
Conflicts of Interest
The author declares no conflict of interest.
References
- Adadi, A., & Berrada, M. (2018). Peeking inside the black-box: A survey on explainable artificial intelligence (XAI). IEEE Access, 6, 52138–52160.
- https://doi.org/10.1109/ACCESS.2018.2870052.
- Ahlstrom, U., & Friedman-Berg, F. J. (2006). Using eye movement activity as a correlate of cognitive workload. International Journal of Industrial Ergonomics, 36(7), 623–636.
- https://doi.org/10.1016/j.ergon.2006.04.002.
- Amann, J., Blasimme, A., Vayena, E., Frey, D., & Madai, V. I. (2020). Explainability for artificial intelligence in healthcare: A multidisciplinary perspective. BMC Medical Informatics and Decision Making, 20, Article 310.
- https://doi.org/10.1186/s12911-020-01332-6.
- Arrieta, A. B., Díaz-Rodríguez, N., Del Ser, J., Bennetot, A., Tabik, S., Barbado, A., García, S., Gil-López, S., Molina, D., Benjamins, R., Chatila, R., & Herrera, F. (2020). Explainable artificial intelligence (XAI): Concepts, taxonomies, opportunities and challenges toward responsible AI. Information Fusion, 58, 82–115.
- https://doi.org/10.1016/j.inffus.2019.12.012.
- Ayaz, H., Shewokis, P. A., Bunce, S., Izzetoglu, K., Willems, B., & Onaral, B. (2012). Optical brain monitoring for operator training and mental workload assessment. NeuroImage, 59(1), 36–47.
- https://doi.org/10.1016/j.neuroimage.2011.06.023.
- Basnet, N., & Zahabi, M. (2025). Real-time cognitive workload assessment using non-intrusive methods: A systematic review. Ergonomics, 1–26. Advance online publication.
- https://doi.org/10.1080/00140139.2025.2606779.
- Beatty, J. (1982). Task-evoked pupillary responses, processing load, and the structure of processing resources. Psychological Bulletin, 91(2), 276–292.
- https://doi.org/10.1037/0033-2909.91.2.276.
- Borghini, G., Astolfi, L., Vecchiato, G., Mattia, D., & Babiloni, F. (2014). Measuring neurophysiological signals in aircraft pilots and car drivers for the assessment of mental workload, fatigue and drowsiness. Neuroscience & Biobehavioral Reviews, 44, 58–75.
- https://doi.org/10.1016/j.neubiorev.2012.10.003.
- Brouwer, A.-M., Hogervorst, M. A., van Erp, J. B. F., Heffelaar, T., Zimmerman, P. H., & Oostenveld, R. (2012). Estimating workload using EEG spectral power and ERPs in the n-back task. Journal of Neural Engineering, 9(4), Article 045008.
- https://doi.org/10.1088/1741-2560/9/4/045008.
- Buçinca, Z., Malaya, M. B., & Gajos, K. Z. (2021). To trust or to think: Cognitive forcing functions can reduce overreliance on AI in AI-assisted decision-making. Proceedings of the ACM on Human-Computer Interaction, 5(CSCW1), Article 188.
- https://doi.org/10.1145/3449287.
- Charles, R. L., & Nixon, J. (2019). Measuring mental workload using physiological measures: A systematic review. Applied Ergonomics, 74, 221–232.
- https://doi.org/10.1016/j.apergo.2018.08.028.
- Chaturvedi, S., & Ahirwal, M. K. (2026). SHAP analysis of an improved EEG-based mental workload classification framework: Utilizing data augmentation and explainable AI. Scientific Reports, 16, Article 22886.
- https://doi.org/10.1038/s41598-026-52330-z.
- Chicco, D., & Jurman, G. (2020). The advantages of the Matthews correlation coefficient (MCC) over F1 score and accuracy in binary classification evaluation. BMC Genomics, 21, Article 6.
- https://doi.org/10.1186/s12864-019-6413-7.
- Craik, A., He, Y., & Contreras-Vidal, J. L. (2019). Deep learning for electroencephalogram (EEG) classification tasks: A review. Journal of Neural Engineering, 16(3), Article 031001.
- https://doi.org/10.1088/1741-2552/ab0ab5.
- de Jong, T. (2010). Cognitive load theory, educational research, and instructional design: Some food for thought. Instructional Science, 38, 105–134.
- https://doi.org/10.1007/s11251-009-9110-0.
- Debie, E., Fernandez Rojas, R., Fidock, J., Barlow, M., Kasmarik, K., Anavatti, S. G., Garratt, M., & Abbass, H. A. (2021). Multimodal fusion for objective assessment of cognitive workload: A review. IEEE Transactions on Cybernetics, 51(3), 1542–1555.
- https://doi.org/10.1109/TCYB.2019.2939399.
- Fairclough, S. H. (2009). Fundamentals of physiological computing. Interacting with Computers, 21(1–2), 133–145.
- https://doi.org/10.1016/j.intcom.2008.10.011.
- Galy, E., Cariou, M., & Mélan, C. (2012). What is the relationship between mental workload factors and cognitive load types? International Journal of Psychophysiology, 83(3), 269–275.
- https://doi.org/10.1016/j.ijpsycho.2011.09.023.
- Hassan, J., Reza, S., Ahmed, S. U., Anik, N. H., & Khan, M. O. (2025). EEG workload estimation and classification: A systematic review. Journal of Neural Engineering, 22(5), Article 051003.
- https://doi.org/10.1088/1741-2552/ad705e.
- Guidotti, R., Monreale, A., Ruggieri, S., Turini, F., Giannotti, F., & Pedreschi, D. (2018). A survey of methods for explaining black box models. ACM Computing Surveys, 51(5), Article 93.
- https://doi.org/10.1145/3236009.
- Hendi, A., Sutarto, A. P., Herlambang, M. B., & Izzah, N. (2026). Interpretable machine learning for mental workload detection: From binary to multi-class with multimodal physiology signals. Asia-Pacific Journal of Science and Technology, 31, Article 286080.
- https://doi.org/10.22299/apst.2026.286080.
- Hogervorst, M. A., Brouwer, A.-M., & van Erp, J. B. F. (2014). Combining and comparing EEG, peripheral physiology and eye-related measures for the assessment of mental workload. Frontiers in Neuroscience, 8, Article 322.
- https://doi.org/10.3389/fnins.2014.00322.
- Holzinger, A., Langs, G., Denk, H., Zatloukal, K., & Müller, H. (2019). Causability and explainability of artificial intelligence in medicine. WIREs Data Mining and Knowledge Discovery, 9(4), Article e1312.
- https://doi.org/10.1002/widm.1312.
- Kahneman, D., & Beatty, J. (1966). Pupil diameter and load on memory. Science, 154(3756), 1583–1585.
- https://doi.org/10.1126/science.154.3756.1583.
- Kapoor, S., & Narayanan, A. (2023). Leakage and the reproducibility crisis in machine-learning-based science. Patterns, 4(9), Article 100804.
- https://doi.org/10.1016/j.patter.2023.100804.
- Kret, M. E., & Sjak-Shie, E. E. (2019). Preprocessing pupil size data: Guidelines and code. Behavior Research Methods, 51(3), 1336–1342.
- https://doi.org/10.3758/s13428-018-1075-y.
- Liao, Q. V., & Varshney, K. R. (2022). Human-centered explainable AI (XAI): From algorithms to user experiences. WIREs Data Mining and Knowledge Discovery, 12(4), Article e1486.
- https://doi.org/10.1002/widm.1486.
- Lim, W. L., Sourina, O., & Wang, L. P. (2018). STEW: Simultaneous task EEG workload data set. IEEE Transactions on Neural Systems and Rehabilitation Engineering, 26(11), 2106–2114.
- https://doi.org/10.1109/TNSRE.2018.2872924.
- Longo, L. (2018). Experienced mental workload, perception of usability, their interaction and impact on task performance. PLOS ONE, 13(8), Article e0199661.
- https://doi.org/10.1371/journal.pone.0199661.
- Lundberg, S. M., & Lee, S.-I. (2017). A unified approach to interpreting model predictions. Advances in Neural Information Processing Systems, 30, 4765–4774.
- https://proceedings.neurips.cc/paper/2017/hash/8a20a8621978632d76c43dfd28b67767-Abstract.html.
- Mathot, S. (2018). Pupillometry: Psychology, physiology, and function. Journal of Cognition, 1(1), Article 16.
- https://doi.org/10.5334/joc.18.
- Miller, T. (2019). Explanation in artificial intelligence: Insights from the social sciences. Artificial Intelligence, 267, 1–38.
- https://doi.org/10.1016/j.artint.2018.07.007.
- Mohseni, S., Zarei, N., & Ragan, E. D. (2021). A multidisciplinary survey and framework for design and evaluation of explainable AI systems. ACM Transactions on Interactive Intelligent Systems, 11(3–4), Article 24.
- https://doi.org/10.1145/3387166.
- Paas, F., Renkl, A., & Sweller, J. (2003). Cognitive load theory and instructional design: Recent developments. Educational Psychologist, 38(1), 1–4.
- https://doi.org/10.1207/S15326985EP3801_1.
- Recarte, M. A., & Nunes, L. M. (2003). Mental workload while driving: Effects on visual search, discrimination, and decision making. Journal of Experimental Psychology: Applied, 9(2), 119–137.
- https://doi.org/10.1037/1076-898X.9.2.119.
- Rudin, C. (2019). Stop explaining black box machine learning models for high stakes decisions and use interpretable models instead. Nature Machine Intelligence, 1, 206–215.
- https://doi.org/10.1038/s42256-019-0048-x.
- Saeb, S., Lonini, L., Jayaraman, A., Mohr, D. C., & Kording, K. P. (2017). The need to approximate the use-case in clinical machine learning. GigaScience, 6(5), 1–9.
- https://doi.org/10.1093/gigascience/gix019.
- Saito, T., & Rehmsmeier, M. (2015). The precision-recall plot is more informative than the ROC plot when evaluating binary classifiers on imbalanced datasets. PLOS ONE, 10(3), Article e0118432.
- https://doi.org/10.1371/journal.pone.0118432.
- Samek, W., Montavon, G., Lapuschkin, S., Anders, C. J., & Müller, K.-R. (2021). Explaining deep neural networks and beyond: A review of methods and applications. Proceedings of the IEEE, 109(3), 247–278.
- https://doi.org/10.1109/JPROC.2021.3060483.
- Sweller, J. (1988). Cognitive load during problem solving: Effects on learning. Cognitive Science, 12(2), 257–285.
- https://doi.org/10.1207/s15516709cog1202_4.
- Tao, D., Tan, H., Wang, H., Zhang, X., Qu, X., & Zhang, T. (2019). A systematic review of physiological measures of mental workload. International Journal of Environmental Research and Public Health, 16(15), Article 2716.
- https://doi.org/10.3390/ijerph16152716.
- Tjoa, E., & Guan, C. (2021). A survey on explainable artificial intelligence (XAI): Toward medical XAI. IEEE Transactions on Neural Networks and Learning Systems, 32(11), 4793–4813.
- https://doi.org/10.1109/TNNLS.2020.3027314.
- Van Calster, B., McLernon, D. J., van Smeden, M., Wynants, L., & Steyerberg, E. W. (2019). Calibration: The Achilles heel of predictive analytics. BMC Medicine, 17, Article 230.
- https://doi.org/10.1186/s12916-019-1466-7.
- van der Wel, P., & van Steenbergen, H. (2018). Pupil dilation as an index of effort in cognitive control tasks: A review. Psychonomic Bulletin & Review, 25, 2005–2015.
- https://doi.org/10.3758/s13423-018-1432-y.
- Varoquaux, G. (2018). Cross-validation failure: Small sample sizes lead to large error bars. NeuroImage, 180, 68–77.
- https://doi.org/10.1016/j.neuroimage.2017.06.061.
- Vilone, G., & Longo, L. (2021). Notions of explainability and evaluation approaches for explainable artificial intelligence. Information Fusion, 76, 89–106.
- https://doi.org/10.1016/j.inffus.2021.05.009.
- Vishnu, K. N., & Gupta, C. N. (2024). Systematic review of experimental paradigms and deep neural networks for electroencephalography-based cognitive workload detection. Progress in Biomedical Engineering, 6(4), Article 042002.
- https://doi.org/10.1088/2516-1091/ad8530.
- Wickens, C. D. (2008). Multiple resources and mental workload. Human Factors, 50(3), 449–455.
- https://doi.org/10.1518/001872008X288394.
- Wilson, G. F., & Russell, C. A. (2003). Real-time assessment of mental workload using psychophysiological measures and artificial neural networks. Human Factors, 45(4), 635–644.
- https://doi.org/10.1518/hfes.45.4.635.27088.
- Xu, H., Zhang, Y., Li, Z., Wang, J., & Li, W.-C. (2026). Recognising and explaining mental workload using a low-interference method by fusing speech, ECG and eye-tracking signals during simulated flight. Ergonomics. Advance online publication.
- https://doi.org/10.1080/00140139.2025.2511877.
- Zhang, Z. T., Ketenci Argın, S., Bilen, M. B., Urgun, D., Deniz, S. M., Liu, Y., & Hassib, M. (2024). Measuring the effect of mental workload and explanations on appropriate AI reliance using EEG. Behaviour & Information Technology, 1–19. Advance online publication.
- https://doi.org/10.1080/0144929X.2024.2431055.
- Young, M. S., Brookhuis, K. A., Wickens, C. D., & Hancock, P. A. (2015). State of science: Mental workload in ergonomics. Ergonomics, 58(1), 1–17.
- https://doi.org/10.1080/00140139.2014.956151.
Figure 1.
Trace-WL evidence chain for explainable cognitive-workload systems.
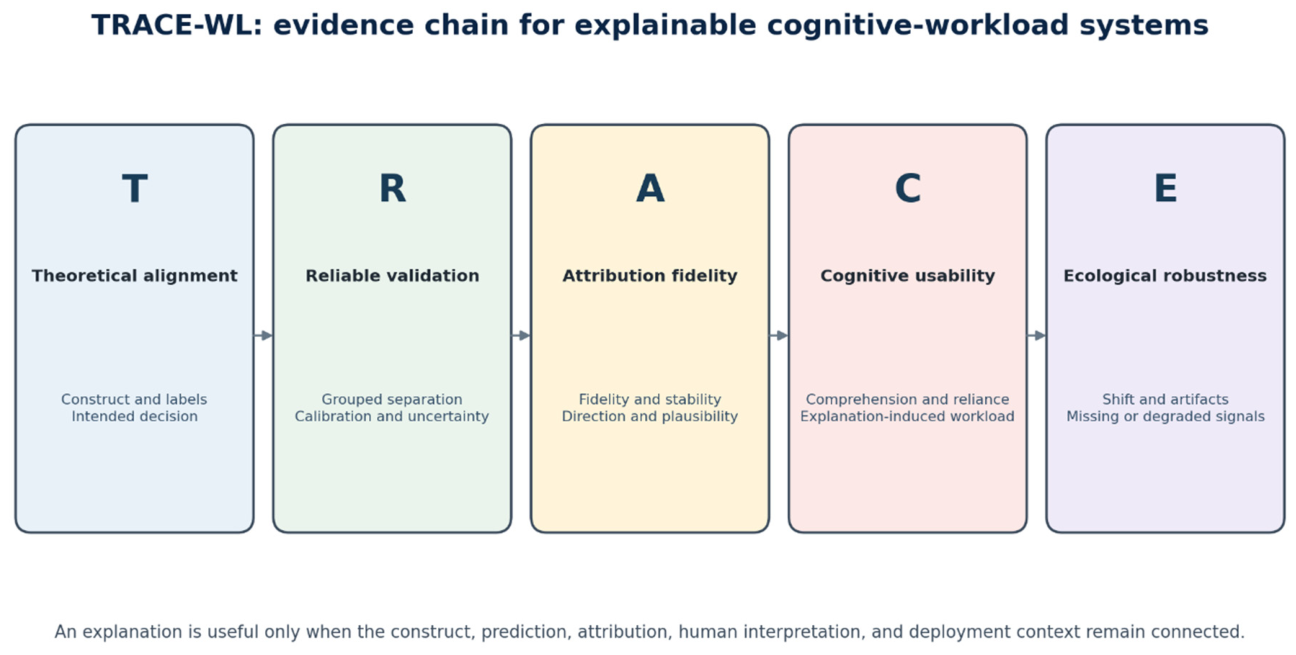
Disclaimer/Publisher’s Note: The statements, opinions and data contained in all publications are solely those of the individual author(s) and contributor(s) and not of MDPI and/or the editor(s). MDPI and/or the editor(s) disclaim responsibility for any injury to people or property resulting from any ideas, methods, instructions or products referred to in the content. |
© 2026 by the authors. Licensee MDPI, Basel, Switzerland. This article is an open access article distributed under the terms and conditions of the Creative Commons Attribution (CC BY) license (http://creativecommons.org/licenses/by/4.0/).
Copyright: This open access article is published under a Creative Commons CC BY 4.0 license, which permit the free download, distribution, and reuse, provided that the author and preprint are cited in any reuse.