

Submitted:
16 November 2026
Posted:
18 November 2026
You are already at the latest version
Abstract
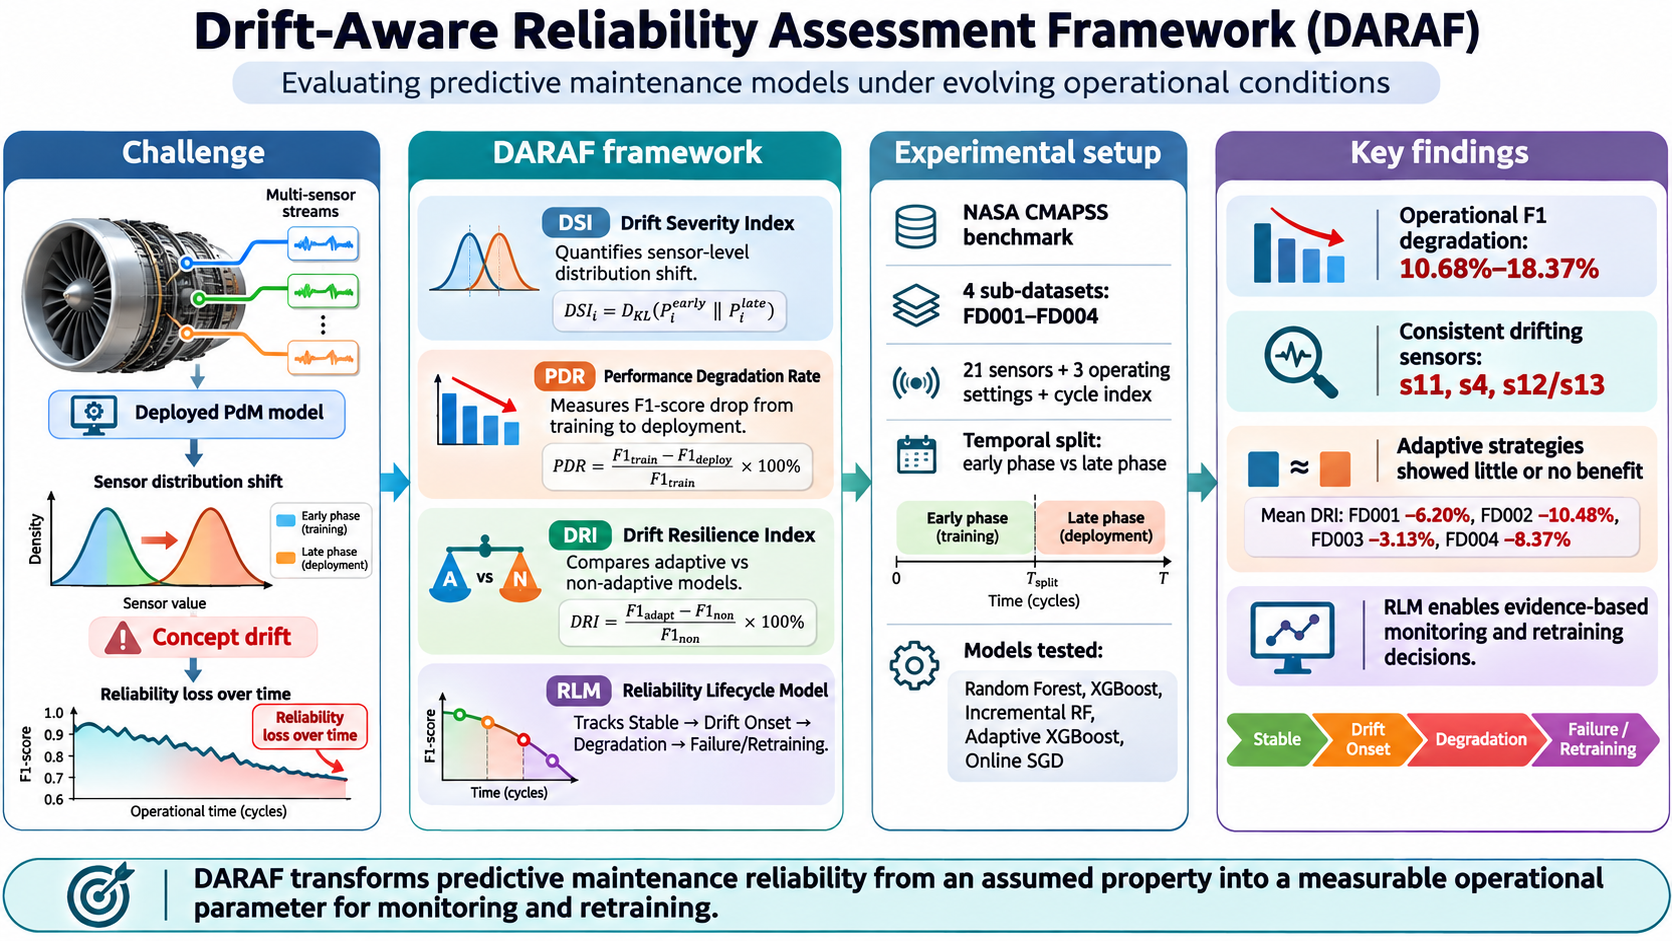
Predictive maintenance (PdM) models are increasingly developed to predict equipment failures and reduce unplanned downtime, yet their long-term reliability degrades as the distribution of sensor data shifts under operational conditions, a phenomenon known as concept drift. Despite growing embrace, no existing framework systematically quantifies this Degradation or supports evidence-based retraining decisions in deployed PdM systems to address this need. We introduced the Drift-Aware Reliability Assessment Framework (DARAF), which assessed model accuracy, reliability, and predictability by examining specific types of changes in operational data over the course of a PdM system's active life. The framework consists of four mutually supporting components: DSI, PDR, DRI, and RLM. Overall, the findings showed an average degradation of 10.68% to 18.37%, with little to no benefit from adaptive (dynamic) strategies for improving the reliability of a PdM system. This study highlights a basis for future training model decision-making processes of PdM systems.
Keywords:
predictive maintenance
; machine learning
; drift detection
; performance degradation
; random forest
1. Introduction
In most real-world applications, the performance of a machine learning model declines in production and continues to fall as systems grow [1]. This is called the model degradation problem. Predictive maintenance systems use data streams from equipment sensors and machine learning algorithms to anticipate equipment failures [2]. In most practical use cases, there is a degradation in the performance of a machine learning model from design time to runtime, as well as during system growth. This is referred to as a model degradation problem. Data streams from equipment sensors and machine learning algorithms are utilized in predictive maintenance to anticipate equipment failure [3]. They have matured into an important means of safety in data-intensive environments like industry and of operational efficiency. Predictive maintenance is an intervention based on condition, while time-dependent strategies are interventions based on time [4]. This approach helps minimize unplanned downtime, replacement-part life and overall ownership cost. With the use of powerful statistical techniques like Random Forest (RF) and Extreme Gradient Boosting (XGBoost), and powerful deep learning techniques like the recurrent network Long Short-Term Memory (LSTM) network, very promising results have been achieved in the well-known NASA Commercial Modular Strong Predictive Modular Aero Propulsion System Simulation (CMSSPS) dataset. The CMSSPS data set is widely regarded as one of the most popular datasets for predictive maintenance of turbofan engines. It is typically used as a reference for useful life parameters. With these predictive maintenance standards in hand, there is a high level of confidence in the ability of the machine learning techniques of predictive maintenance to be implemented in safety-critical industries.
However, a major concern in deploying models from a controlled laboratory setting to real-world settings is the data distribution during deployment [5]. Once deployed, models encounter operational data that may differ substantially from their training distribution, as real industrial systems are dynamic and continuously evolve. Turbofan engines can be used under a variety of flight conditions, including different engine speeds and altitudes. Manufacturing equipment will deteriorate over time and therefore emit varying levels of sensor output. Also, changes in manufacturing processes occur during system use, for example, when base levels change. These environments are continuously changing, and so are the statistical properties of the streaming data. Continuous change in data distribution, also called concept drift or data drift in the literature [6], presents major challenges for keeping a machine learning model in sync with the spatial distribution of its boundaries and their use in practice. These mismatches between data distributions can sometimes be dramatic and may not even be visible on the graph. If a model is deployed to an operational environment, for instance, a period of stability may ensure, followed by a gradual, progressive, long-term decline in the model's operational accuracy without the operators' notice. In predictive maintenance applications in both aviation/industrial environments, operators who rely on ML models that have been losing accuracy over time can experience economic losses due to failing to detect signs of impending failure and unnecessary maintenance actions [7].
The two research directions on model degradation due to model drift are drift detection and drift adaptation [8], using statistical approaches to assess whether a distributional change has occurred, and adaptive learning techniques that resample and adapt model parameters in the presence of drift. Either way is a valid contribution, but neither systematically nor quantitatively examines the reliability of a deployed model. Drift detection does not provide any information about the amount of drift at the sensor level, potential Degradation of performance, or how much drift is still possible before model retraining is needed. The results of this study directly show the dependency between reliability and the frequency of model updates, as assumed in Pivot Strategies; however, in cases of accurate industrial drift, an incorrect update frequency (short time windows) can shorten the time to performance degradation [9]. There is currently no framework that tracks the reliability of the deployed model over its lifetime of use, understands the different stages it goes through, and can empirically detect when the model needs to be retrained. The study focuses on the disconnect between what is performed in the laboratory and what is required in industry.
To address this issue, this study proposes a formal framework, namely the Drift-Aware Reliability Assessment Framework (DARAF), for evaluating the reliability of predictive maintenance models across different operational conditions. The four numerical indices of the DARAF are the Drift Severity Index (DSI) which estimates the extent of the distribution shift in the available data from the training to the deployment time on the sensor level, the Performance Degradation Rate (PDR) which measures the impact of the distribution shift in terms of Degradation in the model performance, the Drift Resilience Index (DRI) which gives means for comparison of the drift resilience of different model architectures, and the Reliability Lifecycle Model (RLM) which describes the model reliability through four phases of operation: Stable, Drift Onset, Degradation, and Failure/Retraining. This framework is for five machine learning models applied to all four of the NASA CMAPSS sub-datasets. The research question of this study is: What is the effect of operational drift on the data distribution at the sensor level, on the accuracy of the machine learning model deployed in real-life environments and in terms of adaptability and non-adaptability model architecture reliability?
This research is not only theoretical, but also has a pragmatic value. Considering the operational risks associated with model failures, most model deployments for PM lack structured visibility and entail the costs of equipment downtime, accidents, or increased maintenance expenses. DARAF allows the practitioner to apply a reproducible, understandable method for assessing model reliability, thereby making reliability an operational variable. The proposed framework lays out the numerical counts of drift levels and occurrence rate, and the thresholds for each stage of the lifecycle, so industry practitioners can make timely and accurate decisions using these data.
2. Related Work
2.1. Predictive Maintenance Systems
Industrial organizations in manufacturing, aerospace, and energy are moving from time-based to data-driven maintenance. Predictive maintenance systems and techniques rely on ongoing sensor data to anticipate equipment health, foresee failures, and enable maintenance activities just in time to prevent failures. This results in well-timed maintenance activities, reduced unscheduled downtime and reduced life cycle costs. In many cases, such as in complex work environments, combining real-time sensor data streams with intelligent inference processes, as in Artificial Intelligence of Things (AIoT) architectures, is the key to the next generation of predictive maintenance (PdM), as shown by Bitam, Yahiaoui [10]. Empirical evidence of the direct influence of IoT-integrated PdM on operations reliability metrics when deployed in the field is provided by Ginting, Mangngi [11]. The NASA CMAPSS data set is used to evaluate PdM methods because it contains failure-to-run trajectories for 21 sensors under varying operating conditions, reflecting real industrial non-stationary conditions. For this reason, it is an ideal choice for drift-based analyses, as carried out in this study.
2.2. Machine Learning Models in Predictive Maintenance
The methods used to classify failure types and predict remaining useful life (RUL) have been established through an ensemble of approaches and deep learning algorithms. An ensemble approach allows an aggregator (e.g., Random Forest or XGBoost) to represent a nonlinear sensor-to-failure relationship. On the other hand, LSTM networks capture the sequential (temporal) dependencies among events, leading to better Degradation than shallow architectures. Kang, Catal [12] demonstrate that LSTM neural networks trained on CMAPSS trajectory data produce competitive predictions for RUL metrics associated with Degradation. The representation of temporal features is key, as it allows a model to learn from the dynamics of progressive Degradation over time. Lorenti, Dalle Pezze [13] stress that the context in which a model is created needs to be understood in terms of the operational dataset's characteristics. Al-Refaie, Al-Atrash [14] confirmed that machine learning approaches are superior to physics-based ones for RUL prediction in an industrial context. Saeed, A. Khan [15] provide further support for diagnostic robustness under resource-constrained IIoT conditions. Across these studies, model performance is consistently evaluated under distributional stationarity, and no results have been provided regarding their performance under operational drift.
2.3. Data Drift and Concept Drift
Data streams in industry have two types of non-stationarity: (i) data drift (changes to input feature distributions), and (ii) concept drift (changes to the relationship of inputs to output). Lu, Liu [16] established the first taxonomy of drift types, comprising four categories: gradual, sudden, recurring, and incremental, to serve as a theoretical foundation for subsequent industrial applications. Han, Meng [17] provide a statistical basis for monitoring feature variance as an early warning sign of drift in streaming industrial data. Finally, according to Bayram, Ahmed [18], degradation in the model's error rate serves as an indicator of concept drift in deployed machine learning systems.; therefore, there have been several contributions establishing the ability to detect drift, but none provide a quantitative estimate of drift severity at the sensor level or systematically link drift detection to downstream model performance.
2.4. Adaptive Predictive Maintenance Systems
The limitations of static deployment in changing conditions have spurred extensive research into adaptive learning methods. Gama, Žliobaitė [19] examine adaptation methods in detail and show that no one method works best for all types of change. Ancy and Paulraj [20] show that a diverse set of ensemble classifiers works better than just a few single classifiers in both types of drift and at all levels of drift; Gözüaçık and Can [21] demonstrate that implicit drift detectors result in a lower rate of false alarms when used in an online system. A further advancement of this direction is made by Marchand, Laval [22], who developed a complete lifecycle framework that includes the detection of both gradual and abrupt changes, as well as the measurement of the severity of each detected change; while Balasubramanian [23] proposes an MLOps pipeline linking the detection of drift with continuous retraining. Although there has been progress in this area, nearly all research on adaptive methods rests on one key, untested assumption: that incremental updates always yield a more reliable system than static deployment. Current research will challenge this assumption.
2.5. Gap Summary
The literature review shows continual improvement in each dimension of PdM reliability, yet a significant gap remains. Research has mainly focused on drift detection and short-term adaptation of deployed models, rather than evaluating long-term operational reliability over the total life cycle of deployed models. As Yang and Rossi [24] note, one key capability required after deploying a model is monitoring its ongoing performance. Yet, none of the research has offered a framework for evaluating and measuring the trustworthiness of deployed models over time. Furthermore, there is a limitation that existing framework can simultaneously provide the following four measures that together make up the four-dimensional gap addressed by the DARAF: (a) quantify the level of drift using information from the sensor; (b) measure the direct operational cost of drift; (c) test the robustness of the comparative architectures for the deployed models; and (d) describe the total reliability life cycle from deployment until the trigger for model retraining.
3. Methodology
3.1. DARAF Framework Overview
The Drift-Aware Reliability Assessment Framework (DARAF) is a novel approach to evaluating the long-term reliability of predictive maintenance models under changing conditions. Unlike current methods, which treat drift detection and model adjustment separately, DARAF integrates them into a single assessment panel or platform. Four analytical components operate in sequence within a continuous feedback loop to describe how trustworthy a model is from deployment through retraining; this sequence defines the retraining threshold. DARAF is independent of the metric (dataset) used and architecture-neutral, so it can be used with any supervised classification and regression model applied to industrial sensor environments where conditions vary over time. Through various components, objective, interpretable, and quantifiable reliability indicators were provided across the pipeline, thereby clarifying the transition from an assumed post-deployment state to a quantifiable, operationally applicable parameter.
3.2. Workflow of DARAF
DARAF has been built as a sequential four-stage pipeline, in which the output of each stage validates the previous stage and feeds into the next. The pipeline begins by deploying the model, after which the model's generated data is split into training and evaluation sets. Data generated during the training phase is then used to calculate the Sensor Channel Drift Severity Index (DSI), which quantifies distributional drift from training to evaluation. The PDR is then calculated from the DSI. Once the DSI and PDR are set, the Drift Resilience Index (DRI) will be established to indicate the relative resiliency of an adaptive model compared to a non-adaptive model to a particular drift exposure. Once the DSI, PDR, and DRI are obtained, the Reliability Lifecycle Model (RLM) will be developed by plotting multiple performance metrics over multiple time intervals to identify when it needs to be updated. Table 1 summarizes the four pipeline stages, the input and output data for each stage, and indicates how each stage uses the previous stage's output to provide context for evaluating the DSI, PDR, DRI, and RLM as aspects of a single trajectory of reliability rather than independent measures.
3.3. Key Components of DARAF
The following are formal definitions of the four components of DARAF. Each component corresponds to a unique, previously unmeasured dimension of Model Drift Reliability with respect to drift. Together, these four components provide a full vocabulary for assessing the reliability of predictive maintenance systems in deployment.
The Drift Severity Index (DSI) quantifies how much the sensor data used to train your model differs from the data collected by sensors when your model goes live. The DSI was calculated for each sensor channel, so if one sensor shows a large difference between training and live, it identifies the sensor producing the greatest distributional divergence and by how much. The total DSI score represented the overall drift severity across all sensor channels and provided the first quantitative signal processed within the DARAF automation pipeline.
A Performance Degradation Rate (PDR) measures the effect of observed drift on the model's predictive accuracy. It was defined as the F1 score difference between the model's training and deployment partitions, expressed in absolute point values and then converted to percentage points. Thus, PDR operationalizes the current distributional shift to produce a defined model output quality, thereby providing operators with a concrete, quantifiable metric of drift related to how reliably a model produces an answer or classification.
The Drift Resilience Index (DRI) is a measure used to assess models' ability to handle drift in real time (i.e., evolving system characteristics). The DRI compared the F1-scores of two models with the same data set and drift characteristics, an adaptive version of the model, and a static version that is not adaptive, and provides a numerical statistic for each performance as a difference score between the two F1 scores obtained from testing. A positive DRI indicates that an adaptive model performed better than a static model relative to drift; a negative DRI indicates that the adaptive model performed worse than its static counterpart, due to increased or accumulated instability (no improvement).
The Model Reliability Lifecycle (MRL) provides a chronological timeline of model reliability throughout the operational lifecycle. MRL comprises data from multiple evaluations of model performance across chronological windows (Time Bins) and uses empirical F1 Thresholds to indicate which phase (1 to 4) the current model is in at any given point in time. The data in Table 2 show operational safety requirements regarding failure classifications. An F1 score below 60% means the model misses more than 40% of genuine failure events and is operationally unjustifiable for autonomous deployment without intervention. The Drift Onset boundary (75%) is the earliest point at which performance degradation should be monitored before it becomes critical.
3.4. Dataset and Preprocessing
The empirical analysis was conducted using the NASA CMAPSS dataset [25], a multivariate run-to-failure dataset comprising sensor time series from four sub-datasets (FD001, FD002, FD003, FD004). Each of the four sub-datasets was subjected to a different set of operating conditions and failed in one of several different fault modes. Each observation includes 21 sensor readings, 3 operational settings, a unit identifier, and a cycle index. Training sets range from 20,631 rows in FD001 to 61,249 rows in FD004. There was no missing data in any of the sub-datasets. The RUL label was estimated by subtracting the current cycle from the maximum number of engine cycles. A 30-cycle threshold was used to create binary failure labels, with failure rates of ~15% in FD001 and FD002 and ~12.5% in FD003 and FD004. The structural properties of the four NASA CMAPSS sub-datasets are summarized in Table 3. There are 26 variables in each observation: an engine identifier, a cycle index, 3 engine settings, and 21 sensor measurements. In this regard, the presence of different operating conditions across the FD002 and FD004 datasets indicates a distribution shift. By contrast, the single condition in FD001 and FD003 allows studying the impact of fault-mode complexity on drift.
3.5. Feature Engineering and Drift Simulation
The feature set included all 21 sensor readings, 3 operating modes and cycle index, totaling 25 input features. The temporal split strategy separated the sub-datasets at the 50 percent mark in the timeline into two parts: the early time frame (for model development) and the late time frame (for model testing). This type of model development design is typical, as the model is trained on early operational data and then tested against operational data, by which point degradation may have changed. This was confirmed by the 0% failure rate in the early phase across all sub-datasets, compared with the 25–30% failure rate in the late phase, which indicated a significant, naturally occurring distributional shift without synthetic data manipulation.
3.6. Experimental Design
All models were first trained on the entire training partition and subsequently evaluated on each test partition using a non-adaptive configuration to enable comparison across the five model variants. Three adaptive strategies were also evaluated: An Incremental Random Forest retrained with a sliding window, an Adaptive XGBoost model updated sequentially via warm-starting, and an Online SGD model updated incrementally via partial fitting. The hyperparameters and adaptation mechanisms of all models are summarized in Table 4. Balanced class weighting was used for Random Forest, the positive class was up-weighted in XGBoost, and manually computed class weights were used in Online SGD to overcome class imbalance. All experiments were carried out in Python using the Scikit-learn and XGBoost libraries, and the F1 score was used primarily to measure performance across the three metrics: PDR, DRI, and RLM. The non-adaptive models serve as a baseline for calculating the DRI, enabling assessment of each adaptation strategy's contribution to overall drift resilience, independent of architectural differences.
4. Results and Evaluation
In this section, we will describe the actual results obtained when the DARAF technique was applied to the four different CMAPSS NASA Subsets of data. The results will be displayed in four sections, each corresponding to one of the four sequential components of the DARAF framework described in Section 3.
4.1. Drift Characterization Results
To evaluate the severity of distributional shift between the early and late operation phases, the Drift Severity Index was calculated for all 21 sensor channels in each sub-dataset. Table 5 shows that the aggregate DSI scores are considerably higher for the single-condition sub-datasets (FD001 and FD003) than for the multi-condition sub-datasets (FD002 and FD004). This result is because the overall distributional spread is evaluated in the KS test. The comparatively narrow shift induced by the Degradation is as large as the high natural spread across the six operating conditions in FD002 and FD004. It is therefore not reflected in the overall shift. Channels s11, s4, s12, and s13 are the only ones to appear consistently as drifting channels across the four sub-datasets. Thus, they can be viewed as prime indicators of Degradation and merit prioritized monitoring in any DARAF operational deployment.
The bar chart per sensor (Figure 1) depicts the KS statistic for each sensor across all four sub-datasets, with the KS statistic plotted against the p = 0.05 significance threshold. Statistically significant sensors are indicated in red, and those that are not are indicated in blue. Drift was distributed unevenly across sensor channels within each sub-dataset. In FD001 and FD003, the three or four middle sensors have higher bars than the others, indicating a "spike" profile with the strongest drift sources in the middle. By comparison, the FD002 and FD004 panels have a flatter, more compressed bar profile with smaller absolute KS-values across the panel, and the variance-masking effect described above is clearly visible. However, a similar number of sensors are below the significance threshold. The contrast between spiked and flattened drift is also diagnostic. A practitioner does not need to consult the dataset's aggregate statistics to determine whether the degradation signature reflects single-regime or multi-regime operational drift, which makes sensor-level DSI visualization a valuable advantage over a single dataset-level drift score.
4.2. Performance Evaluation of Non-Adaptive Models
A set of basic degradation characteristics was defined by training and testing RF and XGBoost on the training partition during the early and late operational phases. Table 5 shows that drift affects all eight model-dataset combinations and that performance degrades across all datasets, with PDR ranging from 10.68% to 18.37%. Random forests regularly over-fit the training set while achieving an F1-score of 100% in half or more of cases; as such, the drop in the F1-score during the test phase appears to be due mainly to distributional shift, rather than to model under-fitting. XGBoost performed slightly better across three of four sub-datasets, particularly in FD004, where its PDR of 10.68% was nearly six points lower than Random Forest's 16.25%.

Table 6.
Non-Adaptive Model Performance and PDR.
| Sub-Dataset | Model | Train F1 | Test F1 | PDR |
| FD001 | Random Forest | 100.0% | 84.55% | 15.45% |
| FD001 | XGBoost | 100.0% | 82.86% | 17.14% |
| FD002 | Random Forest | 100.0% | 83.94% | 16.06% |
| FD002 | XGBoost | 96.72% | 83.55% | 13.17% |
| FD003 | Random Forest | 100.0% | 81.63% | 18.37% |
| FD003 | XGBoost | 100.0% | 84.72% | 15.28% |
| FD004 | Random Forest | 100.0% | 83.75% | 16.25% |
| FD004 | XGBoost | 96.32% | 85.64% | 10.68% |
Figure 2 compares training and testing F1-scores across the four sub-datasets in paired bar charts. Each test-phase bar has a label above it showing how far down the y-axis it is from its original position. The eight panels show an identical "step down" silhouette. In each panel, the training F1-score (blue) is at or very close to zero, while the test F1-score is lower than the number shown in the table below suggests. This common shape across the eight independent panels is the main result of the figure: Degradation is not an occasional anomaly in a single model or data set, but an intrinsic aspect of applying any non-adaptive classifier with a temporal split protocol. The annotated drop values also allow direct visual ranking of severity across panels without having to refer back to the table. The FD003 Random Forest panel has the largest gap annotated on the page. In contrast, the FD004 XGBoost panel has the smallest, providing an immediate severity ranking that supports the numeric PDR ranking and confirms the comparatively mild drop in the multi-condition sub-datasets for XGBoost.
4.3. Performance Evaluation of Adaptive Models
To assess whether the Degradation observed in Section 4.2 can be mitigated by keeping the model up to date, we evaluated three adaptive variants (Incremental Random Forest, Adaptive XGBoost, and Online SGD) using the same train-test split. Figure 3 plots the F1 scores of all five models (two non-adaptive and three adaptive) as bar graphs for each of the four sub-datasets, with a vertical line marking the separation between the non-adaptive and adaptive models. In each graph, one can see a clear downward trend from left to right across the bars. This trend is especially noticeable in the FD002 and FD004 sub-datasets, where the Online SGD bar becomes about two-thirds of the Random Forest bar height. The figure is visually exceptional because the Online SGD bar is the only adaptive bar among the sixteen that is larger than its non-adaptive counterpart, whereas the others show a consistent downward trend; this visually marks FD003 as the boundary case explored further in Section 4.5. Across all four panels, Incremental Random Forest and Adaptive XGBoost remain just below their non-adaptive counterparts, yielding a smaller but still noticeable step-down that suggests moderate rather than severe instability for these two adaptation strategies.
4.4. Reliability Degradation Analysis
Combining the results of Section 4.2 and Section 4.3, it follows that reliability degradation during drift is not a consequence of any specific model choice but rather a fundamental property of the architecture itself. In the absence of any intervention, classifiers deployed with the CMAPSS-trained classifiers can expect to lose about 15.74% of their F1 effectiveness at the end of each operational life cycle. The severity of Degradation was correlated to the complexity of the fault mode, but not the number of operating conditions: FD003 (2 fault modes for only 1 operating condition) had the highest mean PDR, while FD002 (1 fault mode for 6 operating conditions) had comparatively moderate Degradation. This observation highlights that fault-mode diversity, in addition to operating-condition diversity, shows an important role in reliability loss. Such effects can be revealed only through a systematic comparison between PDR and DSI, facilitated by DARAF.
4.5. Drift Resilience Analysis
For each pair of adaptive and non-adaptive models, the Drift Resilience Index (DRI) was calculated to quantify the effects of adaptation. The mean DRI values for the three adaptive models across the three sub-datasets are shown in Table 6. The negative mean DRIs for each sub-dataset indicate that naive, adaptive, and retraining diminish reliability rather than enhance it, contrary to the assumption in the adaptive learning literature that continuous updating will create drift-resilient models. Two mechanisms contribute to these findings. First, window-based retraining exposes each model iteration to only partial training signals, leading to severe forgetting of previously learned failure patterns. Second, online linear learning methods such as SGD cannot capture the nonlinear interdependencies among sensors in multivariate settings, leading to the large DRI losses shown in Figure 3 for FD002 and FD004. The principal novel contribution of the current study is that drift-resilience cannot be assumed from adaptation alone, but must be validated through empirical testing, which is the purpose of the DRI component within DARAF.
Table 7.
Mean Drift Resilience Index by Sub-Dataset.
| Sub-Dataset | Mean DRI | Resilience Level |
| FD001 | −6.20% | Low |
| FD002 | −10.48% | Low |
| FD003 | −3.13% | Low |
| FD004 | −8.37% | Low |
4.6. Reliability Lifecycle Evaluation
The Reliability Lifecycle Model used the first 10 chronological windows across the 10 sub-datasets to train a baseline classifier, then assessed performance on the remaining windows of each sub-dataset. The resulting lifecycle curves for all four sub-datasets are shown in Figure 4. Each window-to-window segment is colored to represent the windows' phase: green for Stable, orange for Drift Onset, red for Degradation, and purple for Failure/Retraining. The curves are plotted on horizontal threshold lines at the 85%, 75%, and 60% F1 boundaries, and a secondary grey dotted line shows the failure rate at each window. FD001 drops from green to orange between W1 and W2, then remains within the orange band for the rest of the windows, visually indicating one transition window and controlled Degradation for the remainder of the sequence. FD002 is very similar to FD001, with one drop into orange, but the curve remains oscillating at the bottom of the orange group rather than the bottom of the FD001 group at the same phase. The journey in FD003 goes through the green, orange, and red windows of the first six windows, enters the purple window at W7 and W8, returns to the orange window at W9, and enters the purple window at W10. This is the best visual evidence of the path's non-monotonicity in the figures and shows that recovery from any given window does not guarantee reliability. Some windows alternate between orange and red, but none change from red to green after W1, or from purple to green before the collapse. Operational risks are not limited to the edges of the figures; Figure 4 makes this clear. The F1 value of FD002 and FD004 is moderate; however, FD004 is unstable in the middle of its curve, while FD003 collapses toward the end of its curve.
5. Discussion
This study's empirical findings have implications beyond the numerical results presented in Section 4. Three main interpretative threads will guide the discussion of the data: First is what the data show about drift itself; second is what they show about the limitations of adaptive learning as practiced today; and third is what the data imply for how predictive maintenance reliability should be thought of and managed in the future.
This study shows that multi-condition operational environments do not always produce more drift than single conditions. The results contradict a hidden assumption underlying almost all prior research on the CMAPSS Dataset. Both Kang, Catal [12] and Lorenti, Dalle Pezze [13] provide evidence of higher remaining useful life prediction accuracy for the FD002 and FD004 multi-condition data sets than for single-condition data sets. However, both authors attribute the differences in accuracy primarily to model architecture and do not explore why these differences exist; more specifically, the authors did not examine the underlying drift structure of the multi-condition datasets. In fact, FD002 and FD004 are not less affected by drift than single-condition data sets; rather, the signals of drift in each of those data sets are masked by legitimate variability due to operating conditions. This masking of the drift signals in FD002 and FD004 cannot be identified without performing a sensor-level KS-test decomposition of the two data sets. Therefore, based on previous studies reporting robust performance across multi-condition sub-datasets, it is more likely that those studies measured resilience to operating-condition noise rather than actual resistance to degradation drift. This distinction is something that the drift segregation index (DSI) of the DSAF framework is designed to capture. The results of this research have clear implications for overall predictive maintenance reliability and operational strategies. Specifically, confirmatory results from predictions of performance degradation provide evidence for the claim in the concept-drift literature that static predictive models experience a decay in accuracy when applied to non-stationary data (e.g., Lu, Liu [16]; Bayram, Ahmed [18]). However, this research quantifies the decay in predictive accuracy using operationally interpretable metrics. Previous studies treated Degradation as a yes-or-no question about whether drift had occurred. The PDR values derived from the test results (10.68% to 18.37%) suggest that, for practitioners, the more relevant question is how much degradation users can tolerate before taking action. This suggests that PDR should be viewed as a practical alternative for current drift detectors rather than as a competing device.
The primary finding of this study is that the DRI (DF) is negative across the four sub-datasets, in contrast to previous research on adaptive learning methods that treat incremental updating as a standard means of diminishing drift [19]. This indicates that incremental updating can be harmful without qualification. There are two reasons for these results: (i) smaller datasets cause catastrophic forgetting; and (ii) linear adaptation does not apply to the complexity of the nonlinear interactions among sensors captured by the ensemble methods, especially when such interactions are difficult to comprehend. This does not imply that the concept of adaptive learning is now obsolete; rather, plan adaptation should be correspondingly complex and empirically tested to determine how often it should be updated before assuming it is beneficial. These concepts have not been clearly addressed in the field of PdM adaptation. The lifecycle research confirms that lifecycle-aware maintenance is consistent with the work done so far by Marchand, Laval [22], who introduced a framework that includes quantification of drift severity but did not cover reliability mapping or define retraining points based on the multiple operational phases of discrete operation. What can be observed from the FD003 trajectory is that the model recovers (W9: 77.92%) but collapses again (W10: 48.29%) before point-in-time monitoring can serve as a single-checkpoint validation, which is commonly used in the previous literature for making safety-critical deployment decisions. The results show that the core design principle of DARAF is that drift severity, performance cost, architectural resilience, and lifecycle position are interrelated criteria that cannot be evaluated independently but must be evaluated as a bundle, as reflected in the literature.
5.1. Limitations
The limitations of this study suggest several avenues for future research. The standardized and simplified adaptive variants presented here are approximations of more sophisticated online learning approaches. In particular, Online SGD replicates the behavior that would be expected from a truly online LSTM-based learner. The window-based retraining approach is only one of many possible adaptive strategies. Therefore, the negative drift/rate of introduction finding should not be taken as indicative of deeper adaptive architectures. The temporal split, which has been validated in practice, is an empirical method for producing naturally occurring drift. However, it allows only a single drift event to occur throughout the equipment lifecycle. A real-world application of the equipment may experience drift many times, in recurrent, seasonal, and/or sudden manners. These were not captured by one of the two equally divided groups. The thresholds associated with the RLM phase were established for operational purposes, not by a heuristic means, and were not optimized against a labelled dataset of retraining outcomes. Finally, the DARAF evaluation was conducted only on CMAPSS, an aerospace benchmark, limiting the generalizability of these findings across the broader industrial domain.
5.2. Industrial Implications
The findings of this study have significant implications for deploying and managing predictive maintenance systems in industrial environments. In current industry practice, a model that performs well during development is assumed to be reliable after deployment. However, even if these changes are not detected by regular monitoring methods, they can result in considerable performance losses for a system. This implies that predictive maintenance must be considered a continuous reliability management process.
DARAF methodology provides a structured approach to managing models through their life cycles. For practitioners, the distributional shift index (DSI) can be used to minimize distributional drift within a specific sensor channel. It assists them in exploring and formulating maintenance plans. The performance degradation ratio (PDR) converts the statistical drift to performance degradation. With this measure, an organization can establish a retraining policy based on facts rather than opinion.
Another example of industrial research demonstrating that adaptive refinements cannot improve reliability is known as the Drift Resilience Index (DRI). The DRI values for all datasets considered were negative, indicating that automated retraining pipelines need to be validated before use. Finally, the Reliability Lifecycle Model (RLM) outlines how to determine when monitoring, interventions, and retraining triggers should be implemented. These capabilities enable the implementation of reliability-focused MLOps, particularly in sectors such as aerospace, manufacturing, transportation, and energy, where model failures can have significant safety, financial, and operational impacts.
5.3. Future Research Directions
The DARAF framework could be used to assess the reliability of predictive maintenance under drift. As such, research on DARAF is necessary before it can be used across industries globally, beyond the NASA CMAPSS benchmarking study. For example, it would help us see how applicable DARAF is to various operational environments, including the manufacturing, energy, transportation, and process industries.
Moreover, the adaptive strategies for adapting the model were rudimentary. Exploring new algorithms for adaptive strategies will provide insight into how these approaches affect the long-term reliability and success of water supplies. By assessing adaptive strategy execution using Darwinian Adaptation Principles (solid mechanistic theories that are proximal to Darwin's adaptations), future studies will be able to provide meaningful assessment tools for organizations seeking to make a sound investment in the long–term viability of their water supply resources as reliable water sources.
An alternative approach to extending drift analysis from sensors to the whole system is to adopt multivariate drift metrics to measure interactions among all the sensors in a complex industrial system. In future releases of DARAF, interactions in drift will be better measured with further analysis and will most likely include XAI to help interpret drift-related decisions and retrain models.
Lastly, extensive research is required to identify thresholds in our Reliability Lifecycle Model based on historical maintenance data and operational outcomes. Using data to set lifecycle boundaries, establish reliability standards by industry and train based on accuracy. This would result in a rigorous Decision Support System for managing predictive maintenance models throughout their entire lifetime in DARAF.
6. Conclusion
A new framework, referred to as the Drift-Aware Reliability Assessment Framework (DARAF), has been proposed to measure the reliability of predictive maintenance models across different industry cases. While drift detection and adaptation have been a focus of earlier works, DARAF uses an integrated approach to evaluating the reliability of the model from the beginning of the operational model life cycle to the end. The framework comprises four dimensions: Drift Severity Index (DSI), Performance Degradation Rate (PDR), Drift Resilience Index (DRI), and Reliability Lifecycle Model (RLM).
Empirical studies using the NASA CMAPSS benchmark have shown that Degradation is a congeneric feature of applied predictive maintenance models. The results demonstrate that high validation accuracy does not guarantee high operational accuracy, despite a negative effect on predictive accuracy across all data sets and architectures. In addition, the drift effect is sometimes overlooked relative to the actual variation during operation, so studying the sensor level is needed to distinguish the drift effect from the operating variance. Also, the negative DRI results across all adaptive configurations raise doubts about the positive role that continuous adaptation always plays in increasing the model's robustness; this means it is important to study adaptation strategies first in real environments.
The main value of the work is to move the reliability of predictive maintenance from the assumed property to an operational parameter that can be measured and monitored over time. DARAF's ability to connect the severity of the drift, the Degradation in performance, resilience, and the advancement of the lifecycle puts the work of researchers and practitioners on a common footing, offering actionable insights for developing and governing a reliability-based model. Future work should involve further expansion of the framework to other industrial sectors, exploring more sophisticated adaptive learning architectures, and tuning the lifecycle thresholds based on real-world maintenance results. This would further enhance the performance of predictive maintenance systems in non-stationary, dynamic industrial environments.
Acknowledgements
None.
Funding
This research received no external funding.
Declaration of Competing Interest
The authors declare no conflict of interest.
Data Availability Statement
The NASA CMAPSS dataset used in this study is publicly available. Additional materials supporting the findings of this work are available from the author upon reasonable request.
Abbreviations
The following abbreviations are used in this manuscript:
| DARAF | Drift-Aware Reliability Assessment Framework |
| DSI | Drift Severity Index/Distributional Shift Index |
| PDR | Performance Degradation Rate |
| DRI | Drift Resilience Index |
| RLM | Reliability Lifecycle Model |
| XAI | eXplainable Artificial Intelligence |
References
- Jhaveri, R.H.; Revathi, A.; Ramana, K.; Raut, R.; Dhanaraj, R.K. A review on machine learning strategies for real-world engineering applications. Mob. Inf. Syst. 2022, 2022(1), 1833507. [Google Scholar] [CrossRef]
- Fordal, J.M.; et al. Application of sensor data based predictive maintenance and artificial neural networks to enable Industry 4.0. Adv. Manuf. 2023, 11(2), 248–263. [Google Scholar] [CrossRef]
- Zhang, W.; Yang, D.; Wang, H. Data-driven methods for predictive maintenance of industrial equipment: A survey. IEEE Syst. J. 2019, 13(3), 2213–2227. [Google Scholar] [CrossRef]
- Merkt, O. On the use of predictive models for improving the quality of industrial maintenance: An analytical literature review of maintenance strategies. In 2019 Federated Conference on Computer Science and Information Systems (FedCSIS); IEEE, 2019. [Google Scholar] [CrossRef]
- Corbin, C.K.; et al. , DEPLOYR: a technical framework for deploying custom real-time machine learning models into the electronic medical record. J. Am. Med. Inform. Assoc. 2023, 30(9), 1532–1542. [Google Scholar] [CrossRef] [PubMed]
- Khamassi, I.; Sayed-Mouchaweh, M.; Hammami, M.; Ghédira, K. Discussion and review on evolving data streams and concept drift adapting. Evol. Syst. 2018, 9(1), 1–23. [Google Scholar] [CrossRef]
- Kothamasu, R.; Huang, S.H.; VerDuin, W.H. System health monitoring and prognostics—a review of current paradigms and practices. Int. J. Adv. Manuf. Technol. 2006, 28(9), 1012–1024. [Google Scholar] [CrossRef]
- Patchipala, S. Tackling data and model drift in AI: Strategies for maintaining accuracy during ML model inference. Int. J. Sci. Res. Arch. 2023, 10(2), 1198–1209. [Google Scholar] [CrossRef]
- Mannapur, S.B. Understanding data drift and concept drift in machine learning systems. Int. J. Sci. Res. Comput. Sci. Eng. Inf. Technol. 2025, 11(1), 318–330. [Google Scholar] [CrossRef]
- Bitam, T.; et al. Artificial intelligence of things for next-generation predictive maintenance. Sensors 2025, 25(24), 7636. [Google Scholar] [CrossRef] [PubMed]
- Ginting, P.; Mangngi, F.; Rita, P.; Sayonara, R.G.G.; Lesmana, I. Application of Internet of Things (IoT) Technology in Predictive Maintenance of Industrial Machines to Improve Operational Reliability. Int. J. Technol. Energy 2025. 1, 2, 42–52. [Google Scholar] [CrossRef]
- Kang, Z.; C. Catal, B. Tekinerdogan, Remaining useful life (RUL) prediction of equipment in production lines using artificial neural networks. Sensors 2021, 21(3), 932. [Google Scholar] [CrossRef] [PubMed]
- Lorenti, L.; et al. Predictive maintenance in the industry: A comparative study on deep learning-based remaining useful life estimation. In 2023 ieee 21st international conference on industrial informatics (indin); IEEE, 2023. [Google Scholar] [CrossRef]
- Al-Refaie, A.; Al-Atrash, M.; Lepkova, N. Prediction of the remaining useful life of a milling machine using machine learning. MethodsX 2025, 14, 103195. [Google Scholar] [CrossRef] [PubMed]
- Saeed, A.; et al. , Deep learning based approaches for intelligent industrial machinery health management and fault diagnosis in resource-constrained environments. Sci. Rep. 2025, 15(1), 1114. [Google Scholar] [CrossRef] [PubMed]
- Lu, J.; et al. , Learning under concept drift: A review. IEEE Trans. Knowl. Data Eng. 2018, 31(12), 2346–2363. [Google Scholar] [CrossRef]
- Han, M.; Meng, F.; Li, C. Variance Feedback Drift Detection Method for Evolving Data Streams Mining. Appl. Sci. 2024, 14(16), 7157. [Google Scholar] [CrossRef]
- Bayram, F.; Ahmed, B.S.; Kassler, A. From concept drift to model degradation: An overview on performance-aware drift detectors. Knowl.-Based Syst. 2022, 245, 108632. [Google Scholar] [CrossRef]
- Gama, J.; Žliobaitė, I.; Bifet, A.; Pechenizkiy, M.; Bouchachia, A. A survey on concept drift adaptation. ACM Comput. Surv. (CSUR) 2014, 46(4), 1–37. [Google Scholar] [CrossRef] [PubMed]
- Ancy, S.; Paulraj, D. Online learning model for handling different concept drifts using diverse ensemble classifiers on evolving data streams. Cybern. Syst. 2019, 50(7), 579–608. [Google Scholar] [CrossRef]
- Gözüaçık, Ö.; Can, F. Concept learning using one-class classifiers for implicit drift detection in evolving data streams. Artif. Intell. Rev. 2021, 54(5), 3725. [Google Scholar] [CrossRef]
- Marchand, J.; Laval, J.; Sekhari, A.; Cheutet, V.; Danielou, J.-B. End-to-end lifecycle machine learning framework for predictive maintenance of critical equipment. Enterp. Inf. Syst. 2025, 19(1-2), 2448008. [Google Scholar] [CrossRef]
- Balasubramanian, A. End-to-end model lifecycle management: An MLOps framework for drift detection, root cause analysis, and continuous retraining. Int. J. Multidiscip. Res. Growth Eval. 2020. 1, 1, 92–102. [Google Scholar] [CrossRef]
- Yang, L.; Rossi, D. Quality monitoring and assessment of deployed deep learning models for network AIOps. IEEE Netw. 2022, 35(6), 84–90. [Google Scholar] [CrossRef]
- Teubert, C. DNG Legacy Data; NASA, 2025; Available online: https://data.nasa.gov/api/views/ff5v-kuh6(v1.1) [Online].
Figure 1.
Per-sensor Drift Severity Index (KS-statistic) across the four NASA CMAPSS sub-datasets, comparing early-phase and late-phase sensor distributions. Bars highlighted in red indicate sensors with statistically significant drift (p < 0.05); the dashed reference line denotes the significance threshold.
Figure 1.
Per-sensor Drift Severity Index (KS-statistic) across the four NASA CMAPSS sub-datasets, comparing early-phase and late-phase sensor distributions. Bars highlighted in red indicate sensors with statistically significant drift (p < 0.05); the dashed reference line denotes the significance threshold.
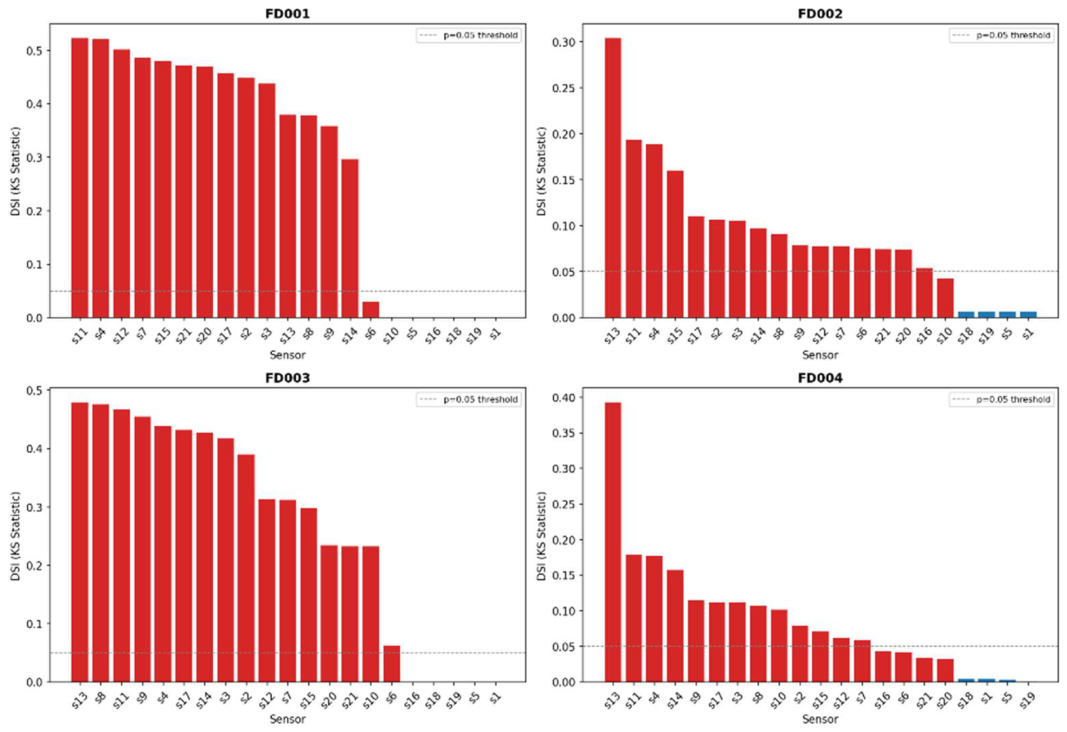
Figure 2.
Comparison of F1 scores between the training partition and the test partition for Random Forest and XGBoost across all four sub-datasets, with the corresponding Performance Degradation Rate (PDR) annotated above each test-phase bar.
Figure 2.
Comparison of F1 scores between the training partition and the test partition for Random Forest and XGBoost across all four sub-datasets, with the corresponding Performance Degradation Rate (PDR) annotated above each test-phase bar.
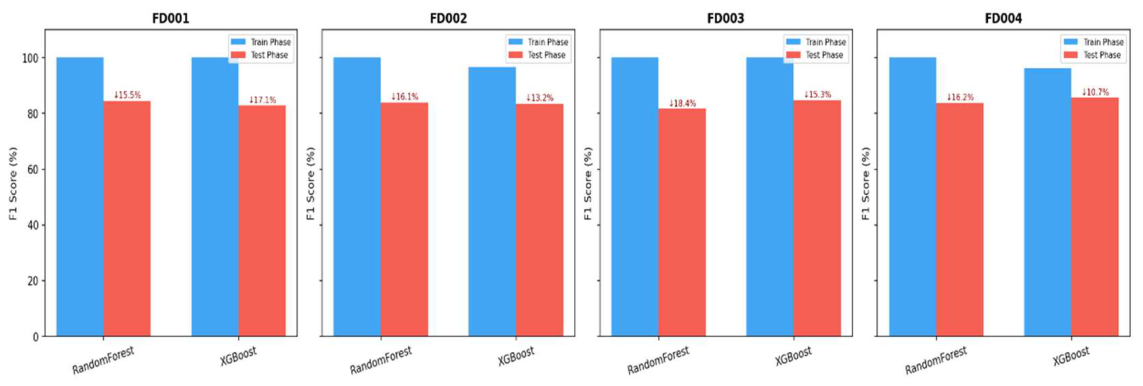
Figure 3.
Comparative F1 scores of non-adaptive (Random Forest, XGBoost) and adaptive (Incremental RF, Adaptive XGBoost, Online SGD) model variants on the test partition across the four sub-datasets, separated by a reference line distinguishing non-adaptive and adaptive groups.
Figure 3.
Comparative F1 scores of non-adaptive (Random Forest, XGBoost) and adaptive (Incremental RF, Adaptive XGBoost, Online SGD) model variants on the test partition across the four sub-datasets, separated by a reference line distinguishing non-adaptive and adaptive groups.
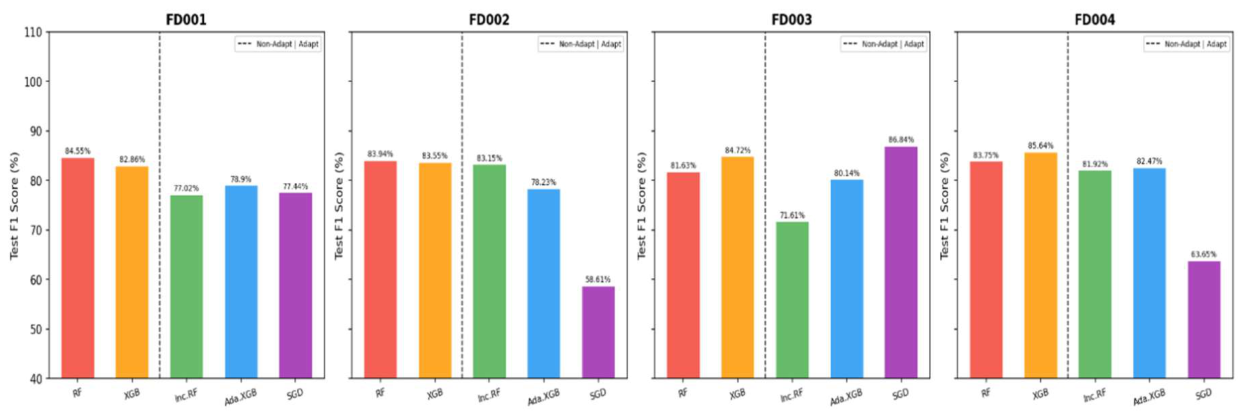
Figure 4.
Reliability Lifecycle Model curves showing F1 score progression across ten chronological evaluation windows for each sub-dataset, color-coded by lifecycle phase (Stable, Drift Onset, Degradation, Failure/Retraining) against the corresponding failure rate trend.
Figure 4.
Reliability Lifecycle Model curves showing F1 score progression across ten chronological evaluation windows for each sub-dataset, color-coded by lifecycle phase (Stable, Drift Onset, Degradation, Failure/Retraining) against the corresponding failure rate trend.
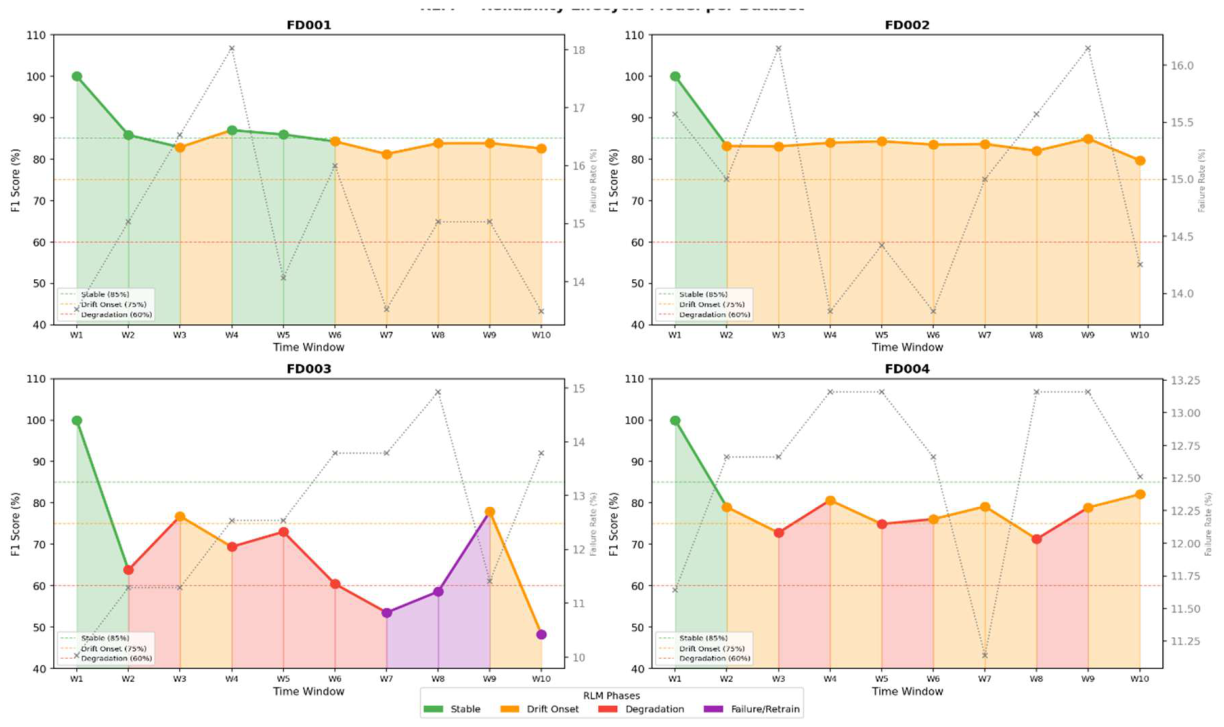
Table 1.
DARAF Workflow Summary.
| Stage | Component | Input | Output |
| 1 | DSI | Sensor distributions reference vs evaluation | Sensor drift profile, aggregate severity score |
| 2 | PDR | Model F1 training vs test partition | Performance drop in percentage points |
| 3 | DRI | Adaptive vs non-adaptive test F1 | Resilience score per architecture |
| 4 | RLM | Window-wise chronological F1 scores | Lifecycle curve, retraining trigger point |
Table 2.
RLM Phase Definitions.
| Phase | F1 Threshold | Recommended Action |
| Stable | ≥ 85% | Continue deployment, routine monitoring |
| Drift Onset | 75% — 84.9% | Increase monitoring frequency |
| Degradation | 60% — 74.9% | Initiate retraining preparation |
| Failure/Retraining | < 60% | Trigger immediate retraining |
Table 3.
NASA CMAPSS Sub-Dataset Characteristics.
| Sub-Dataset | Training Rows | Engines | Operating Conditions | Fault Modes | Max Cycles | Mean Cycles |
| FD001 | 20,631 | 100 | 1 | 1 | 362 | 206.3 |
| FD002 | 53,759 | 260 | 6 | 1 | 378 | 206.8 |
| FD003 | 24,720 | 100 | 1 | 2 | 525 | 247.2 |
| FD004 | 61,249 | 248 | 6 | 2 | 543 | 246.0 |
Table 4.
Experimental Model Configurations.
| Model | Type | Adaptation Strategy | Imbalance Handling |
| Random Forest | Non-adaptive | None | Balanced class weighting |
| XGBoost | Non-adaptive | None | Scale positive weight = 5 |
| Incremental RF | Adaptive | Sliding window retraining | Balanced class weighting |
| Adaptive XGBoost | Adaptive | Warm-start sequential chunks | Dynamic scale positive weight |
| Online SGD | Adaptive | Partial-fit incremental learning | Manual sample weight computation |
Table 5.
Drift Severity Index Results by Sub-Dataset.
| Sub-Dataset | Sensors Drifted (21) | Mean DSI | Drift Level | Top Drifting Sensors |
| FD001 | 15 | 0.2971 | Medium | s11, s4, s12 |
| FD002 | 17 | 0.0923 | Low | s13, s11, s4 |
| FD003 | 16 | 0.2697 | Medium | s13, s8, s11 |
| FD004 | 17 | 0.0896 | Low | s13, s11, s4 |
Disclaimer/Publisher’s Note: The statements, opinions and data contained in all publications are solely those of the individual author(s) and contributor(s) and not of MDPI and/or the editor(s). MDPI and/or the editor(s) disclaim responsibility for any injury to people or property resulting from any ideas, methods, instructions or products referred to in the content. |
© 2026 by the authors. Licensee MDPI, Basel, Switzerland. This article is an open access article distributed under the terms and conditions of the Creative Commons Attribution (CC BY) license (http://creativecommons.org/licenses/by/4.0/).
Copyright: This open access article is published under a Creative Commons CC BY 4.0 license, which permit the free download, distribution, and reuse, provided that the author and preprint are cited in any reuse.