
Submitted:
16 November 2026
Posted:
18 November 2026
You are already at the latest version
Abstract
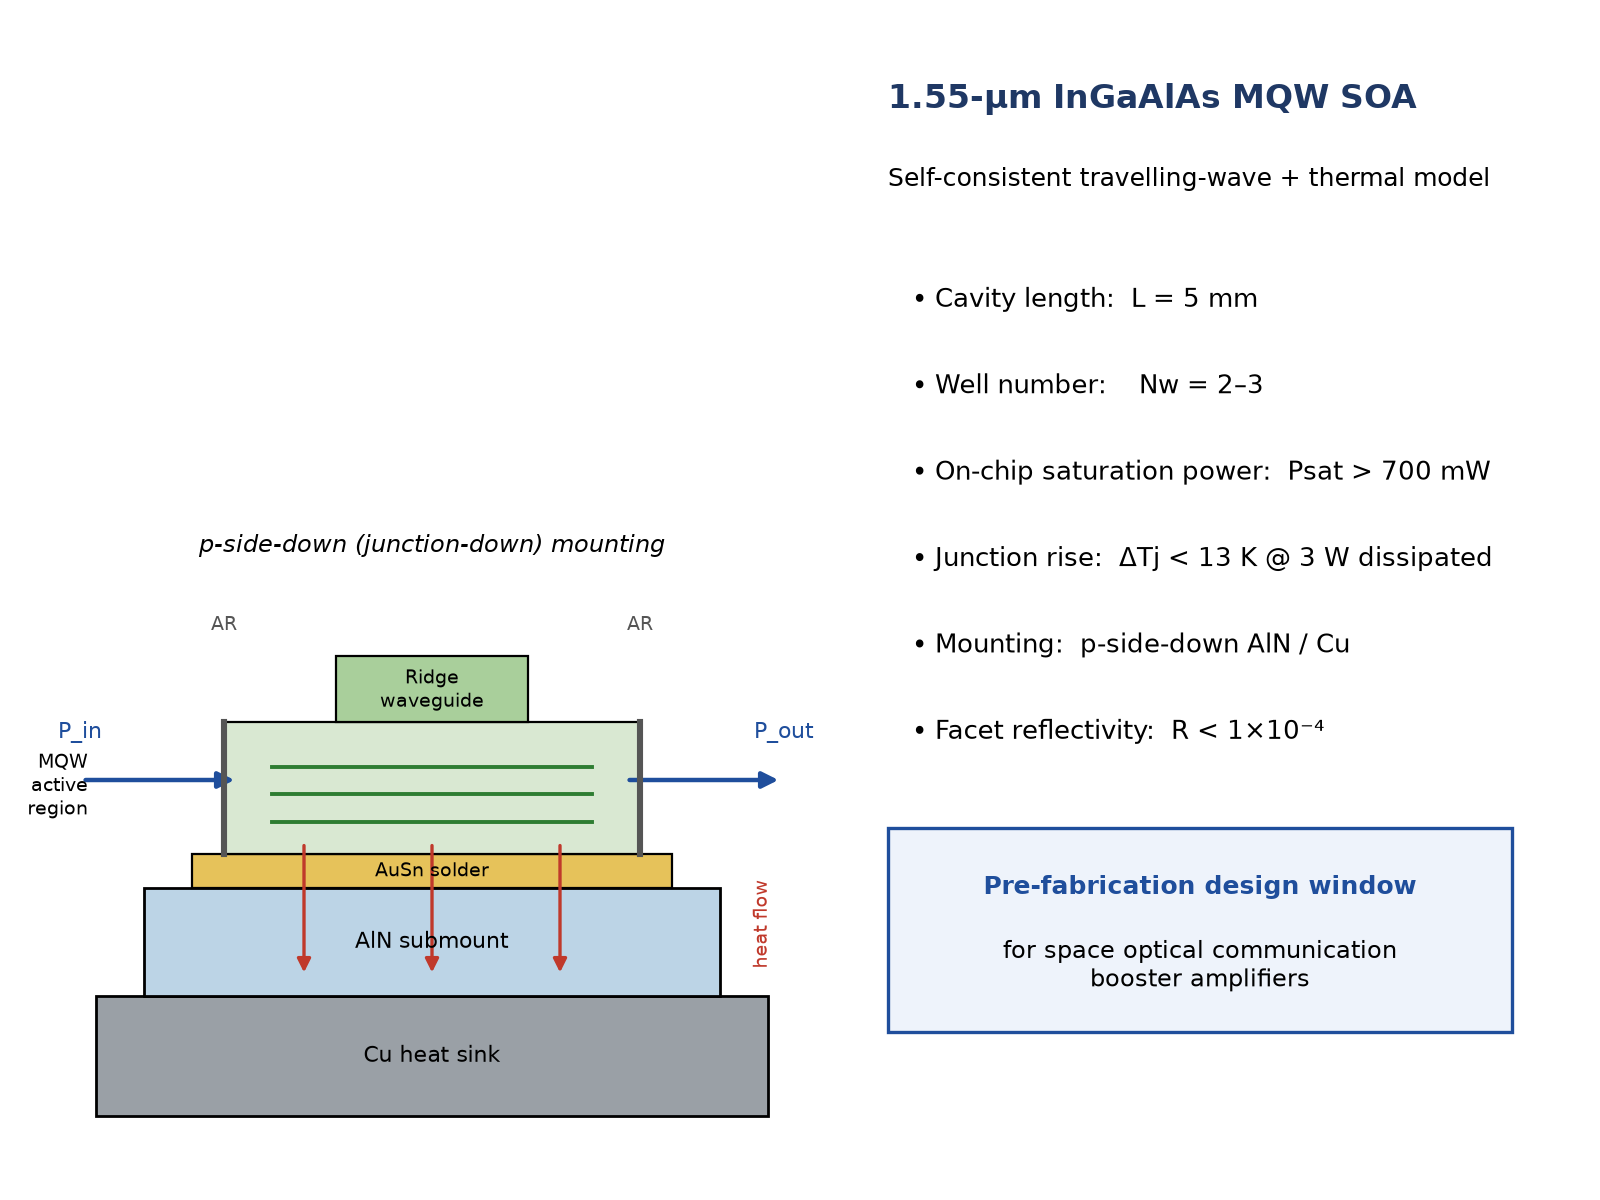
Free-space optical communication (FSOC) links are constrained by stringent power budgets, which high-power booster semiconductor optical amplifiers (SOAs) can relax directly. This study presents a systematic pre-fabrication theoretical design of 1.55-μm InGaAlAs multiple-quantum-well (MQW) SOAs with ultra-high saturation output power. A self-consistent travelling-wave model solves the carrier rate equation, the interband gain, the longitudinal power propagation and a lumped thermal network simultaneously, treating gain saturation and thermal roll-over on the same footing. The model is verified by mesh-convergence and energy-balance tests and by comparison with published transparency carrier density, differential gain and thermal-resistance values. The influences of well thickness (5.2–7.0 nm), well number (2–6) and cavity length (1–5 mm) on the saturation output power are then investigated. The well number and cavity length, rather than the well thickness, dominate the power performance: for a 5-mm cavity with 2–3 wells, an on-chip saturation output power above 700 mW is predicted, with the junction temperature rise kept below 13 K at 3 W dissipated power by p-side-down AlN/Cu mounting. Design guidelines and a benchmark against reported high-power 1.55-μm amplifiers are provided, supplying a quantitative parameter window for high-saturation-power SOAs dedicated to space optical communication; experimental verification is ongoing.
Keywords:
semiconductor optical amplifier (SOA)
; 1.55-μm band
; saturation output power
; InGaAlAs quantum well
; space optical communication
; travelling-wave model
; thermal management
1. Introduction
Free-space optical communication (FSOC) has become a key technology for next-generation space information networks, owing to its large bandwidth, license-free spectrum, high immunity to electromagnetic interference and the compact, low-mass terminals that it enables [1,2]. With the deployment of low-Earth-orbit constellations, inter-satellite links and deep-space probes, both the required link distance and the required throughput keep increasing, and the power budget of the optical terminal becomes the dominant constraint on link availability [2]. In a typical link the received power is proportional to the launched optical power, so that every 3 dB of additional transmitter power roughly doubles the attainable link margin or, equivalently, extends the reachable distance. High-power booster amplifiers are therefore a direct and cost-effective way of relaxing the power budget, and high-power semiconductor amplifiers specifically developed for free-space links have already been reported [3]. The 1.55-μm band is favoured for such systems because it coincides with the low-loss window of silica fibre, allows the use of mature InP-based sources, amplifiers and modulators, and suffers comparatively low atmospheric attenuation, so that high-power 1.55-μm amplifiers have attracted sustained attention [4].
Semiconductor optical amplifiers (SOAs) are attractive booster and pre-amplifier candidates for FSOC terminals because of their small footprint, low power consumption, broad gain bandwidth and monolithic integrability with laser sources and electro-absorption modulators [4]. Their use as high-power boosters has however been limited by two factors: gain saturation, which caps the output power at a few tens to a few hundreds of milliwatts in the 1.55-μm band, and thermal roll-over, which reduces the available gain as the junction temperature rises under high-current operation [5]. Impressive progress has nevertheless been reported. Morito et al. obtained a +17 dBm fibre-coupled saturation output power by using a very thin tensile-strained bulk active layer together with spot-size converters [6]; a +20 dBm module with a noise figure of 6.0 dB was then demonstrated with an MQW active region [7], and broad-band MQW amplifiers combining a high saturation power with a low noise figure were subsequently developed [8]. Along a different route, Juodawlkis et al. reached 0.8 W of output power with a packaged 1.5-μm amplifier based on a low-confinement slab-coupled optical waveguide [9], and multi-channel amplifiers covering 1540–1620 nm have been commercialised for coarse wavelength-division multiplexing [10]. These results indicate that the saturation power of an SOA is ultimately set by the active-region volume, the optical confinement factor and the efficiency with which heat is removed from the chip.
Although a number of high-power SOA structures have been reported, most of them rely on a specific epitaxial design or on proprietary low-confinement waveguides, and a systematic, physically transparent design study that links the quantum-well (QW) parameters and the cavity length to both the saturation power and the junction temperature of an InGaAlAs MQW amplifier is still lacking. This work addresses that gap. The main contributions are: (i) a self-consistent travelling-wave model in which the carrier rate equation, the interband gain, the longitudinal power propagation and a lumped thermal network are solved together; (ii) a numerical verification of the model, comprising mesh-convergence and energy-balance tests plus a comparison of the predicted material and thermal parameters with published values [5,6],[11]; (iii) a systematic study of the influence of the well thickness (5.2–7.0 nm), the well number (2–6) and the cavity length (1–5 mm) on the saturation output power; and (iv) explicit design guidelines and a benchmark against the state of the art. It should be emphasized from the outset that the aim of this work is not to report a fabricated device, but to provide, for high-saturation-power SOAs dedicated to space optical communication, a pre-fabrication theoretical design and a quantitative set of parameter guidelines. The well thickness, the well number, the cavity length, the facet coating, the mounting scheme and the recommended operating point predicted in Section III constitute the theoretical basis on which the subsequent epitaxial growth, device fabrication and measurement can be planned, and the verified model itself is intended to serve as a design tool for such structures.
2. Materials and Methods
2.1. Device Structure and Thermal Architecture
The device considered here is an InGaAlAs separate-confinement-heterostructure (SCH) MQW amplifier emitting at 1.55 μm. The active region consists of 2–6 nominally undoped InGaAlAs quantum wells separated by 10-nm InGaAlAs barriers and embedded between InGaAlAs/InP SCH layers; the emission wavelength is set to 1.55 μm by adjusting the well composition and thickness. A 3-μm-wide ridge waveguide provides transverse single-mode operation up to the output power of interest, and both facets are coated with anti-reflection (AR) coatings whose residual reflectivity is kept below 1×10⁻⁴, so that the device behaves as a travelling-wave amplifier with negligible Fabry–Pérot ripple. The chip is mounted p-side-down (junction-down) on an AlN ceramic submount which is in turn attached to a copper heat sink, as illustrated in Figure 1. Junction-down mounting is essential for high-power operation because it removes the 100-μm InP substrate from the dominant part of the heat path, an approach that has long been used for high-power InP emitters [8]. Table 1 lists the nominal structural, material and thermal parameters used throughout this paper.
2.2. Travelling-Wave Rate-Equation Model
The cavity is divided into Nz sections of length Δz = L/Nz. In each section the carrier density is obtained from the steady-state rate equation, Eq. (1), in which the injection, the non-radiative and radiative recombination and the stimulated recombination are balanced:
Here J is the current density, q the elementary charge, dw the well thickness, Nw the number of wells, n the carrier density in a well, Anr, B and C the Shockley–Read–Hall, radiative and Auger coefficients, Γw the optical confinement factor of a single well, g(n,T) the material gain and Nph the photon density. The first three terms on the right-hand side are the non-radiative, the spontaneous radiative and the non-radiative Auger recombination, respectively, whereas the last term accounts for stimulated amplification. The optical power is propagated section by section according to Eq. (2),
where Γtot = NwΓw is the total confinement factor, αi the internal loss and Fsat the gain-compression factor. For a travelling-wave amplifier the latter is conveniently written as Eq. (3):
The saturation power Psat that appears in Eq. (3) is the intrinsic saturation power of a single quantum well, Eq. (4):
with a0 = dg/dn the differential gain and τs = (Anr + 2Bn + 3Cn2)-1 the differential carrier lifetime. Equation (4) is the key to the interpretation of the results of Section III. The saturation power is inversely proportional to the confinement factor of one well and to the differential gain, but it does not depend explicitly on Nw: adding wells increases Γtot and the modal gain in the same proportion, so that the intrinsic saturation power is essentially unchanged. The number of wells therefore acts mainly through the gain reserve and through the additional heat that has to be removed, which is precisely the trade-off discussed in Section III-B.
Thermal effects enter the model through the temperature dependence of the material gain, Eq. (5):
with T0 = 293 K. Finally, the output power is obtained by integrating Eq. (2) along the cavity, Eq. (6), the single-pass gain being G = Pout/Pin:
g(n,T) = g(n,T0)[1 − kT(T − T0)]
2.3. Interband Gain Model
The material gain is calculated from the interband transition model of Chuang [11], using the strain-dependent band structure and the k·p description of the valence subbands recommended for InGaAlAs [12]. The gain spectrum is given by Eq. (7):
where C0 is a constant containing the dipole matrix element and the refractive index, Mb the bulk momentum matrix element, Ihmen the overlap integral between the n-th conduction and the m-th valence subband, ρr the reduced two-dimensional density of states of the well, μ(Et) = fcn(Et) − fvm(Et) the difference of the Fermi–Dirac occupation probabilities, Een and Ehm the confined subband energies, Eg the strained band gap and τ the intraband relaxation time. The fraction in Eq. (7) is the Lorentzian line-shape function of half-width τ/2 centred at the transition energy Eg + Een + Ehm, so that the gain peaks when the photon energy ħω matches that transition; the term [fcn − fvm] accounts for the inversion condition and makes the gain negative below transparency. The material parameters (effective masses, lattice constants, hydrostatic and shear deformation potentials, band offsets and bowing parameters) are obtained by linear interpolation between the constituting binary compounds, following the scheme of [12]; the interpolation of the band gap includes the bowing terms, and the strain-induced shifts are evaluated with the deformation potentials interpolated in the same way.
2.4. Thermal Model
The electrical power that is not converted into optical power is dissipated as heat in the active region and flows vertically through the substrate, the solder and the submount into the heat sink. The dissipated power is given by Eq. (8),
and the junction temperature by Eq. (9):
Pdiss = I V − Pout + Pin≈I V − Pout
Tj = Ths + Rth Pdiss
The thermal resistance Rth of the layer stack is evaluated with the one-dimensional approximation including 45° heat spreading, Eq. (10):
where ti and ki are the thickness and the thermal conductivity of the i-th layer and Weff,i its effective spreading width. Table 2 lists the layer stack and the resulting contributions: the InP substrate alone accounts for about 47 % of the total thermal resistance at L = 5 mm, which explains why junction-down mounting on a high-conductivity AlN submount is mandatory for high-power operation [13]. Because Rth is inversely proportional to the cavity length, a long cavity is thermally advantageous: Rth falls from 21.4 K/W at L = 1 mm to 4.3 K/W at L = 5 mm, i.e. a fivefold reduction of the temperature rise at the same dissipated power. This is the physical reason why long-cavity, few-well designs are preferred for high-power operation.
2.5. Numerical Implementation and Verification
The coupled system is solved by a fixed-point (shooting) iteration: for a given injection current the thermal equation is updated from the power distribution of the previous iteration, the carrier density is then found section by section with a Newton iteration, and Eq. (2) is integrated with the discretisation of Eq. (11):
The iteration is stopped when the relative change of Pout between two successive passes falls below 1×10⁻⁴; the propagation scheme follows the steady-state formulation of [14]. Figure 2(a) shows the relative deviation of the calculated output power as a function of the number of sections Nz: the deviation decreases monotonically and falls below 0.5 % for Nz = 100, which is the value used throughout this work. Three further checks were carried out. First, the power balance was verified, i.e. the sum of the output power, the dissipated heat and the spontaneous emission was found to reproduce the injected electrical power to better than 0.5 %. Second, the transparency carrier density and the differential gain obtained from Eq. (7) for a 5.2-nm well fall in the ranges 1.3–2×1018 cm-3 and 4–6×10-16 cm2, respectively, i.e. within the values reported for 1.55-μm InGaAlAs quantum wells [15]. Third, Figure 2(b) compares the temperature rise obtained from the lumped model of Eq. (9) with the layer-by-layer solution of Eq. (10); the two agree to within 5 % over the whole operating range, the residual difference being due to the non-linear temperature dependence of the thermal conductivity, which is neglected in the lumped model. The thermal resistance itself is consistent with the values measured for junction-down mounted InP devices of comparable geometry [8].
3. Results
3.1. Material Gain Versus Well Thickness
The QW thickness influences the material gain through the confinement of the carrier states and the change of the two-dimensional density of states. Figure 3 compares the calculated material gain of a 5.2-nm and a 7.0-nm InGaAlAs well at 1.55 μm. Three features are relevant for amplifier design. (i) Differential gain: the thinner well exhibits a steeper g–n slope, i.e. a larger differential gain a0 = dg/dn, which raises the gain per unit length and, through Eq. (4), the saturation power. (ii) Transparency: the thinner well needs a higher carrier density to reach g = 0, because the stronger confinement pushes the subband edges up and reduces the density of states per unit volume; the transparency current therefore increases. (iii) Gain at high injection: at a given carrier density above transparency the thinner well retains the larger gain, so that the gain per well is higher despite the smaller active volume. The crossing of the two curves near transparency is a direct consequence of (ii) and (iii). This figure therefore demonstrates that the well thickness is a genuine design parameter for the differential gain, and it motivates the structural optimisation of Sections III-B and III-C.
3.2. Effect of the Number of Quantum Wells
Figure 4 shows the calculated output power versus injection current for well numbers from 1 to 5, at a cavity length of 4 mm and for the two well thicknesses. Several conclusions can be drawn. First, a single well is clearly insufficient: the modal gain is too small to reach the required output power, and the device saturates at about 375 mW even at 2 A. Second, for two or more wells the curves bunch together: at 2 A the output power is 480–500 mW, and the spread between Nw = 2 and Nw = 5 is smaller than 5 %. This behaviour is a direct consequence of Eq. (4): since Γtot and the active volume scale together, adding wells increases the available gain but leaves the intrinsic saturation power essentially unchanged, so that the output power becomes limited by the thermal load rather than by the gain. Third, at the highest currents the curves with 4 and 5 wells bend over earlier, because the larger total active thickness increases the Auger recombination (the Cn3 term of Eq. (1)) and the dissipated heat. For a target of 400–500 mW the optimum therefore lies at 2–4 wells, and it shifts towards the lower bound, 2–3 wells, as the target power and the thermal load increase. This is consistent with the qualitative statement often made in the literature that for high-power, long-cavity amplifiers a small number of wells is preferred [5].
Comparing Figure 4(a) and Figure 4(b) shows that the well thickness has almost no influence on the power performance in the 5.2–7.0 nm range: the curves almost coincide, and the maximum difference is below 3 %. The well thickness modifies the differential gain and the transparency current (Figure 3) but not the power capability, which is governed by Nw and by the thermal resistance. This is an important practical result, because it means that the well thickness can be optimised for other targets, such as the gain bandwidth or the polarisation dependence, without compromising the saturation power.
3.3. Effect of Cavity Length
Figure 5(a)–(d) presents the output power versus injection current for cavity lengths from 3.0 to 5.0 mm, for two and three wells and for the two well thicknesses. Three observations follow. (i) The output power increases monotonically with the cavity length. Two mechanisms contribute: the reduction of Rth (Table 2 and Figure 2(b)) lowers the junction temperature and, through Eq. (5), preserves the material gain and hence the available output power; in addition, a longer cavity provides more gain, so that the amplifier can be driven further into saturation before the gain is exhausted. (ii) Thermal roll-over sets in earlier for short cavities. For the 2-well, 5.2-nm device the 3-mm cavity peaks at about 565 mW near 3 A and then decreases, whereas the 5-mm cavity still delivers 735 mW at 4 A without roll-over; the intermediate lengths of 3.5, 4.0 and 4.5 mm roll over at progressively higher currents, with peak powers of about 600, 680 and 710 mW, respectively. (iii) The four panels show that the optimum is essentially the same for two and three wells and for both well thicknesses: at L = 5 mm the saturation output power exceeds 700 mW in all four cases, which is the design target derived from the power budget of a long-haul space link. The 2-well device is marginally superior at the highest currents, whereas the 3-well device offers a slightly larger small-signal gain, which is preferable when the amplifier also has to compensate the modulator and fibre-to-chip losses. Both variants are therefore retained as recommended designs, and the 5-mm cavity is identified as the optimum compromise between thermal benefit and chip length. Thermal roll-over of this kind is the characteristic signature of high-power amplifiers in which the heat equation is solved together with the gain saturation along the cavity, and it has been reproduced by numerical models of flared and broad-area amplifiers in which the temperature field is treated self-consistently [16].
3.4. Gain Compression and Transfer Characteristic
The transfer characteristic of the amplifier can be described by the gain compression relation of Eq. (12), which follows from the solution of Eq. (2) for a homogeneously saturated gain:
Figure 6 plots the output power normalized to Psat versus the input power for small-signal gains of 20, 25 and 30 dB. Two features are worth noting. First, the curves converge to the same saturation asymptote, irrespective of G0, which confirms that a large Psat rather than a large small-signal gain is the decisive figure of merit for a booster amplifier. Second, the linear regime extends over less than one decade of input power: to keep the gain compression below 1 dB, which is the usual requirement for a communication link in order to avoid pattern-effect penalties [5], the amplifier must be operated with Pout ≤ 0.25 Psat. For the 700-mW design this corresponds to a usable linear output power of about 175 mW, i.e. an order of magnitude above conventional 1.55-μm SOAs and comparable with the best reported modules [7]. This figure also provides the operating point recommended in Table 4. The longitudinal depletion of the carrier density that produces this compression is treated here section by section along Eq. (2); it is equivalent to the transfer-matrix description of the saturated amplifier [17] and to the classical measurements of gain saturation in 1.5-μm travelling-wave amplifiers [18], in which the saturation output power was shown to be set by the active volume, the confinement factor and the residual facet reflectivity rather than by the small-signal gain.
4. Discussion
4.1. Thermal Behaviour and Design Implications
The junction temperature rise is the second constraint on the attainable output power, and it acts as a hard limit because the gain decreases linearly with temperature through Eq. (5). Figure 7 shows the thermal resistance and the corresponding temperature rise versus cavity length at dissipated powers of 2 and 3 W. Below 2 mm the temperature rise exceeds 20 K, and the incremental output power per additional ampere collapses; this is the origin of the roll-over observed in the short-cavity curves of Figure 5. Above 4 mm the curves flatten, so that further lengthening brings only a modest thermal benefit while increasing the chip length, the epitaxial uniformity requirement and the fibre-coupling complexity. A 5-mm cavity, for which Rth = 4.3 K/W and ΔT ≈ 8.6 K at 2 W, therefore represents a good compromise. It should be noted that the thermal resistance used here corresponds to a well-designed junction-down mounting; a conventional p-side-up mounting on a thick InP substrate would increase Rth by a factor of three to four, which would bring the onset of thermal roll-over below 1 A and make the 700-mW target unreachable. Thermal management is thus not a secondary packaging detail but a first-order design constraint for high-power SOAs [9,13]. Self-consistent thermal–optical simulations of broad-area amplifiers, in which a finite-element heat solver is coupled to the beam propagation of the saturated field, lead to the same conclusion: as soon as the dissipated power exceeds a few watts, the temperature field, and not the unsaturated gain, fixes the attainable output [19].
4.2. Benchmark and Design Guidelines
Table 3 compares the predicted performance with representative high-power 1.55-μm amplifiers reported in the literature. The +17 dBm and +20 dBm fibre-coupled saturation powers of [6] and [7] correspond to 50 and 100 mW, respectively, whereas the 0.8-W result of [9] was obtained with a low-confinement slab-coupled waveguide, i.e. at the price of a much larger mode area, a lower gain per unit length and a technology that is not directly compatible with monolithic integration on InP. The present InGaAlAs MQW design, which keeps a conventional ridge waveguide and a single transverse mode, is predicted to reach at least 700 mW, i.e. about 8.5 dB above the best reported MQW module [7] and comparable with the low-confinement approach, while remaining compatible with monolithic integration. It should be stressed that the figure of 700 mW refers to the on-chip saturation output power; the fibre-coupled value will be lower by the coupling loss, typically 1.5–2.5 dB per facet for a ridge waveguide without a spot-size converter, so that a fibre-coupled power of the order of 300–450 mW can be expected. Adding an integrated spot-size converter, as done in [6], is the natural next step to close this gap. The same principle, namely a deliberate reduction of the confinement factor while keeping a single transverse mode, has recently been applied to hybrid III-V-on-silicon amplifiers, which reach 17.5 dBm on chip with 27 dB of small-signal gain [20]; the InGaAlAs MQW ridge considered here reaches a comparable on-chip power without leaving the InP platform.
The design rules that emerge from this study are summarized in Table 4. They apply to InGaAlAs MQW amplifiers operating in the travelling-wave regime at 1.55 μm and can be used directly as the input of an epitaxial and device design cycle. Three of them deserve emphasis. First, the cavity length is the primary lever for the saturation power, because it acts simultaneously on the gain reserve and on the thermal resistance; a length of at least 5 mm should be targeted for output powers above 500 mW. Second, the number of wells should be kept small, 2–3, so that the gain reserve is sufficient without an excessive Auger heat load. Third, the thermal path must be designed at the same time as the optical structure: a junction-down mounting on AlN with a copper heat sink is indispensable, and the residual facet reflectivity must be kept below 1×10⁻⁴ in order to avoid Fabry–Pérot ripple and longitudinal hole burning, which would otherwise reduce the usable saturation power.

Table 4.
Design guidelines derived from this work.
| Design item | Recommended value | Physical reason |
| Cavity length | L ≥ 5 mm | Rth ∝ 1/L; larger gain reserve |
| Well number | Nw = 2–3 | gain reserve vs. Auger heat load |
| Well thickness | dw = 5.2–7.0 nm | high a0; weak influence on Psat |
| Total confinement | Γtot ≈ 0.05–0.075 | single transverse mode |
| Facet coating | R < 1×10⁻⁴ | travelling-wave operation |
| Mounting | p-side-down, AlN + Cu | lowest Rth path |
| Operating point | Pout ≤ 0.25 Psat | gain compression < 1 dB |
4.3. Pre-Fabrication Design Guidance and Scope of the Work
The outcome of this study is a coherent set of design inputs that can be handed directly to an epitaxial and device fabrication team, rather than a single "best" device. Specifically, the following parameters are fixed by the present analysis: (i) the active region, 2–3 InGaAlAs wells of 5.2–7.0 nm separated by 10-nm barriers, the exact composition being chosen so that the 1.55-μm transition is obtained at the target carrier density; (ii) the waveguide, a 3-μm ridge giving a total confinement factor of 0.05–0.075 and single transverse-mode operation up to the design power; (iii) the cavity, 5 mm, which simultaneously maximises the gain reserve and minimises the thermal resistance; (iv) the facets, AR coatings with R < 1×10⁻⁴ so that the travelling-wave regime assumed in the model is realised; (v) the mounting, p-side-down on AlN with a copper heat sink, giving Rth ≈ 4.3 K/W; and (vi) the operating point, Pout ≤ 0.25 Psat, i.e. about 175 mW of linear output power for the 700-mW design. Each of these figures is accompanied in Sections II–III by the physical reasoning and the tolerance analysis behind it, so that the design can be re-optimised if, for example, the available coating reflectivity or submount material differs from the assumptions made here.
The scope of the work should also be stated explicitly. No device has been fabricated within this study: all the power figures reported above are the predictions of the verified model of Section II, and they are quoted as design targets rather than as measured performance. The model itself was checked against mesh convergence, against the power balance and against published material, thermal and device data [5,6,13,14,15], so that the predicted saturation power and temperature rise can be trusted to the accuracy typical of such one-dimensional travelling-wave models, i.e. within a few tens of percent in absolute value and much better in trend. This is precisely the role that the present work is intended to play: to provide, before any wafer is processed, a quantitative theoretical basis and a parameter window for high-saturation-power SOAs aimed at space optical communication, so that the subsequent fabrication and measurement can start from a well-defined design instead of a trial-and-error search. The first experimental verification, together with the extension to integrated spot-size converters, is in progress and will be reported separately.
5. Conclusions
A self-consistent travelling-wave model coupling the carrier rate equation, the interband gain, the longitudinal power propagation and a lumped thermal network has been established and verified for 1.55-μm InGaAlAs MQW semiconductor optical amplifiers intended for space optical communication. On this basis the influence of the well thickness, the well number and the cavity length on the saturation output power has been investigated systematically.
The main findings are as follows. (i) The saturation output power is governed by the well number and the cavity length rather than by the well thickness: in the 5.2–7.0 nm range the thickness changes the differential gain and the transparency current but modifies the power performance by less than 3 %. (ii) The optimum well number for high-power operation is 2–3, a larger number being penalised by Auger recombination and by the additional heat load. (iii) The cavity length is the most effective design lever, because it reduces the thermal resistance in inverse proportion and simultaneously increases the gain reserve: for a 5-mm cavity with 2–3 wells the saturation output power is predicted to exceed 700 mW, and thermal roll-over is postponed beyond 4 A. (iv) The thermal path is a first-order design constraint; with a p-side-down AlN/Cu mounting the junction temperature rise stays below 13 K at 3 W of dissipated power and below 9 K at 2 W, whereas a conventional mounting would make the target unreachable.
The predicted performance provides a quantitative pre-fabrication design basis for high-power 1.55-μm SOAs to be used as booster amplifiers in long-haul free-space laser communication links. In other words, the work provides, for high-saturation-power SOAs dedicated to space optical communication, a pre-fabrication theoretical design and a set of parameter guidelines that constitute the theoretical basis for the subsequent device fabrication, and the design rules of Table 4 can be applied directly to the next epitaxial and device run. Since the present study is based on a verified but still purely theoretical model, the next step is the fabrication of the optimised structure and its experimental characterisation, including the measurement of the fibre-coupled saturation power, of the gain bandwidth and of the noise figure; the extension of the design to integrated spot-size converters and to longer cavities with improved transverse-mode control is also under investigation.
Supplementary Materials
The supporting information can be downloaded at the website of this paper posted on Preprints.org. Figure S1, Sensitivity of the saturation output power to the mounting scheme and thermal resistance (Nw = 2, dw = 5.2 nm, L = 5 mm); Figure S2, Small-signal gain versus injection current for the recommended 2-well and 3-well, 5-mm-cavity designs (dw = 5.2 nm); Table S1, Additional fixed simulation parameters.
Author Contributions
Conceptualization, Jianqun Cheng and Wenyi Zhou; Methodology, Jianqun Cheng, Bocang Qiu and Jehan Alkbar; Validation, Wenyi Zhou and Jehan Akbar; Software, Miao Zhang; Investigation, Qingchun Zhao and Zhihui Yao; Data curation, Lixin Zhang; Writing—original draft preparation, Jianqun Cheng; Writing—review and editing, Wenyi Zhou; Visualization, Bocang Qiu; Supervision, Qingchun Zhao; Project administration, Jianqun Cheng; Funding acquisition, Jianqun Cheng and Wenyi Zhou. All authors have read and agreed to the published version of the manuscript.
Funding
This research was funded by the Fujian Engineering Research Center of IC Laser Chip and Natural Science Foundation of Fujian Province: 2023J011799.
Institutional Review Board Statement
Not applicable.
Informed Consent Statement
Not applicable.
Data Availability Statement
The data presented in this study are available on request from the corresponding author. The authors gratefully acknowledge the Fujian Engineering Research Center of IC Laser Chip, Quanzhou University of Information Engineering, for providing the equipment, simulation software, and administrative support that facilitated this work. The authors have reviewed and edited all generated content, and they take full responsibility for the content of the published version.
Conflicts of Interest
The authors declare no conflicts of interest.
References
- Chan, V.W.S. Free-space optical communications. J. Light. Technol. 2006, 24, 4750–4762. [Google Scholar] [CrossRef]
- Kaushal, H.; Kaddoum, G. Optical communication in space: Challenges and mitigation techniques. IEEE Commun. Surv. Tuts. 2017, 19, 57–96. [Google Scholar] [CrossRef]
- Pham, C.; et al. Modulation of a high-power semiconductor optical amplifier for free-space communications. J. Light. Technol. 2019. [Google Scholar] [CrossRef]
- Tang, H.; et al. A review of high-power semiconductor optical amplifiers in the 1550 nm band. Sensors TBD: verify DOI and full author list.. 2023, 23, 7326. [Google Scholar] [CrossRef]
- Itoh, M.; Shibata, Y.; Kakitsuka, T.; Kadota, Y.; Sugiura, H.; Tohmori, Y. Amplifying characteristics of 1.55-μm polarization-insensitive SOAs with MQW and strained-bulk active layers for device application. J. Light. Technol. TBD: verify issue, pages and DOI.. 2006, 24. [Google Scholar] [CrossRef]
- Morito, K.; Ekawa, M.; Watanabe, T.; Kotaki, Y. High-output-power polarization-insensitive semiconductor optical amplifier. J. Light. Technol. 2003, 21, 176–181. [Google Scholar] [CrossRef]
- Tanaka, S.; Tomabechi, S.; Uetake, A.; Ekawa, M.; Morito, K. Record high saturation output power (+20 dBm) and low NF (6.0 dB) polarization-insensitive MQW-SOA module. Electron. Lett. 2006. [Google Scholar] [CrossRef]
- Morito, K.; Tanaka, S.; Tomabechi, S.; Kuramata, A. A broad-band MQW semiconductor optical amplifier with high saturation output power and low noise figure. IEEE Photon. Technol. Lett. TBD: verify issue, pages and DOI.. 2005, 17. [Google Scholar] [CrossRef]
- Juodawlkis, P.W.; Plant, J.J.; Loh, W.; Missaggia, L.J.; Jensen, K.E.; O’Donnell, F.J. Packaged 1.5-μm quantum-well SOA with 0.8-W output power and 5.5-dB noise figure. IEEE Photon. Technol. Lett. TBD: verify issue, pages and DOI.. 2009, 21. [Google Scholar] [CrossRef]
- Park, S.; et al. Semiconductor optical amplifier for CWDM operating over 1540–1620 nm. IEEE Photon. Technol. Lett. 2005, 17. [Google Scholar] [CrossRef]
- Chuang, S.L. Physics of Photonic Devices, 2nd ed.; Wiley: Hoboken, NJ, USA, 2009. [Google Scholar]
- Coldren, L.A.; Corzine, S.W.; Mašanović, M.L. Diode Lasers and Photonic Integrated Circuits, 2nd ed.; Wiley: Hoboken, NJ, USA, 2012. [Google Scholar]
- Piprek, J. Semiconductor Optoelectronic Devices: Introduction to Physics and Simulation; Academic Press: San Diego, CA, USA, 2003. [Google Scholar]
- Connelly, M.J. Wideband semiconductor optical amplifier steady-state numerical model. IEEE J. Quantum Electron. 2001, 37, 439–447. [Google Scholar] [CrossRef]
- Tang, H.; Zhang, M.; Yang, C.; Liang, L.; Qin, L.; et al. Semiconductor optical amplifiers with wide gain bandwidth and enhanced polarization insensitivity based on tensile-strained quantum wells. Sensors TBD: verify DOI.. 2024, 24, 3285. [Google Scholar] [CrossRef]
- Lang, R.J.; Hardy, A.; Parke, R.; Mehuys, D.; O’Brien, S.; Major, J.; Welch, D. Numerical analysis of flared semiconductor laser amplifiers. IEEE J. Quantum Electron. 1993, 29, 2044–2051. [Google Scholar] [CrossRef]
- Chu, C.Y.J.; Ghafouri-Shiraz, H. Analysis of gain and saturation characteristics of a semiconductor laser optical amplifier using transfer matrices. J. Light. Technol. 1994, 12, 1378–1386. [Google Scholar] [CrossRef]
- Saitoh, T.; Mukai, T. 1.5-μm GaInAsP travelling-wave semiconductor laser amplifier. IEEE J. Quantum Electron. 1987, 23, 1010–1020. [Google Scholar]
- Dai, Z.; Michalzik, R.; Unger, P.; Ebeling, K.J. Numerical simulation of broad-area high-power semiconductor laser amplifiers. IEEE J. Quantum Electron. 1997, 33, 2240–2254. [Google Scholar] [CrossRef]
- Van Gasse, K.; Wang, R.; Roelkens, G. 27 dB gain III–V-on-silicon semiconductor optical amplifier with >17 dBm output power. Opt. Express 2019, 27, 293–302. [Google Scholar] [CrossRef]
Figure 1.
Cross-section of the InGaAlAs MQW SOA mounted p-side-down on an AlN submount and a copper heat sink. The dashed ellipse indicates the transverse optical mode confined by the ridge; the arrows indicate the vertical heat flow from the active region to the heat sink.
Figure 1.
Cross-section of the InGaAlAs MQW SOA mounted p-side-down on an AlN submount and a copper heat sink. The dashed ellipse indicates the transverse optical mode confined by the ridge; the arrows indicate the vertical heat flow from the active region to the heat sink.
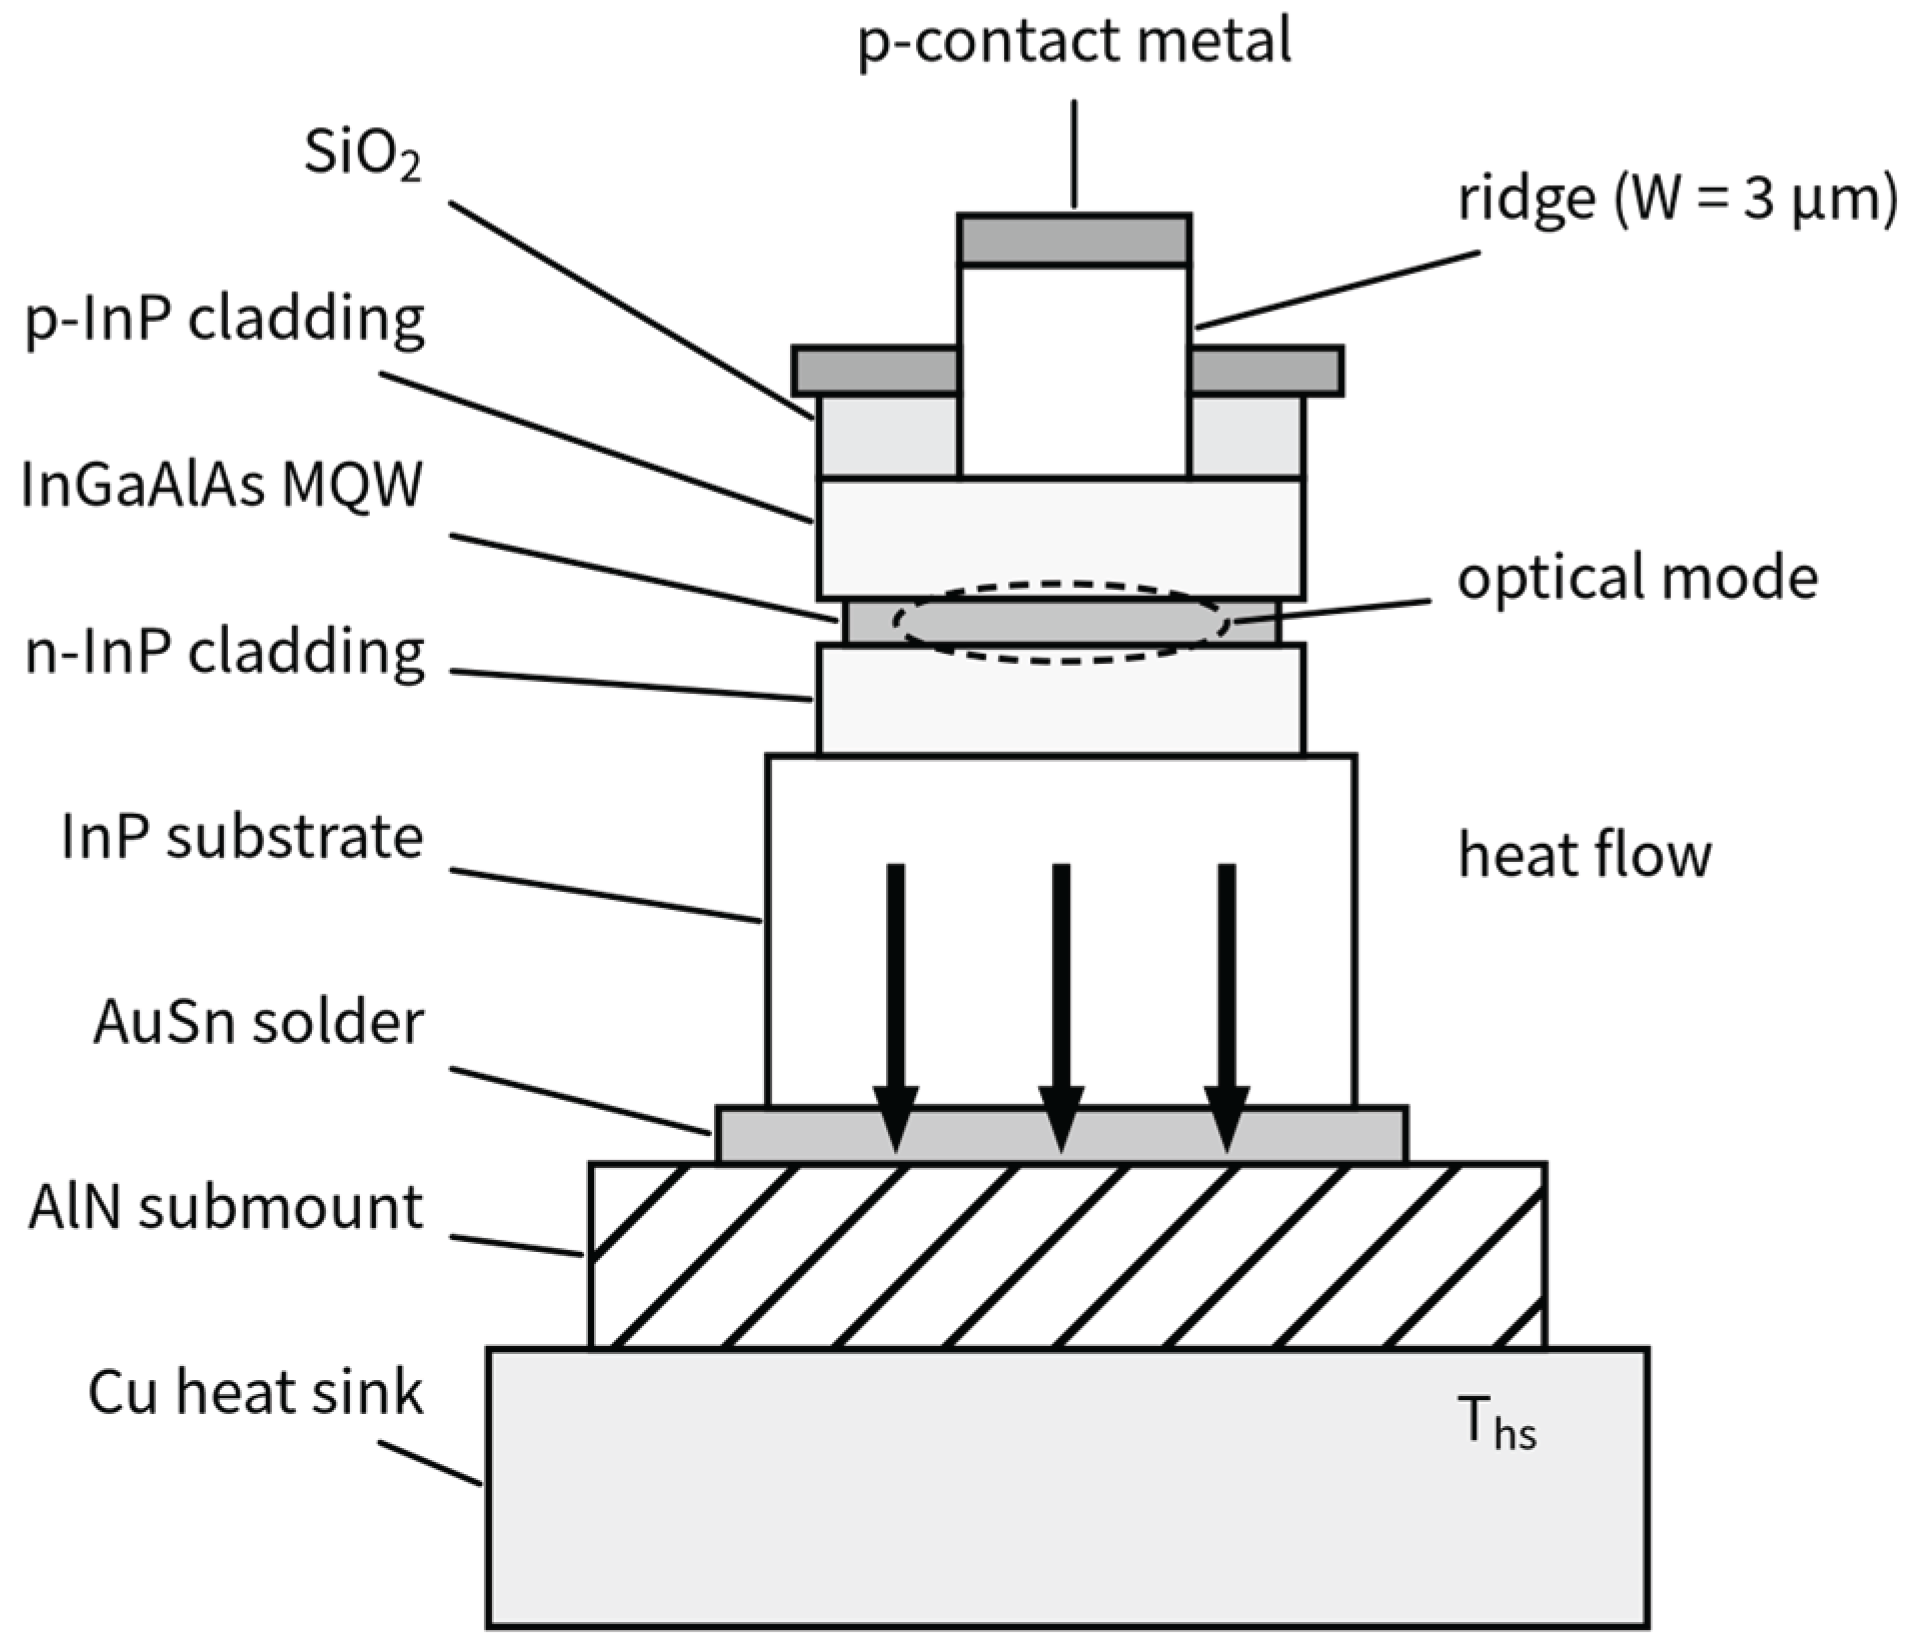
Figure 2.
(a) Relative deviation of the numerically integrated output power as a function of the number of longitudinal sections Nz. (b) Temperature rise of the junction versus dissipated power for cavity lengths of 1, 2, 3 and 5 mm, calculated from the thermal network of Eq. (10).
Figure 2.
(a) Relative deviation of the numerically integrated output power as a function of the number of longitudinal sections Nz. (b) Temperature rise of the junction versus dissipated power for cavity lengths of 1, 2, 3 and 5 mm, calculated from the thermal network of Eq. (10).
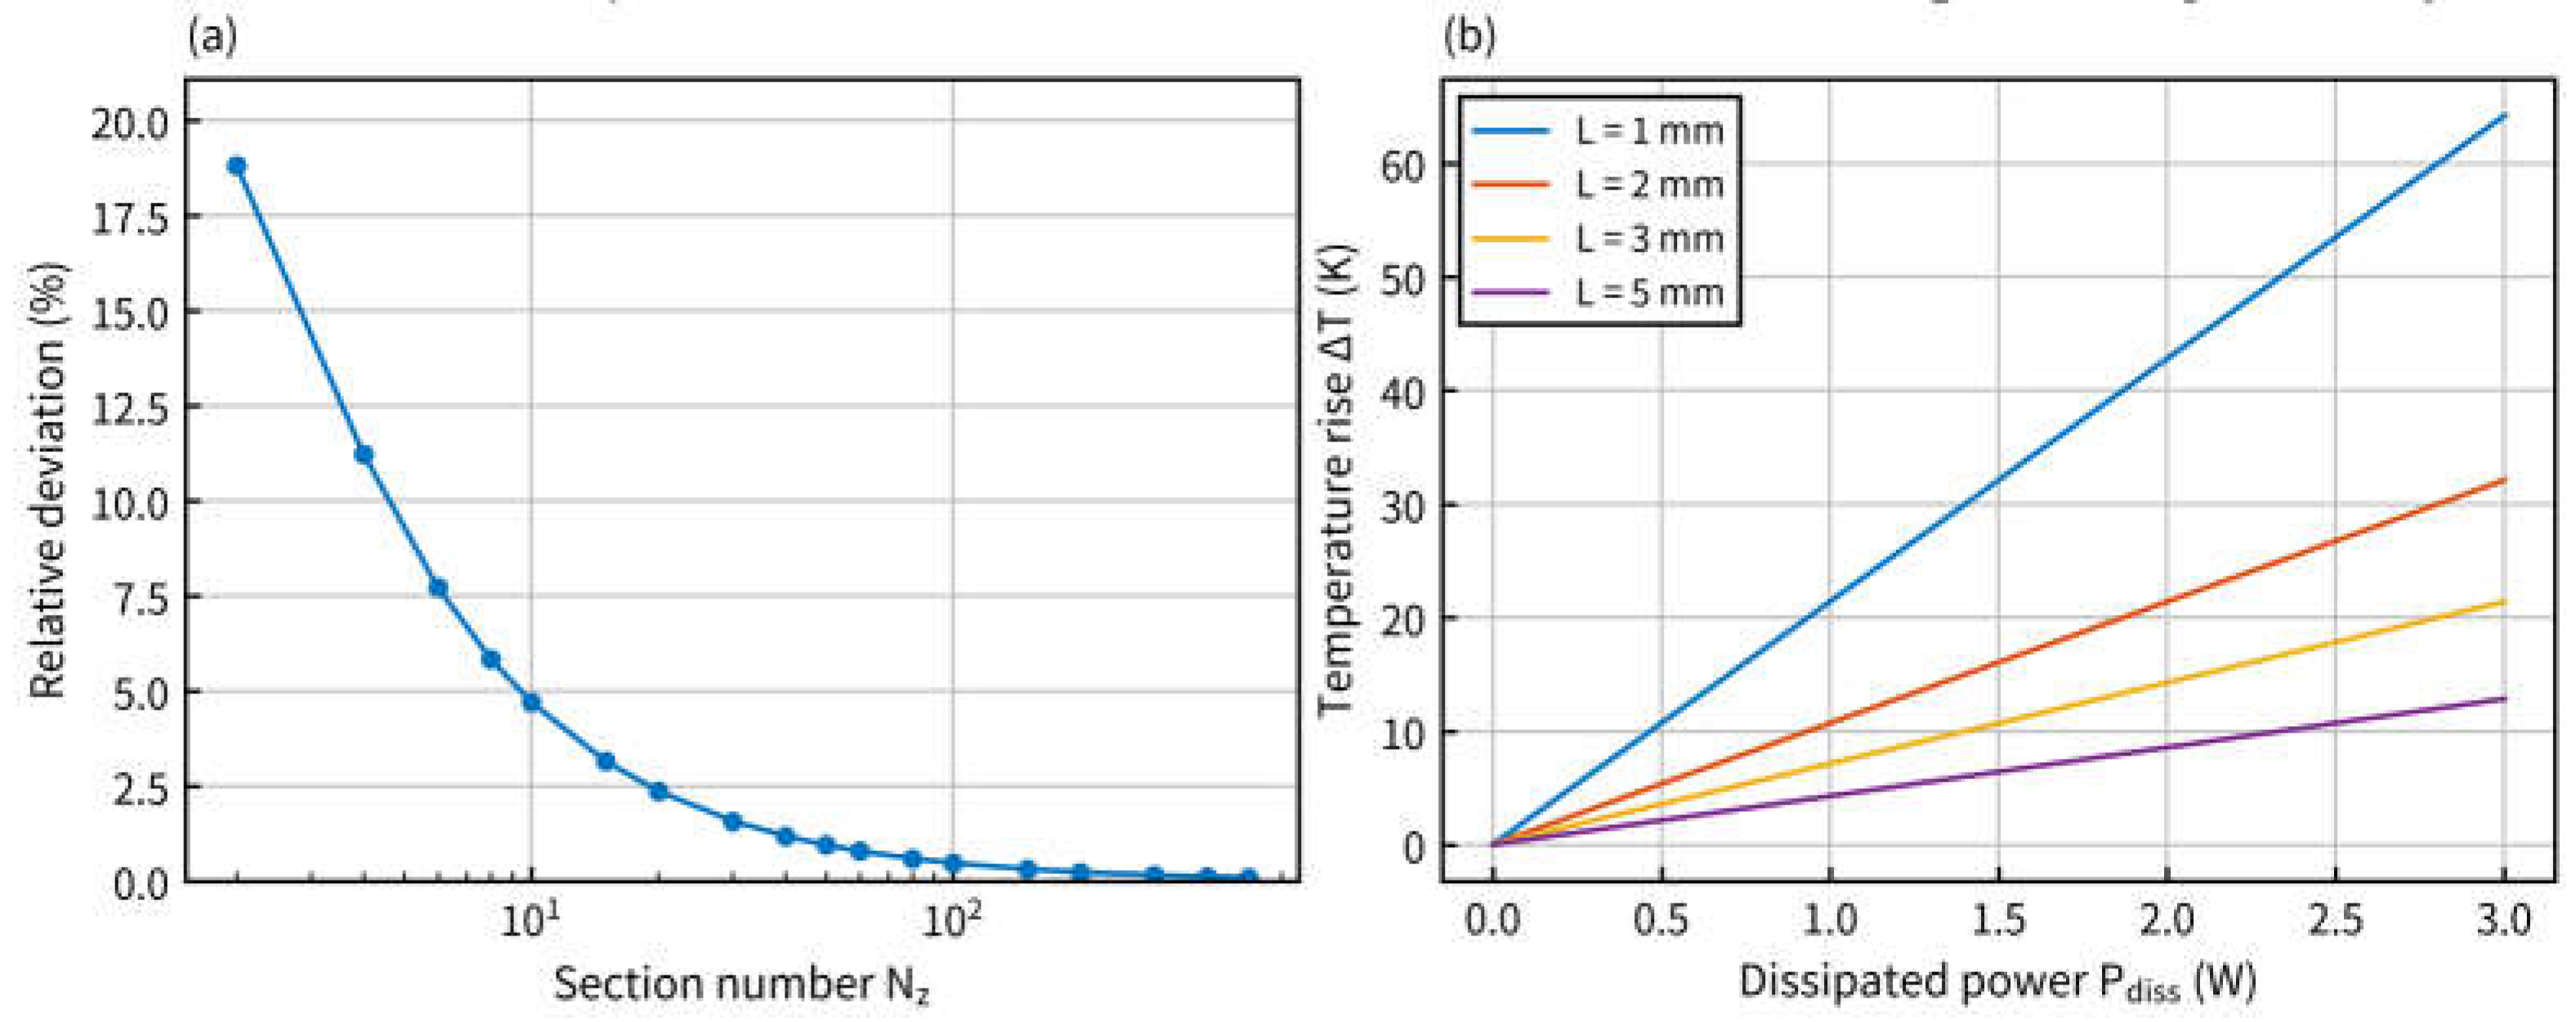
Figure 3.
Calculated material gain versus carrier density in the quantum well for well thicknesses of 5.2 nm (red) and 7.0 nm (blue), T = 293 K, λ = 1.55 μm.
Figure 3.
Calculated material gain versus carrier density in the quantum well for well thicknesses of 5.2 nm (red) and 7.0 nm (blue), T = 293 K, λ = 1.55 μm.
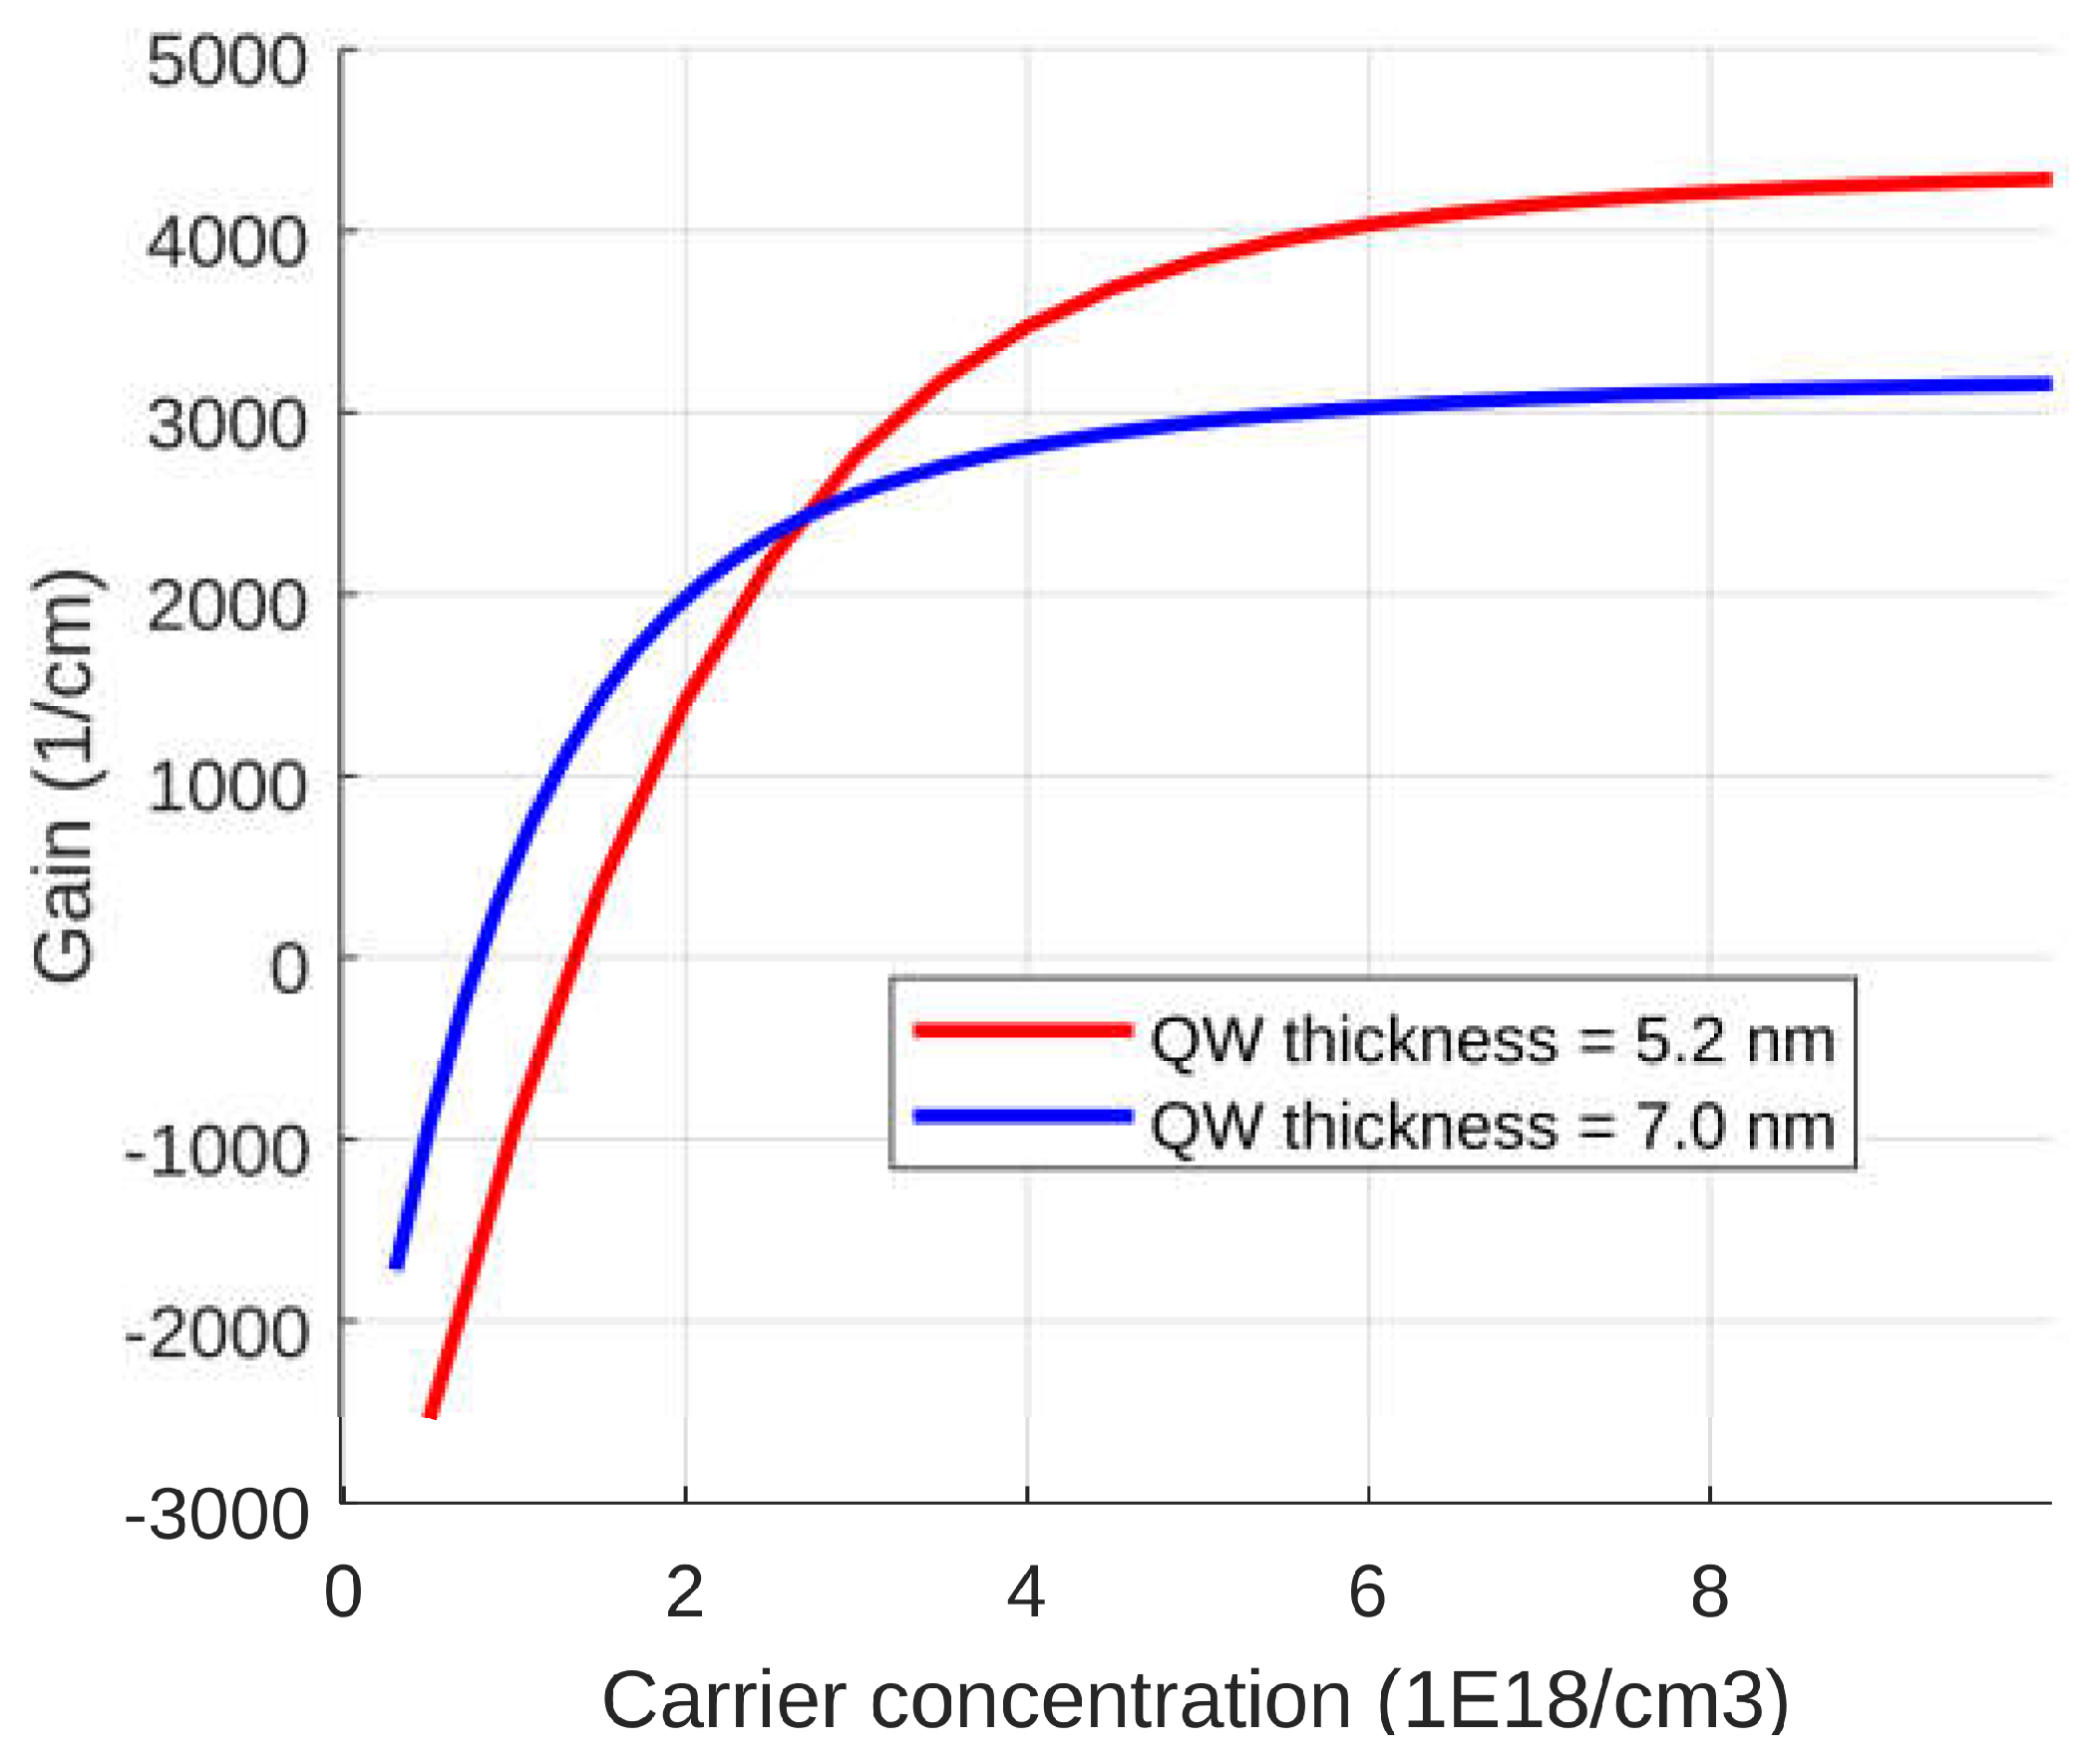
Figure 4.
Output power versus injection current for well numbers of 1–5 at L = 4 mm: (a) dw = 5.2 nm, (b) dw = 7.0 nm.
Figure 4.
Output power versus injection current for well numbers of 1–5 at L = 4 mm: (a) dw = 5.2 nm, (b) dw = 7.0 nm.
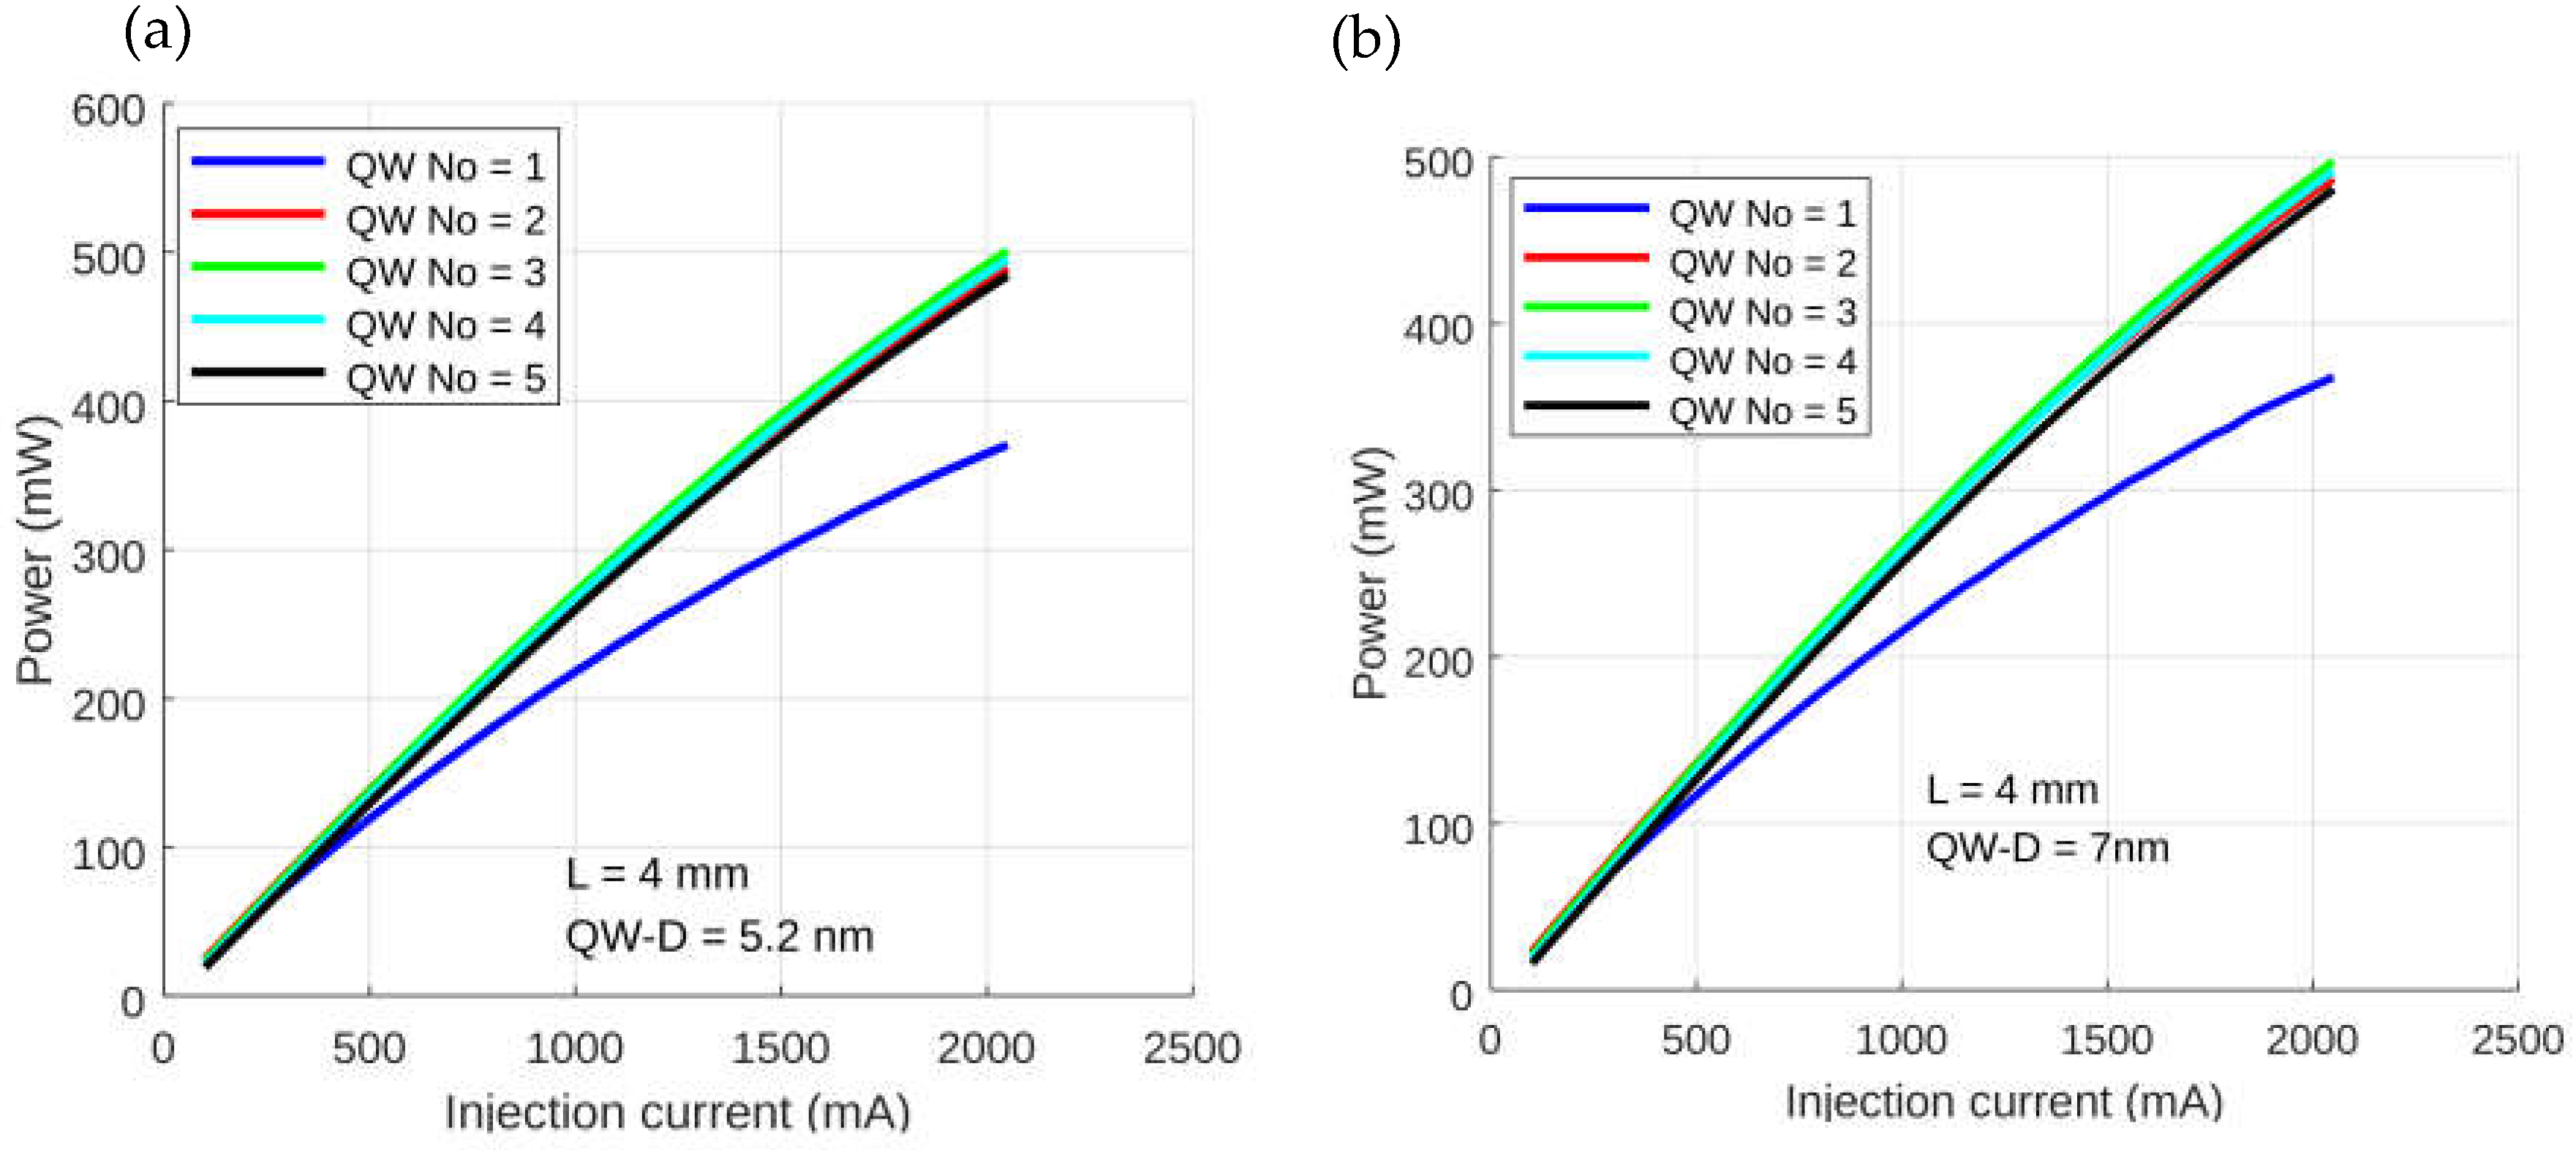
Figure 5.
Output power versus injection current for cavity lengths of 3.0–5.0 mm: (a) Nw = 2, dw = 5.2 nm, (b) Nw = 3, dw = 5.2 nm, (c) Nw = 2, dw = 7.0 nm, (d) Nw = 3, dw = 7.0 nm.
Figure 5.
Output power versus injection current for cavity lengths of 3.0–5.0 mm: (a) Nw = 2, dw = 5.2 nm, (b) Nw = 3, dw = 5.2 nm, (c) Nw = 2, dw = 7.0 nm, (d) Nw = 3, dw = 7.0 nm.
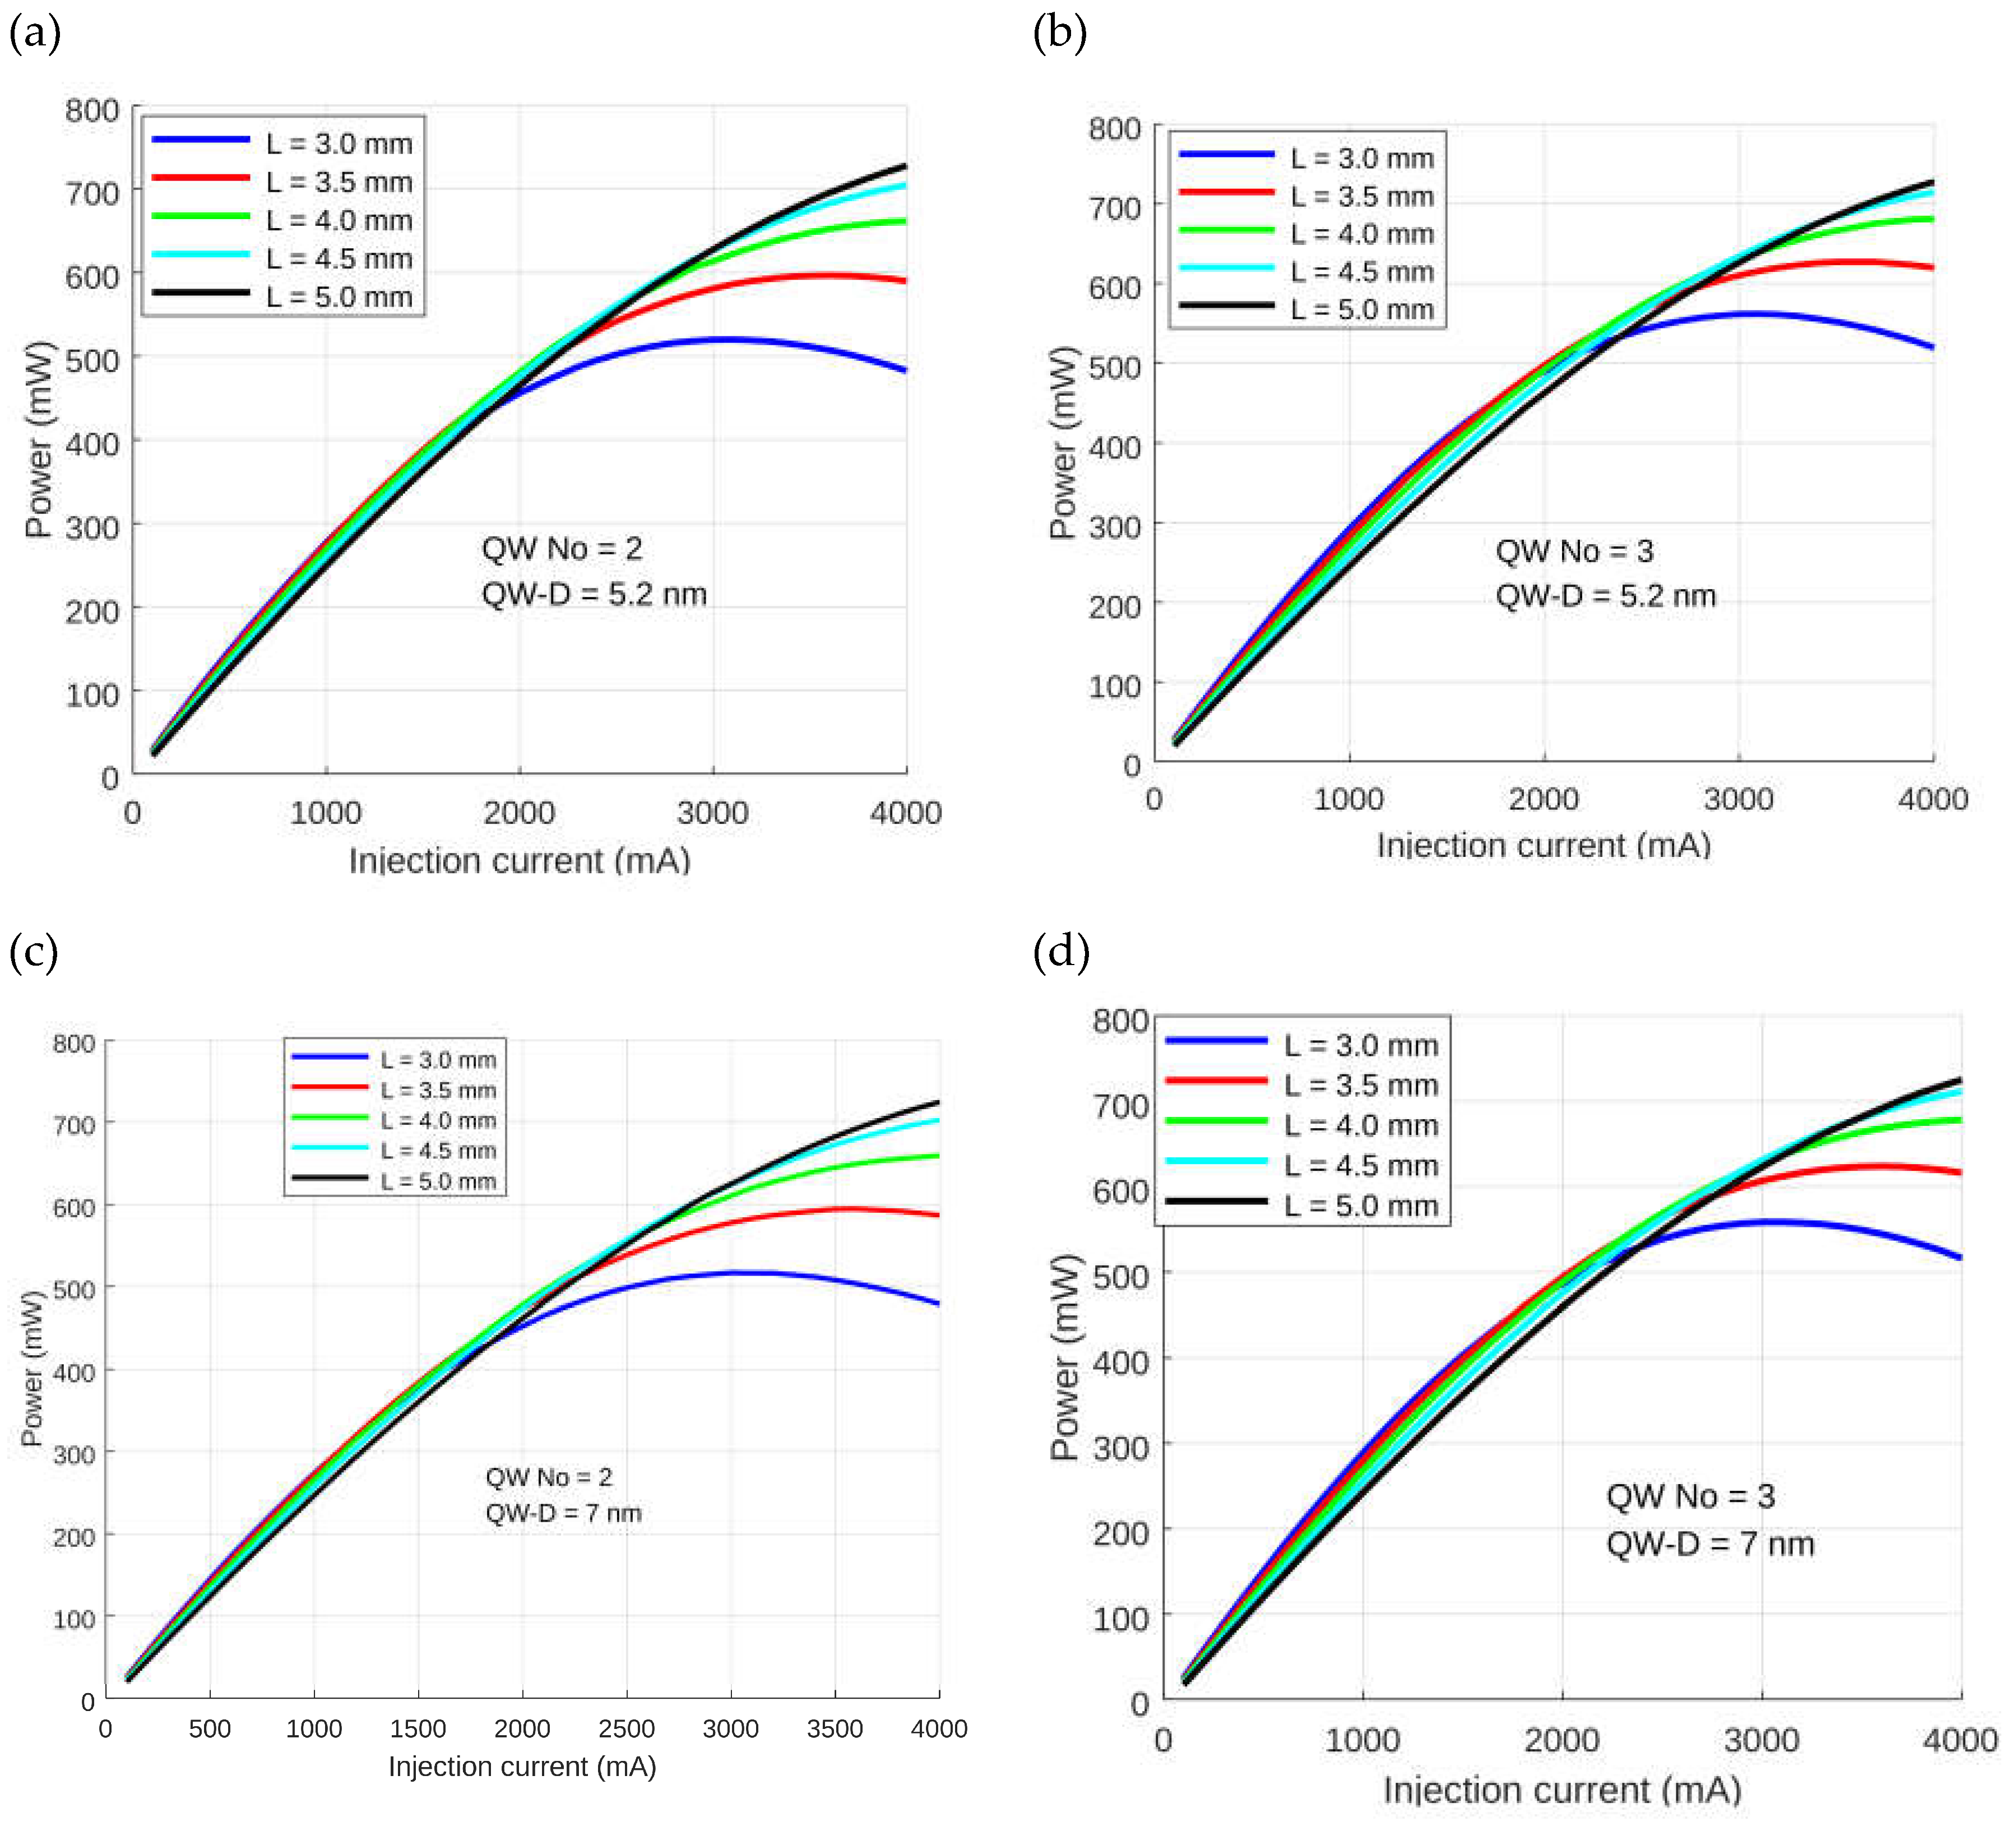
Figure 6.
Output power normalized to the saturation power versus normalized input power for small-signal gains of 20, 25 and 30 dB. The dotted line is the linear asymptote for G0 = 30 dB.
Figure 6.
Output power normalized to the saturation power versus normalized input power for small-signal gains of 20, 25 and 30 dB. The dotted line is the linear asymptote for G0 = 30 dB.
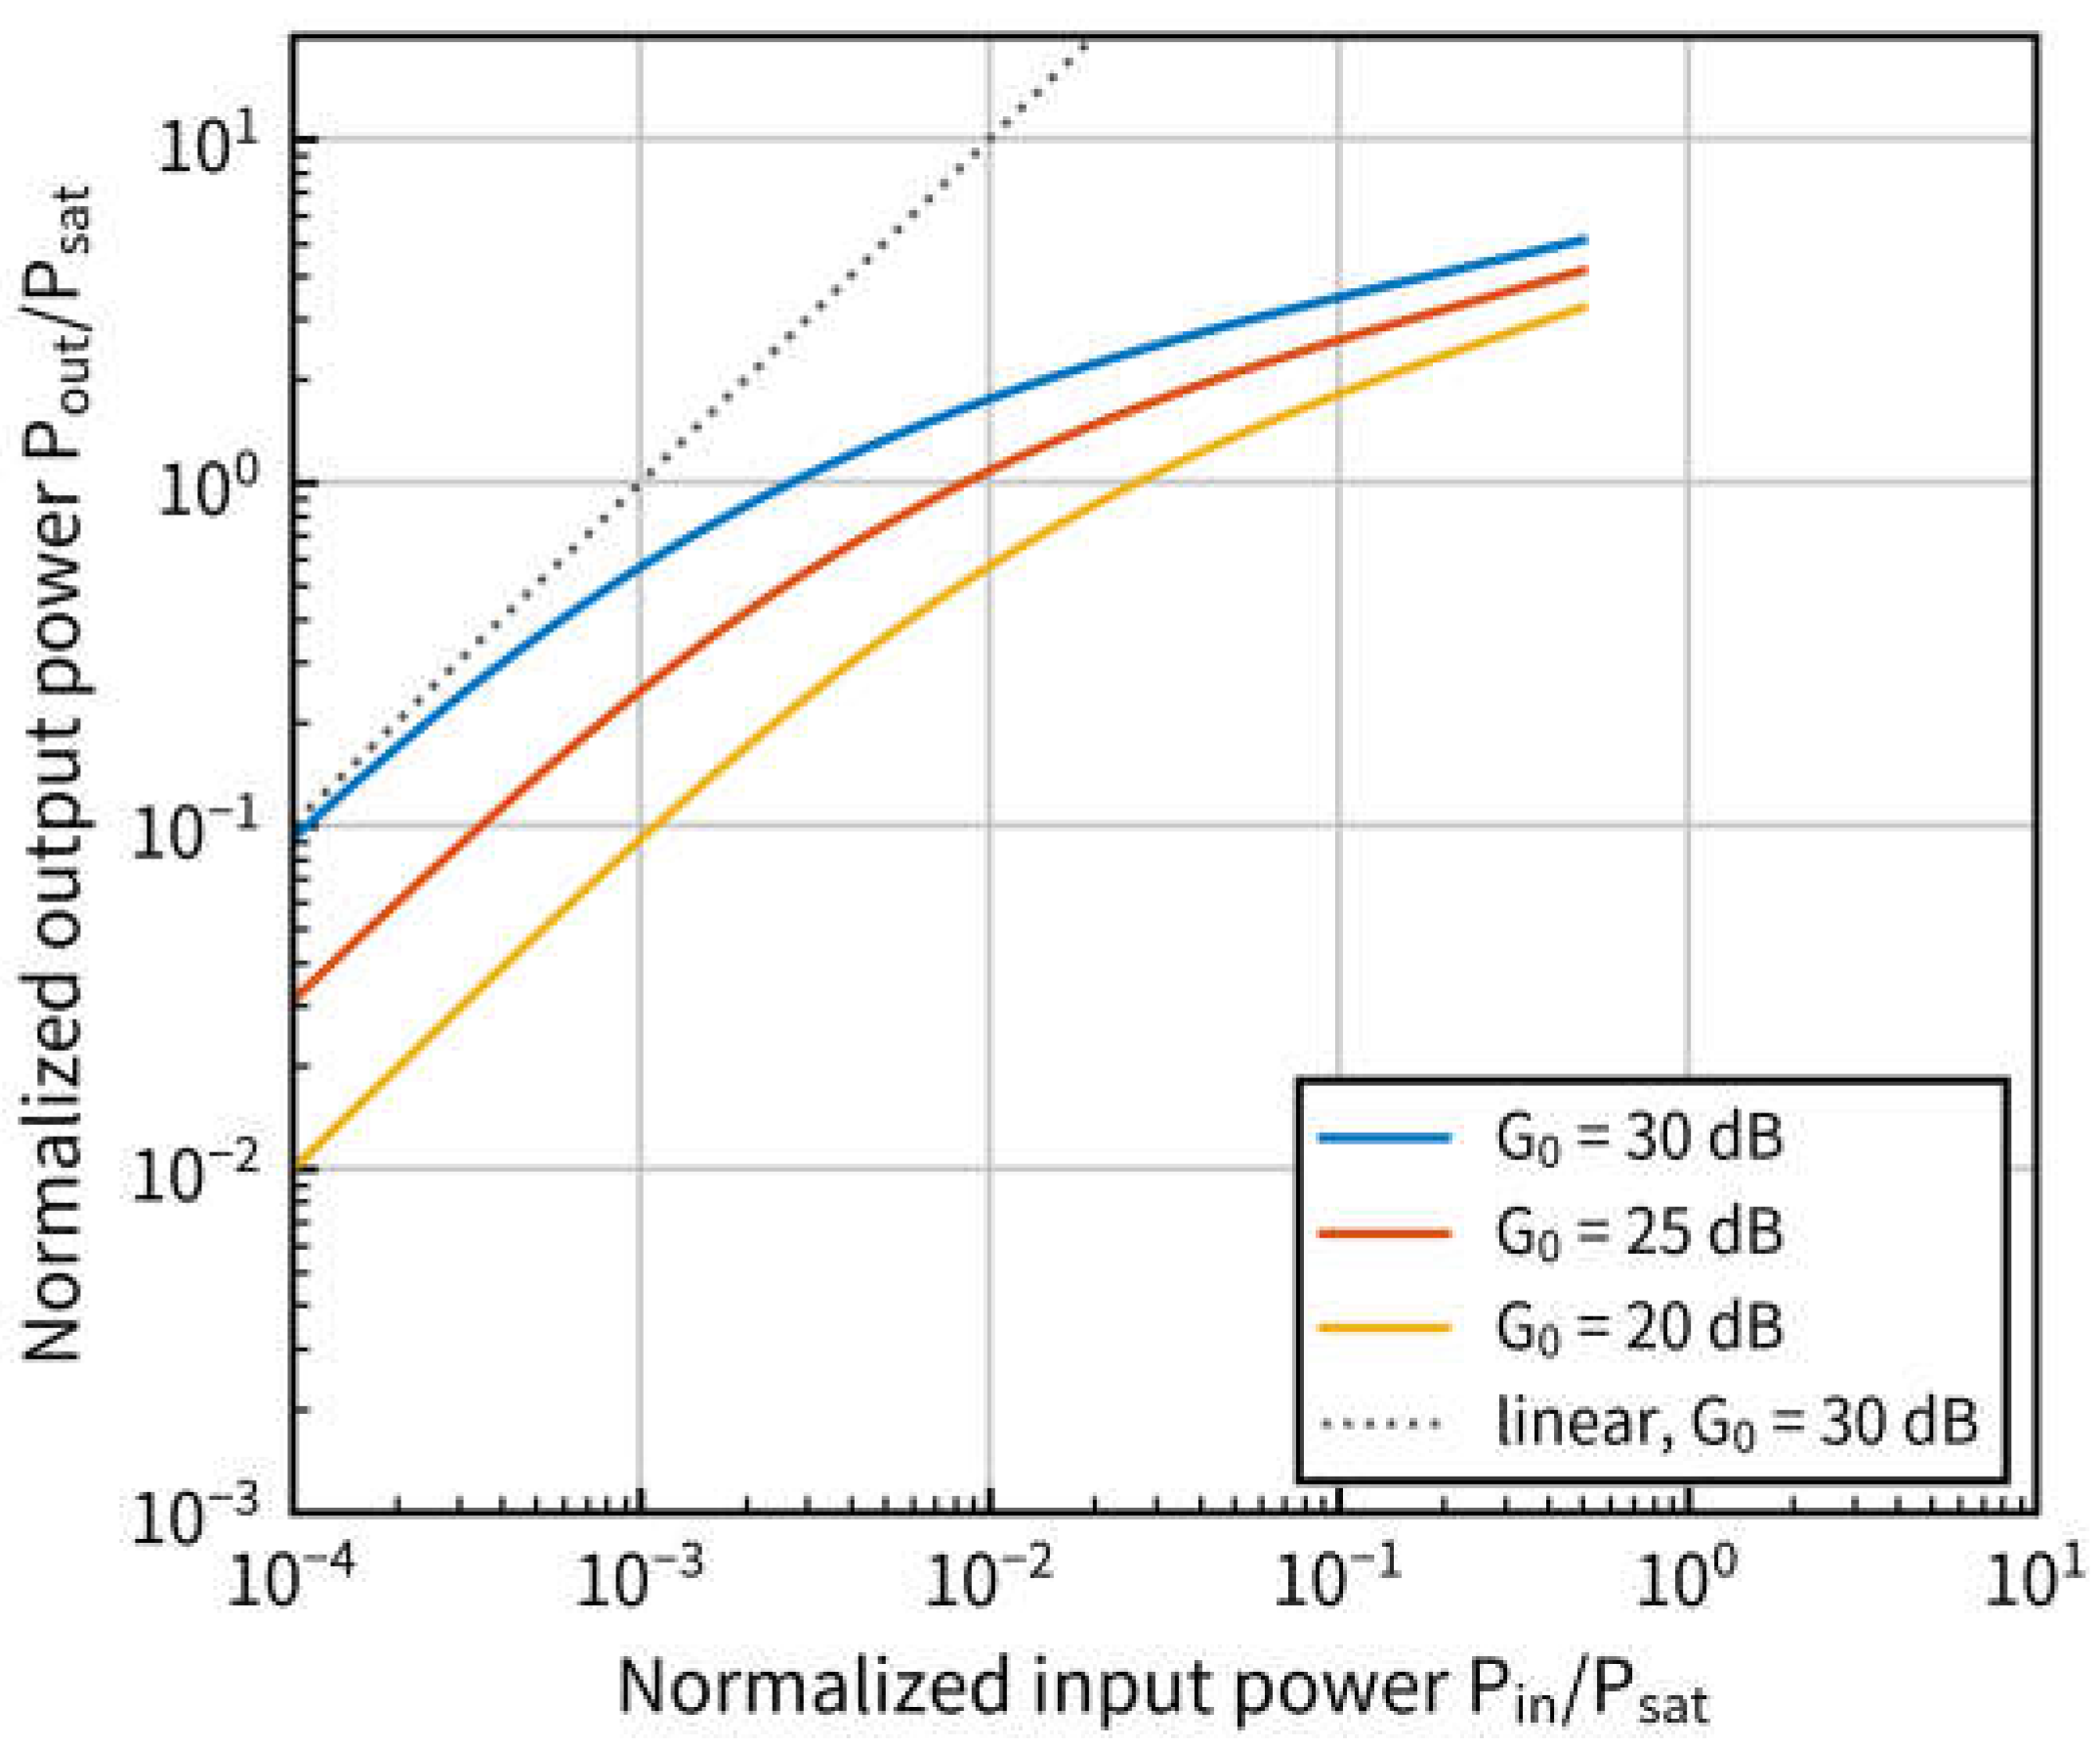
Figure 7.
Thermal resistance and junction temperature rise versus cavity length for the p-side-down AlN/Cu mounting, at dissipated powers of 2 and 3 W.
Figure 7.
Thermal resistance and junction temperature rise versus cavity length for the p-side-down AlN/Cu mounting, at dissipated powers of 2 and 3 W.
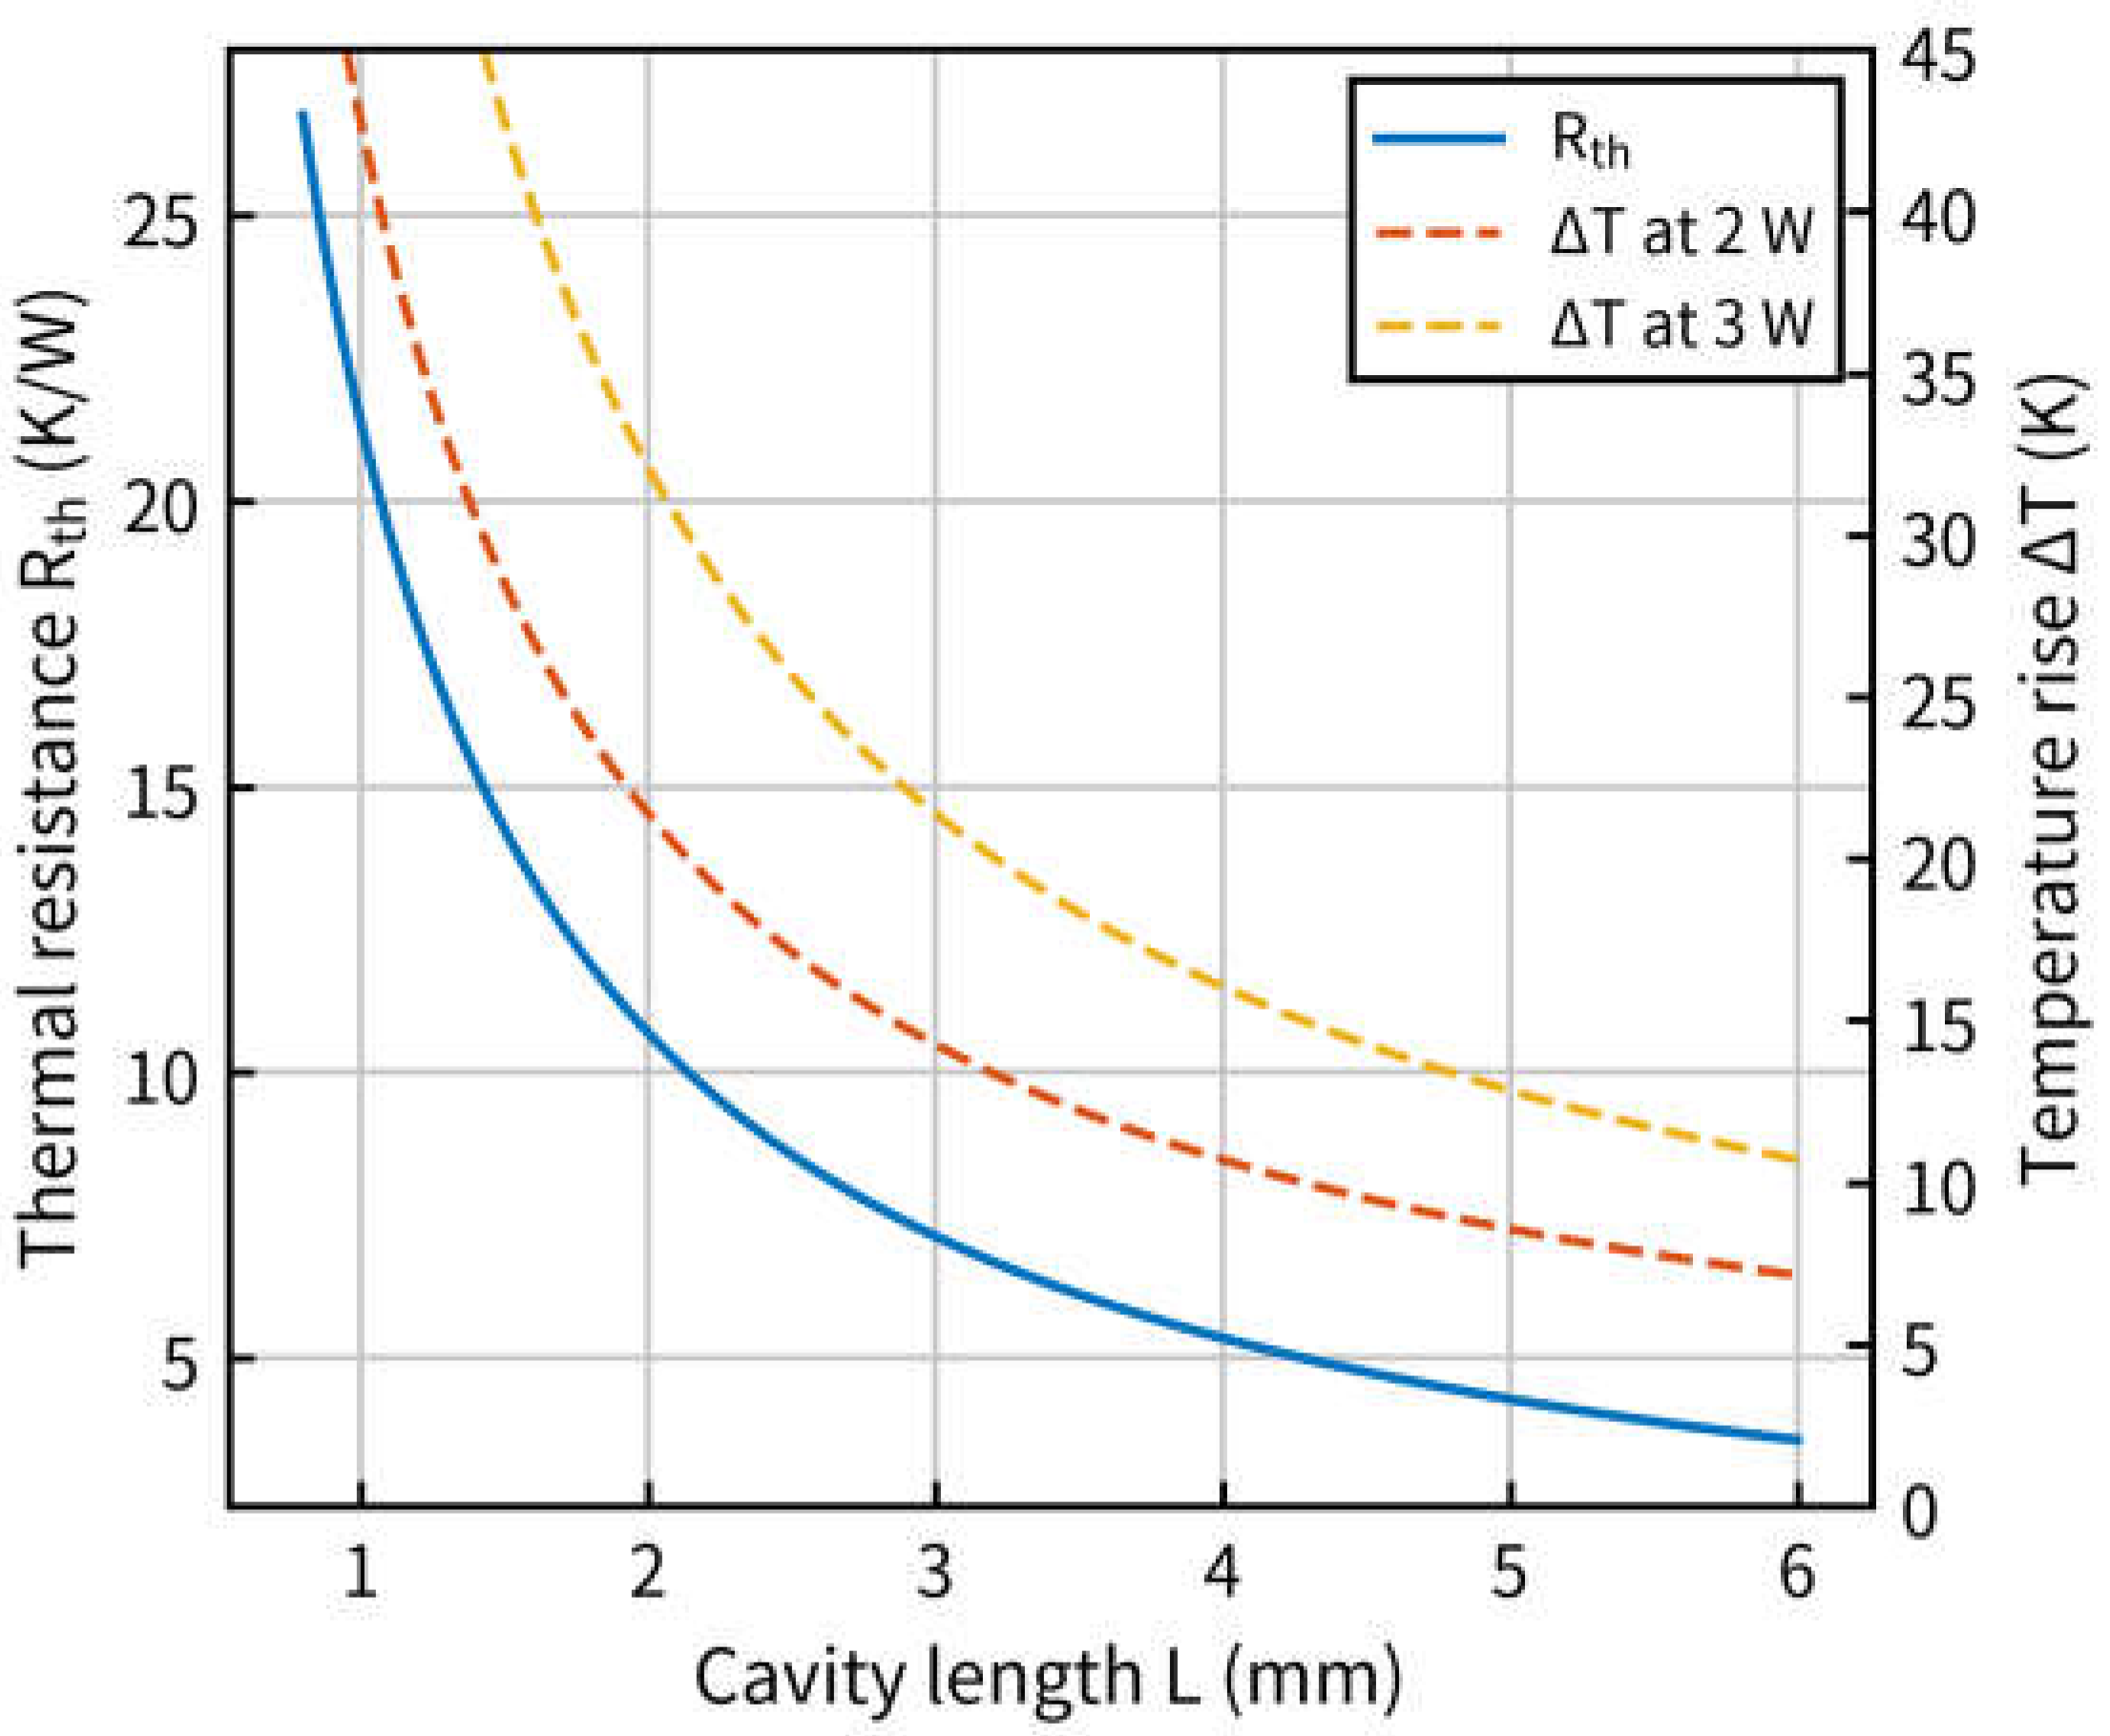
Table 1.
Nominal structural, material and thermal parameters used in the simulation.
| Parameter | Symbol | Value |
| Emission wavelength | λ | 1.55 μm |
| Ridge (active) width | W | 3.0 μm |
| Well thickness | dw | 5.2–7.0 nm |
| Well number | Nw | 2–6 |
| Barrier thickness | db | 10 nm |
| Confinement factor per well | Γw | 0.025 |
| Internal loss | αi | 2 cm-1 |
| Group index | ng | 3.7 |
| Facet reflectivity | R | <1×10⁻⁴ |
| Cavity length | L | 1–5 mm |
| SRH / radiative / Auger coefficients | Anr, B, C | 5×10⁶ s-1, 1×10⁻¹⁰ cm3s-1, 3×10-29 cm6s-1 |
| Gain temperature coefficient | kT | 2.5×10⁻³ K-1 |
| Heat-sink temperature | Ths | 293 K |
| Thermal resistance (L = 5 mm) | Rth | 4.3 K/W |
Table 2.
Layer stack of the p-side-down mounting and the corresponding thermal resistance.
| Layer | t (μm) | k (W/mK) | Rth@5 mm | Rth@1 mm |
| p-InP cladding | 1.5 | 90 | 0.74 | 3.71 |
| InGaAlAs MQW | 0.008 | 25 | 0.01 | 0.05 |
| n-InP cladding | 2.0 | 90 | 0.55 | 2.77 |
| InP substrate | 100 | 90 | 2.02 | 10.1 |
| AuSn solder | 5 | 200 | 0.02 | 0.12 |
| AlN submount | 300 | 200 | 0.58 | 2.89 |
| Cu heat sink | 2000 | 400 | 0.36 | 1.78 |
| Total | — | — | 4.28 | 21.4 |
Table 3.
Comparison with reported high-power 1.55-μm semiconductor optical amplifiers.
| Ref. | Active region / concept | Psat,out | Remarks |
| [6] | tensile-strained bulk + spot-size converter | +17 dBm (50 mW) | fibre-coupled, module |
| [7] | MQW, low noise figure | +20 dBm (100 mW) | NF = 6.0 dB |
| [9] | InGaAsP slab-coupled optical waveguide | 0.8 W (29 dBm) | low confinement, large mode |
| [20] | hybrid III-V-on-Si, 6 QW | +17.5 dBm (53 mW) | on-chip, low confinement |
| This work | InGaAlAs MQW, 2–3 wells, L = 5 mm | ≥700 mW (28.5 dBm) | on-chip, simulation |
Disclaimer/Publisher’s Note: The statements, opinions and data contained in all publications are solely those of the individual author(s) and contributor(s) and not of MDPI and/or the editor(s). MDPI and/or the editor(s) disclaim responsibility for any injury to people or property resulting from any ideas, methods, instructions or products referred to in the content. |
© 2026 by the authors. Licensee MDPI, Basel, Switzerland. This article is an open access article distributed under the terms and conditions of the Creative Commons Attribution (CC BY) license (http://creativecommons.org/licenses/by/4.0/).
Copyright: This open access article is published under a Creative Commons CC BY 4.0 license, which permit the free download, distribution, and reuse, provided that the author and preprint are cited in any reuse.