

Submitted:
16 November 2026
Posted:
17 November 2026
You are already at the latest version
Abstract
Improving sustainable energy production efficiency is a priority for resource-constrained countries, where environmental stress, equipment degradation, managerial weaknesses and human operational errors can threaten reliable energy supply. This study develops and tests an integrated operational risk model for sustainable energy production in Eritrea. Drawing on the Resource-Based View and Multi-Hazard Early Warning Systems perspective, it examines whether human, environmental, management and equipment risks affect sustainable energy production efficiency through production technology risk and early warning management effectiveness. Survey data were collected from 300 respondents with direct knowledge of production, maintenance, safety, monitoring and warning-response activities in sustainable energy production industries. The data were analyzed using partial least squares structural equation modelling and fuzzy-set qualitative comparative analysis. The results show that all four risk dimensions significantly increase production technology risk, with human risk exerting the strongest effect. Production technology risk is positively associated with early warning management effectiveness, which is the strongest direct predictor of sustainable energy production efficiency. The mediation results confirm that production technology risk and early warning management effectiveness transmit the effects of operational risks to efficiency outcomes, while the configurational analysis reveals multiple alternative pathways to high efficiency. The findings suggest that sustainable energy performance depends not only on technical assets but also on coordinated risk knowledge, monitoring, maintenance and rapid-response capabilities.
Keywords:
sustainable energy production
; operational risk
; production technology risk
; early warning management
; energy efficiency
; eritrea
1. Introduction
As sustainable energy production expands in resource-constrained environments organizations should scale physical capacity and develop knowledge routines that enable employees to detect, interpret and respond to operational risk signals. Eritrea exemplifies these challenges. The Eritrean energy context provides a compelling setting for examining the connection between operational risk, early warning capability, and sustainable energy production efficiency. Recent sector profiles indicate that national electricity access remains incomplete, with a marked rural-urban divide. The Africa Energy Portal reports that Eritrea's national electricity access rate was estimated at 54.4% in 2023, with urban access substantially higher than rural access. The same source notes that more than 80% of the population relies on biomass, while installed electricity capacity is constrained by aging assets, deterioration, lack of spare parts, and insufficient maintenance, which reduce available capacity below installed capacity [1,2]. These conditions mean that sustainable energy production in Eritrea is not only a matter of increasing installed renewable capacity, but also a matter of improving the organizational systems that keep existing and new assets reliable, safe, and productive.
Studies on the country’s energy transition highlight institutional bottlenecks, infrastructural constraints, and system design limitations that hinder the integration of high levels of renewable energy [2,3]. Safety risk management is a crucial component of sustainable energy production and overall production efficiency. When safety management is inadequate, production efficiency becomes less stable, disruptions increase, and confidence in the energy transition declines. The significance of this study is further underscored by recent research, demonstrating that effective safety risk management contributes to operational excellence, improved organizational performance, and more resilient energy infrastructures. Thus, continuing to pursue transitioning to sustainable energy, without adequate consideration of safety reliability, could threaten the technical and public confidence. This study is applicable to Sustainable Development Goal 7 (SDG 7) whose objective is to assure access the affordability, reliability of sustainable energy production. SDG 7 outlines the conditions essential to increase access and efficiency, improve reliability, modernize infrastructure, promote sustainable development of energy production. Consequently, investments in energy infrastructure and technologies are necessary, particularly in developing countries where advancement to sustainable energy goals via 2030 has been inadequate [4,5]. In this context, the Eritrean case shows a critical employment challenge, in which energy transition strategies may fail when institutional capacity, maintenance systems, monitoring routines, and response procedures do not keep pace with new production technologies. Therefore, the present study contributes to the SDG 7 discussion by explaining how risk governance and early warning management can support more reliable and efficient sustainable energy production in a resource-constrained national context.
Current research indicates that safety risk management in sustainable energy production is multidimensional. Although substantial advancements have been achieved regarding safety risks identification and associations, there is still considerable scope for improvement when it comes to the interconnection between safety risks. While research into human risks has shed light on problems associated with fatigue among workers, insufficient training, and non-compliance with procedure [6], studies into technical and environmental risks have focused on factors like dust, moisture, harmonic distortion, and failure of equipment [7,8]. Moreover, maintenance and reliability-related research have revealed gaps in work force management and resources allocation [9,10]. Consequently, limited attention has been paid to how human, environmental, management, and equipment risks are transformed into actionable operational knowledge through production technology risk assessment and early warning management, and how this knowledge process influences sustainable energy production efficiency.
This gap is significant because early warning management depends on the acquisition, interpretation, dissemination and use of risk knowledge across technical and managerial actors. The resource-based view (RBV) posits that workforce capabilities, monitoring routines, maintenance systems, and technological assets constitute strategic operational resources [11,12,13]. The multi-hazard early warning systems (MHEWS) perspective further emphasizes the need for integrated risk knowledge, monitoring, warning dissemination, and response capabilities [14,15,16,17]. This study addresses the gap by developing and empirically validating an integrated RBV-MHEWS model tailored to sustainable energy production in Eritrea.
2. Literature Review
2.1. Theoretical Foundations
This study integrates the Resource-Based View (RBV) and Multi-Hazard Early Warning Systems (MHEWS) perspectives. RBV posits that firm performance depends on the valuable, rare, and efficiently deployed resources and capabilities of the organization [11]. In sustainable energy production, these resources include employee expertise, maintenance knowledge, monitoring routines, organizational memory and disciplined knowledge-sharing practices. According to Hart [13], natural-resource-based view further suggests that environmental and operational capabilities can become sources of sustained competitive advantage rather than mere compliance costs.
In resource-constrained energy systems, institutional capacity is a central mechanism through which resources are converted into performance. Institutional capacity refers to the ability of organizations and public agencies to coordinate planning, allocate scarce maintenance resources, collect and interpret operational data, train personnel, enforce safety procedures, and respond to emerging risks. From an RBV perspective, these capabilities can be understood as valuable organizational resources because they determine whether physical assets and renewable-energy technologies are used efficiently. From an MHEWS perspective, they also form the practical foundation of risk knowledge, monitoring, warning dissemination, and response. In the Eritrean context, where infrastructure constraints, spare-part shortages, and limited financial flexibility can magnify operational disruptions, institutional capacity becomes especially important for turning early warning information into timely corrective action.
RBV explains why certain capabilities matter, while MHEWS clarifies how these capabilities should be integrated to detect, interpret, communicate, and respond to risk signals effectively [14,15,16,17]. The combination of these theories provides a more comprehensive understanding of sustainable energy production efficiency in uncertain environments, where human, environmental, management, and equipment risks often interact and influence production technology risk and early warning management effectiveness.
Integrating RBV and MHEWS provides a knowledge-based explanation of how organizations convert risk signals into coordinated responses that improve sustainable energy production efficiency. The RBV can offer an understanding of why capabilities are important [12,18], whereas the MHEWS can offer an understanding of how such capabilities should be integrated in order to form an effective warning and response chain[14,15,16,17]. This integrated understanding of theory can be useful in sustainable energy production because human, environmental, managerial, and equipment risks are unlikely to be independent of each other in such settings. These risks can affect production technology risk through technological fragility and the effectiveness of the warning response routines. Thus, this study can propose a process model in which exogenous risks (human, environmental, management, and equipment) can affect production technology risk, which in turn can affect the effectiveness of early warning management, which can affect sustainable energy production efficiency.
Based on the integrated perspective of the RBV-MHEWS model, the study argues that exogenous risk dimensions affect production technology risks, which in turn affect early warning management effectiveness, which finally influences sustainable energy production efficiency, as shown in (Figure 1). As discussed above, the model is designed to be parsimonious so that the mediating process is conceptually clear and empirically verifiable. As supported by the literature, the efficiency of sustainable energy production is affected by various factors beyond the mere availability of equipment and production capacity. A critical review of the literature indicates that the main problem with the existing literature is that the research is technically fragmented and insufficiently linked to the process of organizational response. Accordingly, this review integrates RBV and MHEWS to explain how risk-related knowledge resources, technology-risk interpretation and early warning routines jointly shape sustainable energy production efficiency. As discussed above, the main channel through which exogenous risks affect the efficiency of sustainable energy production is the impact of production technology risks and early warning management effectiveness.
2.2. Significance of Human Risk and Production Technology Risk
Human risk is defined as the vulnerabilities that are related to the workers, such as insufficiently trained workers, fatigued workers, noncompliance with safety standards, errors by workers, lack of appropriate means to report safety issues, and insufficiently supervised workers. Continuing research into solar and renewable energy systems, for example, shows that human factors are a major cause of unsafe or operationally problematic circumstances. Aman et al. (2015) identified many potential safety, health, and environmental risks associated with solar energy systems, while Duroha and Macht (2023) found that workers performing installation and maintenance tasks on such systems were exposed to significant occupational hazards. Research on human reliability also supports the idea that human factors, such as fatigue or procedural violations, create a greater risk to overall system reliability (Griffith and Mahadevan, 2011).
The results of these studies indicate that the main reason for a failure in a production technology is not due to malfunctioning equipment, but also due to how people operate, monitor and maintain those technologies. The majority of previous studies examine the outcome (in the form of injury or compliance) rather than technological instability caused by human activity. Thus, this study views human risk as antecedent to production technology risk. When workforce capacity and operating discipline are low, this will be associated with increased probabilities of technological instability. This leads to the following hypothesis:
Hypothesis 1: Human risk has a positive effect on production technology risk.
2.3. Significance of Environmental Risk on Production Technology Risk
Sustainable energy production industries are face several environmental hazards, including heat, dust, humidity, and other stresses caused by the climate. These effects can result in decreased efficiency and performance of operations, especially in situations whereby there is limited or no provision for protection and maintenance within such resource-deprived environment [9]. Previous literature has indicated that soiling, thermal, and environmental stress have been found to be major constraints affecting photovoltaic technology through effects on panel, sensor, and inverter performance [8,19]. In many studies, however, environmental hazards in question have not been considered as a major cause of production technology risk but as contextual factors that affect performance of such technology [9,20]. Given the nature of resource-scarce environments that are common in countries such as Eritrea, it becomes evident that these stressors will affect production technology even more significantly than they would under other circumstance. Therefore, environmental risk is expected to heighten production technology risk through increased fragility and process instability. Thus, these gaps propose the following hypothesis.
Hypothesis 2: Environmental risk has significant effect on production technology risk.
2.4. Significance of Management Risk on Production Technology Risk
Management risk includes weaknesses in organizational areas such as planning, supervision, maintenance, governance, communication, staffing, and decision-making routines. In an industrial environment characterized by complexity and, therefore, uncertainty, these managerial aspects will determine how effectively an organization prevents, detects and responds to technical failure. The findings of research conducted on both maintenance planning and the strategic coordination of workforces demonstrate that organizational design and the maintenance and management of scheduling are integral to achieving operational reliability [10]. Similarly, a review of performance of photovoltaic systems, including maintenance and operation, shows that, unless management focuses on inspection, repair cycles and process control, they will not maintain high levels of technical performance [9].
From an RBV perspective, managerial systems are strategic organizational resources because they coordinate the deployment of people, information, and assets. When those systems are weak, even technically adequate assets may be used poorly, maintained inconsistently, or monitored too late. The result is heightened production technology risk. Existing work often discusses governance failures conceptually, but less often embeds them in a causal plant-level model. Accordingly, the following hypothesis is proposed:
Hypothesis 3: Management risk has a significant effect on production technology risk.
2.5. Significance of Equipment Risk on Production Technology Risk
Equipment risk refers to vulnerabilities arising from machinery wear, component failure, inadequate inspection, weak maintenance execution and the absence of predictive maintenance practices [21,22]. Equipment risk can be particularly significant in sustainable energy production, where there is a substantial amount of Research and Development (R&D) focused upon condition monitoring, imaging technologies and fault history in regards to Photovoltaic (PV) performance levels and safety, as a function of the integrity of equipment and to the timely identification of degradation of equipment [23,24,25]. Additionally, electrical disturbances and harmonic problems, etc., also demonstrate that the technical assets themselves may be a significant cause of operational fragility [7].
The literature strongly supports the importance of equipment reliability, but it often treats equipment failure as a purely engineering issue. A broader organizational interpretation is needed because equipment-related weaknesses can cascade into production instability, affect the quality of warning signals, and complicate maintenance response. In the present model, equipment risk is therefore treated as a direct source of production technology risk.
Hypothesis 4: Equipment risk has a positive effect on production technology risk.
2.6. Significance of Production Technology Risk on Early Warning Management Effectiveness and Sustainable Energy Production Efficiency
Production technology risk is central to the mediation process because it translates exogenous risks into technological fragility and process instability. The extent of this instability in production systems can include failing to identify faults and experiences with systems failure, cascades of failure, inaccurate monitoring, and unstable operating conditions. When researchers have studied renewable energy systems regarding maintenance and the diagnosis of faults, they have found that instability in relation to technology is rarely an isolated event from exogenous risk factors [8,9,25]. In addition, from a theoretical basis, this role of production technology risk aligns with the Resource-Based View (RBV) as technological resilience is an organizational capability that has been developed by the quality of the organization’s resources and its associated routines and the manner in which these resources have been deployed.
Early warning management effectiveness refers to the organization's knowledge capability to detect, interpret, communicate and act on risk signals before they escalate into operational losses. MHEWS research offers the clearest conceptual basis for this construct. Effective warning systems require more than sensors and alarms; they depend on integrated configurations of risk knowledge, communication, institutional coordination, and response [14,15,16]. In sustainable energy production, this means that monitoring systems are valuable only when managers and operating teams respond quickly and coherently.
Production technology risk occupies a central position in the mediation process. It reflects technological fragility and process instability arising from exogenous risks. Higher levels of production technology risk may prompt organizations to strengthen monitoring, interpretation, and response mechanisms, thereby enhancing early warning management effectiveness. This positive association is theoretically plausible because greater perceived technological instability can motivate more rigorous application of warning protocols and response routines.
Sustainable energy production efficiency is conceptualized as the performance outcome of coordinated knowledge resources, technology-risk interpretation and early warning response routines. In this study, it reflects reliable, stable, and resource-efficient production rather than a narrow engineering ratio alone. Prior research on climate-changing operational risk and sustainable capabilities indicates that an organization’s ability to successfully perform will be contingent on how well they prepare for and manage disruptions and not on their ownership of assets or capacity [18,20]. If the management of early warning systems is properly executed by an organization, they will have a greater ability to limit downtime, reduce fault escalation and continue producing at an efficient level. The following hypotheses are therefore proposed:
Hypothesis 5: Production technology risk has a significant effect on early warning management effectiveness.
Hypothesis 6: Early warning management effectiveness has a significant effect on sustainable energy production efficiency.
Hypothesis 7: Production technology risk mediates the relationship between the four exogenous risk dimensions and early warning management effectiveness.
Hypothesis 8: Production technology risk and early warning management effectiveness serially mediate the relationship between the four exogenous risk dimensions and sustainable energy production efficiency.
3. Research Methodology
Drawing on the integrated RBV-MHEWS framework, this study proposes a risk-capability-performance model in which four exogenous risks, human risk (HR), environmental risk (ER), management risk (MR), and equipment risk (EQR), influence sustainable energy production efficiency (SEPE) through the serial mediators of production technology risk (PTR) and early warning management effectiveness (EWME). The study adopts a quantitative explanatory design and employs a combination of Partial Least Squares Structural Equation Modeling (PLS-SEM) and fuzzy-set Qualitative Comparative Analysis (fsQCA) to examine both net effects and indirect relationships, as well as alternative configurational pathways leading to high efficiency [26,27,28].
3.1. Research Methods and Design
This study is grounded in a post-positivist paradigm and follows a deductive research logic. The RBV-MHEWS framework was translated into observable constructs and tested through a cross-sectional survey of respondents with direct knowledge of production, maintenance, safety, monitoring, and warning-response processes.
Eritrea was selected as an appropriate empirical context because it represents a resource-constrained energy system in which production efficiency, operational reliability, and sustainable-energy expansion are closely connected. The country faces infrastructure and capacity constraints that make maintenance routines, workforce competence, monitoring practices, and rapid response mechanisms particularly important. This context allows the study to examine whether risk-related organizational capabilities help explain sustainable energy production efficiency under conditions where technical redundancy, financial resources, and replacement capacity may be limited. The Eritrean setting is therefore theoretically relevant for extending RBV and MHEWS perspectives to developing-country energy systems and practically relevant for identifying managerial and policy levers that support SDG 7 implementation.
PLS-SEM was selected as the principal analytical technique because the proposed model is relatively complex, incorporates multiple mediation paths, and is oriented toward both explanation and prediction. The method is particularly suitable for theory development and extension, latent-variable modeling, and predictive assessment in models with multiple indicators and interrelated structural paths [29,30]. To complement this symmetric analysis, fsQCA was employed as a second-stage configurational technique. Unlike PLS-SEM, which estimates the magnitude and significance of net linear effects, fsQCA captures equifinality, causal asymmetry, and conjunctural causation by identifying combinations of conditions that are sufficient for the outcome of interest [26,31,32].
3.2. Population Sampling
Data were collected from 300 professional respondents working in different roles within the sustainable energy production sector. A key informant approach was used because the study focuses on organizational routines, technological conditions, and warning-response capabilities best assessed by personnel with direct operational responsibility. Using purposive, criterion-based sampling, the study targeted organizations involved in sustainable energy production and key informants directly engaged in production, maintenance, safety, monitoring, and early warning response. Participants were drawn from different operating contexts where access permitted. The finalized sample size surpassed the suggested minimum sample threshold for PLS-SEM, and provided sufficient range of data to meet the requirements of fsQCA [27].
3.3. Measurement Instrument
Data were collected using a structured questionnaire developed from the conceptual definitions in the literature and adapted from validated measures of organizational risk, technological reliability, early warning systems, and sustainability-related performance. The instrument translated the seven main constructs into meaningful, multi-item measures while preserving the conceptual meaning of the original scales, using Likert scale response formats appropriate for assessing risk exposure, technological fragility, warning management capability, and sustainable energy production efficiency.
To improve clarity, contextual relevance, and content validity, the questionnaire was refined without altering conceptual equivalence. In line with the RBV-MHEWS framework, HR, ER, MR and EQR captured antecedent vulnerabilities; PTR reflected technological fragility and process instability; EWME measured the organization’s capacity to monitor, interpret, communicate and respond to warning signals; and SEPE assessed reliable and efficient sustainable energy production (Table 1).
3.4. Data Collection and Screening
The survey was administered through a mixed distribution approach to respondents with direct operational knowledge. Participation was voluntary and anonymous with each questionnaire including a cover letter explaining the research purpose and how it relates to the academic area of study. To minimize common method bias, several procedural remedies were implemented during questionnaire design, including the use of clear language, respondent anonymity, randomized question order, and psychological separation of predictors and outcome variables [33,34]. Although several procedural remedies were implemented to minimize common method bias, the possibility of residual bias cannot be entirely ruled out because all data were collected from a single source using self-reported measures.
Prior to data analysis, the answers were checked for missing cases, suspicious responding patterns, and outliers. Cases with excessive missing data or patterned responses were removed. Where missing data were limited and appeared random, appropriate treatment procedures were applied. Multivariate normality was not assumed, as is standard in PLS-SEM; instead, the data were examined for extreme skewness, kurtosis, and invalid response patterns [27,29]. Common method variance was further assessed using full collinearity analysis based on variance inflation factors [33,35]. The study followed all guidelines established by ethical research for studies involving human participants including obtaining informed consent from respondents, not reporting any personally identifiable information and ensuring that all organizational data collected was treated in a manner that would protect potentially commercially sensitive information.
3.5. Data Analysis Strategy
The empirical analysis proceeded in two complementary stages. First, PLS-SEM was employed to evaluate the reflective measurement model and test the hypothesized structural relationships, including direct, indirect, and serial mediation effects. Second, fsQCA was used to identify alternative configurations of antecedent risks and mediating conditions that were sufficient for high SEPE. This sequential design combined symmetric net-effect estimation with asymmetric configurational reasoning, thereby providing a more comprehensive account of the determinants of sustainable energy production efficiency [27,28].
3.5.1. PLS-SEM Analysis
PLS-SEM estimation followed established procedures for variance-based structural equation modeling. The reflective measurement model was assessed before interpretation of the structural model. Indicator reliability, internal consistency, convergent validity, and discriminant validity were assessed through outer loadings, composite reliability, AVE, and HTMT [27,29].
After establishing the measurement model’s reliability, the structural model was assessed in terms of collinearity statistics, path coefficients, coefficients of determination (R²), effect sizes (f²), and predictive relevance (Q²). Statistical significance was assessed through bootstrapping, and mediation was evaluated using bootstrapped indirect effects rather than stepwise significance procedures. Because the framework was prediction-oriented, out-of-sample predictive performance was also assessed. PLSpredict was used to compare model-based predictions with target estimations and evaluate whether the model offered practical predictive value beyond in-sample explanation [27,29].
3.5.2. Fuzzy-Set Qualitative Comparative Analysis (fsQCA)
Fuzzy-set Qualitative Comparative Analysis (fsQCA) was conducted to investigate whether multiple combinations of antecedent risks and mediating conditions were sufficient for sustainable energy production efficiency (SEPE). This step was important because SEPE in risk-intensive production environments is unlikely to be driven by a single dominant factor [26,28].
The fsQCA procedure started with calibration of the survey constructs into fuzzy sets using theoretically grounded and distribution-sensitive anchors. Necessity analysis was then performed, followed by sufficiency analysis based on the truth table. Consistency and coverage metrics were used to evaluate the empirical relevance of the resulting configurations [26,28]. In substantive terms, fsQCA can reveal that high SEPE may arise under consistent low-risk conditions and through compensatory configurations in which strong EWME offsets specific technological and environmental susceptibilities. These insights balance the PLS-SEM results by showing that effective early warning management and resilient technological arrangements can constitute alternative pathways to efficient and sustainable production even when some antecedent risks remain present.
3.6. Robustness
To enhance analytical integrity, the study used PLS-SEM and fsQCA findings in a transparent method. For PLS-SEM, this includes factor loadings, reliability indices, AVE, HTMT, VIF, path coefficients, indirect effects, R², f², Q², and predictive assessment. In an fsQCA, the results include a description of the calibration used, provide the necessity results obtained, give a description of the truth-table used, provide the solution consistencies, and contain the raw coverages, exclusive coverages, and configuration-specific interpretations [27,28]. Furthermore, robustness checks consist of re-estimating the fsQCA solutions using alternative calibration anchors, comparing fsQCA models both with and without control variables, and examining the mediating effect when influential cases have been removed. Such checks are especially valuable because composite-based SEM and set theoretic analysis benefit from transparent sensitivity assessment. This combined methodological design provides a rigorous basis for investigating how risk conditions, technological susceptibilities, and early warning management capability shape sustainable energy production efficiency in complex operational environments.
3.7. Ethical Considerations
The study adhered to ethical principles of informed consent, confidentiality, anonymity and honest reporting. Participants received a written statement about the research purpose via a Google Forms link that was shared electronically. They were informed that the research was purely academic and that their participation was voluntary and anonymous. They received information about the procedures and potential risks. Furthermore, they could withdraw from the research at any time without reason if they felt it was inconvenient. All participants' personal information was kept anonymous. Participants' names and personal identifiers were not included in this study.
4. Results
This section presents the empirical findings for the integrated RBV–MHEWS framework. The results are organized into respondent profile (reported in the supplementary materials), measurement model assessment, structural relationships, model adequacy, exploratory multigroup analysis (reported in the supplementary materials), configurational evidence from fsQCA, and advanced result overviews. This structure follows recommended reporting practice for variance-based structural equation modeling and complementary set-theoretic analysis [27,28].
4.1. Demographic Information
A total of 300 valid responses were retained for analysis. As shown in (Table 2), the sample was male-dominated, with 193 male respondents (64.36%) and 107 female respondents (35.64%). In age terms, the largest segments were 36–45 years (30.55%) and 46–55 years (30.18%), followed by 26–35 years (20.18%). Educational attainment was concentrated at the bachelor’s degree level (41.45%) and master’s degree level (26.18%), whereas respondents with vocational training, doctoral-level education, and high school education constituted smaller proportions. In relation to work experience, the most represented categories were more than 20 years (28.00%) and 6–10 years (27.45%), indicating that the dataset reflects a comparatively experienced operational workforce. This profile is appropriate for assessing organizational risk, production technology, warning effectiveness, and efficiency outcomes.
The descriptive statistics suggest relatively elevated perceptions of operational and contextual risks. Environmental risk reported the highest mean score (mean = 3.989, standard deviation = 0.579), followed closely by production technology risks (mean = 3.963, standard deviation = 0.616) and human risk (mean = 3.900, standard deviation = 0.598). By contrast, equipment risk recorded the lowest mean (mean = 3.561, standard deviation = 0.634). Early warning management effectiveness (mean = 3.802, standard deviation = 0.645) and sustainable energy production efficiency (mean = 3.759, standard deviation = 0.588) were both above the midpoint of the scale but lower than the principal risk dimensions, indicating that respondents perceived risk exposure to be high while the translation of those conditions into warning effectiveness and efficiency outcomes remained comparatively moderate. Table 3 summarizes the results.
4.2. Measurement Model Assessment
4.2.1. Convergent Reliability and Validity Test
The measurement model was evaluated in terms of indicator reliability, internal consistency, convergent validity, and discriminant validity. As previously outlined in the existing guidelines regarding standardized loadings above 0.70 Appendix 1, composite reliability of indicators that have acceptable values within the composite reliability range of 0.70 – 0.90 indicate acceptable internal consistency, and average variance explained are measured to exceed an AVE of 0.50 support convergent validity [27,30]. The determination of discriminant validity was given by the HTMT using the heterotrait-monotrait ratio of correlations (HTMT), where an HTMT threshold of less than 0.85 is the more stringent standard and an HTMT threshold of less than 0.90 is the looser acceptable measure [36].
The results shown in (Table 4) indicate satisfactory measurement quality for reliability and convergent validity. The items are strongly loaded on their constructs, composite reliability ranges from 0.853 to 0.894, and AVE ranges from 0.545 to 0.592. These values satisfy widely used thresholds for reflective measurement assessment [27].
4.2.2. Discriminant Validity
The findings illustrated in (Table 5), discriminant validity results require cautious interpretation. While all HTMT values fall below the liberal threshold of 0.90, several exceed the more conservative threshold of 0.85 (e.g., HR-ER = 0.882, HR-PTR = 0.873). Given the conceptual overlap among the risk-related constructs, these values are still considered acceptable [36,37].
4.2.3. Collinearity Statistics (VIF): At Item and Construct Level
Collinearity statistics were reviewed at the item and construct level to determine if multicollinearity caused any issues for the analysis (Table 6). The item level VIF values were between 1.413 and 1.793 and the tolerance value was between 0.558 and 0.708 indicating that no indicators had problematic overlap with one another in the same construct.
The construct level VIF values were between 1.686 and 3.793 and the tolerance values were between 0.264 and 0.593. Compared to previous methodology investigations these values are below the generally accepted cut off of 5.0, as per Hair Jr et al. [37] with HR, PTR and SEPE just above the more conservative cut off of 3.3 as suggested by [38] for variance-based SEM. However, since none of the construct level VIF values were greater than 5.0 and all of the tolerance values were greater than 0.20, it can be concluded that multicollinearity is not a significant concern and does not impede the model's estimation robustness. Thus, the collinearity diagnostics indicated that the study variables are sufficiently distinct and that it is appropriate to proceed with additional analysis on them.
4.3. Structural Model (Inner Model) Results
4.3.1. Model Fit Results
The measurement model phase exhibited overall satisfactory fit for this model (Table 7). The SRMR scores below the common 0.08 criterion (in this case 0.070) indicate acceptable residual value-based fit within this analysis (although interpretation requires more complex data analysis). NFI values above .90 (in this instance .920) suggest that the specified model has acceptable to good comparative fit [39,40].
The overall size of the complete measure of model fit is based on two indices; d_ULS (unweighted least squares discrepancy measure) and d_G (geodesic distance measure), which produced values that are both small (d_ULS = 3.660; d_G = 2.381). However, absolute cutoff values (as specified in previous studies) cannot necessarily be established for either of these indices. A more thorough interpretation of these two indices will require that these values be assessed in relation to the values that are determined by the calculations of bootstrap confidence limits. Thus, both of these indices may provide some degree of evidence of fit, although their interpretation may remain cautious unless additional bootstrap exact-fit findings are determined from the analysis of the entire sample data [36,41].
The other supplement covariance-based fit indices indicate that the overall model demonstrates moderate to good fit against the other covariance-based measures (the RMSEA was found to equal .023 indicating close fit, CFI = .981 and TLI = .979 both indicate excellent incremental fit). While the chi-square value (χ² (644) = 828.17, p < .001) was significant, it is not unusual for large sample sizes to yield significant chi-square values. Furthermore, the ratio of chi-square to degrees of freedom, 1.29 (χ²/ df), indicates that this model has acceptable levels of global fit [39,42,44]..
4.3.2. Hypothesis Results
The structural model results (Table 8) support the proposed serial mediation chain, although the relationships appear more nuanced than a purely linear interpretation would suggest. The four exogenous risks collectively explain a substantial portion of the variance in production technology risk (R² = 0.691), with human risk showing the strongest association (β = 0.349, p < 0.001; Figure 2). Early warning management effectiveness was also positively related to sustainable energy production efficiency (β = 0.588, p < 0.001; R² = 0.346).
These findings indicate that production technology risk and early warning management effectiveness transmit the influence of exogenous risk conditions to sustainable energy production efficiency. The effect sizes for the paths from production technology risk to early warning management effectiveness (f² = 0.426) and from early warning management effectiveness to sustainable energy production efficiency (f² = 0.529) were large, highlighting the central role of these two mediating constructs.
4.3.3. Mediation Analysis Results
The serial indirect effects reinforce the mediation process (Table 9). Human risk exhibited the largest indirect effect on sustainable energy production efficiency via the two mediators (β = 0.112, 95% CI [0.078, 0.151]), followed by management risk (β = 0.068), environmental risk (β = 0.063), and equipment risk (β = 0.053). All confidence intervals did not contain zero, thereby lending empirical credence to the indirect mechanisms proposed. All serial indirect effects on sustainable energy production efficiency via production technology risk and early warning management effectiveness are significant, as their 95% confidence intervals exclude zero. Human risk exhibits the largest indirect effect.
4.4. Model Adequacy, Effect Size, and Sample Size Sufficiency
The structural model showed adequate explanatory power, with R² values of 0.691 for production technology risk, 0.299 for early warning management effectiveness, and 0.346 for sustainable energy production efficiency. The main mediation pathways showed large effect sizes, with f² = 0.426 for the path from production technology risk to early warning management effectiveness, and f² = 0.529 for the path from early warning management effectiveness to sustainable energy production efficiency. The sample size of 300 was adequate for PLS-SEM model estimation.
Overall, the model demonstrates reasonable explanatory power for the proposed risk-capability-performance mechanism. However, the low value of R² related to the final dependent variable indicates some other predictors that affect sustainable energy production efficiency outside the scope of this model. The obtained results are tentative because of the cross-sectional nature of this study.
4.5. Fuzzy-Set Qualitative Comparative Analysis (fsQCA) Results
To complement the net-effect logic of PLS-SEM, fuzzy-set qualitative comparative analysis was used to examine whether multiple combinations of conditions can lead to high sustainable energy production efficiency (Table 10, Table 11 and Table 12). Following established practice, fuzzy sets were calibrated using the 10th percentile as full non-membership, the 50th percentile as the crossover point, and the 90th percentile as full membership [28]. Consistency and coverage were used to assess the sufficiency and empirical relevance of the resulting configurations [45].
The fsQCA results suggested equifinality. High sustainable energy production efficiency can be achieved through several sufficient configurations rather than through a single universal pathway. The first configuration, which combines the high-set presence of all conditions, exhibits the broadest empirical coverage. Other accepted configurations indicate that high efficiency can still emerge when one condition is absent or weak, provided that the remaining conditions, especially production technology risks and early warning management effectiveness, are sufficiently strong. In this sense, the configurational results converge with the PLS-SEM findings by again positioning technology-related readiness and warning effectiveness at the center of the explanatory mechanism.
4.6. Advanced Results Overviews
4.6.1. Confirmatory Tetrad Analysis (CTA-PLS)
CTA-PLS was employed to examine whether the reflective specification assigned to the constructs was empirically consistent with the data. In confirmatory tetrad analysis, a reflective measurement model is supported when the model-implied non-redundant tetrads are not significantly different from zero; however, this statistical evidence should be interpreted together with theoretical justification rather than treated as a purely mechanical decision rule [29,46,47,48].
In the present study, the mean absolute tetrad values were very small across all constructs, ranging from 0.0047 for management risk to 0.0201 for EWME (Table 13) and (Figure 3). These low values indicate that, in general, the indicators tended to covary as manifestations of common latent concepts. This overall pattern is broadly consistent with previous research in which CTA-PLS supported reflective operationalization when tetrad values were close to zero and the empirical pattern matched the underlying theory. For instance, Martínez Avila et al. [49] reported empirical support for a reflective specification, and Hemrungrojn et al. [50] likewise found that their latent vectors were not misspecified as reflective. In the current results, management risk showed the clearest reflective structure, with no significant tetrads, while human risk, environmental risk, and equipment risk displayed only limited proportions of significant tetrads, suggesting comparatively acceptable, although not unambiguous, support for reflective measurement.
The results further suggest that the strength of support for reflective measurement is not uniform throughout all of the constructs. According to the original CTA-PLS framework, when a construct is referenced as reflective, all tetrads implied by that construct's model must be zero. Consequently, if there is even one tetrad that does not have a z=0 result, then there is sufficient evidence to question its reflective classification. Recently, studies related to methodology have continued to support both this strict application of quadratic tetrad tests and have emphasized the importance of performing multiple-testing adjustments in tetrad evaluation. Therefore, as the number of significant tetrads increases for constructs PTR, SEPE, and especially EWME, it is cautioned that these three constructs do not as clearly support a purely reflective type of relationship with the model as do the other dimensions of risk covered in this investigation.
Confirmatory tetrad analysis (CTA-PLS) provided mixed support for the reflective measurement specification. Management risk showed the strongest reflective structure (no significant tetrads), while production technology risk, early warning management effectiveness, and sustainable energy production efficiency displayed a higher proportion of significant tetrads. These results suggest that some constructs may benefit from further refinement or alternative specification in future research.
4.6.2. Importance-Performance Map Analysis (IPMA)
Table 14 and (Figure 4) present the importance–performance map analysis (IPMA) results for SEPE. In PLS-SEM, IPMA complements the structural model by examining each antecedent in terms of both its importance, reflected in the total effect on the target construct, and its performance, reflected in the average latent variable score, thereby supporting the prioritization of managerial actions [51,52,53]. When the performance values are compared with the commonly used midpoint benchmark of 50 on the 0–100 IPMA scale, all constructs were considered to exhibit acceptable performance as their scores range from 60.430 to 69.446 [54]. However, IPMA interpretation depends not only on whether a construct exceeds the midpoint threshold, but also on whether it combines high importance with less-than-optimal performance. From this perspective, EWME emerges as the most critical construct because it records the highest importance value (0.588) while showing only moderate performance (62.677). This result suggests that improvements in EWME are likely to yield the greatest incremental gains in SEPE. PTR is the second most influential construct; however, the priority of PTR is lower than EWME even though it has a high importance score (0.322) and performance score (65.414) indicating that it is an important managerial lever. On the other hand, HR has the highest performance score (69.446), but it has a low importance score (0.112) which suggests that HR should be maintained and not targeted as the primary area for intervention. MR (0.068; 60.430), ER (0.063; 66.323) and EQR (0.054; 62.008) perform above the midpoint benchmark; however, their total effects are relatively weak indicating they are secondary drivers of SEPE.
The importance-performance map analysis highlights early warning management effectiveness as the highest-priority construct for improving sustainable energy production efficiency, due to its strong total effect combined with only moderate performance.
These findings align with the earlier RBV-MHEWS framing. RBV would expect operationally deployable capabilities to exert the strongest leverage on sustainability outcomes, whereas MHEWS would assign a central role to monitoring, warning, communication, and response capability. The dominance of EWME and PTR is therefore theoretically coherent and also consistent with prior sustainability and resilience research that treats technology and warning capacity as key drivers of sustainable energy production efficiency.
4.6.3. Finite Mixture (FIMIX) Segmentation
To assess whether the sample was characterized by unobserved heterogeneity, a FIMIX-PLS procedure was estimated. Methodological guidance recommends that the number of segments should not be chosen on the basis of a single fit statistic; instead, information criteria should be interpreted jointly with entropy and the substantive usefulness of the resulting class sizes [55,56]. On this basis, the three-segment solution appears to provide the most defensible representation of the data. Figure 5 demonstrates that the Bayesian information criterion (BIC) has a minimum value of 7614.89 at three segments, and the highest value for entropy is found at this solution (0.946), indicating that its classification quality is relatively high. Although the three-segment solution can still be interpreted substantively, the smallest segment, which represents 14.4% of total sample size, is not significant. The AIC3 decreases as more segments are removed, which helps with the increased model complexity, but it doesn't fully support the five-segment solution because the smallest class is only 4.0%. The CAIC exhibits a minor preference for only two segments; however, the evidence suggests nonhomogeneous data and provides an acceptable balance between parametric diversity, class differentiation, and usability of each segment for the three-segment solution (Hair et al., 2016; Sarstedt et al., 2011).
A complete and comprehensive understanding of the three-segment solution is possible with the help of segment average values (Figure 6). A high-performance profile is established in segment 1, which comprises 54.7% of the sample and has high values across all constructs involved in the study. Segment 2 (14.4%) can be interpreted as a vulnerable low-capability group, as it records the weakest values across all constructs, particularly on equipment risk and early warning management effectiveness. Segment 3 (30.9%) occupies an intermediate position and may therefore be interpreted as a transitional group. Substantively, these results suggest that the global model may mask meaningful between-group differences. Findings from previous investigations [57,58] indicate that the presence of unobserved variability among individuals can distort aggregated parameter estimates and hide segment-specific patterns that are of theoretical and managerial significance.
4.6.4. Prediction-Oriented Segmentation (POS)
Prediction-oriented segmentation (POS) was estimated as a complementary (Figure 7), prediction-focused procedure. Unlike FIMIX-PLS, which is primarily used to detect latent heterogeneity and identify a plausible number of latent classes, POS seeks to form groups that improve out-of-sample predictive performance [59,60]. From this perspective, the two-segment solution is preferred. The segmented version creates an RMSE of 0.301 on SEPE and produces the highest value for Q² predict (0.737) among the non-segment basis (CV-RMSE = 0.305 and Q² = 0.730). Despite these numerical enhancements are fairly small, they are important in a predictive framework because an improvement in fit is often assessed by incremental increases in withstand predictions rather than how a model predicts when applied to a dataset [60,61].
The POS profiles are substantively interpretable, as shown in Figure 7. The higher group can be interpreted as the majority group with strong performance, with higher scores on the antecedents, EWME, and SEPE. Smaller groups reflect groups with weaker performance and lower levels in the same dimensions, especially those related to equipment, technology, and early warning effectiveness. Importantly, POS does not contradict FIMIX's findings; Instead, it complements them. Taken together, the two approaches suggest true but moderate heterogeneity in the sample, and that a single uniform intervention is unlikely to have a uniform effect on all units in the sample. In this sense, FIMIX provides richer interpretive segmentation, while POS provides more concise and predictively efficient segmentation, which is consistent with previous potential PLS-SEM studies [55,58,62].
5. Conclusion and Implications
This study examined how exogenous safety risks influence sustainable energy production efficiency in a resource-constrained setting. The findings indicate that human, environmental, management, and equipment risks are associated with higher production technology risk. In turn, production technology risk is positively related to early warning management effectiveness, which strongly predicts sustainable energy production efficiency. Human risk exerts the strongest influence on production technology risk.
The results further provide a linkage to an explanatory pathway for how risk exposure impacts sustainable energy production efficiency through production technology risk and early warning management effectiveness. Complementing these net effects, the configurational evidence shows that high efficiency can emerge through multiple combinations of conditions rather than through a single uniform pathway. Collectively, the study demonstrates that sustainable energy production efficiency should be understood not merely as a technical output, but as a capability-driven outcome shaped by how organizations anticipate, interpret, and respond to risk in real time.
The Eritrea-specific interpretation of these results is important. In resource-constrained energy production systems, human, equipment, management, and environmental risks could have stronger significances because operational buffers are inadequate. When there is scarcity of spare parts, old assets, or constrained maintenance budgets, comparatively minor failures can escalate into wider production uncertainty. Similarly, when there is limited monitoring and communication routines, early warning signals could not transform into appropriate action. The finding that early warning management effectiveness strongly predicts sustainable energy production efficiency therefore suggests that efficiency improvements in Eritrea should not be pursued only through capacity expansion or technology acquisition. They also require institutional routines that support detection, interpretation, escalation, coordination, and corrective response.
5.1. Theoretical Implication
This research offers three main theoretical contributions. First, it extends the Resource-Based View and the knowledge-management literature by positioning safety monitoring, risk interpretation and response routines as strategic knowledge resources that enhance efficiency under uncertainty. Second, it integrates RBV with MHEWS to explain the mechanisms through which exogenous risks affect efficiency via production technology risk and early warning processes. Third, the combined use of PLS-SEM and fsQCA demonstrates both net effects and equifinal configurational pathways to sustainable energy production efficiency.
5.2. Practical Implications
Managers should look beyond physical assets and strengthen the knowledge routines, maintenance learning systems and warning-response capabilities that enable sustainable energy production efficiency. Enhancing the organization's characteristics may result in improved production technology stability and thus provide an increase in performance through increased effectiveness of early warning management. In resource-constrained settings such as Eritrea, this requires ongoing dedication to developing the workforce’s capabilities, developing proactive maintenance and fault diagnosis systems, establishing employee monitoring systems, and developing communication infrastructures that permit early interventions to prevent disruptions.
The results also have policy implications for SDG 7 implementation in Eritrea and other developing countries. Policy makers should consider maintenance capability, reliability, and early warning as an integral part of the energy access strategy rather than just a technical consideration. The increase in renewable production capacity will help achieve SDG 7 to a greater extent when the country adopts some form of risk-based maintenance program, employee training, spare parts supply chains, fault identification, and real-time monitoring at the national or sectoral level. Thus, policy makers should convoy their efforts to offer sustainable energy production through solar, wind, geothermal, and mini-grids with organized measures to enhance operational management. This can be attained by adopting standards of safety and maintenance for sustainable energy plants, reporting of production disruption incidents, skill enhancement for technicians and supervisors, and coordination between sustainable energy production managers, supervisors, and local administrations. All of these steps would help advance SDG 7.1 on reliable access, SDG 7.2 on renewable energy investments, and SDG 7.3 on losses and inefficiency.
5.3. Managerial Implications
Management's most immediately actionable leverage point is the relationship between production technology risk and the effectiveness of early warning management. Managers should develop knowledge-governance practices that formalize escalation protocols, support timely interpretation of warning signals, strengthen cross-functional coordination and reinforce disciplined maintenance oversight. Because of the significant impact of human risk on production technology risk, organizations should also make it a strategic priority to develop training programs, compliance evaluations, measured reporting and closely supervised operational practices. Rather than reactively responding to faults or applying a standard approach through best practices, organizations should adopt integrated and context-specific risk governance systems that consider monitoring, workforce maintenance and risk response as one system.
For managers, the results imply that institutional capacity should be developed at the facility level as well as at the sector level. The sustainable energy sector should institutionalize the early warning management process, define principles for growth, maintain their risk registers efficient, and ensure that the data obtained from monitoring processes are analyzed by responsible people. Managers should connect human resource development with risk reduction by ensuring regular training of employees on safety, fault detection, emergency procedures, and preventive maintenance. Moreover, equipment risk management should be backed up by asset history, critical spares, and prioritization of maintenance activities. This is crucial in Eritrea due to resource constraints. A disciplined early warning and maintenance culture can therefore help organizations sustain production efficiency even when infrastructure and financial constraints remain present.
5.4. Limitations and Future Research Directions
The main limitations are the cross-sectional design, which restricts causal inference, reliance on perceptual key-informant data from one national context; and several borderline discriminant-validity values that should be reassessed in future studies. In addition, the global model masks moderate unobserved heterogeneity, as revealed by segmentation analyses.
The national situation may thus be viewed as having advantages as well as disadvantages. Although Eritrea presents a study for analyzing sustainable energy production within limitations, the measurements of the country’s institutions, infrastructure, and economy could not match with other developing countries. Thus, future research should consider associating Eritrea to other similar nations at different levels of sustainable energy employment and institutional development. Future research may consider including objective measures of power outages, backlogs, generation capability, energy loss, and rural access success. Furthermore, future research may consider analyzing variables at the policy level, such as regulatory quality, training programs, government capacity to invest, and donor/development finance involvement to assess whether institutional capability at the national level influences the impact of operational risk on sustainable energy production efficiency.
Future studies should employ longitudinal and multi-source designs, incorporate objective performance metrics, and test the framework across different countries, energy technologies, and levels of digital maturity. Mixed-methods approaches would also help illuminate how managers interpret and act on warning signals under operational constraints.
Supplementary Materials
Author Contributions
Conceptualization, Z.Y. Medin and Fan Luo; methodology, Z.Y. Medin and Fan Luo; software, Z.Y. Medin; validation, Z.Y. Medin and Fan Luo; formal analysis, Z.Y. Medin and Fan Luo; investigation, Z.Y. Medin; resources, Z.Y. Medin; data curation, Z.Y. Medin and Fan Luo; writing—original draft preparation, Z.Y. Medin and Fan Luo; writing—review and editing, Z.Y. Medin and Fan Luo.; visualization, Z.Y. Medin and Fan Luo; supervision, Fan Luo; project administration, Z.Y. Medin and Fan Luo; funding acquisition, Z.Y. Medin and Fan Luo. All authors have read and agreed to the published version of the manuscript.
Funding
This research received no external funding.
Institutional Review Board Statement
Not applicable.
Informed Consent Statement
All participants gave their consent to participate in this study before any sort of data gathering occurred, and were anonymous during both the collection and analysis of their data. There were no instances where personally identifiable information was gathered during this study.
Data Availability Statement
The data will be available from the corresponding author upon reasonable request.
Acknowledgments
The authors would like to thank all survey respondents for their insightful feedback. We appreciate Mrs. Trhas Ghebrebrhan and other families for their moral support and encouragement and we would like to thank the China Scholarship Council (CSC), and Wuhan University of Technology for granting us the scholarship awards. During the preparation of this manuscript, the authors used Grammarly for language polishing, grammar checking, and formatting assistance. The authors have reviewed and edited the output and take full responsibility for the content of this publication.
Conflicts of Interest
The authors declared no potential conflicts of interest with respect to the research, authorship, and publication of this article.
Declaration: of GenAI use. The authors used Claude Sonnet 5.5 (Anthropic) on 5 November 2026 to check grammar and improve the clarity of the English text. The authors reviewed and edited all AI-assisted text to ensure that the scientific content, data, analyses, and citations are their own and accurate. No AI tool was used to generate data, results, or references. The authors take full responsibility for the content of the manuscript.
Appendix A

Table A1.
Indicator loadings for the reflective measurement model.
| Construct | Indicator | Loading |
| Human Risk (HR) | HR1 | 0.758 |
| HR2 | 0.724 | |
| HR3 | 0.73 | |
| HR4 | 0.733 | |
| HR5 | 0.745 | |
| HR6 | 0.773 | |
| Environmental Risk (ER) | ER1 | 0.732 |
| ER2 | 0.735 | |
| ER3 | 0.746 | |
| ER4 | 0.733 | |
| ER5 | 0.734 | |
| ER6 | 0.749 | |
| ER7 | 0.741 | |
| Management Risk (MR) | MR1 | 0.768 |
| MR2 | 0.731 | |
| MR3 | 0.759 | |
| MR4 | 0.751 | |
| MR5 | 0.754 | |
| Equipment Risk (EQR) | EQR1 | 0.747 |
| EQR2 | 0.769 | |
| EQR3 | 0.752 | |
| EQR4 | 0.731 | |
| EQR5 | 0.742 | |
| EQR6 | 0.75 | |
| Production Technology Risk (PTR) | PTR1 | 0.754 |
| PTR2 | 0.74 | |
| PTR3 | 0.748 | |
| PTR4 | 0.774 | |
| PTR5 | 0.753 | |
| Early Warning Management Effectiveness (EWME) | EWME1 | 0.791 |
| EWME2 | 0.76 | |
| EWME3 | 0.744 | |
| EWME4 | 0.781 | |
| Sustainable Energy Production Efficiency (SEPE) | SEPE1 | 0.746 |
| SEPE2 | 0.768 | |
| SEPE3 | 0.74 | |
| SEPE4 | 0.72 | |
| SEPE5 | 0.742 |
References
- Teklebrhan, N.; et al. Strategies for integrating residential PV and wind energy in Eritrea’s electricity grid by imposing feed-in constraints in low voltage network. Sol. Energy 2025, 286, 113140. [Google Scholar] [CrossRef]
- Habtetsion, S.; Tsighe, Z. Energy sector reform in Eritrea: initiatives and implications. J. Clean. Prod. 2007, 15, 178–189. [Google Scholar] [CrossRef]
- Negash, T.; et al. System design issues of high renewable energy system, the case of Eritrea. Energy Policy 2026, 209. [Google Scholar] [CrossRef]
- Küfeoğlu, S. SDG-7 Affordable and Clean Energy, in Emerging Technologies: Value Creation for Sustainable Development; Küfeoğlu, S., Ed.; Springer International Publishing: Cham, 2022; pp. 305–330. [Google Scholar]
- Puthenkalam, J.J.; Masachika, S.; Kunar, N.A.V. Achieving Affordable and Reliable Energy Security: A Global Perspective, in Sustainable, Affordable, Reliable and Modern Energy: A Road Map for India; Puthenkalam, J.J., Chennattuserry, J.C., Cyriac, B., Eds.; Springer Nature Switzerland: Cham., 2026; pp. 5–28. [Google Scholar]
- Duroha, J.C.; Macht, G.A. Solar installation occupational risks: A systematic review. Saf. Sci. 2023, 160. [Google Scholar] [CrossRef]
- Eroğlu, H.; et al. Harmonic problems in renewable and sustainable energy systems: A comprehensive review. Sustain. Energy Technol. Assess. 2021, 48. [Google Scholar] [CrossRef]
- Harrou, F.; et al. Reliable fault detection and diagnosis of photovoltaic systems based on statistical monitoring approaches. Renew. Energy 2018, 116, 22–37. [Google Scholar] [CrossRef]
- Abdulla, H.; Sleptchenko, A.; Nayfeh, A. Photovoltaic systems operation and maintenance: A review and future directions. Renew. Sustain. Energy Rev. 2024, 195. [Google Scholar] [CrossRef]
- Akl, A.M.; et al. A Joint Optimization of Strategic Workforce Planning and Preventive Maintenance Scheduling: A Simulation–Optimization Approach. Reliab. Eng. Syst. Saf. 2022, 219. [Google Scholar] [CrossRef]
- Barney, J. Firm resources and sustained competitive advantage. J. Manag. 1991, 17, 99–120. [Google Scholar] [CrossRef]
- El Nemar, S.; et al. Resource-based view and sustainable advantage: a framework for SMEs. J. Strateg. Mark. 2022, 33, 798–821. [Google Scholar] [CrossRef]
- Hart, S.L. A natural-resource-based view of the firm. Acad. Manag. Rev. 1995, 20, 986–1014. [Google Scholar] [CrossRef]
- Aguirre-Ayerbe, I.; et al. An evaluation of availability and adequacy of Multi-Hazard Early Warning Systems in Asian countries: A baseline study. Int. J. Disaster Risk Reduct. 2020, 49. [Google Scholar] [CrossRef]
- Budimir, M.; et al. Opportunities and challenges for people-centered multi-hazard early warning systems: Perspectives from the Global South. iScience 2025, 28, 112353. [Google Scholar] [CrossRef] [PubMed]
- Kelman, I.; Fearnley, C.J. From multi-hazard early warning systems (MHEWS) to all-vulnerability warning systems (AVWS). iScience 2025, 28, 112977. [Google Scholar] [CrossRef] [PubMed]
- Rokhideh, M.; Fearnley, C.; Budimir, M. Multi-Hazard Early Warning Systems in the Sendai Framework for Disaster Risk Reduction: Achievements, Gaps, and Future Directions. Int. J. Disaster Risk Sci. 2025, 16, 103–116. [Google Scholar] [CrossRef]
- Khanra, S.; et al. A resource-based view of green innovation as a strategic firm resource: Present status and future directions. Bus. Strategy Environ. 2021, 31, 1395–1413. [Google Scholar] [CrossRef]
- Javed, W.; Guo, B.; Figgis, B. Modeling of photovoltaic soiling loss as a function of environmental variables. Sol. Energy 2017, 157, 397–407. [Google Scholar] [CrossRef]
- Juhola, S.; et al. Climate risks to the renewable energy sector: Assessment and adaptation within energy companies. Bus. Strategy Environ. 2023, 33, 1906–1919. [Google Scholar] [CrossRef]
- Teixeira, H.N.; Lopes, I.S. Supporting condition-based maintenance implementation: a methodology. J. Qual. Maint. Eng. 2025, 31, 48–82. [Google Scholar] [CrossRef]
- Zhou, N.; et al. Scheduling the Imperfect Maintenance and Replacement of Power Substation Equipment: A Risk-Based Optimization Model. IEEE Trans. Power Deliv. 2025, 40, 2154–2166. [Google Scholar] [CrossRef]
- Høiaas, I.; et al. Inspection and condition monitoring of large-scale photovoltaic power plants: A review of imaging technologies. Renew. Sustain. Energy Rev. 2022, 161. [Google Scholar] [CrossRef]
- Syamsuddin, A.; et al. Predictive maintenance based on anomaly detection in photovoltaic system using SCADA data and machine learning. Results Eng. 2024, 24. [Google Scholar] [CrossRef]
- Li, J.; et al. Risk evaluation of photovoltaic power systems: An improved failure mode and effect analysis under uncertainty. J. Clean. Prod. 2023, 414. [Google Scholar] [CrossRef]
- Fiss, P.C. Building better causal theories: A fuzzy set approach to typologies in organization research. Acad. Manag. J. 2011, 54, 393–420. [Google Scholar] [CrossRef]
- Hair, J.F.; et al. When to use and how to report the results of PLS-SEM. Eur. Bus. Rev. 2019, 31, 2–24. [Google Scholar] [CrossRef]
- Pappas, I.O.; Woodside, A.G. Fuzzy-set Qualitative Comparative Analysis (fsQCA): Guidelines for research practice in Information Systems and marketing. Int. J. Inf. Manag. 2021, 58. [Google Scholar] [CrossRef]
- Hair, J.; Alamer, A. Partial Least Squares Structural Equation Modeling (PLS-SEM) in second language and education research: Guidelines using an applied example. Res. Methods Appl. Linguist. 2022, 1, 100027. [Google Scholar] [CrossRef]
- Hair, J.F.; Howard, M.C.; Nitzl, C. Assessing measurement model quality in PLS-SEM using confirmatory composite analysis. J. Bus. Res. 2020, 109, 101–110. [Google Scholar] [CrossRef]
- Pu, G.; Suo, X. The synergy effect of digitization and servitization on enterprise resilience: a fuzzy-sets QCA approach. Bus. Process Manag. J. 2025, 1–20. [Google Scholar] [CrossRef]
- Meng, Q.; et al. Multiple configurational effects and analyses on construction workers’ unsafe behaviors: a qualitative approach of fuzzy-set qualitative comparative analysis. Int. J. Occup. Saf. Ergon. 2025, 1–18. [Google Scholar] [CrossRef] [PubMed]
- Podsakoff, P.M.; et al. Common method biases in behavioral research: a critical review of the literature and recommended remedies. J. Appl. Psychol. 2003, 88, 879–903. [Google Scholar] [CrossRef] [PubMed]
- Wamba, S.F.; et al. Big data analytics and firm performance: Effects of dynamic capabilities. J. Bus. Res. 2017, 70, 356–365. [Google Scholar] [CrossRef]
- Polas, M.R.H. Common Method Bias in Social and Behavioral Research: Strategic Solutions for Quantitative Research in the Doctoral Research. J. Compr. Bus. Adm. Res. 2025. [Google Scholar] [CrossRef]
- Henseler, J.; Ringle, C.M.; Sarstedt, M. A new criterion for assessing discriminant validity in variance-based structural equation modeling. J. Acad. Mark. Sci. 2015, 43, 115–135. [Google Scholar] [CrossRef]
- Hair, J.F., Jr.; et al. Partial Least Squares Structural Equation Modeling (PLS-SEM) using R: A Workbook; Springer Nature, 2021. [Google Scholar]
- Kock, N.; Lynn, G.S. Lateral collinearity and misleading results in variance-based SEM: An illustration and recommendations. J. Assoc. Inf. Syst. 2012, 13, 2. [Google Scholar] [CrossRef]
- Gaskin, J.E.; et al. Essential Validation Criteria for Rigorous Covariance-Based Structural Equation Modelling. Inf. Syst. J. 2025, 35, 1630–1661. [Google Scholar] [CrossRef]
- Henseler, J.; Hubona, G.; Ray, P.A. Using PLS path modeling in new technology research: updated guidelines. Ind. Manag. Data Syst. 2016, 116, 2–20. [Google Scholar] [CrossRef]
- Henseler, J.; et al. Testing measurement invariance of composites using partial least squares. Int. Mark. Rev. 2016, 33, 405–431. [Google Scholar] [CrossRef]
- Hu, L.t.; Bentler, P.M. Cutoff criteria for fit indexes in covariance structure analysis: Conventional criteria versus new alternatives. Struct. Equ. Model. A Multidiscip. J. 1999, 6, 1–55. [Google Scholar] [CrossRef]
- Dijkstra, T.K.; Henseler, J. Consistent Partial Least Squares Path Modeling1. Manag. Inf. Syst. Q. 2015, 39, 297–316. [Google Scholar] [CrossRef]
- Kline, R.B. Principles and Practice of Structural Equation Modeling, 5th ed.; Guilford publications: New York, London, 2023. [Google Scholar]
- Baumgartner, M.; Ambühl, M. Optimizing Consistency and Coverage in Configurational Causal Modeling. Sociol. Methods Res. 2021, 52, 1288–1320. [Google Scholar] [CrossRef]
- Bollen, K.A.; Ting, K.-f. A tetrad test for causal indicators. Psychol. Methods 2000, 5, 3. [Google Scholar] [CrossRef] [PubMed]
- Cefis, M.; et al. Detecting Causal Relations Among Indicators with the CTA Test: Simulations and Applications. Soc. Indic. Res. 2025, 178, 393–417. [Google Scholar] [CrossRef]
- Gudergan, S.P.; et al. Confirmatory tetrad analysis in PLS path modeling. J. Bus. Res. 2008, 61, 1238–1249. [Google Scholar] [CrossRef]
- Martínez Avila, M.; García-Machado, J.J.; Moreno, E. Fierro. A Multiple Full Mediating Effect in a PLS Hierarchical Component Model: Application to the Collaborative Public Management. Mathematics 2021, 9. [Google Scholar] [CrossRef]
- Hemrungrojn, S.; et al. Cognitive impairments predict the behavioral and psychological symptoms of dementia. Front Neurol. 2023, 14, 1194917. [Google Scholar] [CrossRef] [PubMed]
- Hauff, S.; et al. Importance and performance in PLS-SEM and NCA: Introducing the combined importance-performance map analysis (cIPMA). J. Retail. Consum. Serv. 2024, 78. [Google Scholar] [CrossRef]
- Ringle, C.M.; Sarstedt, M. Gain more insight from your PLS-SEM results. Ind. Manag. Data Syst. 2016, 116, 1865–1886. [Google Scholar] [CrossRef]
- Sarstedt, M.; et al. Combined importance–performance map analysis (cIPMA) in partial least squares structural equation modeling (PLS–SEM): a SmartPLS 4 tutorial. J. Mark. Anal. 2024, 12, 746–760. [Google Scholar] [CrossRef]
- Rahman, A.; et al. Examining the influence of deterrent and enhancement factors on QR-code mobile payment continuance intention: insights from PLS-SEM and IPMA analysis. Front Big Data 2025, 8, 1679897. [Google Scholar] [CrossRef] [PubMed]
- Hair, J.J.F.; et al. Identifying and treating unobserved heterogeneity with FIMIX-PLS: part I – method. Eur. Bus. Rev. 2016, 28, 63–76. [Google Scholar] [CrossRef]
- Sarstedt, M.; et al. Uncovering and treating unobserved heterogeneity with FIMIX-PLS: which model selection criterion provides an appropriate number of segments? Schmalenbach Bus. Rev. 2011, 63, 34–62. [Google Scholar] [CrossRef]
- Sarstedt, M.; Ringle, C.M. Treating unobserved heterogeneity in PLS path modeling: a comparison of FIMIX-PLS with different data analysis strategies. J. Appl. Stat. 2010, 37, 1299–1318. [Google Scholar] [CrossRef]
- Sarstedt, M.; et al. Latent class analysis in PLS-SEM: A review and recommendations for future applications. J. Bus. Res. 2022, 138, 398–407. [Google Scholar] [CrossRef]
- Becker, J.-M.; et al. Discovering Unobserved Heterogeneity in Structural Equation Models to Avert Validity Threats1. MIS Q. 2013, 37, 665–694. [Google Scholar] [CrossRef]
- Shmueli, G.; et al. Predictive model assessment in PLS-SEM: Guidelines for using PLSpredict. Eur. J. Mark. 2019, 53, 2322–2347. [Google Scholar] [CrossRef]
- Shmueli, G.; et al. The elephant in the room: Predictive performance of PLS models. J. Bus. Res. 2016, 69, 4552–4564. [Google Scholar] [CrossRef]
- Ratzmann, M.; Gudergan, S.P.; Bouncken, R. Capturing heterogeneity and PLS-SEM prediction ability: Alliance governance and innovation. J. Bus. Res. 2016, 69, 4593–4603. [Google Scholar] [CrossRef]
Figure 1.
Proposed research model.
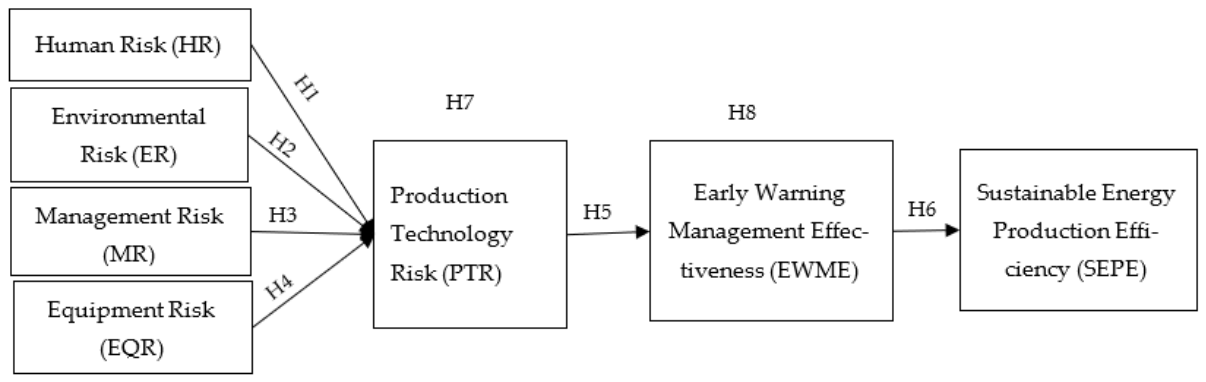
Figure 2.
PLS-SEM structural model with standardized path coefficients and explained variance.
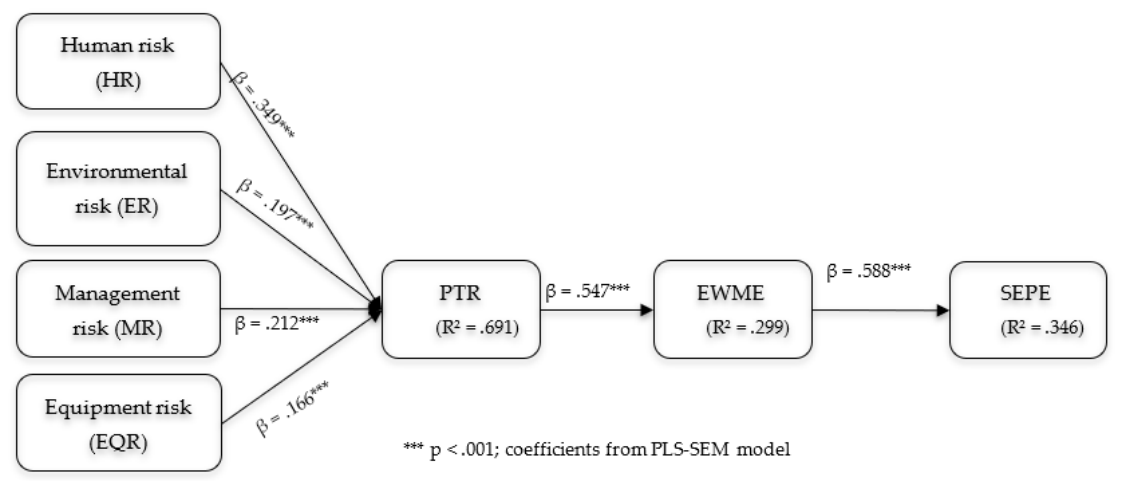
Figure 3.
Share of significant tetrads by construct.
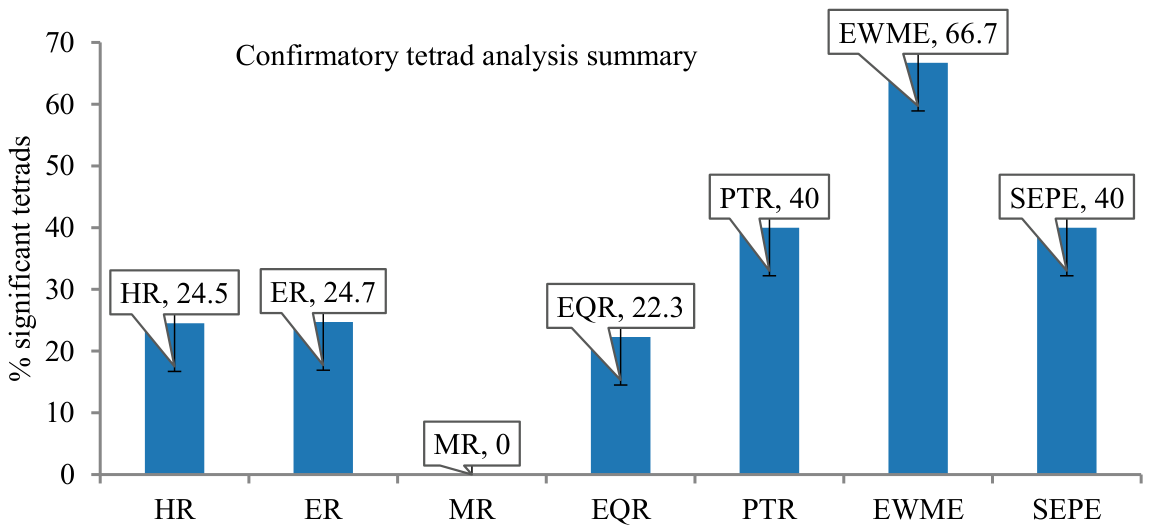
Figure 4.
Importance-performance map for SEPE.
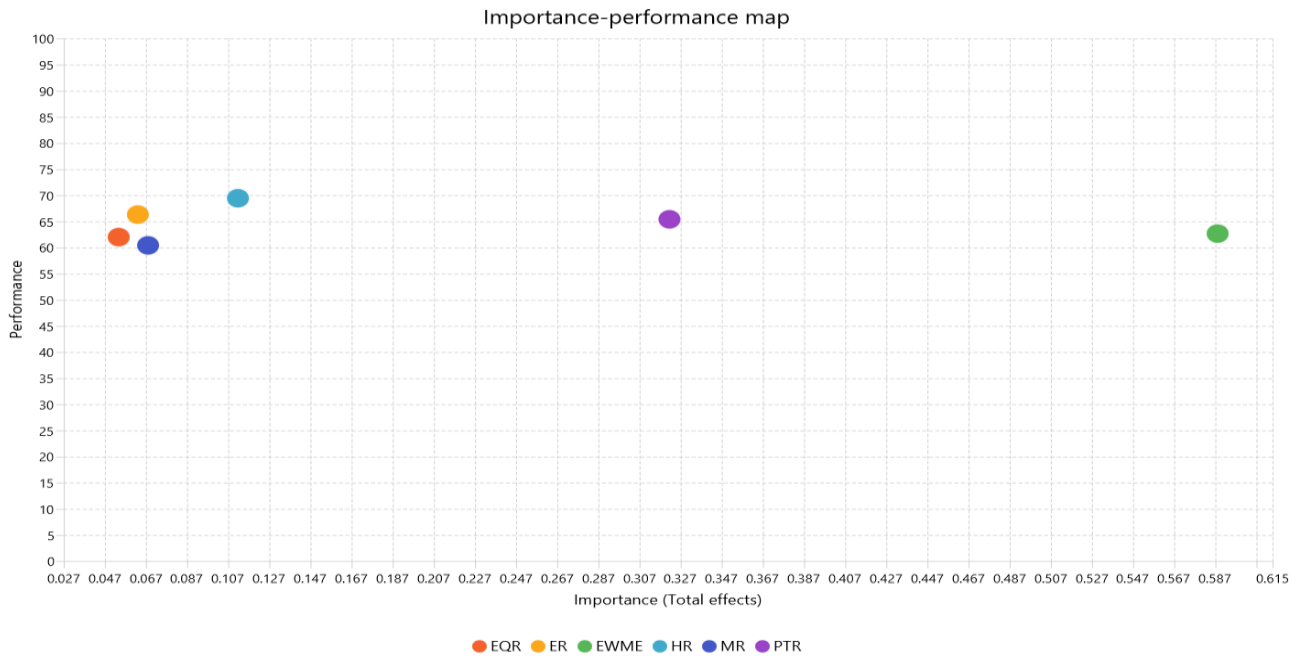
Figure 5.
FIMIX Information criteria and Entropy. Note: FIMIX = finite mixture; AIC3 = modified Akaike information criterion; BIC = Bayesian information criterion; CAIC = consistent Akaike information criterion.
Figure 5.
FIMIX Information criteria and Entropy. Note: FIMIX = finite mixture; AIC3 = modified Akaike information criterion; BIC = Bayesian information criterion; CAIC = consistent Akaike information criterion.
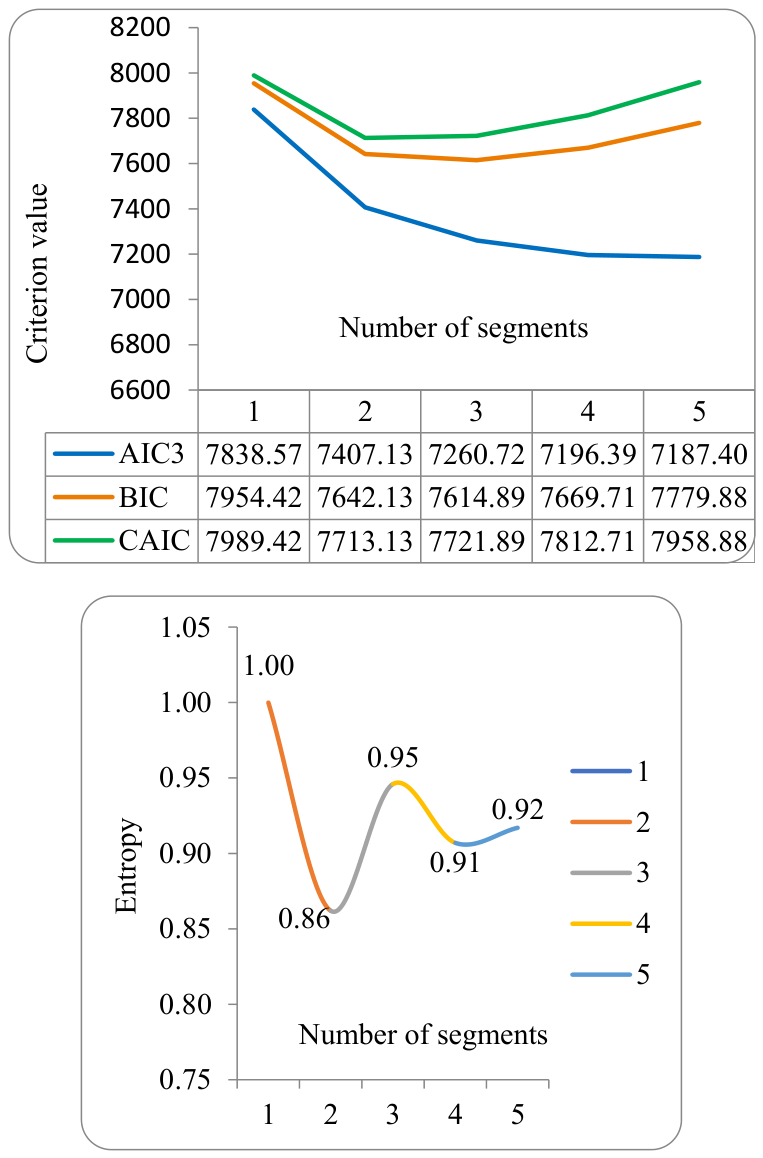
Figure 6.
Three-Segment FIMIX Profile Means.
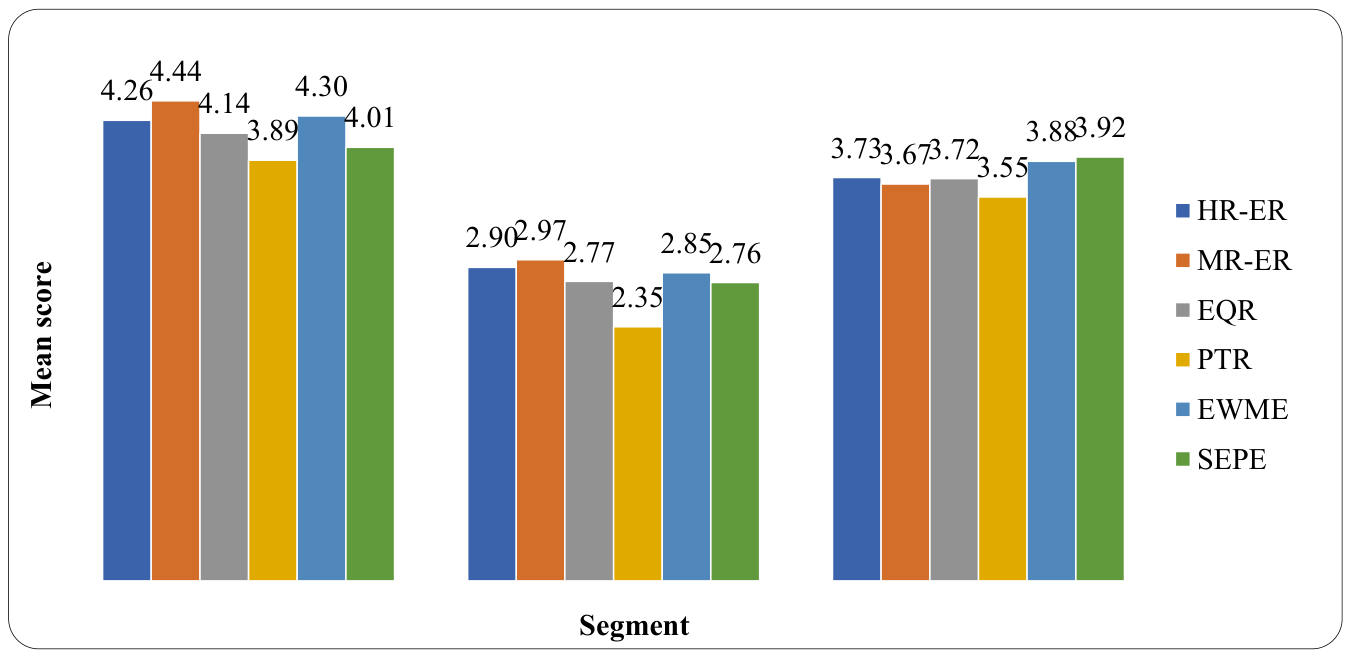
Figure 7.
POS segmentation performance.
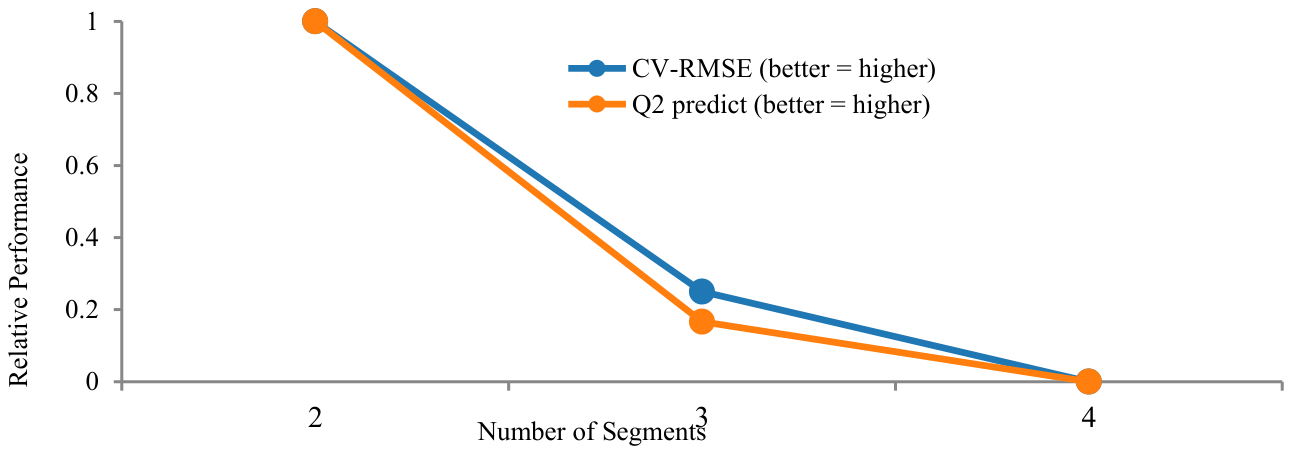
Table 1.
The analytical role of the study constructs.
| Construction | code | Analytical role | Conceptual position in the model |
| Human risk | HR | Exogenous | Workforce-related exposures affecting production and safety processes |
| Environmental risk | ER | Exogenous | The impact of external environmental and disaster-related stresses on operational stability |
| Management risk | MR | Exogenous | Weaknesses in management's planning, coordination, and control |
| Equipment risk | EQR | Exogenous | Technical and maintenance-related risks associated with machinery and assets |
| Production technology risk | PTR | Mediator 1 | Technical and process constraints translate upfront risk into operational disruption |
| Effectiveness of early warning management | EWME | Mediator 2 | Monitoring, early warning, communication and response capabilities |
| Sustainable energy production efficiency | SEPE | Dependent | Operational efficiency, reflection on consequences, reliable and sustainable production |
Table 2.
Demographic profile of respondents.
| Variable | Category | Number of Respondents | Percent |
| Educational Background | High school | 11 | 3.82 |
| Vocational training | 45 | 14.91 | |
| Bachelor's degree | 124 | 41.45 | |
| Master's degree | 79 | 26.18 | |
| PhD and above | 41 | 13.64 | |
| Working Experience | <5 years | 43 | 14.18 |
| 6–10 years | 82 | 27.45 | |
| 11–15 years | 56 | 18.73 | |
| 16–20 years | 35 | 11.64 | |
| >20 years | 84 | 28.00 | |
| Gender | Male | 193 | 64.36 |
| Female | 107 | 35.64 | |
| Age | ≤25 years | 34 | 11.27 |
| 26–35 years | 61 | 20.18 | |
| 36–45 years | 92 | 30.55 | |
| 46–55 years | 91 | 30.18 | |
| ≥56 years | 23 | 7.82 |
Table 3.
Descriptive statistics of the study constructs.
| Construct | Mean | SD |
| HR | 3.9 | 0.598 |
| ER | 3.989 | 0.579 |
| MR | 3.813 | 0.597 |
| EQR | 3.561 | 0.634 |
| PTR | 3.963 | 0.616 |
| EWME | 3.802 | 0.645 |
| SEPE | 3.759 | 0.588 |
Note: HR = Human Risk; ER = Environmental Risk; MR = Management Risk; EQR = Equipment Risk; PTR = Production Technology Risk; EWME = Early Warning Management Effectiveness; SEPE = Sustainable Energy Production Efficiency; SD = standard deviation.
Table 4.
Reliability and convergent validity Results.
| Construct | Cronbach alpha | Composite Reliability | AVE |
| Human Risk | 0.838 | 0.881 | 0.554 |
| Environmental Risk | 0.861 | 0.894 | 0.545 |
| Management Risk | 0.808 | 0.867 | 0.566 |
| Equipment Risk | 0.842 | 0.884 | 0.56 |
| Production Technology Risk | 0.81 | 0.868 | 0.568 |
| Early Warning Management Effectiveness | 0.77 | 0.853 | 0.592 |
| Sustainable Energy Production Efficiency | 0.796 | 0.861 | 0.553 |
Note: AVE = average variance extracted.
Table 5.
HTMT matrix for discriminant validity Results.
| Construct | HR | ER | MR | EQR | PTR | EWME | SEPE |
| HR | |||||||
| ER | 0.882 | ||||||
| MR | 0.811 | 0.821 | |||||
| EQR | 0.836 | 0.848 | 0.842 | ||||
| PTR | 0.873 | 0.815 | 0.840 | 0.868 | |||
| EWME | 0.627 | 0.611 | 0.696 | 0.726 | 0.692 | ||
| SEPE | 0.872 | 0.807 | 0.861 | 0.802 | 0.862 | 0.748 |
Note: HTMT = heterotrait-monotrait ratio; HR = Human Risk; ER = Environmental Risk; MR = Management Risk; EQR = Equipment Risk; PTR = Production Technology Risk; EWME = Early Warning Management Effectiveness; SEPE = Sustainable Energy Production Efficiency.
Table 6.
Collinearity statistics (VIF) Results.
| Construct | Item Level VIF range | Item Level Tolerance range | Construct level VIF | Tolerance |
| HR | 1.563-1.793 | 0.558-0.640 | 3.645 | 0.274 |
| MR | 1.471-1.624 | 0.616-0.680 | 3.209 | 0.312 |
| ER | 1.638-1.749 | 0.572-0.610 | 3.068 | 0.326 |
| EQR | 1.604-1.756 | 0.569-0.623 | 3.097 | 0.323 |
| PTR | 1.532-1.689 | 0.592-0.653 | 3.478 | 0.288 |
| SEPE | 1.467-1.632 | 0.613-0.682 | 3.793 | 0.264 |
| EWME | 1.413-1.584 | 0.631-0.708 | 1.686 | 0.593 |
Note: VIF = variance inflation factor; HR = Human Risk; MR = Management Risk; ER = Environmental Risk; EQR = Equipment Risk; PTR = Production Technology Risk; SEPE = Sustainable Energy Production Efficiency; EWME = Early Warning Management Effectiveness.
Table 7.
Model Fit Results.
| Fit index | Results | Benchmark | Suggestions |
| SRMR | 0.07 | < 0.08 indicates acceptable model fit [36,42]. | Indicates good overall model fit. |
| NFI | 0.92 | > 0.90 treated as acceptable in practice, although interpretation in composite models should remain cautious [36]. | Suggests acceptable to good comparative fit. |
| d_ULS | 3.66 | Lower values are preferable; the strongest assessment compares the original value with bootstrap [43]. | Supports fit, but exact-fit confirmation requires bootstrap comparison. |
| d_G | 2.381 | Lower values are preferable; interpretation should rely on bootstrap rather than a fixed universal cutoff [43]. | Supports fit, but exact-fit confirmation requires bootstrap comparison. |
| Chi-square (χ²) | 828.17 (df = 644, p < .001) | A non-significant value is preferred, but chi-square is highly sensitive to sample size and model complexity [44]. | Significant, but not unusual for a model of this size. |
| χ²/df | 1.29 | < 3.00 is commonly viewed as desirable in applied SEM reporting [44]. | Indicates low discrepancy relative to model complexity. |
| RMSEA | 0.023 | < 0.06 indicates close fit; values below 0.08 are generally acceptable [42,44]. | Shows excellent approximate fit. |
| CFI | 0.981 | > 0.95 indicates excellent fit; > 0.90 is typically acceptable [42,44]. | Shows excellent incremental fit. |
| TLI | 0.979 | > 0.95 indicates excellent fit; > 0.90 is typically acceptable [42,44]. | Shows excellent fit after parsimony adjustment. |
Note: SRMR = standardized root mean squares residual; NFI = normed fit index; d_ULS = unweighted least squares discrepancy; d_G = geodesic distance; χ² = chi-square; df = degrees of freedom; RMSEA = root mean square error of approximation; CFI = comparative fit index; TLI = Tucker–Lewis’s index.
Table 8.
Structural path coefficients, explained variance, and effect sizes.
| Path | β | SE | T statistics | p value | 95% CI | R2 | f² | Decision |
| HR → PTR | 0.349 | 0.044 | 7.900 | <0.001 | [0.260, 0.436] | 0.691 | 0.128 | Small |
| ER → PTR | 0.197 | 0.044 | 4.500 | <0.001 | [0.111, 0.283] | 0.691 | 0.044 | Small |
| MR → PTR | 0.212 | 0.044 | 4.777 | <0.001 | [0.125, 0.297] | 0.691 | 0.050 | Small |
| EQR → PTR | 0.166 | 0.043 | 3.879 | <0.001 | [0.082, 0.253] | 0.691 | 0.032 | Small |
| PTR → EWME | 0.547 | 0.036 | 14.996 | <0.001 | [0.472, 0.615] | 0.299 | 0.426 | Large |
| EWME → SEPE | 0.588 | 0.037 | 15.860 | <0.001 | [0.514, 0.660] | 0.346 | 0.529 | Large |
Note: HR = Human Risk; ER = Environmental Risk; MR = Management Risk; EQR = Equipment Risk; PTR = Production Technology Risk; EWME = Early Warning Management Effectiveness; SEPE = Sustainable Energy Production Efficiency; β = standardized path coefficient; SE = standard error; CI = confidence interval; R² = coefficient of determination; f² = effect size.
Table 9.
Serial indirect effects on SEPE via PTR and EWME.
| Predictor | Indirect Path Coefficient | Standard Error | 95% Confidence Interval |
| HR | 0.112 | 0.019 | [0.078, 0.151] |
| ER | 0.063 | 0.015 | [0.034, 0.094] |
| MR | 0.068 | 0.017 | [0.038, 0.104] |
| EQR | 0.053 | 0.016 | [0.024, 0.087] |
Note: HR = Human Risk; ER = Environmental Risk; MR = Management Risk; EQR = Equipment Risk; PTR = Production Technology Risk; EWME = Early Warning Management Effectiveness; SEPE = Sustainable Energy Production Efficiency.
Table 10.
Calibration anchors for the fsQCA analysis.
| Set | Full non-membership (p10) | Crossover (p50) | Full membership (p90) |
| HR | 3.167 | 4.000 | 4.500 |
| ER | 3.143 | 4.286 | 4.571 |
| MR | 2.800 | 4.000 | 4.400 |
| EQR | 2.500 | 3.667 | 4.333 |
| PTR | 3.000 | 4.200 | 4.600 |
| EWME | 2.750 | 4.000 | 4.500 |
| SEPE | 2.800 | 3.800 | 4.400 |
Note: HR = Human Risk; ER = Environmental Risk; MR = Management Risk; EQR = Equipment Risk; PTR = Production Technology Risk; EWME = Early Warning Management Effectiveness; SEPE = Sustainable Energy Production Efficiency; p10 = 10th percentile; p50 = 50th percentile; p90 = 90th percentile.
Table 11.
Accepted truth-table rows for high sustainable energy production efficiency.
| Configuration | HR | ER | MR | EQR | PTR | EWME | N | Consistency | Raw coverage |
| T1 | 1 | 1 | 1 | 1 | 1 | 1 | 24 | 0.979 | 0.436 |
| T2 | 1 | 1 | 1 | 1 | 1 | 0 | 25 | 0.967 | 0.330 |
| T3 | 1 | 1 | 1 | 0 | 1 | 1 | 12 | 0.982 | 0.290 |
| T4 | 1 | 0 | 1 | 1 | 1 | 1 | 17 | 0.978 | 0.282 |
| T5 | 1 | 1 | 0 | 1 | 1 | 1 | 10 | 0.976 | 0.255 |
| T6 | 1 | 1 | 1 | 0 | 1 | 0 | 12 | 0.982 | 0.246 |
| T7 | 1 | 1 | 1 | 1 | 0 | 0 | 16 | 0.975 | 0.241 |
| T8 | 0 | 0 | 0 | 1 | 0 | 1 | 10 | 0.905 | 0.186 |
| T9 | 0 | 1 | 0 | 1 | 0 | 0 | 11 | 0.953 | 0.165 |
Note: T = truth-table row; 1 = presence/high-set membership; 0 = absence/low-set membership; HR = Human Risk; ER = Environmental Risk; MR = Management Risk; EQR = Equipment Risk; PTR = Production Technology Risk; EWME = Early Warning Management Effectiveness.
Table 12.
fsQCA solution terms for high sustainable energy production efficiency.
| Configuration | HR | ER | MR | EQR | PTR | EWME | Raw coverage | Unique coverage | Consistency |
| C1 | ● | ● | ● | ● | ● | ● | 0.436 | 0.062 | 0.979 |
| C2 | ● | ● | ● | ● | ● | ○ | 0.330 | 0.059 | 0.967 |
| C3 | ● | ● | ● | ○ | ● | ● | 0.290 | 0.016 | 0.982 |
| C4 | ● | ○ | ● | ● | ● | ● | 0.282 | 0.032 | 0.978 |
| C5 | ● | ● | ○ | ● | ● | ● | 0.255 | 0.021 | 0.976 |
Note: C = configuration; ● = presence/high-set membership; ○ = absence/low-set membership; HR = Human Risk; ER = Environmental Risk; MR = Management Risk; EQR = Equipment Risk; PTR = Production Technology Risk; EWME = Early Warning Management Effectiveness; SEPE = Sustainable Energy Production Efficiency.
Table 13.
Reconstructed CTA-PLS summary.
| Construct | No. tetrads | Mean abs. tetrad | Significant tetrads | % significant |
| HR | 45 | 0.012 | 11 | 24.4 |
| ER | 105 | 0.011 | 26 | 24.8 |
| MR | 15 | 0.005 | 0 | 0.0 |
| EQR | 45 | 0.015 | 10 | 22.2 |
| PTR | 15 | 0.016 | 6 | 40.0 |
| EWME | 3 | 0.020 | 2 | 66.7 |
| SEPE | 15 | 0.015 | 6 | 40.0 |
Note: CTA-PLS = confirmatory tetrad analysis using partial least squares; HR = Human Risk; ER = Environmental Risk; MR = Management Risk; EQR = Equipment Risk; PTR = Production Technology Risk; EWME = Early Warning Management Effectiveness; SEPE = Sustainable Energy Production Efficiency; abs. = absolute.
Table 14.
IPMA construct priorities for SEPE.
| Construct | Importance (Total Effect) | LV Performance |
| EWME | 0.588 | 62.677 |
| PTR | 0.322 | 65.414 |
| HR | 0.112 | 69.446 |
| MR | 0.068 | 60.43 |
| ER | 0.063 | 66.323 |
| EQR | 0.054 | 62.008 |
Note: IPMA = importance-performance map analysis; LV = latent variable; EWME = Early Warning Management Effectiveness; PTR = Production Technology Risk; HR = Human Risk; MR = Management Risk; ER = Environmental Risk; EQR = Equipment Risk; SEPE = Sustainable Energy Production Efficiency.
Disclaimer/Publisher’s Note: The statements, opinions and data contained in all publications are solely those of the individual author(s) and contributor(s) and not of MDPI and/or the editor(s). MDPI and/or the editor(s) disclaim responsibility for any injury to people or property resulting from any ideas, methods, instructions or products referred to in the content. |
© 2026 by the authors. Licensee MDPI, Basel, Switzerland. This article is an open access article distributed under the terms and conditions of the Creative Commons Attribution (CC BY) license (http://creativecommons.org/licenses/by/4.0/).
Copyright: This open access article is published under a Creative Commons CC BY 4.0 license, which permit the free download, distribution, and reuse, provided that the author and preprint are cited in any reuse.