

Submitted:
15 November 2026
Posted:
17 November 2026
You are already at the latest version
Abstract
Three decades of progress in light–matter interaction at metal–dielectric interfaces have pushed optical biosensor detection limits from the micromolar to the femtomolar range and below, yet the translation of this sensitivity into devices that perform reliably in clinical, environmental, and industrial samples has lagged far behind. This review argues that buffer-phase sensitivity is no longer the limiting quantity. Starting from the electrodynamics of the surface plasmon polariton, we show what a resonance can and cannot measure, compare the major transduction platforms by sensitivity, probing depth, and technology readiness, and propose a nine-axis vocabulary that specifies what a reported sensitivity actually measures. Comparative evidence and a worked numerical case study identify matrix effects, batch-to-batch reproducibility, and miniaturization as the principal unresolved barriers. Two-dimensional materials are assessed for stability and manufacturability, and magneto-optical modulation and machine-learning calibration are examined as routes to drift suppression and more robust inference, while chemical selectivity remains dependent on recognition chemistry and independently validated discrimination. Five priorities follow: manufacturable materials with documented stability, magnetoplasmonic readouts tested against non-magnetic controls, miniaturized platforms benchmarked against reference methods, matrix-validated machine learning, and standardized multi-axis reporting with explicit technology-readiness statements.
Keywords:
optical biosensors
; surface plasmon resonance
; magneto-optic surface plasmon resonance
; magnetoplasmonics
; transverse magneto-optical Kerr effect
; two-dimensional materials
; label-free sensing
; point-of-care diagnostics
; technology readiness level
; figure of merit
1. Introduction
Optical interrogation of molecular interactions at surfaces has a long history, but only in the past few decades has it become sensitive enough to matter in the clinic. Surface plasmon resonance (SPR), localized plasmonic hot spots, photonic-crystal and whispering-gallery-mode (WGM) cavities, optical-fiber gratings, and metasurfaces have together pushed detection limits from the micromolar range into the femtomolar range and below [1,2,3]. This progress was hard-won and incremental, accumulated through successive improvements in materials, coupling geometries, and readout schemes. Prism-, grating-, and fiber-coupled SPR configurations trade fabrication complexity against field portability [3,4], whereas more recent strategies, including evanescent-field engineering, signal amplification with metasurfaces and nanozymes, and hybrid architectures, target the limit of detection directly [5].
Each further fraction of a nanometer or millidegree of resonance shift is now harder to obtain, and the accumulated evidence indicates that optimizing sensitivity in isolation is no longer the most valuable use of the community’s effort. A systematic review and meta-analysis of the clinical and biomedical translation literature identifies reproducibility, matrix robustness, and regulatory validation, rather than raw sensitivity, as the dominant bottlenecks to clinical adoption [6]. A review of nanophotonic biosensors likewise names cost reduction and the handling of complex biological samples as the principal open challenges [7].
The physical reason is simple and worth stating at the outset. A refractometric transducer measures a change in the dielectric permittivity within a thin evanescent volume; it cannot, by itself, identify which molecule caused that change. An increase in refractometric sensitivity can therefore enhance responses to both target binding and interfering changes; the relative contributions depend on the sample matrix, functionalization, and optical field distribution, and, in real samples, the interfering contribution is often the larger of the two. Selectivity, reproducibility, and stability are not engineering afterthoughts to sensitivity; they are the quantities that decide whether a resonance becomes a diagnostic.
Accordingly, this review does not attempt to catalog the optical biosensing literature; instead, it critically examines where the principal bottlenecks of the field now lie. Section 2 derives, from the electrodynamics of the surface plasmon polariton, the quantities that set what a resonance can measure. Section 3 compares the dominant transduction platforms, and Section 4 proposes a multi-axis vocabulary for disambiguating sensitivity claims. Section 5 and Section 6 examine matrix effects, reproducibility, and the stability of emerging materials. Section 7 and Section 8 treat magneto-optical modulation and machine learning as routes to drift suppression and more robust inference rather than as sources of further sensitivity, and Section 9 and Section 10 address miniaturization and technology readiness as gates to translation. Section 11 sets out research priorities, and Section 12 presents the conclusions. Throughout, experimental results are distinguished from numerical simulations, proof-of-concept demonstrations from validated prototypes, and idealized-buffer performance from real-matrix performance, because conflating these categories is a persistent methodological weakness of this literature.
This is a critical narrative review rather than a systematic review; no formal search protocol or meta-analysis was used. The evidence was drawn from peer-reviewed literature identified through bibliographic-database searches and citation tracking from key reviews, combining foundational studies of surface plasmon resonance and magneto-optics with work on optical biosensor validation and translation, most of it published between 2019 and 2026. Studies were included when they bore directly on what a resonance measures, how performance claims are reported, which barriers separate buffer-phase from real-sample performance, or how validation evidence maps onto technology readiness. Experimental demonstrations have been distinguished from numerical simulations on the basis of the methods reported in each source, and numerical values are quoted as reported by the original authors.
2. Physical Foundations: What a Plasmonic Resonance Can and Cannot Measure
2.1. The Surface Plasmon Polariton and Its Probing Depth
Consider a planar interface between a metal of complex permittivity εm and a dielectric sample of permittivity εd. Maxwell’s equations admit a transverse-magnetic wave bound to this interface, whose field decays exponentially on both sides. Continuity of the tangential fields fixes its in-plane wavevector through the surface plasmon polariton (SPP) dispersion relation [4]:
which describes a bound mode only when Re εm < −εd, the condition met by free-electron metals such as gold and silver in the visible and near-infrared. Because Re kSP exceeds the wavevector of light in the sample, the SPP cannot be excited directly by a free-space beam; in the Kretschmann configuration, momentum is supplied by a prism of refractive index np, and resonance occurs at the angle θSPR for which
This is an ideal-interface approximation; the reflectance minimum of a finite prism–metal–analyte multilayer also depends on film thickness, optical losses, and coupling geometry. The same boundary-value problem gives the decay constant of the field in the sample, κd = k0εd/[−(εm + εd)]1/2, where k0 = 2π/λ. The penetration depth, defined as the distance over which the field amplitude falls to 1/e, is therefore
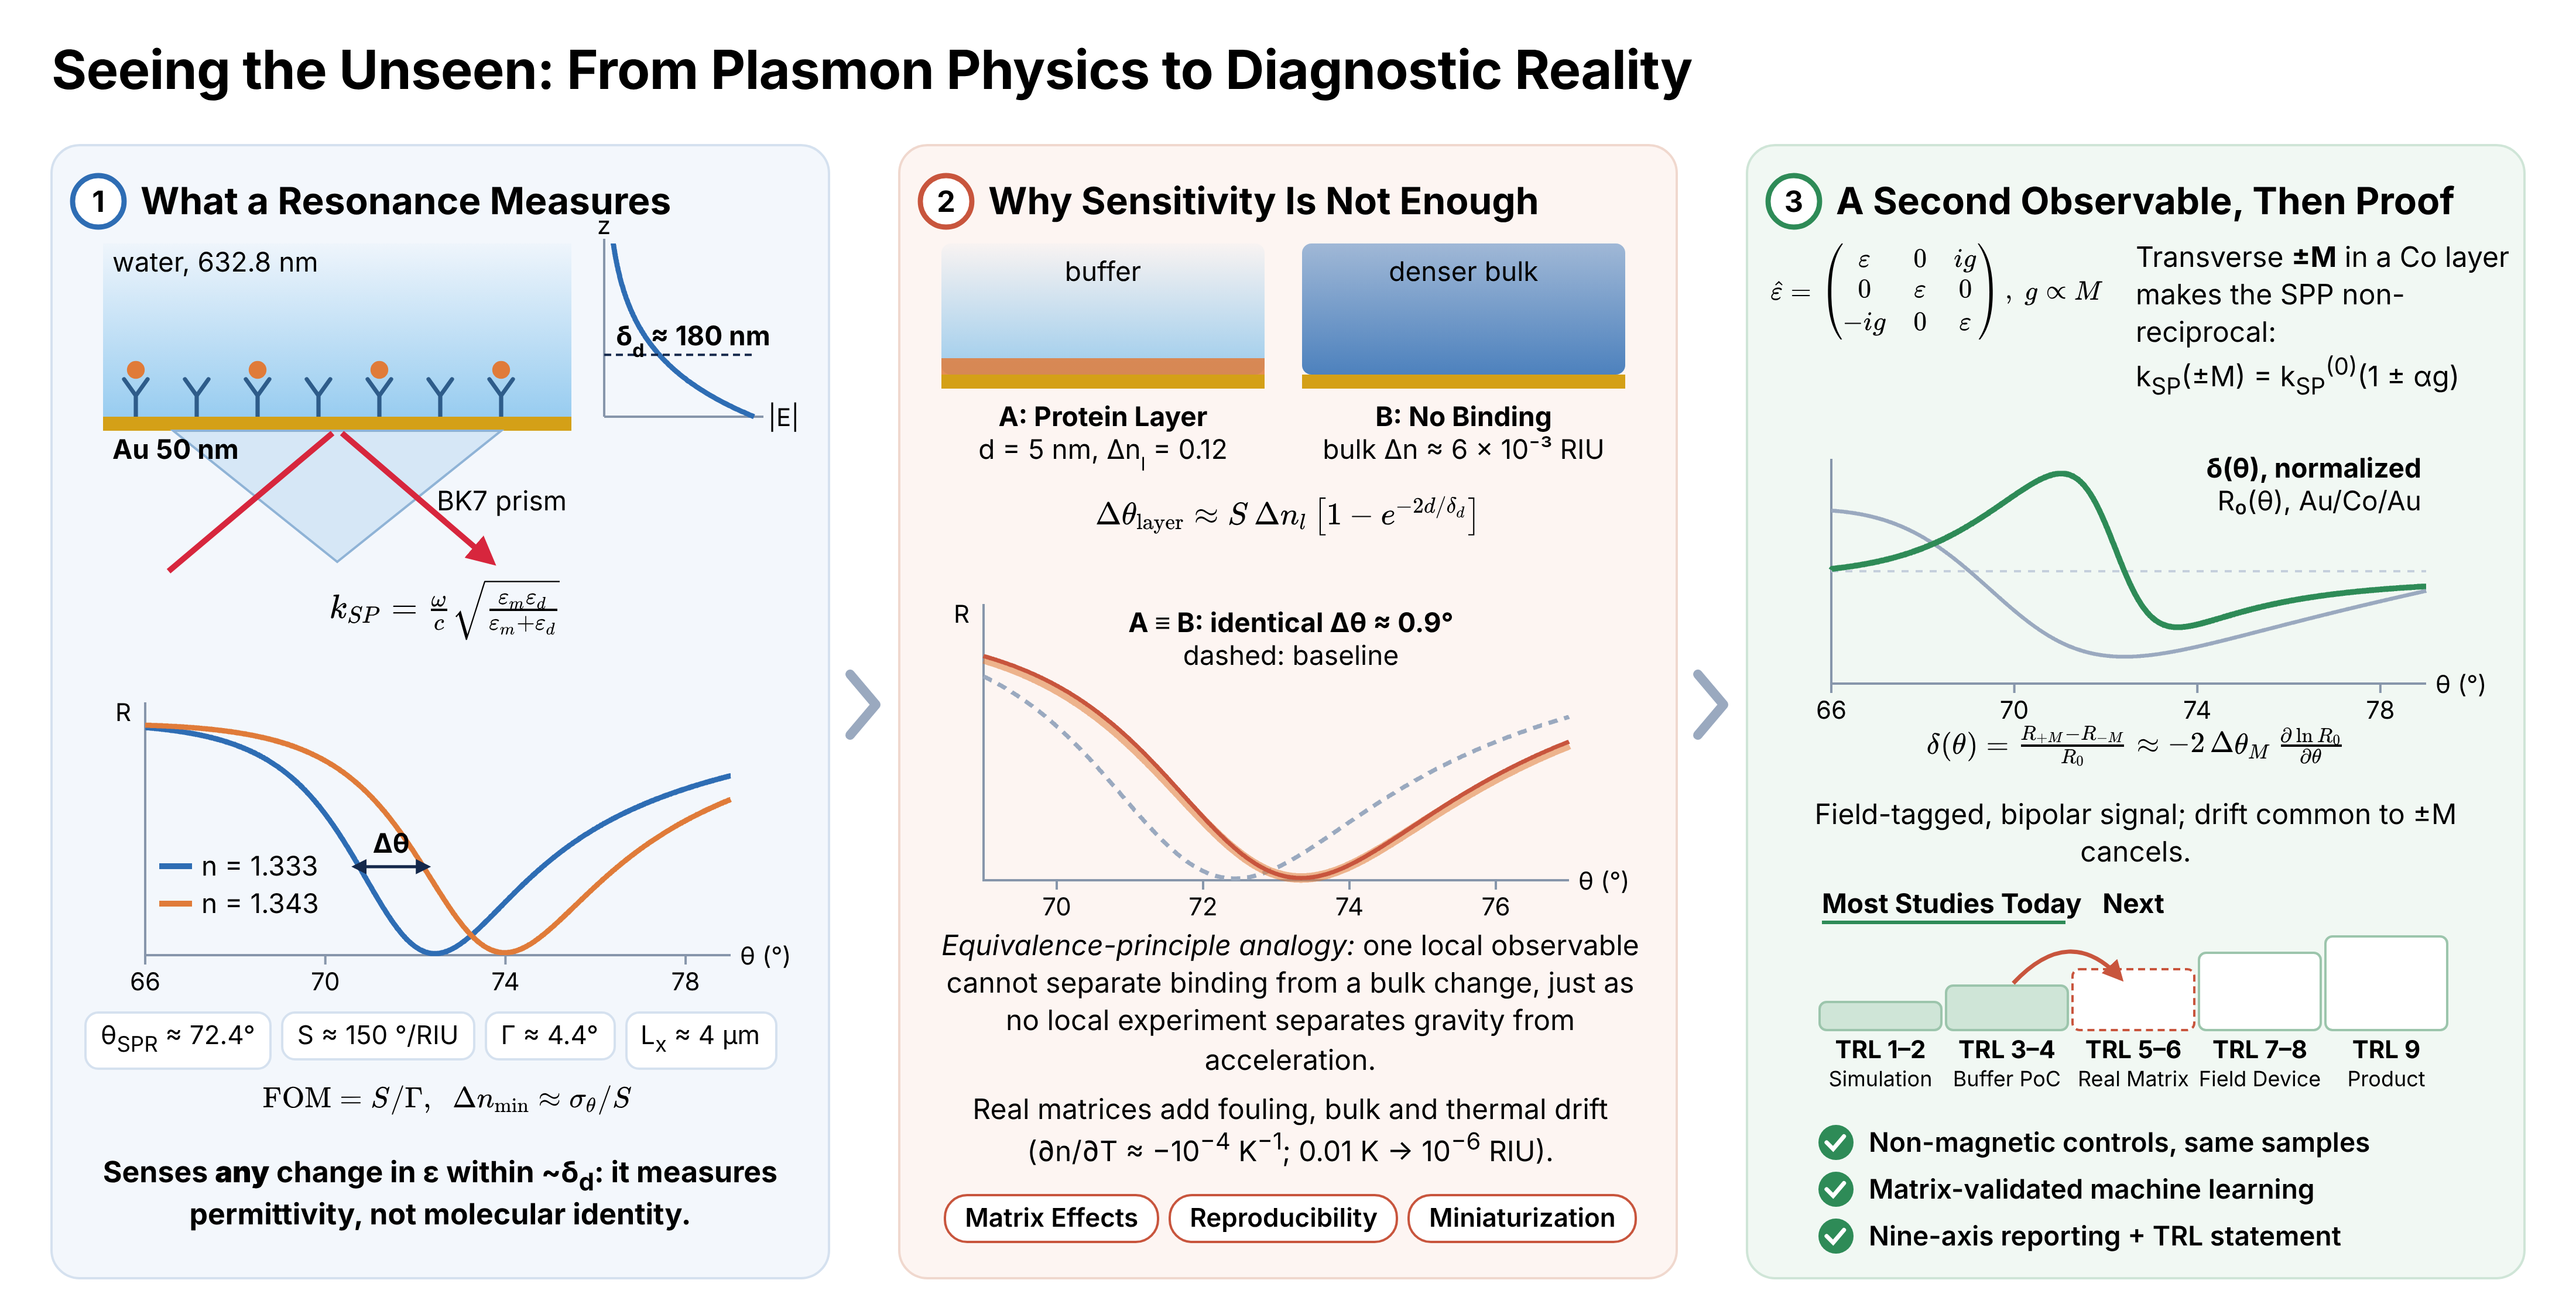
For gold at 633 nm (εm ≈ −11.6 + 1.2i) in water, Equation (3) gives δd ≈ 180 nm, and Equation (2) places the resonance near 72.8° in a BK7 prism. The imaginary part of kSP sets the propagation length, Lx = 1/(2 Im kSP) ≈ 4 µm for the same interface. These two lengths are the physical budget of the platform: the transducer samples a slab only a few hundred nanometers thick, and the resonance linewidth is fixed by how far the SPP travels before it is absorbed. A localized surface plasmon confines the field even more tightly, to 10–30 nm, which raises the response to a thin molecular layer but leaves an even smaller volume in which specific and non-specific binding compete.
2.2. Sensitivity, Linewidth, and the Limit of Resolution
The bulk sensitivity, S = ∂θSPR/∂n (or ∂λSPR/∂n in spectral interrogation), describes how far the resonance moves per unit change in refractive index. It is not, on its own, a measure of how small a change can be resolved, because a broad resonance is harder to locate than a narrow one. The figure of merit (FOM) normalizes the sensitivity by the resonance linewidth Γ, defined as the full width at half depth of the reflectance dip (or the full width at half maximum of a resonant peak) and expressed in the same units as the interrogated variable:
where σθ is the uncertainty with which the resonance position is determined. This uncertainty is not a universal function of Γ: it depends on the resonance shape and contrast, the angular or spectral sampling, the fitting or centroid algorithm, and the detector and noise model. For a fixed lineshape and contrast under additive, white-noise-limited detection, σθ scales approximately as Γ/SNR, where SNR is the signal-to-noise ratio of the reflectance measurement; in that regime, narrowing the line is as valuable as increasing S, and a material that raises S while broadening Γ in proportion yields no net gain in resolution. Equation (4) also exposes a second, less often stated limit. The thermo-optic coefficient of water is approximately −1 × 10⁻⁴ K−1, so a temperature fluctuation of only 0.01 K changes the bulk index by about 10−6 refractive-index units (RIU), comparable to the best laboratory resolutions reported for SPR and magnetoplasmonic sensors [8]. A resolution claim at this level is therefore also an implicit claim of millikelvin thermal stability.
2.3. Bulk Versus Surface Response: A Thought Experiment
For a thin adsorbed layer of thickness d and refractive-index contrast Δnl with respect to the sample, the exponential decay of the evanescent field intensity, which falls off over δd/2 because δd is defined for the field amplitude, gives, to first order, a resonance shift
Imagine two identical chips read by an observer who can see only the resonance angle. On the first, a protein layer with d = 5 nm and Δnl ≈ 0.12 binds to the surface; on the second, nothing binds, but the bulk index of the sample rises. With δd ≈ 180 nm, Equation (5) shows that the two chips give identical readings when the bulk change is Δn ≈ 6.5 × 10⁻³ RIU, roughly half the index difference between buffer and undiluted serum. No measurement of a single refractometric observable can tell these two chips apart, just as no local experiment can distinguish a uniform gravitational field from uniform acceleration. The degeneracy cannot be resolved from that one response alone. It may be reduced through a second observable whose surface-to-bulk weighting differs from the first, such as two modes with different penetration depths [9], or through a reference channel, controlled sample preparation, or validated selective binding chemistry. A magneto-optical signal that is odd in the applied field (Section 7) does not by itself guarantee that bulk and surface changes become identifiable. This principle, more than any sensitivity record, organizes the remainder of this review.
3. Platform Landscape: A Comparative Technical Assessment
Optical biosensing platforms share the physical basis of Section 2: a change in the local or bulk refractive index is converted into a measurable shift in angle, wavelength, phase, or intensity. They differ in how that shift is generated, confined, and read out. Table 1 compares the dominant platform classes using the metrics most often reported: bulk sensitivity (degrees or nanometers per RIU), typical evanescent-field penetration depth, and an approximate technology readiness level (TRL), estimated from the weight of experimentally validated, as opposed to purely simulated, literature for each class.
Prism-coupled SPR is the most mature class, with established commercial instrumentation and a multi-decade clinical-analysis literature spanning hormones, protein markers, autoantibodies, nucleic acids, and pathogens [19]. Fiber-optic and grating-coupled geometries give up some of that sensitivity in exchange for portability and multiplexing, and recent work on tilted fiber Bragg gratings (TFBGs) shows that machine-learning-assisted spectral analysis can recover surface-specific refractive-index information that single-wavelength interrogation misses entirely [10]. Localized surface plasmon resonance (LSPR) and related nanostructured architectures include some of the largest reported wavelength sensitivities, predominantly from simulations: a finite-element simulation of a microstructured polymeric waveguide–plasmonic sensor reported a wavelength sensitivity of 111,000 nm/RIU and a sensor resolution of 9 × 10⁻⁷ RIU, while labeling 8.12 × 10⁻¹² RIU2/nm as a “limit of detection” [13]. Such figures are simulated design targets rather than validated device performance in a biological matrix, and the units of the latter quantity do not represent an index- or concentration-domain detection limit. The LSPR literature itself has repeatedly identified selectivity in complex media and point-of-care adaptation, rather than the limit of detection, as the persistent open problems [12]. WGM microresonators occupy a similar position: they reach single-molecule-class sensitivity under carefully controlled conditions, but packaging, thermal stability, and robust coupling still separate these results from deployable instruments [16].
Figure 1 places the plasmonic platform classes of Table 1 in a broader historical context. In the roadmap proposed by Zhou et al., plasmonics progresses from the first observation of grating anomalies in 1902, through the individually established single-effect modalities, namely SPR, LSPR, surface-enhanced Raman scattering (SERS), and surface-enhanced infrared absorption (SEIRA), toward “integrative plasmonics”, in which several optical effects are combined and plasmonic transducers are fused with electronic, acoustic, and thermal functions, with molecular diagnostics as one of three principal application domains [18]. Two features of this roadmap bear directly on translation. First, its most recent stage is defined by combining physical effects, that is, by adding observables, rather than by a further increase in the bulk sensitivity of any single one; this is precisely the remedy that the thought experiment of Section 2 prescribes. The detection-limit compilation of Kabashin et al. points in the same direction: across more than twenty plasmonic studies, the lowest mass-concentration detection limits for the smallest analytes were reached by phase-interrogated metamaterial transducers, a gain that arose from a change of observable and readout scheme rather than from a larger bulk sensitivity [1]. Second, the roadmap is organized by physical effect and application domain, not by validated diagnostic performance: it charts what plasmonic transduction can do, not whether it does so reliably in clinical samples. That evidentiary dimension is captured by the TRL column of Table 1 and underlies the translation barriers discussed in Section 5, Section 6, Section 7, Section 8, Section 9 and Section 10.
Magnetoplasmonic architectures and MO-SPR readouts form a distinct class (Section 7). Their reported advantage is not primarily a larger bulk sensitivity but an additional, independently modulated observable, the magneto-optical Kerr signal, whose field modulation can suppress selected instrumental drifts and provide complementary response information; discrimination of specific binding from bulk-index changes must be demonstrated using independent controls and a validated sensing model [8,14,15,20]. This cross-checkable second observable, rather than any sensitivity record, is the more defensible case for magnetoplasmonics in biosensing.
4. A Vocabulary Before a Verdict: A Nine-Axis Taxonomy for Defensible Sensitivity Claims
A recurring problem in this literature is that the words “sensor”, “biosensor”, and “sensitive” are applied loosely across at least nine distinct descriptive axes: the measurand (what is physically determined); the recognition mechanism (why the interaction occurs at all); the transduction pathway (how the interaction becomes a signal); the observable (what the instrument actually records); the interrogation mode (angle, wavelength, phase, intensity, or magnetic state); the device architecture; the role of magnetism, if any; the level of system integration; and the strength of evidence behind the claim. The nine-axis framework is proposed and fully defined in this review (Table 2); a related treatment will appear in a forthcoming monograph by one of the present authors. Formal terminology recommendations have addressed comparable ambiguities in electrochemical biosensors for more than two decades [21], and a recent terminological guide extends the discussion to the biomolecular-recognition vocabulary shared by optical and electrochemical platforms [22]; the ambiguity is therefore not peculiar to plasmonics.
A single platform can simultaneously be characterized by a biological measurand, antibody-based recognition, refractometric optical transduction, angular interrogation, a prism-coupled plasmonic architecture, and a magneto-optical readout; describing it with a single adjective discards the information needed to compare it with a competing platform. Table 2 lists the nine axes with a working definition and an illustrative contrast for each, drawn from the platform classes of Table 1.
Figure 2 represents the same framework graphically. A single “sensor record” sits at the center of eight complementary descriptors (measurand, recognition, transduction, observable, interrogation, architecture, magnetic role, and evidence), each of which a reported device occupies simultaneously rather than alternatively. The figure groups two axes of Table 2, device architecture and system-integration level, under “architecture”, but the principle is unchanged: a sensor is a multi-label record rather than a one-word category, and a sensitivity value becomes interpretable only once each label has been stated. The magnetic role and the evidence level are the descriptors most often left implicit, and the second of these maps directly onto technology readiness levels (Section 10).
Two distinctions require particular care. The first concerns the role of magnetism. Magnetic nanoparticles are sometimes used only to enrich or concentrate an analyte near the sensing region, a sample-delivery function, and sometimes to provide a magneto-optical differential readout that can suppress selected drifts and add response information, a readout function [15]. A device that pairs a magnetic label with an otherwise ordinary SPR readout is not, on that basis alone, an MO-SPR or magnetoplasmonic biosensor, and reports should state which function the magnetic component performs. The second concerns the distinction between bulk and surface sensitivity, whose physical origin is Equation (5). A sensor calibrated against a bulk buffer-dilution series answers a different question from one calibrated against surface-layer binding, and measurements with comb-like fiber-grating resonances have shown that the two responses can be discriminated and can diverge substantially, depending on the penetration depth and the thickness of the analyte layer [9]. A single “sensitivity” value that does not specify which of the two was measured is incomplete at best and misleading at worst.
5. From Idealized Buffers to Diagnostic Reality: Matrix Effects and Reproducibility
A limit of detection reported in a controlled buffer such as phosphate-buffered saline (PBS) is a necessary but no longer sufficient indicator of merit. PBS is chemically simple, optically clean, and easy to control, whereas real samples such as blood, serum, saliva, urine, wastewater, or food extracts contain proteins, salts, particulates, competing analytes, and other interferents, and their pH can vary. Non-specific adsorption of these components at the transducing interface produces background signals that are difficult to distinguish from specific binding, thereby degrading sensitivity, specificity, and reproducibility [24]. In the language of Section 2, the evanescent volume cannot distinguish one adsorbed mass from another, so every non-specific protein within δd of the surface contributes to the signal through Equation (5). Systematic work on microfluidic capillary immunoassays has shown quantitatively that antibody surface coverage itself drives matrix interference, so that the same surface chemistry can behave differently depending on how densely it is functionalized, independently of the transduction physics [25]. An analysis of polymer-based biosensors applied to real samples reaches a parallel conclusion for a class of materials that is often evaluated on buffer-phase performance alone [26]. Table 3 summarizes the principal sources of matrix dependence, instrumental uncertainty, and reporting error that separate nominal buffer-phase performance from practical performance, together with representative evidence.
Proof-of-concept studies conducted exclusively in idealized buffers remain scientifically valuable, but they offer limited evidence of practical utility unless robustness, selectivity, matrix effects, fouling, reproducibility, and calibration stability are evaluated under realistic operating conditions. The meta-analysis of Ramirez-Priego et al. reaches this conclusion across the clinical deployment literature [6], and an earlier comprehensive treatment of SPR in clinical analysis reached a similar conclusion for serum, saliva, blood, and urine, noting that new immobilization chemistries and instrumentation were needed because standard buffer protocols underperformed in these fluids [19]. Batch-to-batch reproducibility in particular is evidence, not a secondary detail: a coating or nanostructure that cannot be reproduced beyond a single laboratory bench has not yet demonstrated the manufacturability that a diagnostic device requires.
Much of the gap between buffer-phase and real-matrix performance is decided at the sensor surface (Figure 3). Light coupled to the transducer generates an evanescent field that probes only the medium immediately adjacent to the surface (tens to a few hundred nanometers, depending on the platform; Table 1), and any refractive-index change within that volume is converted into a change in an output property such as intensity or wavelength (Figure 3a) [28]. Whether the recorded signal reports the analyte, however, is determined by three biofunctionalization parameters: bioreceptor orientation, grafting density, and antifouling coating (Figure 3b) [28]. Quantitative evidence that grafting density alone can govern matrix interference comes from Barbosa et al., who varied capture-antibody loading from 0 to 200 µg/mL in fluoropolymer microcapillary immunoassays for anti-mouse immunoglobulin G (IgG), interleukin-1β (IL-1β), and prostate-specific antigen (PSA) and found that the serum-to-buffer signal ratio moved into or out of a ±20% acceptability band as surface coverage changed; the effect was attributed to low-affinity serum components, such as autoantibodies, competing with the antigen for the immobilized antibody [25].
Although that readout was colorimetric rather than refractometric, the same competition acts on a plasmonic or magnetoplasmonic chip, where it is compounded by the fact that a refractometric transducer responds to adsorbed mass irrespective of its identity. The antifouling coating involves a trade-off of its own that follows directly from Equation (5). Zwitterionic coatings, among the most fouling-resistant reported, have failed when challenged with undiluted plasma, and the relatively thick coatings and polymer brushes that offer the highest fouling resistance can hinder receptor coupling and displace the binding event away from the surface, where the evanescent field is strongest, thereby reducing analytical sensitivity [28]. Bioreceptor density, orientation, and antifouling chemistry, optimized in the target matrix rather than in buffer, as Barbosa et al. recommend [25], are therefore reportable experimental variables on a par with metal-film thickness or resonance wavelength, rather than protocol details.
A related gap, between the buffer-phase detection limit and the real-matrix demonstration, is evident in Figure 4 for a state-of-the-art nanophotonic platform. Hu et al. patterned arrays of high-quality-factor (high-Q) silicon guided-mode-resonance metasurfaces (average Q ≈ 2200 in physiological buffer, at densities of ~160,000 devices per cm2), functionalized them with DNA probes for a SARS-CoV-2 gene fragment, and reported a limit of detection of ~8 fM in buffer from N = 20 independently measured resonators [17]. Figure 4a shows time-resolved binding on 10 resonators from 1 fM to 1 µM, and Figure 4b shows measurements in clinical nasopharyngeal eluates confirmed negative by reverse-transcription polymerase chain reaction (RT-PCR), in which the background matrix produced only a minimal, reversible response, whereas the eluate spiked with target at 100 nM produced a persistent shift [17]. The study is exemplary in testing an authentic clinical matrix and in reporting resonator-to-resonator statistics. It also makes the buffer-to-matrix gap explicit: the clinical-matrix demonstration was performed roughly seven orders of magnitude above the buffer-phase detection limit. Establishing the matrix-specific detection limit, rather than the buffer-phase one, is the evidentiary step associated with TRL 5–6 (Section 10).
6. The Materials Frontier: Two-Dimensional Materials, MXenes, and Manufacturability
Two-dimensional (2D) materials, including MXenes, and engineered nanostructures have repeatedly produced laboratory-scale sensitivity gains when incorporated as adlayers on plasmonic transducers. Physically, an adlayer acts in two ways: it modifies the effective permittivity of the stack, and therefore the SPP dispersion of Equation (1), and it changes the chemistry of the outermost surface where binding occurs. The optical effect can increase or decrease sensitivity and change the resonance linewidth, depending on the complex optical constants, thickness, and coupling geometry of the adlayer; the surface chemistry determines whether any improvement survives a realistic sample. The antimonene-based SPR sensor of Xue et al. illustrates the chemical route. Few-layer antimonene nanosheets, assembled layer by layer on a gold film, adsorbed gold-nanorod-conjugated single-stranded DNA probes far more strongly than double-stranded DNA, so hybridization with the target microRNA (miRNA) released the conjugates from the surface and produced a negative shift of the resonance angle; a detection limit of 10 aM was reported for miRNA-21, together with discrimination of single-base mismatches [29]. These measurements were nevertheless made in buffer, and the gain arose from the combination of adlayer chemistry and gold-nanorod signal amplification rather than from the optical properties of the adlayer alone. Table 4 compares four widely studied material classes in terms of the properties most relevant to translation: the sensitivity-enhancement mechanism, fabrication maturity, and the principal documented reproducibility concern.
Few studies, however, demonstrate that a given 2D-material coating survives batch-to-batch reproducibility testing beyond a single research bench. MXene-specific reviews acknowledge this gap explicitly, identifying environmental degradation and surface-termination control as open problems even as they catalog an expanding range of achieved sensitivities [30,31,32]. The underlying chemistry is well documented. Aqueous Ti3C2Tx colloids stored in open vials degraded by 42%, 85%, and 100% after 5, 10, and 15 days, respectively, mainly to anatase TiO2, whereas hermetically sealed, argon-filled storage at 5 °C largely preserved them [33]. Few-layer black phosphorus is similarly vulnerable: under ambient conditions, condensed water etches it layer by layer, and its volume increases by more than 200% over several days [34]. Because the optical response of an adlayer enters the SPP dispersion through its permittivity, a coating that oxidizes changes the calibration of the sensor as surely as it changes its chemistry. Materials studies are therefore most informative when the achieved sensitivity is reported alongside storage stability, atmosphere sensitivity, and reproducibility data, which together show whether a coating is a laboratory curiosity or a manufacturable component.
An experimental, rather than simulated, study by Zhu et al. illustrates both the promise and the reporting gap of atomically thin plasmonic adlayers. A silver film was capped with an atomically thin amorphous Ge2Sb2Te5 (GST) layer, and the singular-phase-enhanced Goos–Hänchen lateral position shift of p-polarized light near the resonance angle was used as the observable. Near the point of darkness, the reflected phase varies abruptly with angle, and because the lateral shift is proportional to the angular derivative of that phase, the observable is amplified enormously; the reported sensitivity was 1.72 × 10⁸ nm/RIU in a glycerol calibration, and tumor necrosis factor-α (TNF-α) and interleukin-6 (IL-6) were detected from 0.1 fM to 1 nM [36]. Two aspects meet the reporting standard of Section 4 and Section 5: the GST-capped silver withstood 24 h of immersion in buffer without observable change in reflectance, which matters for silver transducers that are otherwise prone to oxidation, and non-specific adsorption on mismatched antibodies was quantified directly at approximately 20% of the specific signal [36]. Equally instructive is what remains to be shown. The cytokine data were acquired in buffer, and multi-batch reproducibility of the GST deposition and storage stability beyond 24 h were not reported. The approximately 20% non-specific response indicates a potential source of interference; its effect on the detection limit must be established from background variability and matrix-specific validation. Finally, a lateral-position sensitivity in nm/RIU is not directly comparable with the spectral sensitivities of Table 1, a concrete instance of the observable-axis ambiguity described in Section 4.
6.1. A Worked Illustration: Transparency in a Numerical Case Study
A bimetallic, phosphorene-based SPR architecture for detecting salivary cortisol, a clinically relevant stress biomarker, makes the reporting standard of Section 4 and Section 5 concrete; the design was reported previously by the present authors and co-workers [23]. The study is a numerical simulation, not an experimental demonstration, a distinction too often left implicit in abstracts. For a Cu (15 nm)/Ni (80 nm) bimetallic stack at 830 nm, increasing the number of phosphorene layers from one to six raised the angular sensitivity from 229.18 to 320.86 °/RIU, while the FOM improved from 121.26 to 225.96 RIU−1 as the resonance narrowed from 1.89° to 1.42° [23], in accordance with Equation (4). Across a modeled salivary cortisol range of 0.36–4.50 ng/mL, the resonance angle shifted by only about 0.3°, and the derived limit of detection, calculated for an assumed instrumental angular resolution of 0.001°, varied non-monotonically between roughly 0.004 and 0.055 ng/mL, depending on the concentration interval used [23].
The reflectance curves of Figure 5 show why this assumption matters. At the scale of the main plot, the resonance minima for the full modeled cortisol range nearly overlap, and only the magnified inset (78–79.5°) resolves them. Because the derived detection limit is the assumed angular resolution divided by the angular response per unit concentration, it scales directly with the assumed 0.001°: an instrument with a tenfold coarser angular resolution yields a tenfold higher detection limit [23]. A set of reflectance curves of this kind, accompanied by the stated resolution, enables readers to assess immediately whether a given benchtop or portable goniometric instrument could reproduce the claimed detection limit, which a single sensitivity value in °/RIU does not.
A resolution-derived detection limit is also not the quantity used in clinical chemistry. There, the limit of blank (LoB) and the limit of detection (LoD) are determined empirically from replicate measurements of blank and low-concentration samples [37]:
where μblank and σblank are the mean and standard deviation of the blank signal and σlow is the standard deviation of a low-concentration sample. The factor 1.645 corresponds to a one-sided 95% confidence level, so Equation (6) controls both false-positive and false-negative rates at 5%, provided that the blank and low-concentration responses are approximately Gaussian; otherwise, nonparametric (percentile-based) estimates are preferable. These expressions yield thresholds in units of the assay signal; a concentration-domain LoD requires conversion through a validated calibration function. The resolution-derived and clinical detection limits coincide only when the assumed resolution reflects the measured noise of the assay in its intended matrix. The numbers above are discussed not to favor phosphorene over competing platforms but because the study states the assumed resolution on which the detection limit depends, reports the full concentration-dependent results rather than a single best-case value, and makes clear that the values describe a modeled matrix rather than a validated clinical assay. Statements of this kind are easily omitted from sensitivity-focused abstracts, yet they determine whether a reported detection limit can be reproduced.
7. Magnetoplasmonics: A Field-Modulated Measurement Channel, Not Just a Signal Enhancer
7.1. Physical Origin of the Magneto-Optical Observable
A magnetized ferromagnetic metal is no longer optically isotropic. For a magnetization M along the y axis, perpendicular to the plane of incidence (the transverse geometry), the permittivity acquires antisymmetric off-diagonal elements [8,20,38]:
where the gyration g originates microscopically in the spin–orbit coupling of the spin-polarized conduction electrons. The off-diagonal terms couple the in-plane and normal components of the SPP field, and because they change sign with M, they make the surface wave non-reciprocal: to first order in g, the SPP wavevector becomes kSP(±M) = kSP(0)(1 ± αg), with α fixed by the permittivities of the stack. The two magnetization states therefore shift the resonance in opposite directions, each by a small angle ΔθM, so that their angular separation is approximately 2ΔθM. Writing R(θ; ±M) ≈ R0(θ ∓ ΔθM), where R0(θ) = [R(θ; +M) + R(θ; −M)]/2 coincides with the unmagnetized reflectance to leading order in g, and assuming |ΔθM| ≪ Γ and R0 > 0, the normalized transverse magneto-optical Kerr effect (TMOKE) signal is
Other TMOKE conventions normalize the difference by the sum, (R+M − R−M)/(R+M + R−M), which yields half the value of Equation (8); the convention should therefore be stated whenever TMOKE magnitudes are compared. Three consequences follow from Equation (8), and they define what the magneto-optical channel can and cannot offer. First, δ is proportional to the logarithmic derivative ∂ln R0/∂θ in this pure angular-shift approximation: it vanishes at a reflectance extremum where R0 remains finite, and its maximum depends on both the reflectance slope and the residual reflectance, so that near a deep, nearly dark resonance the normalized response can peak away from the point of maximum absolute slope. Second, for a fixed dip depth, ∂R0/∂θ scales as 1/Γ, so the same gyration produces a larger signal on a narrower resonance; because ΔθM ∝ αg, the normalized amplitude scales approximately as αg/Γ rather than with g alone, although the lineshape and background reflectance also enter. Ferromagnetic layers raise g but also add absorption that broadens Γ. Third, δ is odd in M. Synchronous demodulation at the field-modulation frequency suppresses signals and drifts outside the magnetic modulation band; common multiplicative fluctuations of the optical power may remain unless the response is normalized or an independent optical-power reference is used. What the magneto-optical channel cannot do is evade Equation (5): it probes the same evanescent volume as the SPR minimum and is therefore also affected by non-specific adsorption, although its response function need not be identical to that of the conventional plasmonic signal. Its value lies in a cleaner, field-tagged measurement of the resonance, not in analyte-specific chemical selectivity, which modulation does not by itself provide.
7.2. Experimental and Numerical Evidence
Early MO-SPR measurements with Au/Co/Au transducers improved the limit of detection by a factor of three relative to standard SPR, for both refractive-index changes and biomolecular adsorption, and projected up to an order-of-magnitude gain with optimized metal layers and instrumentation [39]. The second consequence of Equation (8) is demonstrated most clearly by coupling TMOKE detection to a high-quality surface mode. In a heterostructure consisting of a one-dimensional photonic crystal capped by Co and Au layers, the SPR dip had an angular width of 0.06°, whereas the associated magnetoplasmonic resonance was only 0.02° wide, corresponding to a propagation length of about 106 µm and a TMOKE magnitude of 11%, with a reported detection limit of ~10−6 RIU under laboratory conditions [8]. The propagation length is some 25 times that of an SPP on a plain gold film (Section 2), which is exactly why the resonance is narrow; by the estimate of Section 2, a resolution of 10−6 RIU also presupposes temperature stability at the 10 mK level.
A numerical comparison of noble-metal and transition-metal single layers and Co/Ag and Co/Au bilayers at 632.8 and 785 nm, reported previously by one of the present authors and co-workers, found that the intensity-based MO-SPR sensitivities exceeded the corresponding SPR intensity sensitivities in every configuration studied, although performance depended on the medium and was consistently lower in water-based media, which are the relevant ones for biosensing, than in air [14]. This surrounding-medium (optical-background) dependence arises from the optics of the layer stack and is distinct from the fouling and interferents of real biological matrices discussed in Section 5; both must be accounted for in biosensing claims. In an antibody–antigen assay, an Au–Co alloy chip lowered the detection limit for anti-human IgG from 0.96 nM with standard SPR to 0.60 nM and remained intact in saline solution, whereas a conventional Au/Co/Au trilayer exfoliated rapidly [15]. The stability of the magnetic layer in aqueous media, and not only its magneto-optical activity, therefore, determines whether the second channel can be used in practice. The same group has since applied MO-SPR readout to a functionalized multi-spot array for gases and volatile organic compounds; this adjacent, non-clinical evidence is placed on the evidence ladder in Section 10.
Figure 6 illustrates how the field-modulated channel is generated. In the prism-coupled MO-SPR configuration, a p-polarized beam excites an SPP in an antibody-functionalized Au/Co/Au trilayer, while a transverse magnetic field reverses the magnetization of the Co layer between +M and −M. Magnetization reversal displaces the reflectance minimum of each state by approximately ±ΔθM relative to R0, a total separation of about 2ΔθM, and the normalized differential signal of Equation (8) takes the form of a bipolar, dispersive feature that is steepest close to the plasmon resonance. Differential detection suppresses common-mode contributions, provided that both magnetic states are acquired under equivalent conditions. The gain is nevertheless local: an optimized differential response degrades when a large refractive-index perturbation moves the system away from the resonance condition for which it was optimized, so a steeper slope is obtained at the expense of dynamic range. As a conceptual schematic with representative curves, Figure 6 defines the form of the observable rather than its magnitude, which depends strongly on the layer stack and the sensing medium.
Figure 7 shows the angle-resolved profiles underlying the Co/Ag and Co/Au bilayer comparison. Computed MO-SPR sensitivities, defined as the percentage change of the field-modulated reflected intensity per refractive-index unit, are shown for Co (8 nm)/Ag (35 nm) and Co (8 nm)/Au (35 nm) bilayers at 632.8 and 785 nm, in a gaseous (air–helium) and a liquid (water–methanol) sensing medium [14]. For these bilayers, the maximum values tabulated in the same study show that the Co/Ag stack reaches ~8.0 × 10⁵ %/RIU in air at 785 nm, compared with ~2.2 × 10⁵ %/RIU for Co/Au, whereas in the aqueous medium at the same wavelength the values fall to ~5.7 × 10⁴ and ~9.0 × 10⁴ %/RIU, respectively [14]. This medium-dependent reduction, approximately 14-fold for Co/Ag but only 2.4-fold for Co/Au, reverses the ranking of the two stacks. Physically, the higher permittivity of water shifts the resonance to larger angles and alters the balance between radiative coupling and absorption in the stack, so the optimal metal and thickness differ between gas and liquid. It is the aqueous rather than the gaseous value that should be compared with biosensing claims, and because these values are numerical, they serve as an idealized benchmark rather than as demonstrated device performance.
7.3. Localized and Metal-Free Magnetoplasmonics
Localized architectures carry the differential principle to the nanoscale. Phase-sensitive magneto-optical readout of Ni nanoantenna arrays substantially improved the refractometric FOM and gave a raw surface sensitivity about two orders of magnitude higher than values reported for nanoplasmonic sensors, corresponding to the detection of approximately 0.8 ag of polyamide per nanoantenna [40]; the test layer, however, was a polymer film rather than a biomolecular binding event in a biological fluid. Ferromagnetic constituents also add optical loss, which broadens Γ and, through Equation (8), works against the very signal they create.
A conceptually different route avoids ferromagnets altogether. In a degenerately doped semiconductor nanocrystal, an applied field acts directly on the free carriers through the Lorentz force and lifts the degeneracy of the two circularly polarized localized plasmon modes. To first order, the splitting is set by the cyclotron frequency:
where m* is the carrier effective mass [41]. The estimate is instructive: for m* of the order of 0.3 me and B = 1.4 T, ħωc ≈ 0.5 meV, less than 10−3 of a plasmon energy of ~0.68 eV at 1825 nm. The magneto-optical signal is therefore a small perturbation that grows linearly with the field, which is why such experiments are performed at tesla-scale fields, and why a light effective mass and a narrow plasmon line are the material parameters that matter. Figure 8 shows the experiment of Gabbani et al., in which colloidal Sn-doped In2O3 (ITO) and F,In-codoped CdO (FICO) nanocrystals support near-infrared localized plasmons at ~1825 nm and ~1883 nm, respectively [41]. Faraday rotation and ellipticity spectra were recorded in solvents of increasing refractive index (CCl4, C2Cl4, and CS2) under a 1.4 T field, and the ellipticity sensitivity of FICO (1.24 °/RIU, compared with 0.29 °/RIU for ITO) exceeded, by the authors’ comparison, that of their earlier Au-nanoparticle system by approximately 40-fold and that of Ni nanodisks by approximately 2.5-fold [41]. Because the observable is odd in the field, it can in principle be separated from field-independent drift by lock-in detection, the same principle illustrated for the planar case in Figure 6. The experiment also makes explicit the instrumentation cost of the approach, namely a tesla-scale field and near-infrared polarimetry, and it was performed in neat solvents rather than biological media; translation will require demonstrations at modest fields on functionalized surfaces in aqueous samples.
It is still unresolved whether the instrumental burden of a magnetic field source, polarization optics, and lock-in detection is outweighed by the potential improvement in drift rejection or analyte discrimination, an improvement that has yet to be established in biological matrices, particularly because the strongest demonstrations to date are laboratory-grade heterostructures rather than field-deployed instruments. A perspective on magnetophotonic sensing identified the realization of compact devices able to transfer the technology from research laboratories to industry as the main remaining challenge [38]. The case for magnetoplasmonic biosensing is therefore best made with data, ideally through side-by-side comparisons of a magnetoplasmonic device and its non-magnetic counterpart on identical real-matrix samples. Systematic cross-study compilations of magnetoplasmonic sensor performance, including one in preparation, can support such comparisons only if individual studies report the axes of Table 2 explicitly.
8. Data-Driven Calibration: Machine Learning as Evidence, Not Alchemy
Machine learning and other artificial-intelligence methods are increasingly used for calibration, drift correction, and spectral classification. The practice is welcome, but the evidentiary bar should be the same as for any other calibration claim. A study integrating a regression model with gold-coated TFBG sensors showed that the trained model can recover surface-specific refractive-index dynamics directly from comb-like spectral features. Within the reported experimental protocol, this reduced or avoided a separate per-sensor calibration step, although the trained model still relies on calibration data and requires transfer validation on new devices; it also enabled, for the first time on that platform, real-time monitoring of surface refractive-index changes during a bioassay rather than only at its endpoint [10]. The advance is methodological: it addresses the bulk-versus-surface ambiguity of Equation (5) with data rather than with an assumed model, because the many cladding modes of a TFBG sample the surface with different penetration depths and so provide the multiple observables that a single resonance cannot.
Figure 9 shows the experimental basis of this claim. In an anti-insulin/insulin bioassay on a gold-coated TFBG, the surface refractive index retrieved by the trained model (Figure 9b,d) is compared with conventional cross-demodulation of the same spectra (Figure 9a,c), both during antibody immobilization and during sequential insulin injections at 0.1 and 1 µg/mL [10]. The model was trained on 23,030 spectra acquired in 470 refractometric experiments on 12 fibers at 49 polarization states, and the reported standard deviation of the model-based readout (~0.006 nm) is more than an order of magnitude below that of cross-demodulation (~0.1 nm), for a reported detection limit of 3 × 10⁻⁵ RIU [10]. Two features of the figure exemplify good practice. The upper bound of the training range (1.3432 RIU, an 8.2 mRIU shift from the buffer) is drawn on the plot, so the reader can see where the model is extrapolating; the ethanolamine-blocking step in Figure 9b, which exceeds this bound, is a case in point. In addition, the comparison with physics-based demodulation is made on identical data rather than on separate experiments.
More broadly, integrated platforms that couple nanomaterial transducers with real-time computation are beginning to deliver accurate quantitative output under continuous operation; a graphene-transistor-array platform, for example, achieved real-time, high-accuracy ion sensing with the electronic and computational integration needed for continuous monitoring rather than single-point measurement [42]. Data-driven sensing also carries a specific risk: models trained on limited or insufficiently diverse data generalize poorly and can be highly sensitive to changes in the underlying data [43]. In biosensing, such changes arise whenever the sample matrix, the instrument, or the fabrication batch differs from that used for training. Training-data provenance must therefore be reported, and independent tests should include held-out samples, acquisition days, and, where deployment is claimed, previously unseen instruments and fabrication batches in the intended matrix. A model trained only on idealized simulations does not carry the same evidentiary weight as one validated against fabricated devices under realistic conditions, and an unstated mismatch between training and validation matrices is a reporting gap comparable to an unstated buffer-versus-serum gap.
The same standard applies when machine learning is used for classification rather than calibration. Figure 10 shows the cancer-detection analysis of Shin et al., who combined SERS spectra of plasma-derived exosomes, acquired at 100 spots per sample on a gold-nanoparticle-aggregate substrate, with a convolutional neural network (CNN) classifier [44]. Evaluated on 520 held-out test subjects not used in training (healthy controls and patients with six types of early-stage cancer), the classifier identified cancer presence with an area under the receiver operating characteristic curve (AUC) of 0.970 (Figure 10e); the final integrated decision model, which also assigns the tissue of origin, reached a sensitivity of 90.2% at a specificity of 94.4% [44]. This subject-level hold-out tests within-study discrimination but does not independently establish multi-site, new-instrument, or prospective clinical transportability. Although SERS is not a refractometric mechanism, the study is directly relevant here because the training and test subjects are distinct, the measurements were made in the intended biological matrix, and the score distributions of the training and held-out test sets are shown side by side (Figure 10c), which provides a useful indication of potential overfitting. Because the design is retrospective, independent prospective and multi-site validation remains necessary; it is the step that would carry such a platform beyond TRL 5–6 in the framework of Table 5.
9. Miniaturization and the Benchtop-to-Bedside Gap
Miniaturization is not a packaging step that follows once the sensing chemistry works on a benchtop rig; it changes what must be demonstrated. The REASSURED criteria, which extend the earlier ASSURED framework with real-time connectivity and ease of specimen collection, treat analytical sensitivity as one attribute among several, alongside specificity, affordability, user-friendliness, speed and robustness, equipment-free operation, and delivery to end users [45]. Shrinking the optical path, light source, and readout electronics can degrade the very sensitivity demonstrated on benchtop systems [46]; in the terms of Equation (4), a compact source and detector usually lower the SNR and thereby increase σθ, and a less stable thermal environment raises the effective noise floor. A miniaturized biosensor that has not been benchmarked side by side against its benchtop counterpart on the same samples therefore presents an incomplete argument. The frontier between laboratory demonstrations and deployable diagnostics is accordingly defined by multiparametric sensing, integration, and miniaturization rather than by further gains in single-molecule sensitivity [47]. It is also defined by longitudinal, continuous monitoring rather than single-time-point measurement, a capability that will ultimately distinguish clinically valuable devices from incrementally improved research instruments [48].
Figure 11 shows what clinically benchmarked validation of a compact plasmonic reader looks like in practice. Li et al. combined nanozyme-catalyzed signal amplification with a metasurface plasmon sensor read by a portable optical quantification platform and measured three cancer biomarkers, carcinoembryonic antigen (CEA), cancer antigen 125 (CA125), and α-fetoprotein (AFP), in 60 clinical serum samples, comparing each result with the hospital’s clinical result for the same sample [49]. Agreement with the clinical results gave R2 = 0.961 (CEA), 0.880 (CA125), and 0.911 (AFP), and receiver operating characteristic analysis yielded sensitivity/specificity pairs of 95.7%/97.3%, 90.9%/93.9%, and 86.7%/97.8%, respectively [49]. Benchmarking of this kind, against a clinical reference on identical samples, is what every miniaturized platform should report. Correlation and R2 alone do not, however, demonstrate analytical agreement; they should be accompanied by estimates of bias, limits of agreement, and calibration error, and by predefined acceptable-error thresholds for clinical adoption. Two further qualifications apply. The assay is nanozyme-amplified rather than label-free and therefore trades the real-time kinetic information of refractometric SPR for sensitivity, and the comparatively lower agreement for CA125 indicates that matrix- or analyte-dependent differences persist even in a clinically benchmarked system, information that a buffer-only calibration could not have revealed.
10. Technology Readiness and Regulatory Validation Frameworks
The barriers that most often separate an elegant resonance from a translational contribution can be grouped into categories and mapped onto a technology-readiness framework.
The International Federation of Clinical Chemistry and Laboratory Medicine (IFCC) Committee on Mobile Health and Bioengineering in Laboratory Medicine has published a position statement that sets out validation and verification requirements specifically for biosensors and in vitro diagnostic (IVD) devices and links the rigor of data integration and validation to the stage of deployment [50]. Table 5 adapts this staged framing to optical and magnetoplasmonic biosensing by specifying, for each approximate TRL band, the evidence that addresses four categories of translation barrier: materials and interfaces, fabrication and scale-up, benchmarking and reproducibility, and regulatory validation. The corresponding evidence pathway is illustrated in Figure 12. None of these four categories is, by itself, a criterion for dismissing a study. Together, however, they distinguish an interesting resonance from a contribution that can fairly be called translational, and a brief statement of where the reported work sits in Table 5 prevents deployment readiness from being implied by omission.
Figure 12 condenses the staged logic of Table 5 into a single evidence ladder. Six stages (analytical or numerical modeling, controlled benchtop experiment, complex-sample testing, field or application-environment testing, clinical or regulatory validation where applicable, and the deployed system) are arranged along an arrow of increasing evidence and translation readiness rather than of increasing response magnitude. The stages correspond approximately to the TRL bands of Table 5: stage (a) to TRL 1–2, stage (b) to TRL 3–4, stage (c) to TRL 5–6, stage (d) to TRL 7–8, stage (e) to approximately TRL 8–9, depending on the applicable regulatory pathway, and stage (f) to TRL 9. These correspondences are illustrative and are not agency-specific readiness criteria. Mapped onto this ladder, the studies shown in Figure 4 and Figure 5, and 7–11 span only stages (a) to (c): the cortisol reflectance curves of Figure 5 and the MO-SPR sensitivities of Figure 7 are stage (a) simulations; the magnetoplasmonic nanocrystal and fiber-grating experiments of Figure 8 and Figure 9 are stage (b) benchtop demonstrations; and only the clinical-eluate, patient-plasma, and patient-serum measurements of Figure 4 and Figure 10, and 11 enter stage (c), of which only the hospital-benchmarked serum study of Figure 11 quantifies matrix-specific performance against a clinical reference [17,44,49]. None of the magnetoplasmonic studies discussed in Section 7 has yet reached stage (c); closing that gap is the most direct test of whether magnetic modulation improves drift rejection or analyte discrimination in practice. The closest recent experimental evidence is adjacent rather than clinical: with a four-spot functionalized MO-SPR/SPR chip, shrinkage linear discriminant analysis classified six gases and vapors with 88.3% overall accuracy using combined MO-SPR and SPR features, compared with 66.2% using SPR features alone, under within-dataset (leave-one-concentration-block-out) cross-validation [51]. This proof of concept belongs to stage (b): it concerns chemical vapors rather than clinical biosamples, and its classification performance reflects the functionalized multi-spot array together with its dual readout rather than magnetic modulation alone.
11. Research Priorities and Outlook
The evidence of Section 2, Section 3, Section 4, Section 5, Section 6, Section 7, Section 8, Section 9 and Section 10 suggests that the most consequential advances of the next several years will come from three convergences that the literature still largely treats separately, together with two reporting reforms that would make cross-study comparison possible at scale.
First, materials that are also manufacturable. The sensitivity gains reported experimentally for MXenes and predicted numerically for phosphorene and related 2D materials (Section 6) are substantial, but reproducibility and environmental-stability data remain the exception rather than the rule [30,31,32], even though the degradation pathways of the most widely used materials are well characterized [33,34]. The GST-capped silver study illustrates the point: an experimentally demonstrated, atomically thin adlayer reported with short-term stability and non-specific-binding data still lacks multi-batch and real-matrix validation [36]. Priority should therefore go to research that reports storage stability, atmosphere sensitivity, and multi-batch variance alongside any new sensitivity or FOM record.
Second, magneto-optical and hybrid modulation pursued as a route to drift-resilient measurement and evaluated against non-magnetic controls on identical real-matrix samples, rather than as an incremental sensitivity enhancement judged only against buffer-phase SPR baselines. Equation (8) states what such an evaluation should test: a magnetically modulated, potentially drift-resilient measurement whose normalized amplitude depends on the magneto-optical shift, lineshape, and background; any improvement in molecular discrimination requires head-to-head real-matrix evidence. The added instrumental complexity would be justified by a demonstrated improvement in discriminating specific binding from non-specific drift but is not yet justified by sensitivity numbers alone [8,14,15]. The aqueous-medium penalty in Figure 7 and the tesla-scale field in Figure 8 define, respectively, the surrounding-medium and instrumentation costs that such a comparison must account for [14,41].
Third, miniaturization without loss of analytical rigor. Every miniaturized platform should be benchmarked side by side against its benchtop counterpart or an established clinical reference on the same samples, and every longitudinal-monitoring claim should be demonstrated over the timescale it is meant to serve [45,46,47,48]. Figure 11 shows that benchmarking against an established clinical reference on identical samples is achievable within a single study [49].
Fourth, matrix-validated machine learning with explicitly stated data provenance (Section 8) [10,42,43]. Figure 9 and Figure 10 show two practical forms of such provenance: a plotted training-range boundary and a subject-level held-out test set in the intended biological matrix [10,44]; cross-device, cross-batch, time-separated, and prospective external validation remain the next steps.
Fifth, and most immediately actionable, standardized multi-axis reporting. A single sentence early in the Methods section of an experimental study can state where the reported sensitivity value sits on the nine axes of Table 2 (summarized graphically in Figure 2) and indicate the approximate position of the work on the technology-readiness scale of Table 5 (Figure 12). Such a statement takes little space, yet it would help turn a collection of individually impressive but mutually incomparable numbers into a body of literature on which clinicians, regulators, and other researchers can build.
None of these priorities diminishes the value of fundamental optical studies that make no diagnostic claim at all. Where a diagnostic claim is made, however, it should be held to these standards.
12. Conclusions
Optical biosensing has reached an inflection point. Fundamental sensitivity is no longer the principal bottleneck, and the credibility of the field with clinicians, regulators, and the diagnostics industry now depends on showing that laboratory performance survives contact with real samples and real users. The underlying physics explains why. A refractometric resonance samples a slab a few hundred nanometers thick and cannot, with a single observable, distinguish the analyte from any other mass or bulk change within it; its resolution is bounded by linewidth, noise, and temperature as much as by sensitivity. Elegant resonance curves are therefore plentiful, whereas devices that keep those curves stable when non-specific proteins foul the surface, when the sample is whole blood rather than a purified analyte, and when the instrument must survive shipping, storage, and a clinic without climate control remain scarce.
Several conclusions can be drawn with reasonable confidence. A reported sensitivity is interpretable only when its measurand, observable, interrogation mode, and evidence level are stated; matrix-specific detection limits, rather than buffer-phase limits, are the relevant metric for any diagnostic claim; and batch-to-batch reproducibility and interface stability are prerequisites rather than refinements. Other directions are plausible but not yet established. Magnetoplasmonic differential readout offers a physically well-founded, field-tagged measurement that can suppress selected sources of drift under appropriate modulation and normalization conditions, but the magnetoplasmonic studies discussed here have not progressed beyond benchtop demonstrations, and validation in complex biological matrices against non-magnetic controls remains to be shown. Machine-learning calibration can extract surface-specific information that conventional demodulation misses, but its value depends on reported data provenance and on independent testing across held-out samples, acquisition days, instruments, and fabrication batches in the intended matrix. The most urgent priorities are matrix-specific detection limits, multi-batch fabrication and stability data, and side-by-side comparisons of magnetic and non-magnetic readouts on identical clinical samples. Progress on these fronts will determine how quickly the field moves from what light can measure to what medicine can use.
Author Contributions
Conceptualization, C.R. and Y.K.P.; writing—original draft preparation, C.R.; writing—review and editing, C.R. and Y.K.P.; project administration, C.R. All authors have read and agreed to this version of the manuscript.
Funding
This research received no external funding. The work was supported by internal research and development resources of Seed NanoTech International Inc.
Institutional Review Board Statement
Not applicable.
Informed Consent Statement
Not applicable.
Data Availability Statement
No new experimental datasets were generated for this review. Comparative numerical values are drawn from the cited publications, and the previously published numerical case study discussed in Section 6.1 is identified and referenced in the text. The reproduced figures and reported results are available in the cited publications; the availability of the underlying raw data is governed by each source.
Acknowledgments
The authors thank the Editorial Office of Photonics for the invitation to serve as Guest Editors of the Special Issue. During the preparation of this work, the authors used ChatGPT (OpenAI) for language refinement, grammatical editing, and assistance with citation checking. The authors have reviewed and edited the output and take full responsibility for the content of this publication. Figure 2 and Figure 6, and 12 were created by the authors; all other figures are adapted from published sources, with the source and license given in the corresponding figure captions. The authors independently checked all figures, source numerical values, and license credits against the original publications.
Conflicts of Interest
Conrad Rizal is the founder and Chief Executive Officer of Seed NanoTech International Inc., a company developing optical sensing technologies. Both authors serve as Guest Editors of the Photonics Special Issue “Optical Biosensors: From Fundamental Optics to Diagnostic Applications”. The authors declare no other competing interests.
Abbreviations
The following abbreviations are used in this manuscript:
| 2D | two-dimensional |
| AFP | α-fetoprotein |
| ATR | attenuated total reflection |
| AUC | area under the receiver operating characteristic curve |
| CA125 | cancer antigen 125 |
| CEA | carcinoembryonic antigen |
| CNN | convolutional neural network |
| CVD | chemical vapor deposition |
| EDC–NHS | 1-ethyl-3-(3-dimethylaminopropyl) carbodiimide/N-hydroxysuccinimide |
| FICO | F,In-codoped CdO |
| FOM | figure of merit |
| GST | Ge2Sb2Te5 |
| HC | healthy control |
| IFCC | International Federation of Clinical Chemistry and Laboratory Medicine |
| IgG | immunoglobulin G |
| IL-1β | interleukin-1β |
| IL-6 | interleukin-6 |
| ITO | Sn-doped In2O3 |
| IVD | in vitro diagnostic |
| LoB | limit of blank |
| LoD | limit of detection |
| LSPR | localized surface plasmon resonance |
| miRNA | microRNA |
| MO-SPR | magneto-optic surface plasmon resonance |
| PBS | phosphate-buffered saline |
| PSA | prostate-specific antigen |
| RI | refractive index |
| RIU | refractive-index unit |
| ROC | receiver operating characteristic |
| RT-PCR | reverse-transcription polymerase chain reaction |
| SEIRA | surface-enhanced infrared absorption |
| SERS | surface-enhanced Raman scattering |
| SNR | signal-to-noise ratio |
| SPP | surface plasmon polariton |
| SPR | surface plasmon resonance |
| TFBG | tilted fiber Bragg grating |
| TMOKE | transverse magneto-optical Kerr effect |
| TNF-α | tumor necrosis factor-α |
| TRL | technology readiness level |
| WGM | whispering gallery mode |
References
- Kabashin, A.V.; Kravets, V.G.; Grigorenko, A.N. Label-free optical biosensing: going beyond the limits. Chem. Soc. Rev. 2023, 52, 6554–6585. [CrossRef]
- Fan, X.; White, I.M.; Shopova, S.I.; Zhu, H.; Suter, J.D.; Sun, Y. Sensitive optical biosensors for unlabeled targets: A review. Anal. Chim. Acta 2008, 620, 8–26. [CrossRef]
- Shen, C.; Sui, W.; Zhou, J.; Han, W.; Dong, J.; Fang, B.; Wang, Z. Review of Biosensors Based on Surface Plasmon Resonance. Laser Optoelectron. Prog. 2023, 60, 1106004. [CrossRef]
- Homola, J.; Yee, S.S.; Gauglitz, G. Surface plasmon resonance sensors: Review. Sens. Actuators B Chem. 1999, 54, 3–15. [CrossRef]
- Garg, K.; Mathur, A. Detection Limit Mediated Advancements in the Fabrication Technologies of SPR Biosensor. BIO Web Conf. 2026, 233, 03002. [CrossRef]
- Ramirez-Priego, P.; Mauriz, E.; Giarola, J.F.; Lechuga, L.M. Overcoming challenges in plasmonic biosensors deployment for clinical and biomedical applications: A systematic review and meta-analysis. Sens. Bio-Sens. Res. 2024, 46, 100717. [CrossRef]
- Altug, H.; Oh, S.-H.; Maier, S.A.; Homola, J. Advances and applications of nanophotonic biosensors. Nat. Nanotechnol. 2022, 17, 5–16. [CrossRef]
- Ignatyeva, D.O.; Knyazev, G.A.; Kapralov, P.O.; Dietler, G.; Sekatskii, S.K.; Belotelov, V.I. Magneto-optical plasmonic heterostructure with ultranarrow resonance for sensing applications. Sci. Rep. 2016, 6, 28077. [CrossRef]
- Liu, F.; Zhang, X.; Li, K.; Guo, T.; Ianoul, A.; Albert, J. Discrimination of Bulk and Surface Refractive Index Change in Plasmonic Sensors with Narrow Bandwidth Resonance Combs. ACS Sens. 2021, 6, 3013–3023. [CrossRef]
- Fasseaux, H.; Loyez, M.; Caucheteur, C. Machine learning unveils surface refractive index dynamics in comb-like plasmonic optical fiber biosensors. Commun. Eng. 2024, 3, 34. [CrossRef]
- Wang, H.; Wang, T.; Yuan, X.; Wang, Y.; Yue, X.; Wang, L.; Zhang, J.; Wang, J. Plasmonic Nanostructure Biosensors: A Review. Sensors 2023, 23, 8156. [CrossRef]
- Unser, S.; Bruzas, I.; He, J.; Sagle, L. Localized Surface Plasmon Resonance Biosensing: Current Challenges and Approaches. Sensors 2015, 15, 15684–15716. [CrossRef]
- Islam, M.S.; Sultana, J.; Aoni, R.A.; Habib, M.S.; Dinovitser, A.; Ng, B.W.-H.; Abbott, D. Localized surface plasmon resonance biosensor: An improved technique for SERS response intensification. Opt. Lett. 2019, 44, 1134–1137. [CrossRef]
- Rizal, C.; Pisana, S.; Hrvoic, I. Improved Magneto-Optic Surface Plasmon Resonance Biosensors. Photonics 2018, 5, 15. [CrossRef]
- David, S.; Polonschii, C.; Luculescu, C.; Gheorghiu, M.; Gáspár, S.; Gheorghiu, E. Magneto-plasmonic biosensor with enhanced analytical response and stability. Biosens. Bioelectron. 2015, 63, 525–532. [CrossRef]
- Loyez, M.; Adolphson, M.; Liao, J.; Yang, L. From Whispering Gallery Mode Resonators to Biochemical Sensors. ACS Sens. 2023, 8, 2440–2470. [CrossRef]
- Hu, J.; Safir, F.; Chang, K.; Dagli, S.; Balch, H.B.; Abendroth, J.M.; Dixon, J.; Moradifar, P.; Dolia, V.; Sahoo, M.K.; Pinsky, B.A.; Jeffrey, S.S.; Lawrence, M.; Dionne, J.A. Rapid genetic screening with high quality factor metasurfaces. Nat. Commun. 2023, 14, 4486. [CrossRef]
- Zhou, H.; Li, D.; Lv, Q.; Lee, C. Integrative plasmonics: optical multi-effects and acousto-electric-thermal fusion for biosensing, energy conversion, and photonic circuits. Chem. Soc. Rev. 2025, 54, 5342–5432. [CrossRef]
- Mariani, S.; Minunni, M. Surface plasmon resonance applications in clinical analysis. Anal. Bioanal. Chem. 2014, 406, 2303–2323. [CrossRef]
- Rizal, C. Recent Advances in Magnetooptics: Innovations in Materials, Techniques, and Applications. Magnetism 2026, 6, 3. [CrossRef]
- Thévenot, D.R.; Toth, K.; Durst, R.A.; Wilson, G.S. Electrochemical biosensors: recommended definitions and classification. Anal. Lett. 2001, 34, 635–659. [CrossRef]
- Weber, T.E.; Fritschen, A.; Prins, M.W.J.; Blaeser, A. What Is a Biosensor?—A Terminological Guide From Biomolecular Recognition to Bioindicators. Eng. Life Sci. 2026, 26, e70068. [CrossRef]
- Verma, V.K.; Pal, S.; Rizal, C.; Prajapati, Y.K. Tunable and Sensitive Detection of Cortisol Using Anisotropic Phosphorene with a Surface Plasmon Resonance Technique: Numerical Investigation. Magnetochemistry 2022, 8, 31. [CrossRef]
- Lichtenberg, J.Y.; Ling, Y.; Kim, S. Non-Specific Adsorption Reduction Methods in Biosensing. Sensors 2019, 19, 2488. [CrossRef]
- Barbosa, A.I.; Edwards, A.D.; Reis, N.M. Antibody Surface Coverage Drives Matrix Interference in Microfluidic Capillary Immunoassays. ACS Sens. 2021, 6, 2682–2690. [CrossRef]
- Mascini, M.; Palmieri, S.; Eugelio, F.; Rivero, M.I.; Del Carlo, M. Analytical Performances of Polymer-Based Biosensors for Real Samples Application. Biosensors 2026, 16, 207. [CrossRef]
- Bhardwaj, S.K.; Singh, H.; Khatri, M.; Kim, K.-H.; Bhardwaj, N. Advances in MXenes-based optical biosensors: A review. Biosens. Bioelectron. 2022, 202, 113995. [CrossRef]
- Soler, M.; Lechuga, L.M. Biochemistry strategies for label-free optical sensor biofunctionalization: advances towards real applicability. Anal. Bioanal. Chem. 2022, 414, 5071–5085. [CrossRef]
- Xue, T.; Liang, W.; Li, Y.; Sun, Y.; Xiang, Y.; Zhang, Y.; Dai, Z.; Duo, Y.; Wu, L.; Qi, K.; Shivananju, B.N.; Zhang, L.; Cui, X.; Zhang, H.; Bao, Q. Ultrasensitive detection of miRNA with an antimonene-based surface plasmon resonance sensor. Nat. Commun. 2019, 10, 28. [CrossRef]
- Ali, A.; Majhi, S.M.; Siddig, L.A.; Deshmukh, A.H.; Wen, H.; Qamhieh, N.N.; Greish, Y.E.; Mahmoud, S.T. Recent Advancements in MXene-Based Biosensors for Health and Environmental Applications—A Review. Biosensors 2024, 14, 497. [CrossRef]
- Sengupta, J.; Hussain, C.M. MXene-Based Electrochemical Biosensors: Advancing Detection Strategies for Biosensing (2020–2024). Biosensors 2025, 15, 127. [CrossRef]
- Singha Roy, A.; Babu, N.; Hussain, A. Two-Dimensional MXenes as Next-Generation Nanomaterials for Biosensing and Hydrogen Production. Nanotechnol. Sci. Appl. 2026, 19, 1–27. [CrossRef]
- Zhang, C.J.; Pinilla, S.; McEvoy, N.; Cullen, C.P.; Anasori, B.; Long, E.; Park, S.-H.; Seral-Ascaso, A.; Shmeliov, A.; Krishnan, D.; Morant, C.; Liu, X.; Duesberg, G.S.; Gogotsi, Y.; Nicolosi, V. Oxidation Stability of Colloidal Two-Dimensional Titanium Carbides (MXenes). Chem. Mater. 2017, 29, 4848–4856. [CrossRef]
- Island, J.O.; Steele, G.A.; van der Zant, H.S.J.; Castellanos-Gomez, A. Environmental instability of few-layer black phosphorus. 2D Mater. 2015, 2, 011002. [CrossRef]
- Liu, H.; Xing, X.; Tan, Y.; Dong, H. Two-dimensional transition metal carbides and nitrides (MXenes) based biosensing and molecular imaging. Nanophotonics 2022, 11, 4977–4993. [CrossRef]
- Zhu, S.; Jaffiol, R.; Crunteanu, A.; Vézy, C.; Chan, S.-T.; Yuan, W.; Ho, H.-P.; Zeng, S. Label-free biosensing with singular-phase-enhanced lateral position shift based on atomically thin plasmonic nanomaterials. Light Sci. Appl. 2024, 13, 2. [CrossRef]
- Armbruster, D.A.; Pry, T. Limit of blank, limit of detection and limit of quantitation. Clin. Biochem. Rev. 2008, 29, S49–S52.
- Rizal, C.; Manera, M.G.; Ignatyeva, D.O.; Mejía-Salazar, J.R.; Rella, R.; Belotelov, V.I.; Pineider, F.; Maccaferri, N. Magnetophotonics for sensing and magnetometry toward industrial applications. J. Appl. Phys. 2021, 130, 230901. [CrossRef]
- Sepúlveda, B.; Calle, A.; Lechuga, L.M.; Armelles, G. Highly sensitive detection of biomolecules with the magneto-optic surface-plasmon-resonance sensor. Opt. Lett. 2006, 31, 1085–1087. [CrossRef]
- Maccaferri, N.; Gregorczyk, K.E.; de Oliveira, T.V.A.G.; Kataja, M.; van Dijken, S.; Pirzadeh, Z.; Dmitriev, A.; Åkerman, J.; Knez, M.; Vavassori, P. Ultrasensitive and label-free molecular-level detection enabled by light phase control in magnetoplasmonic nanoantennas. Nat. Commun. 2015, 6, 6150. [CrossRef]
- Gabbani, A.; Sangregorio, C.; Tandon, B.; Nag, A.; Gurioli, M.; Pineider, F. Magnetoplasmonics beyond Metals: Ultrahigh Sensing Performance in Transparent Conductive Oxide Nanocrystals. Nano Lett. 2022, 22, 9036–9044. [CrossRef]
- Xue, M.; Mackin, C.; Weng, W.-H.; Zhu, J.; Luo, Y.; Luo, S.-X.L.; Lu, A.-Y.; Hempel, M.; McVay, E.; Kong, J.; Palacios, T. Integrated biosensor platform based on graphene transistor arrays for real-time high-accuracy ion sensing. Nat. Commun. 2022, 13, 5064. [CrossRef]
- Schackart, K.E., III; Yoon, J.-Y. Machine Learning Enhances the Performance of Bioreceptor-Free Biosensors. Sensors 2021, 21, 5519. [CrossRef]
- Shin, H.; Choi, B.H.; Shim, O.; Kim, J.; Park, Y.; Cho, S.K.; Kim, H.K.; Choi, Y. Single test-based diagnosis of multiple cancer types using Exosome-SERS-AI for early stage cancers. Nat. Commun. 2023, 14, 1644. [CrossRef]
- Land, K.J.; Boeras, D.I.; Chen, X.-S.; Ramsay, A.R.; Peeling, R.W. REASSURED diagnostics to inform disease control strategies, strengthen health systems and improve patient outcomes. Nat. Microbiol. 2019, 4, 46–54. [CrossRef]
- Puiu, M.; Bala, C. SPR and SPR Imaging: Recent Trends in Developing Nanodevices for Detection and Real-Time Monitoring of Biomolecular Events. Sensors 2016, 16, 870. [CrossRef]
- Masuda, K.; Gordon, R.; Kukura, P.; Langhammer, C.; Oh, S.-H.; Vollmer, F.; Zijlstra, P. Future directions in all-optical label-free single-molecule sensing. npj Biosens. 2026, 3, 3. [CrossRef]
- Roy, N.; Powers, M.; Gonzalez, M.; Cucullo, L. Beyond Detection Limits: Integrated Biosensors for Molecular Diagnostics, Longitudinal Monitoring, and Clinical Translation. Biosensors 2026, 16, 477. [CrossRef]
- Li, R.; Fan, H.; Zhou, H.; Chen, Y.; Yu, Q.; Hu, W.; Liu, G.L.; Huang, L. Nanozyme-Catalyzed Metasurface Plasmon Sensor-Based Portable Ultrasensitive Optical Quantification Platform for Cancer Biomarker Screening. Adv. Sci. 2023, 10, 2301658. [CrossRef]
- Gruson, D.; Cobbaert, C.; Dabla, P.K.; Stankovic, S.; Homsak, E.; Kotani, K.; Assaad, R.S.; Nichols, J.H.; Gouget, B. Validation and verification framework and data integration of biosensors and in vitro diagnostic devices: a position statement of the IFCC Committee on Mobile Health and Bioengineering in Laboratory Medicine (C-MHBLM) and the IFCC Scientific Division. Clin. Chem. Lab. Med. 2024, 62, 1904–1917. [CrossRef]
- David, S.; Polonschii, C.; Cocos-Barbu, E.G.; Bratu, D.; Gheorghiu, E. Magneto-Optical Surface Plasmon Resonance Multi-Spot Assay for Identification and Quantification of Gaseous Compounds at Room Temperature. Sensors 2026, 26, 4537. [CrossRef]
Figure 1.
Roadmap of integrative plasmonics. Classical plasmonics comprises single-effect modalities established after the first observation of plasmonic grating anomalies in 1902: surface plasmon polaritons (SPPs) probed by surface plasmon resonance (SPR), localized surface plasmons probed by localized SPR (LSPR), surface-enhanced Raman scattering (SERS), and surface-enhanced infrared absorption (SEIRA). Integrative plasmonics combines several optical effects (“optical multi-effects”, e.g., plasmon–phonon coupling, electromagnetically induced transparency or absorption, nanocavities, and nonlinear and chiral responses) and fuses plasmonics with acoustic, electronic, and thermal technologies. The circular inset shows the three principal application domains: molecular diagnostics, energy conversion, and photonic integrated circuits. Reprinted from Ref. [18] under the terms of the CC BY 3.0 license.
Figure 1.
Roadmap of integrative plasmonics. Classical plasmonics comprises single-effect modalities established after the first observation of plasmonic grating anomalies in 1902: surface plasmon polaritons (SPPs) probed by surface plasmon resonance (SPR), localized surface plasmons probed by localized SPR (LSPR), surface-enhanced Raman scattering (SERS), and surface-enhanced infrared absorption (SEIRA). Integrative plasmonics combines several optical effects (“optical multi-effects”, e.g., plasmon–phonon coupling, electromagnetically induced transparency or absorption, nanocavities, and nonlinear and chiral responses) and fuses plasmonics with acoustic, electronic, and thermal technologies. The circular inset shows the three principal application domains: molecular diagnostics, energy conversion, and photonic integrated circuits. Reprinted from Ref. [18] under the terms of the CC BY 3.0 license.
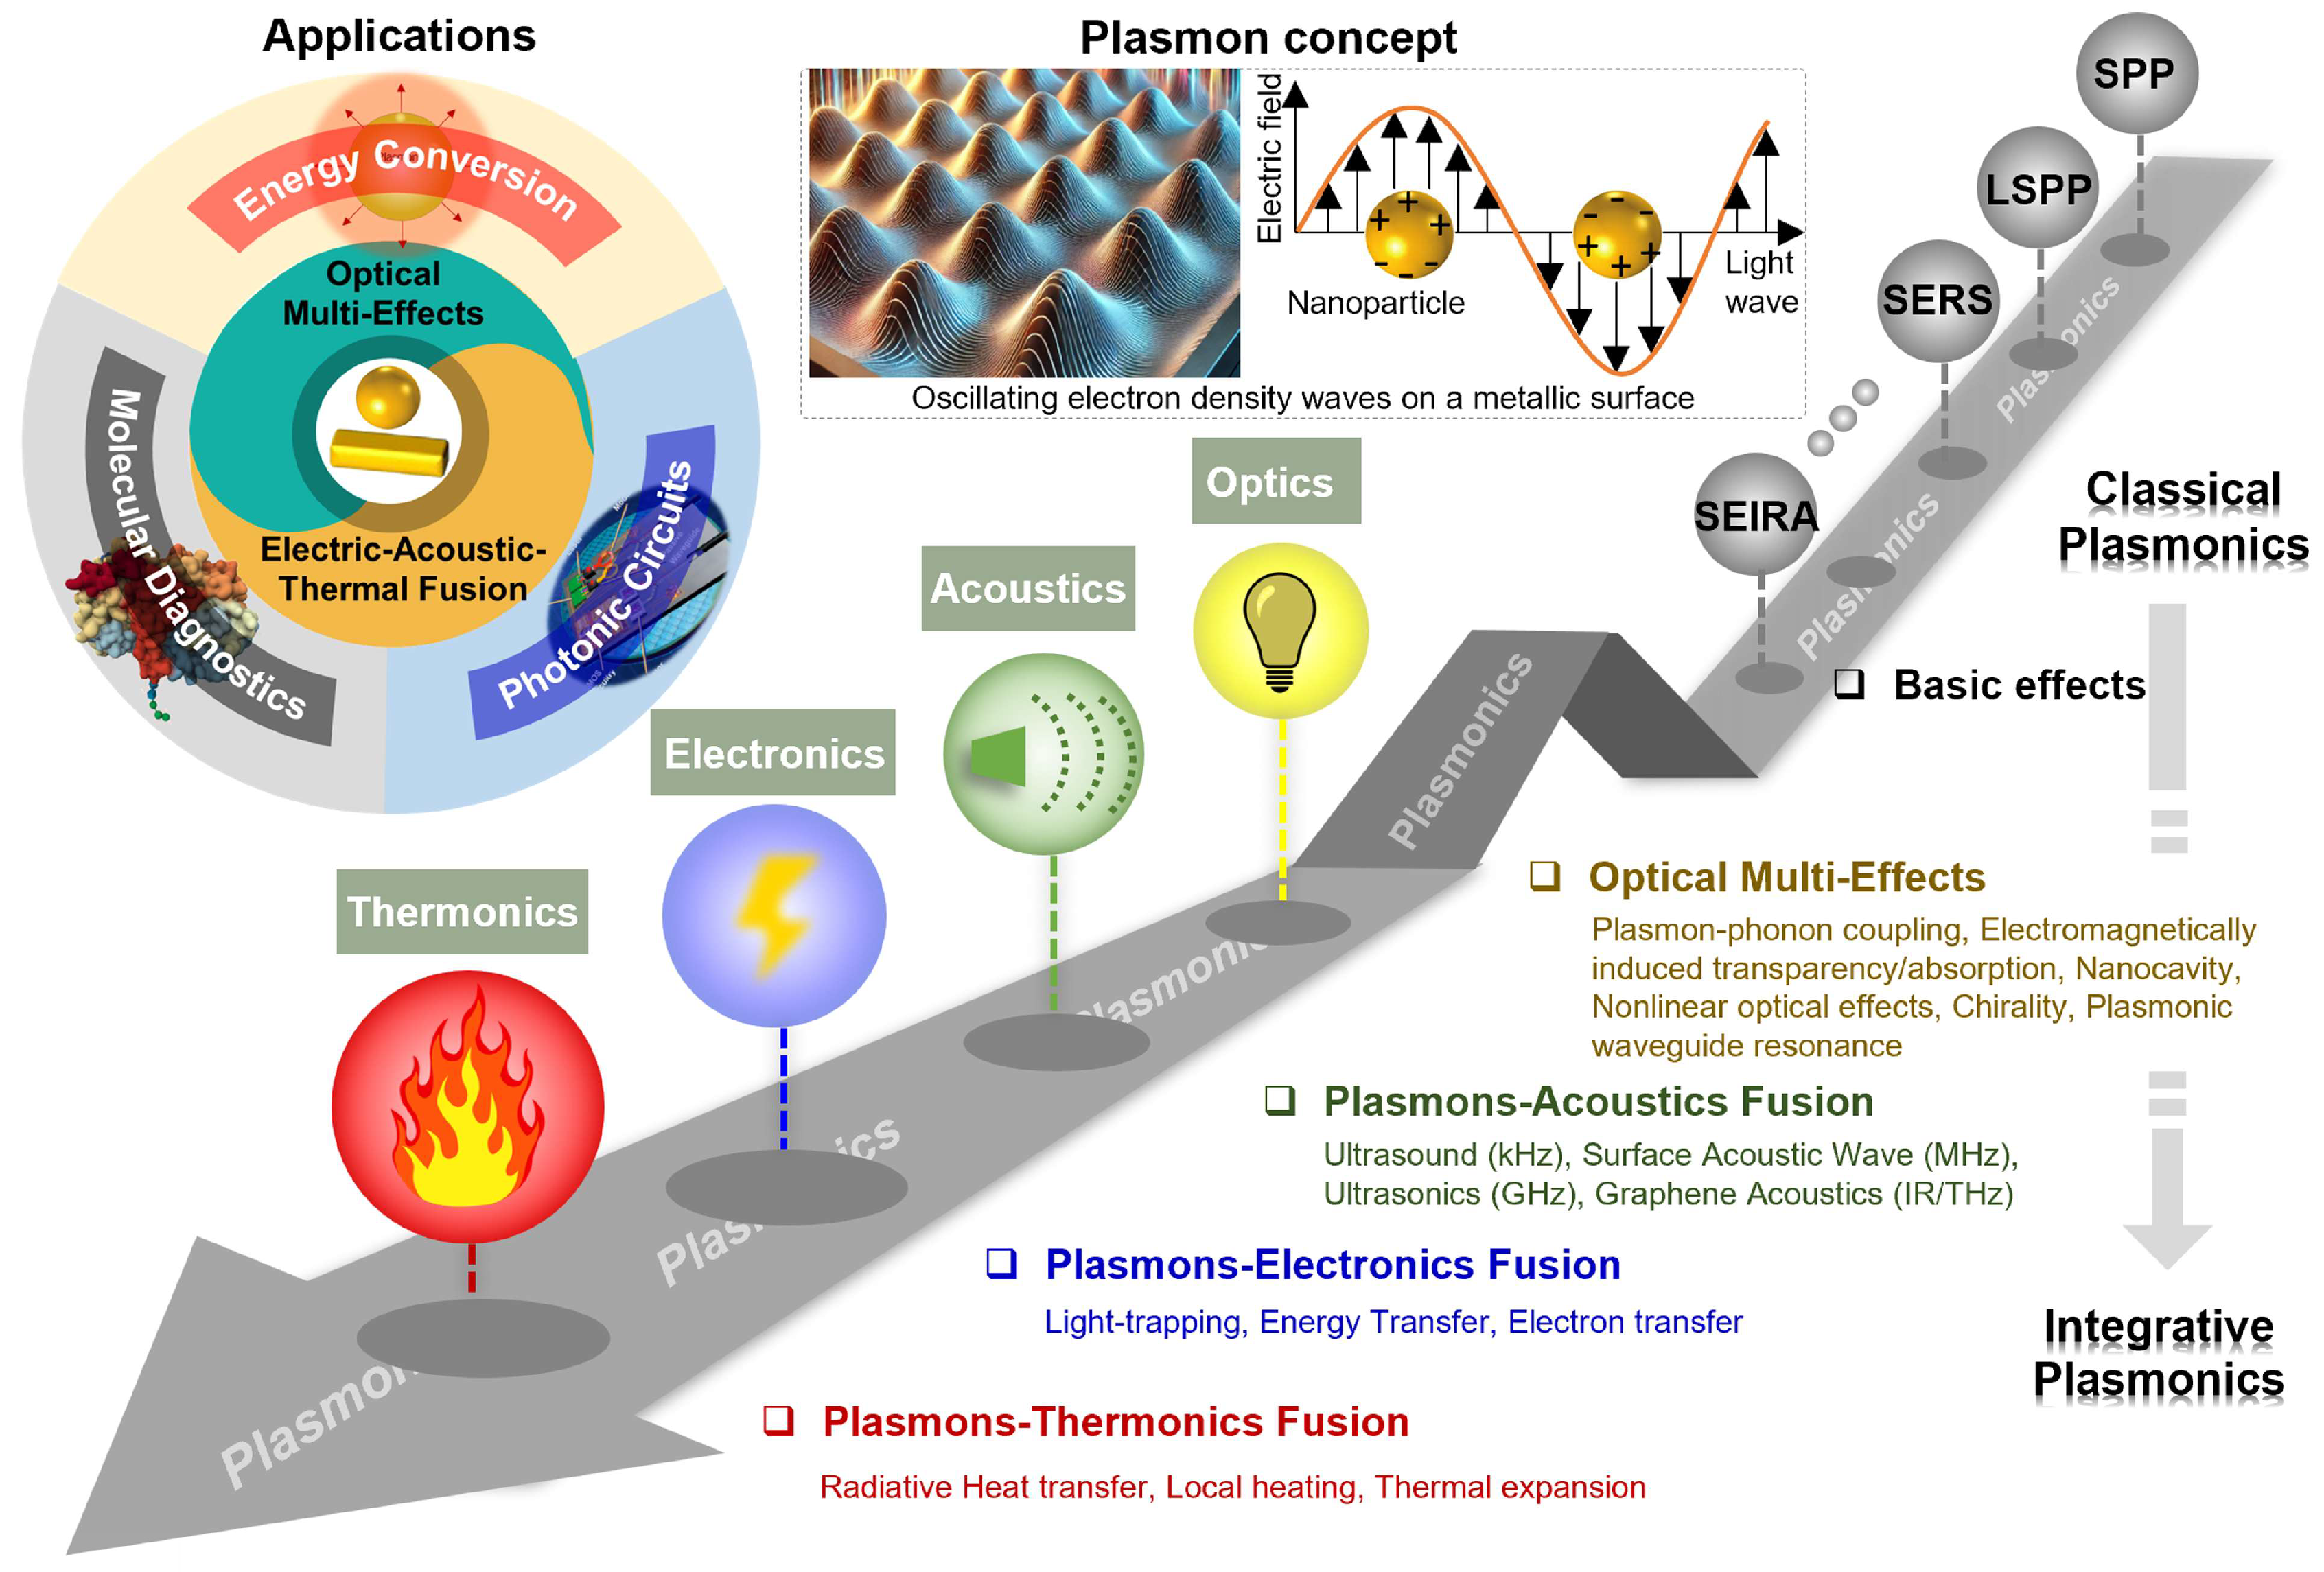
Figure 2.
Multidimensional classification framework in which a sensor is described as a single, unified record. Rather than assigning a device to one rigid category, the framework describes it along eight complementary descriptors (outer boxes) that converge on a common sensor record (center): the measurand (the quantity sought), the recognition mechanism (how the target interacts), the transduction pathway (the physical signal domain), the observable (what the instrument reads), the interrogation method (what is scanned), the architecture (geometry and level of integration), the magnetic role (none, modulation, or handling), and the evidence level (from model to deployment). Arrows indicate that all descriptors apply to the same device simultaneously. The descriptors correspond to the axes of Table 2, with device architecture and system-integration level combined.
Figure 2.
Multidimensional classification framework in which a sensor is described as a single, unified record. Rather than assigning a device to one rigid category, the framework describes it along eight complementary descriptors (outer boxes) that converge on a common sensor record (center): the measurand (the quantity sought), the recognition mechanism (how the target interacts), the transduction pathway (the physical signal domain), the observable (what the instrument reads), the interrogation method (what is scanned), the architecture (geometry and level of integration), the magnetic role (none, modulation, or handling), and the evidence level (from model to deployment). Arrows indicate that all descriptors apply to the same device simultaneously. The descriptors correspond to the axes of Table 2, with device architecture and system-integration level combined.
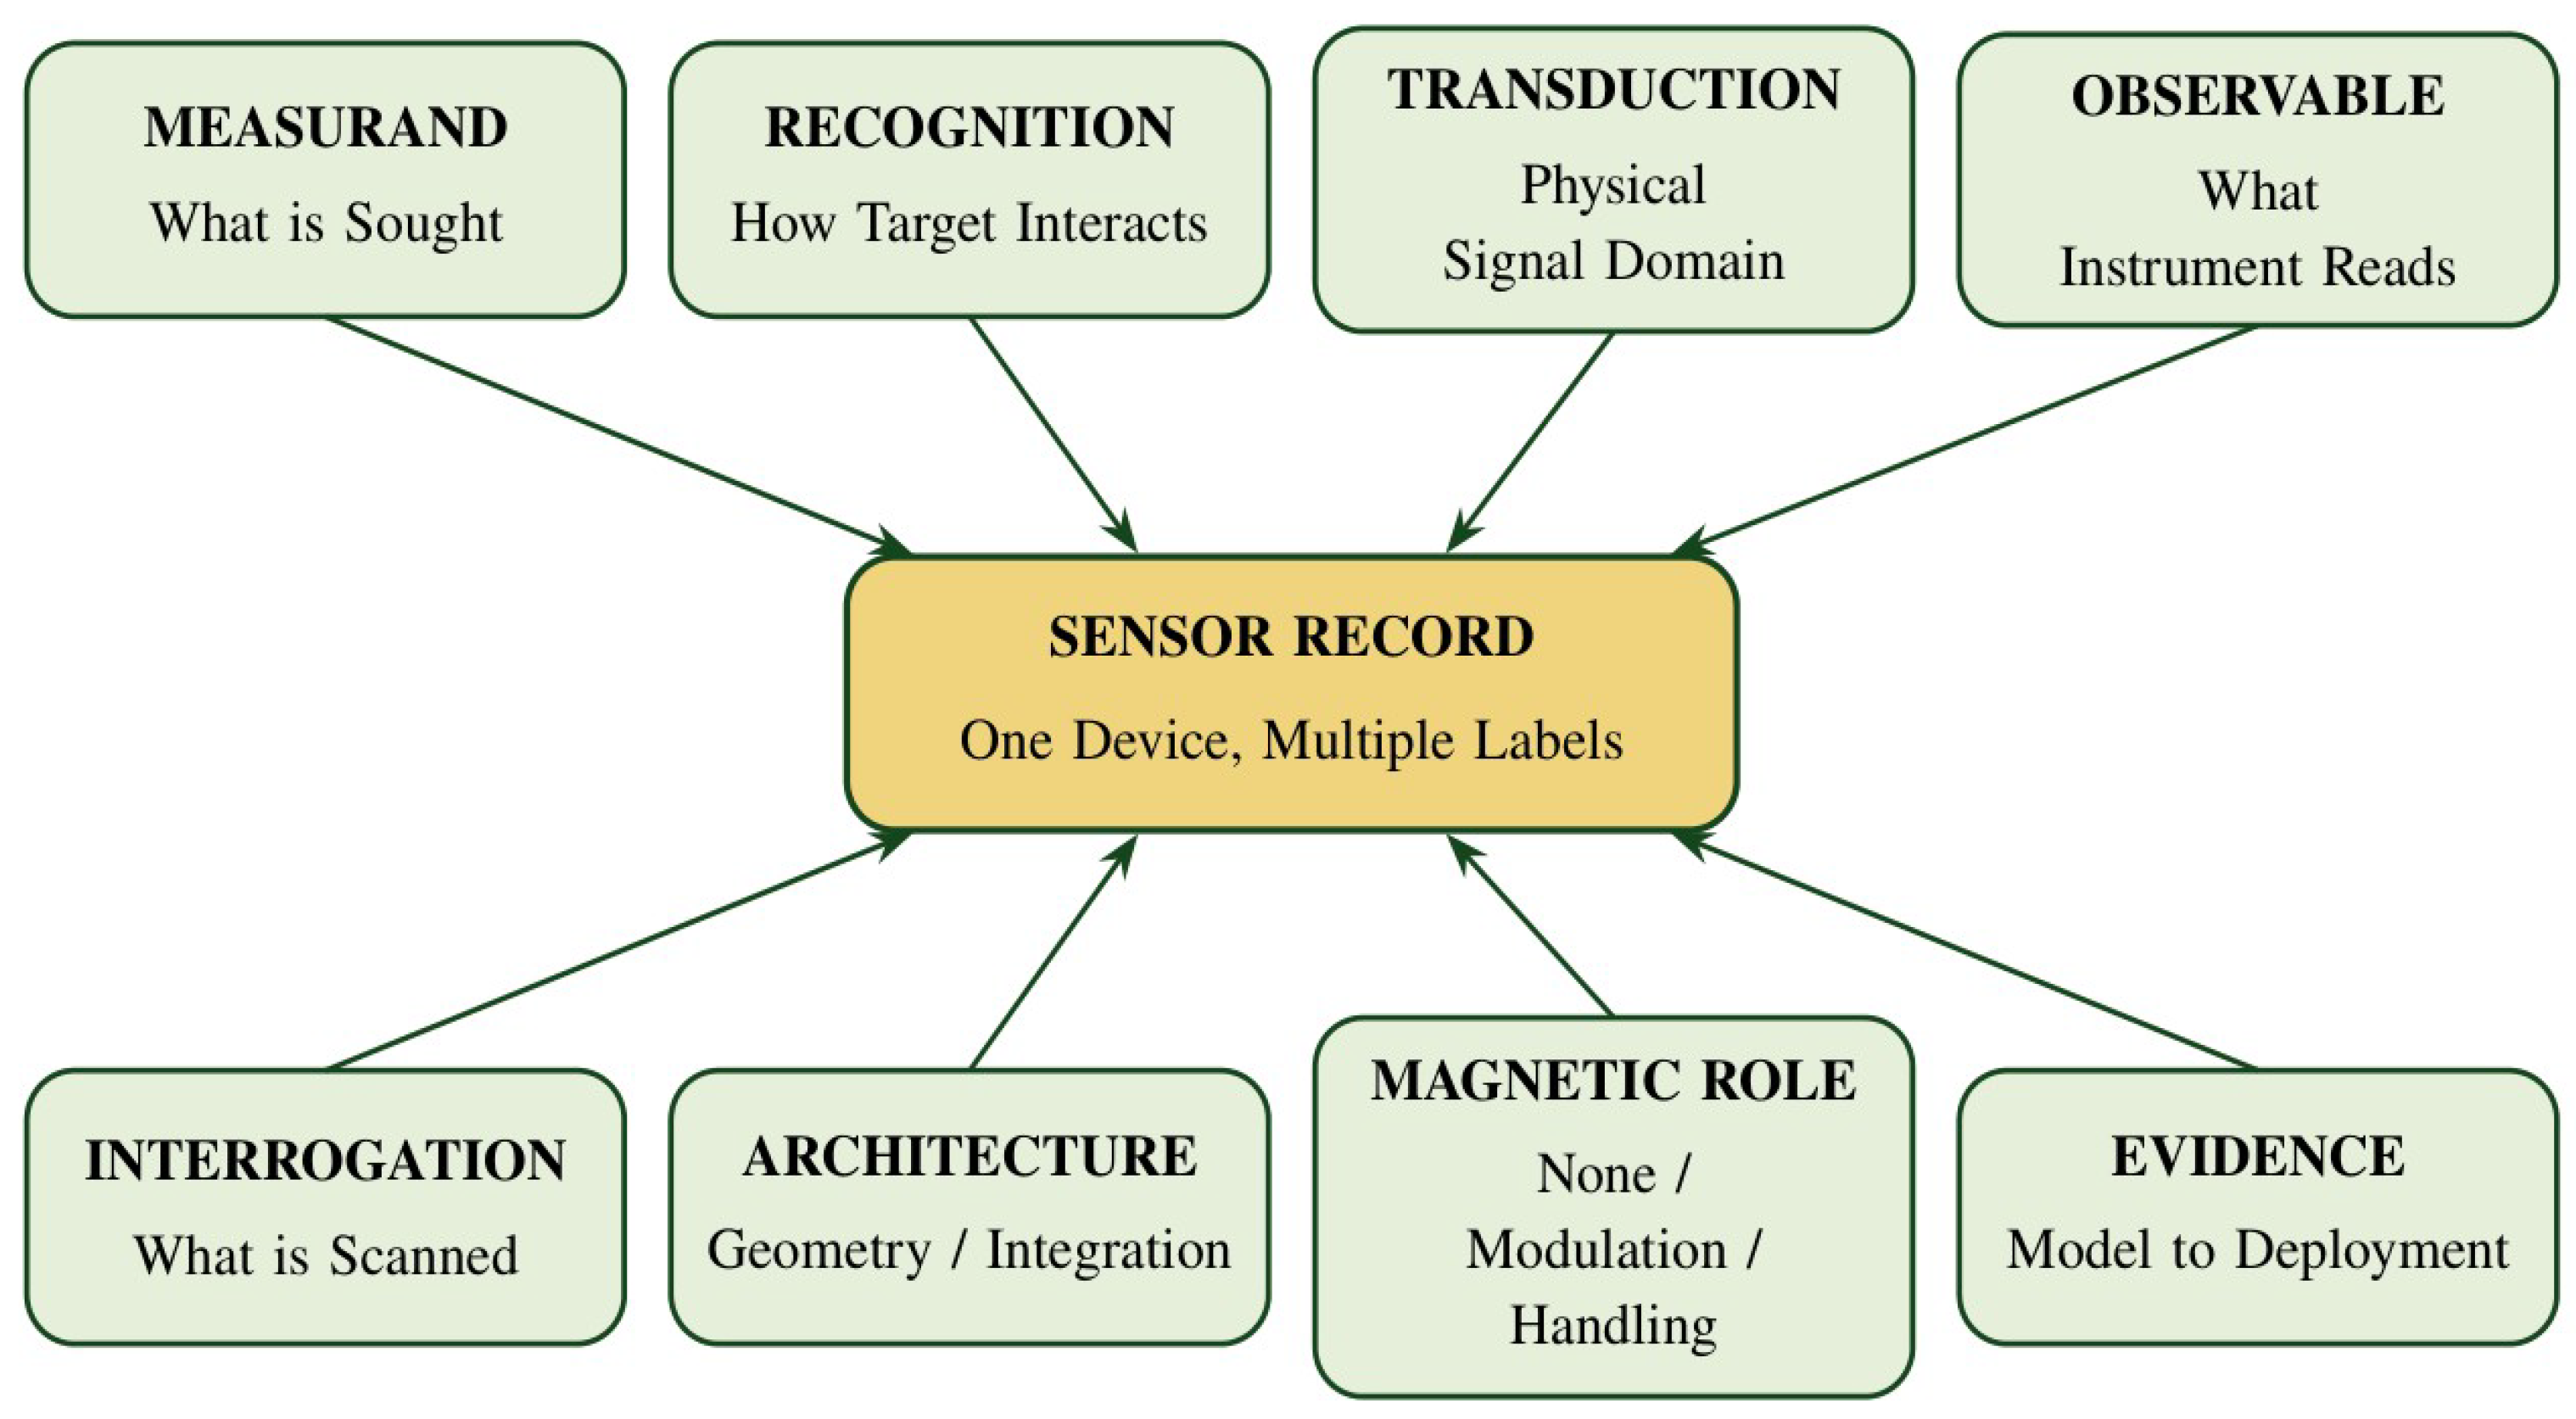
Figure 3.
Evanescent-field optical biosensing and the surface-chemistry parameters that govern performance in real samples. (a) Schematic of an optical biosensor based on the evanescent-field sensing mechanism: light coupled into the photonic sensor generates an evanescent field (red shading) that penetrates into the medium in which bioreceptors (green) capture the analyte (yellow), and the resulting refractive-index change modifies the optical properties of the output light (e.g., intensity or wavelength). (b) Main optimization parameters in sensor surface biofunctionalization: bioreceptor orientation (random vs. end-on; top), grafting density (low, optimum, and high; middle), and antifouling coating (non-coated vs. coated surface, which repels non-specific proteins shown in red; bottom). Reprinted from Ref. [28] under the terms of the CC BY 4.0 license.
Figure 3.
Evanescent-field optical biosensing and the surface-chemistry parameters that govern performance in real samples. (a) Schematic of an optical biosensor based on the evanescent-field sensing mechanism: light coupled into the photonic sensor generates an evanescent field (red shading) that penetrates into the medium in which bioreceptors (green) capture the analyte (yellow), and the resulting refractive-index change modifies the optical properties of the output light (e.g., intensity or wavelength). (b) Main optimization parameters in sensor surface biofunctionalization: bioreceptor orientation (random vs. end-on; top), grafting density (low, optimum, and high; middle), and antifouling coating (non-coated vs. coated surface, which repels non-specific proteins shown in red; bottom). Reprinted from Ref. [28] under the terms of the CC BY 4.0 license.
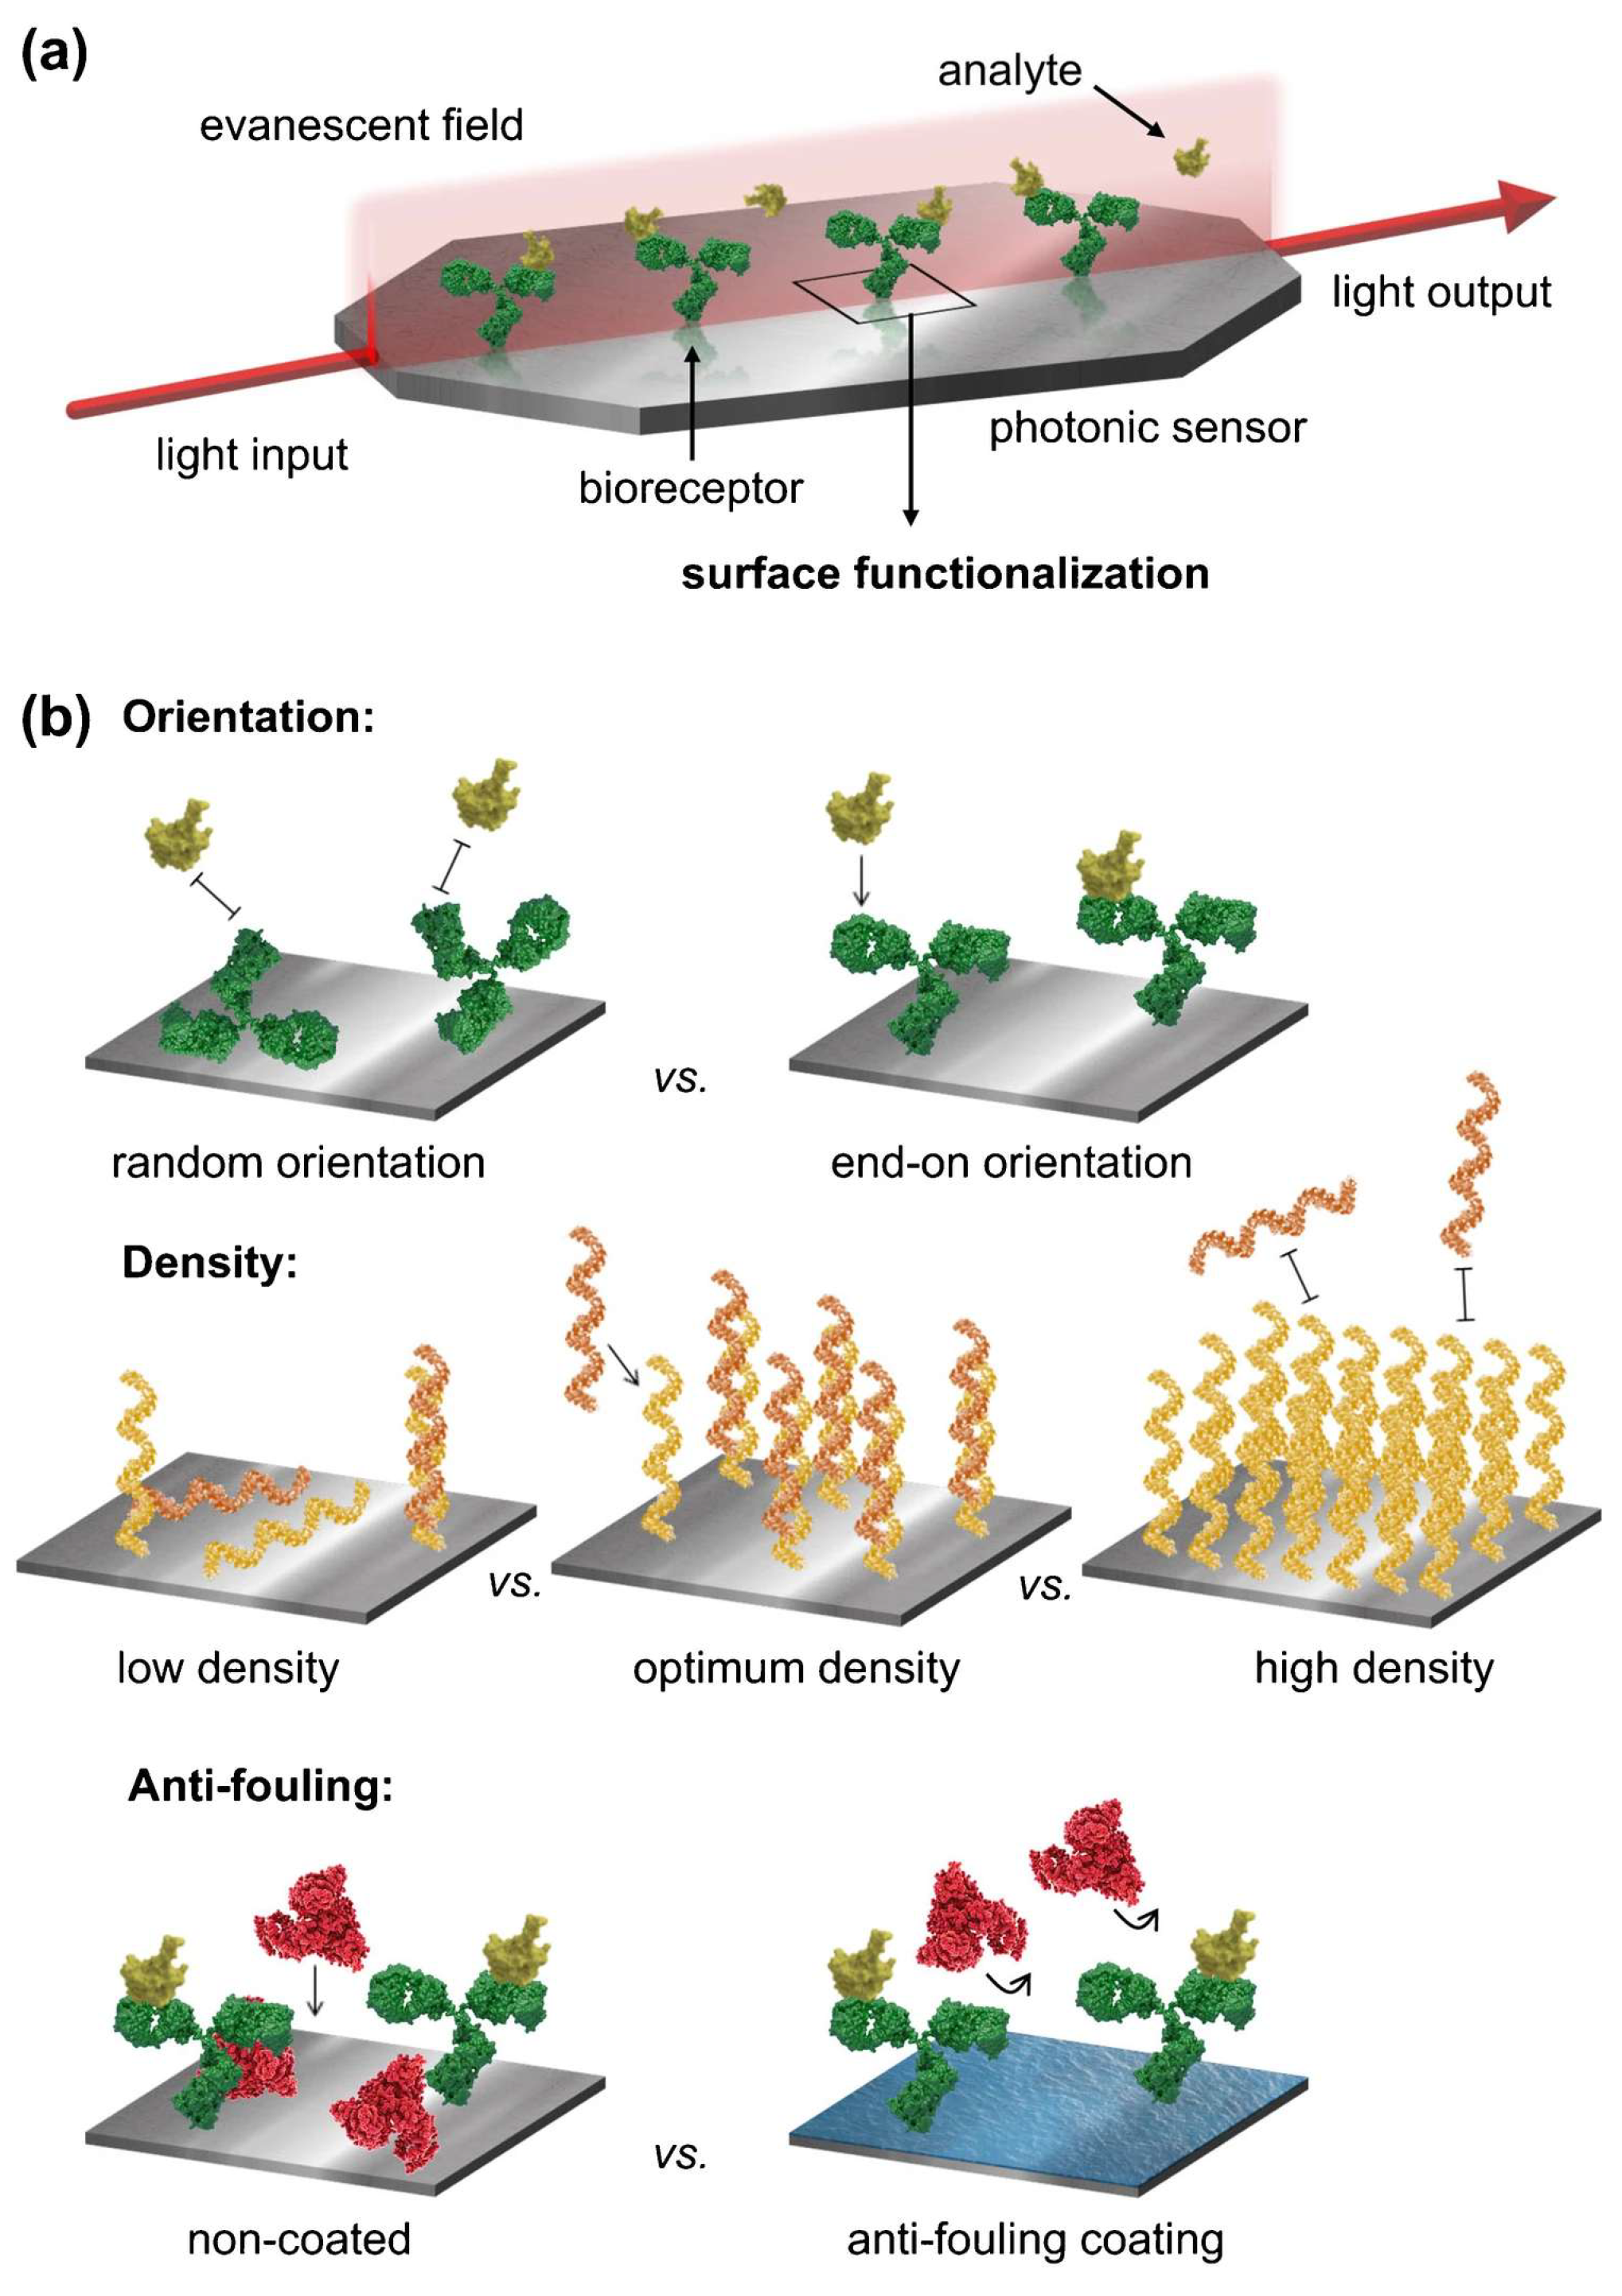
Figure 4.
Kinetic binding response and measurement in clinical samples on a high-quality-factor (high-Q) silicon metasurface biosensor. (a) Time-dependent resonance shifts of 10 distinct resonators exposed to 1 fM, 1 pM, 1 nM, and 1 µM of the SARS-CoV-2 nCoV.E gene-fragment target. (b) Detection in clinical nasopharyngeal eluates: swab extracts confirmed SARS-CoV-2-negative by reverse-transcription polymerase chain reaction (RT-PCR) served as negative samples, and the same matrix spiked with target at 100 nM served as the positive sample; the lower trace shows the wavelength shift during sequential exposure to buffer, negative eluate, buffer, positive eluate, and buffer, with minimal non-specific binding and persistent specific target binding indicated by arrows. The buffer-phase limit of detection of the platform (~8 fM; average Q ≈ 2200) was determined in a separate calibration in the original study. Reprinted from Ref. [17] under the terms of the CC BY 4.0 license.
Figure 4.
Kinetic binding response and measurement in clinical samples on a high-quality-factor (high-Q) silicon metasurface biosensor. (a) Time-dependent resonance shifts of 10 distinct resonators exposed to 1 fM, 1 pM, 1 nM, and 1 µM of the SARS-CoV-2 nCoV.E gene-fragment target. (b) Detection in clinical nasopharyngeal eluates: swab extracts confirmed SARS-CoV-2-negative by reverse-transcription polymerase chain reaction (RT-PCR) served as negative samples, and the same matrix spiked with target at 100 nM served as the positive sample; the lower trace shows the wavelength shift during sequential exposure to buffer, negative eluate, buffer, positive eluate, and buffer, with minimal non-specific binding and persistent specific target binding indicated by arrows. The buffer-phase limit of detection of the platform (~8 fM; average Q ≈ 2200) was determined in a separate calibration in the original study. Reprinted from Ref. [17] under the terms of the CC BY 4.0 license.
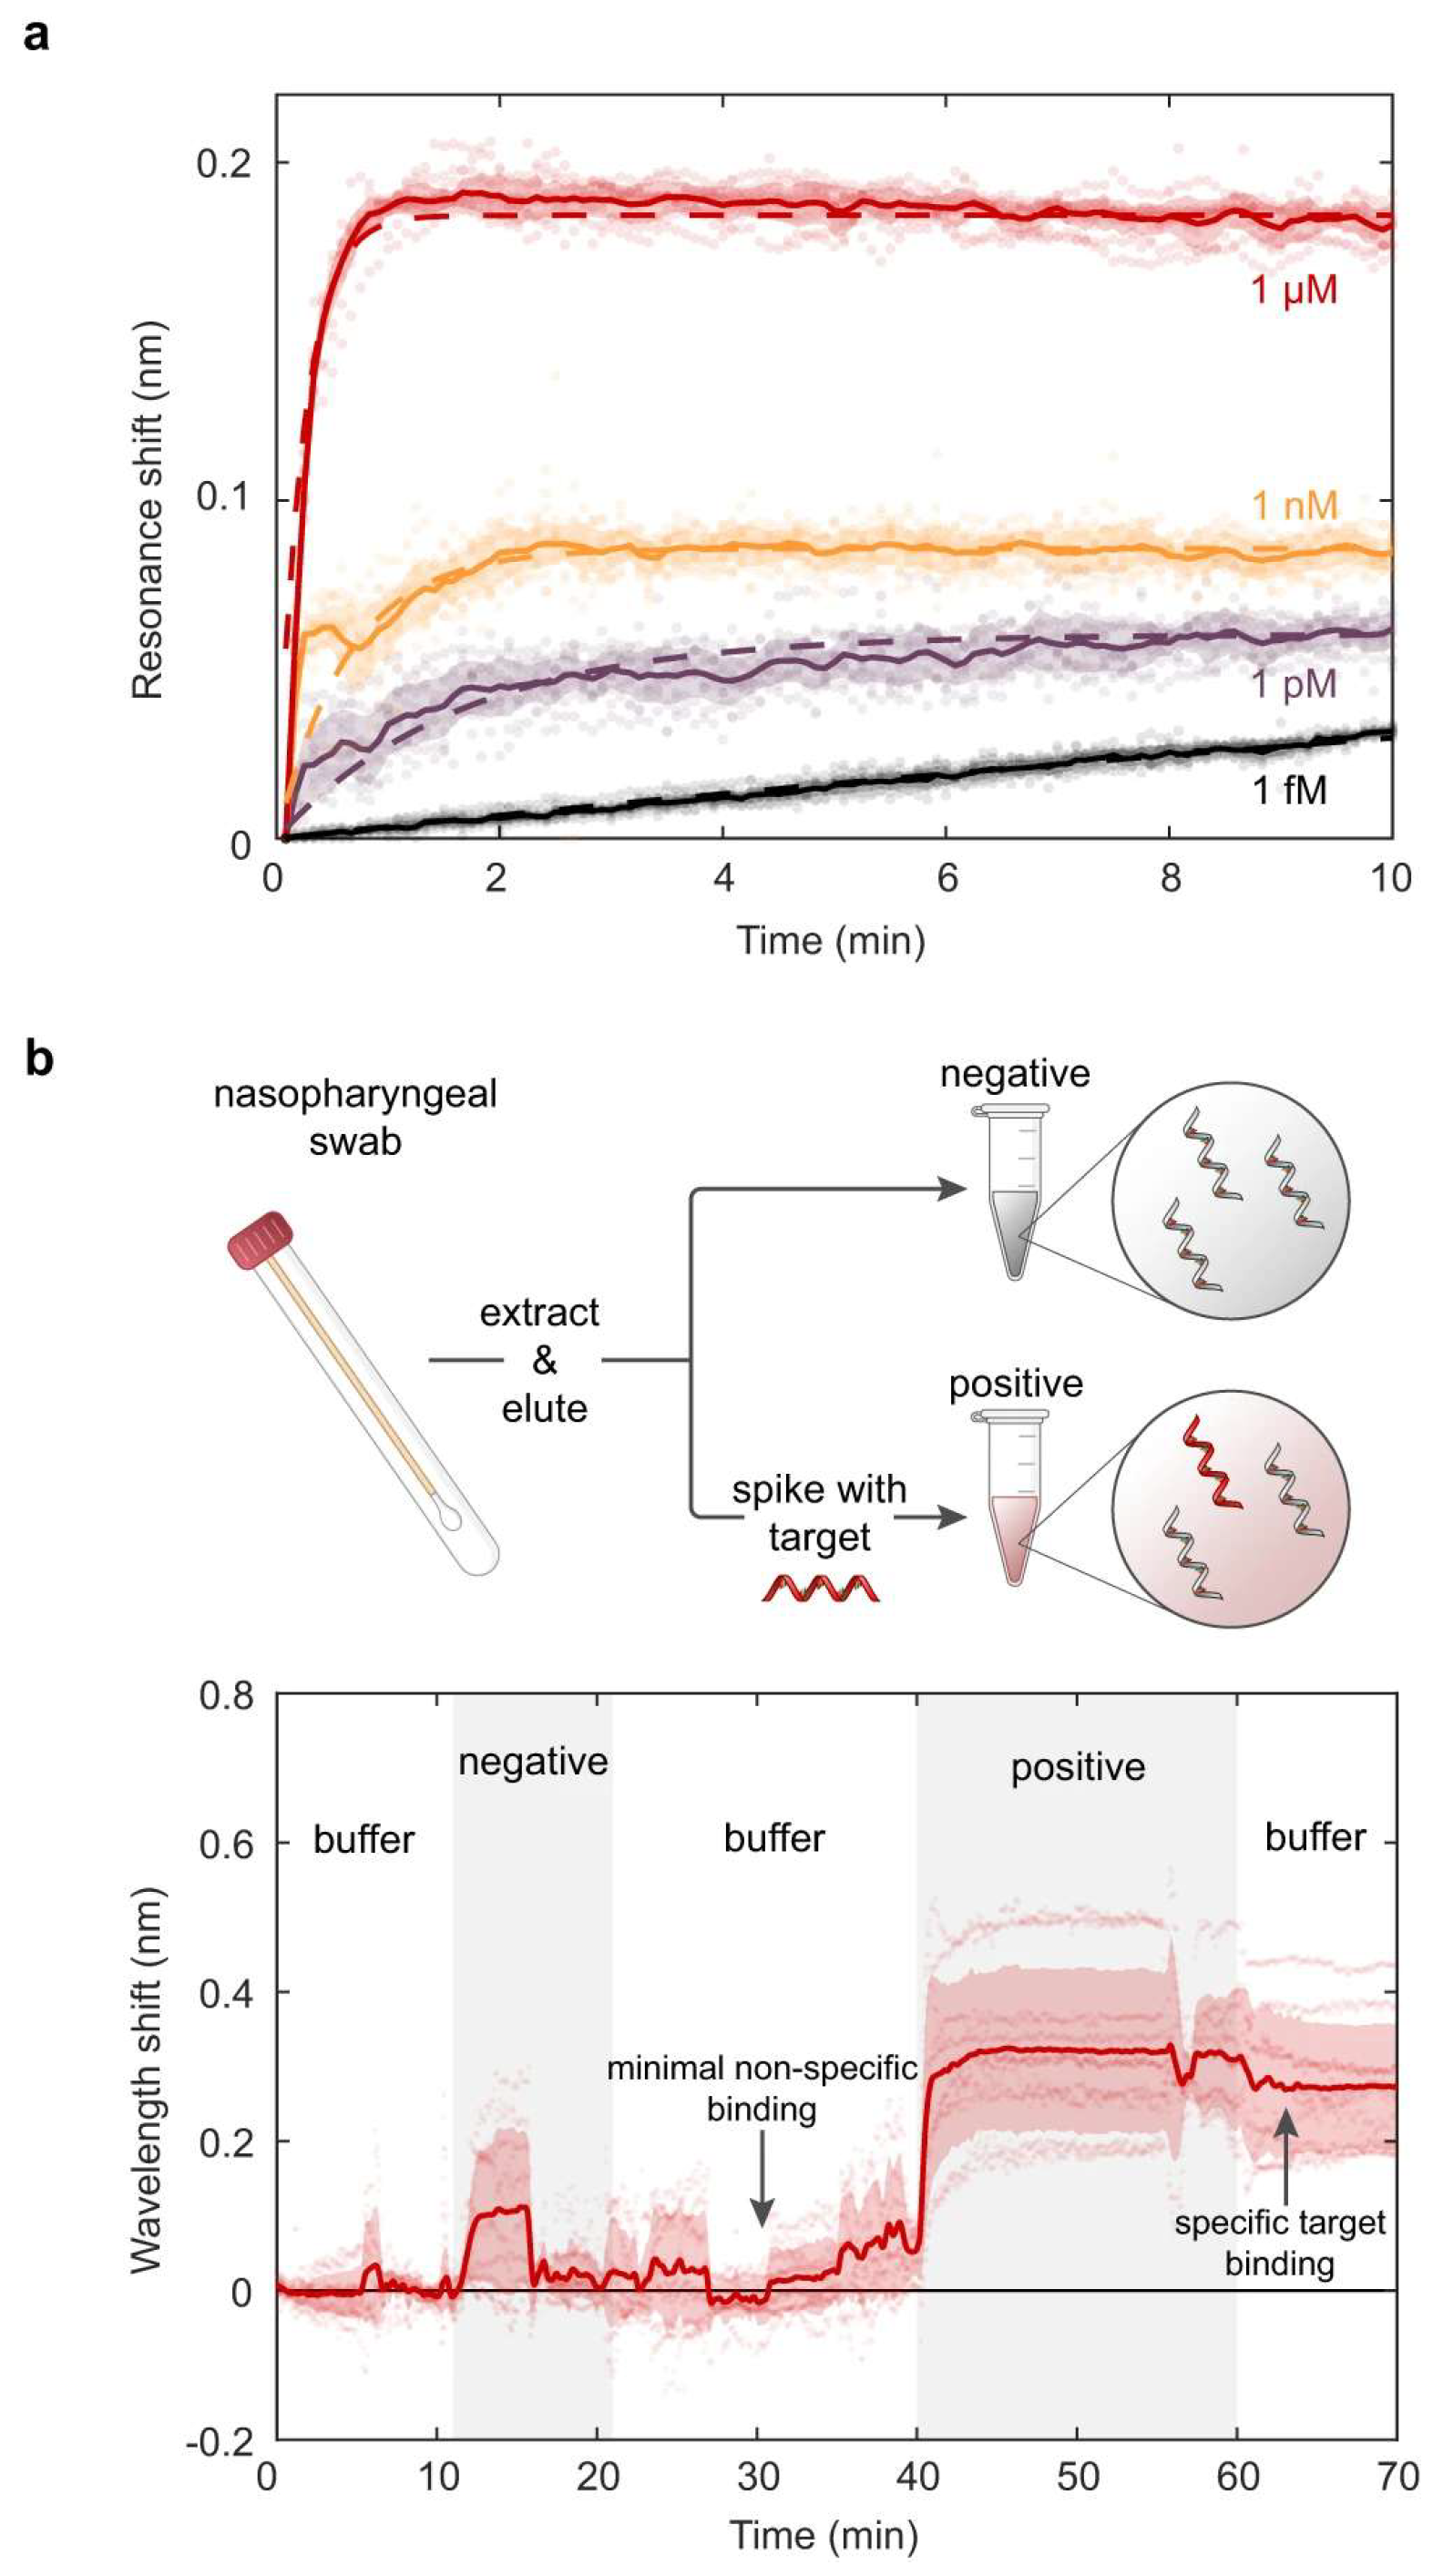
Figure 5.
Simulated surface plasmon resonance (SPR) reflectance curves of a BK7 prism/Cu (15 nm)/Ni (80 nm)/six-layer anisotropic phosphorene (0.53 nm per layer) sensor at λ = 830 nm for salivary cortisol concentrations of 0.36, 0.72, 1.80, 3.60, and 4.50 ng/mL. The inset magnifies the resonance region between 78° and 79.5°, where the reflectance minima of the individual concentrations are resolved; the total resonance shift across this range is only ~0.3°. The results are numerical simulations, not experimental measurements. Reprinted from Ref. [23] under the terms of the CC BY 4.0 license.
Figure 5.
Simulated surface plasmon resonance (SPR) reflectance curves of a BK7 prism/Cu (15 nm)/Ni (80 nm)/six-layer anisotropic phosphorene (0.53 nm per layer) sensor at λ = 830 nm for salivary cortisol concentrations of 0.36, 0.72, 1.80, 3.60, and 4.50 ng/mL. The inset magnifies the resonance region between 78° and 79.5°, where the reflectance minima of the individual concentrations are resolved; the total resonance shift across this range is only ~0.3°. The results are numerical simulations, not experimental measurements. Reprinted from Ref. [23] under the terms of the CC BY 4.0 license.
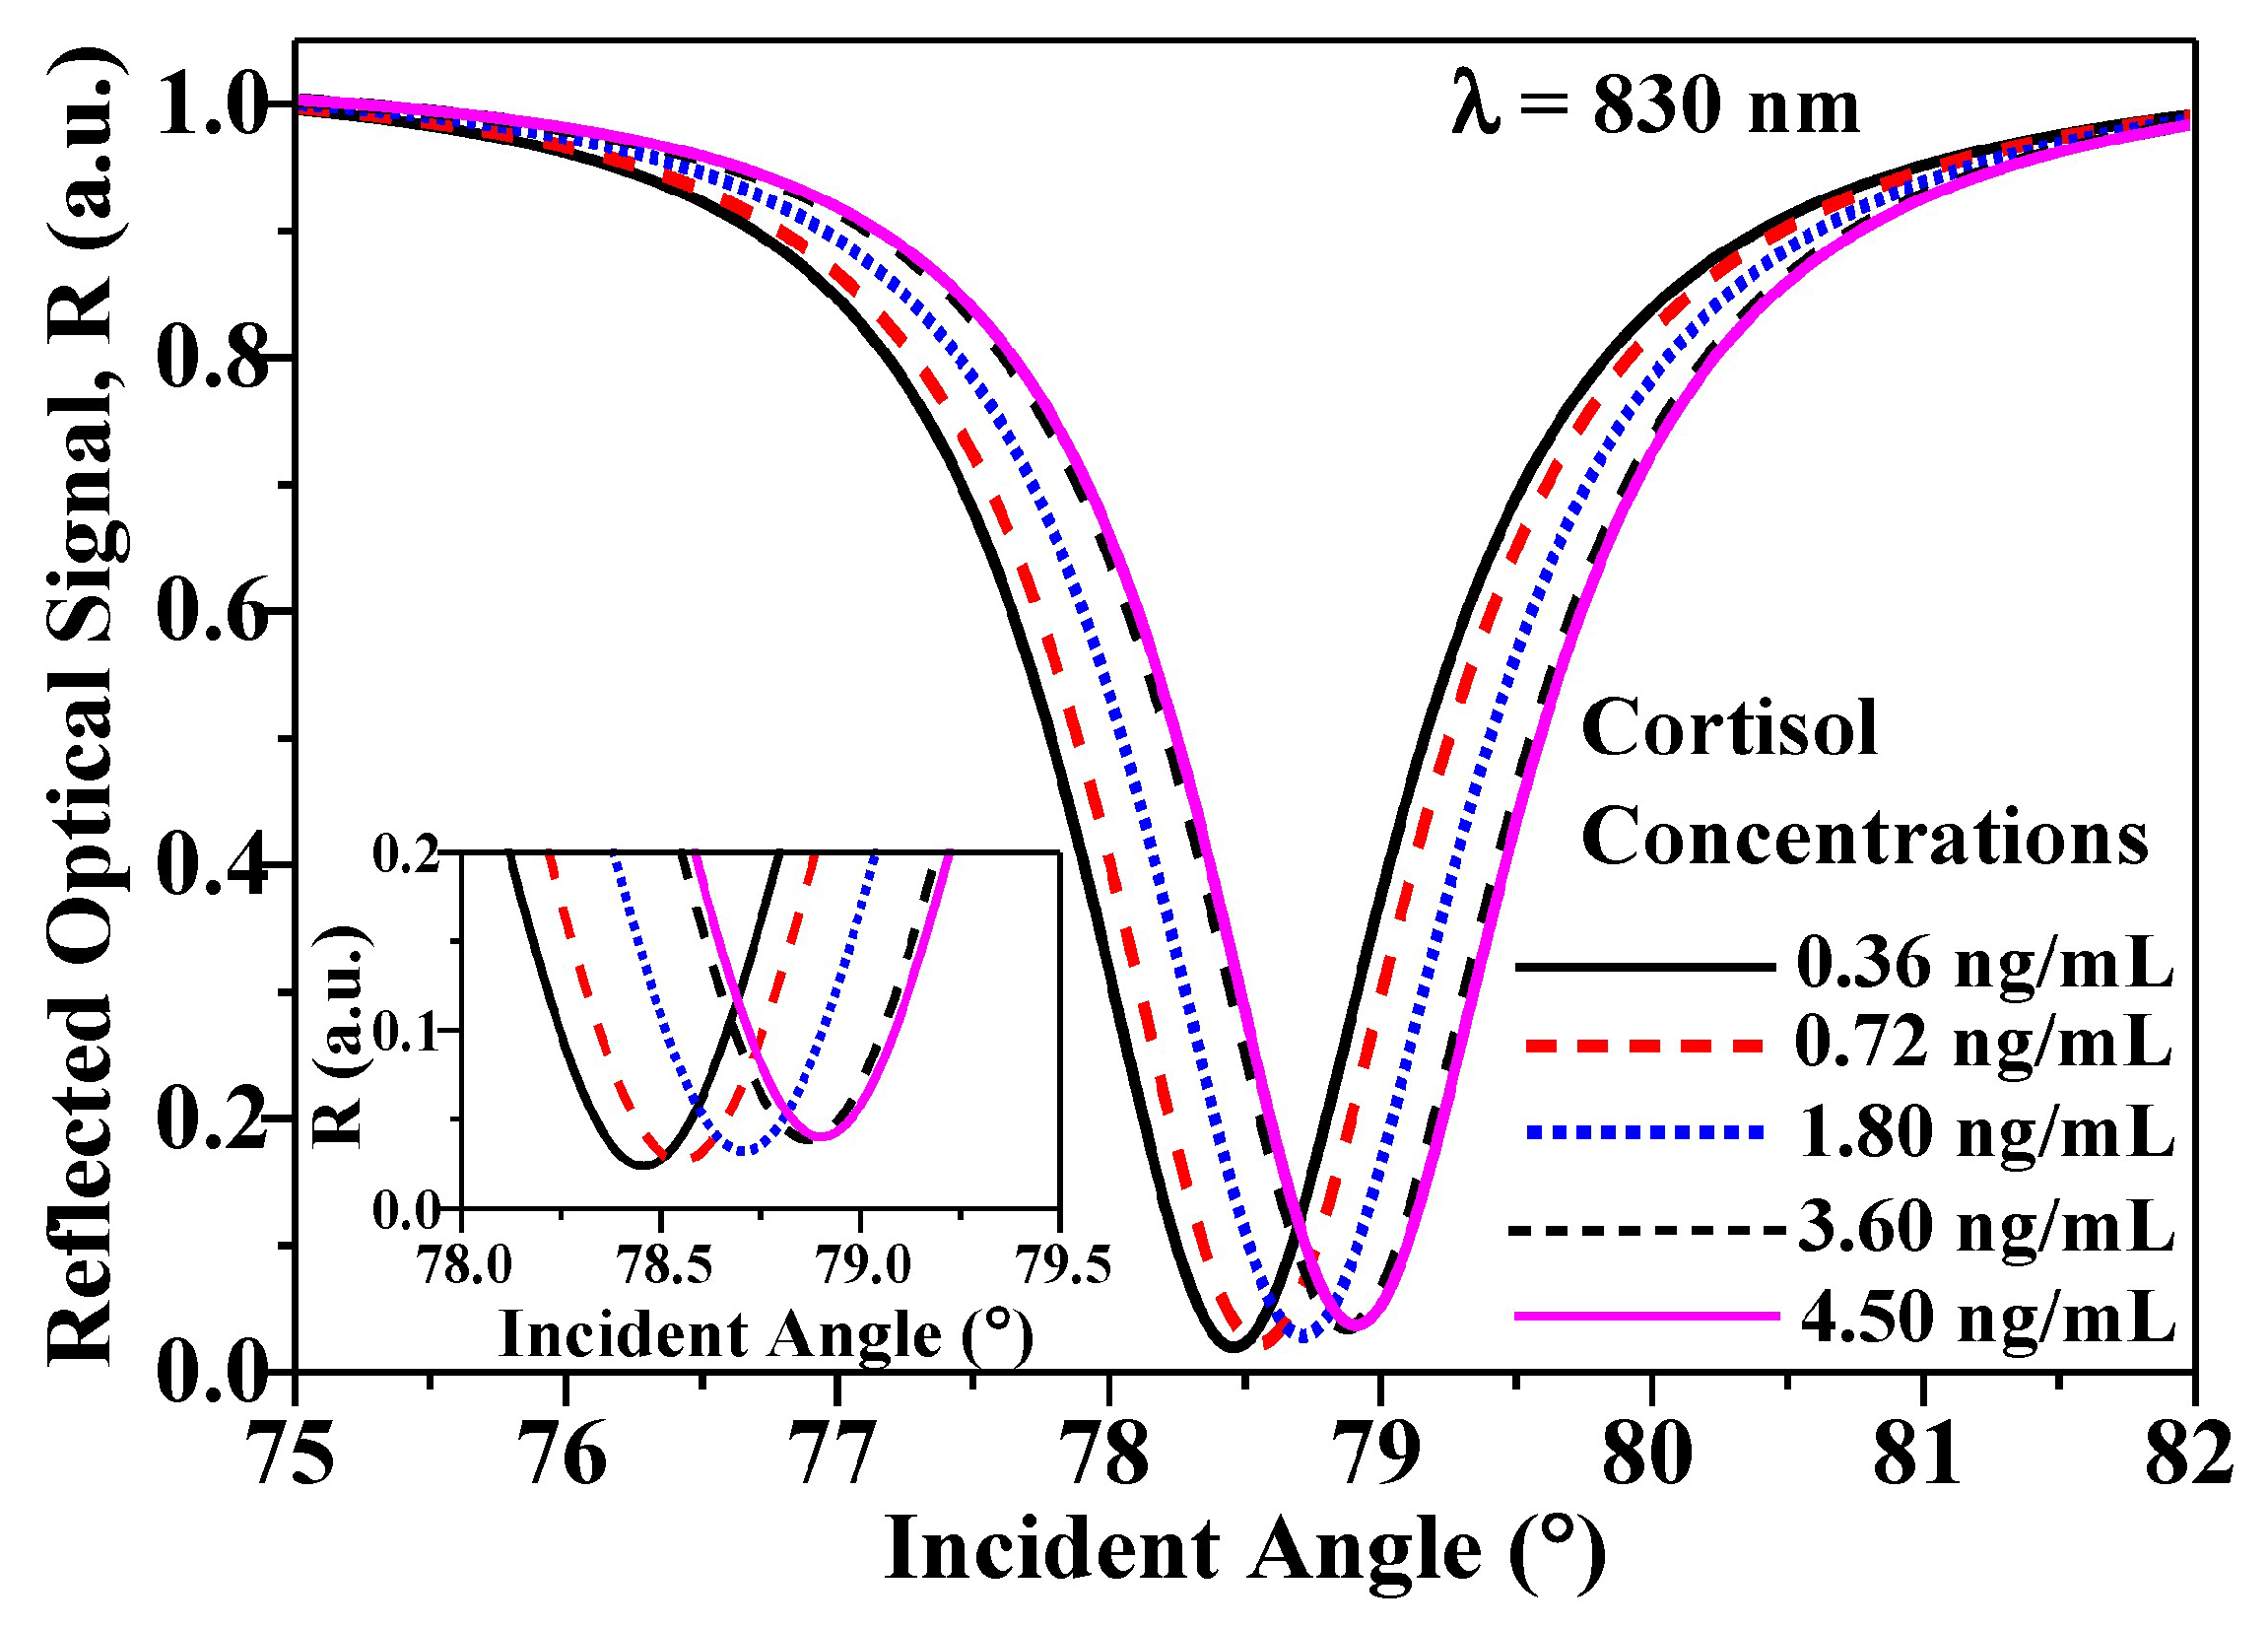
Figure 6.
Operating principle of a magneto-optic surface plasmon resonance (MO-SPR) sensing platform. Top: Kretschmann configuration in which a p-polarized beam excites a surface plasmon polariton (SPP) in an antibody-functionalized Au/Co/Au trilayer, while a transverse magnetic field, Hy, reverses the magnetization (±M) of the Co layer. Bottom left: reflectance R versus incidence angle θ for the two magnetic states (+M, solid line; −M, dashed line); each magnetic state is shifted by approximately ±ΔθM relative to R0, so that their angular separation, marked in the panel, is approximately 2ΔθM. Bottom right: normalized differential signal (R+M − R−M)/R0, where R0 is the mean of the two reflectances (Equation (8)), which provides a field-reversible readout of refractive-index changes at the sensor–analyte interface. The curves are representative and illustrate the form of the signal rather than measured magnitudes.
Figure 6.
Operating principle of a magneto-optic surface plasmon resonance (MO-SPR) sensing platform. Top: Kretschmann configuration in which a p-polarized beam excites a surface plasmon polariton (SPP) in an antibody-functionalized Au/Co/Au trilayer, while a transverse magnetic field, Hy, reverses the magnetization (±M) of the Co layer. Bottom left: reflectance R versus incidence angle θ for the two magnetic states (+M, solid line; −M, dashed line); each magnetic state is shifted by approximately ±ΔθM relative to R0, so that their angular separation, marked in the panel, is approximately 2ΔθM. Bottom right: normalized differential signal (R+M − R−M)/R0, where R0 is the mean of the two reflectances (Equation (8)), which provides a field-reversible readout of refractive-index changes at the sensor–analyte interface. The curves are representative and illustrate the form of the signal rather than measured magnitudes.
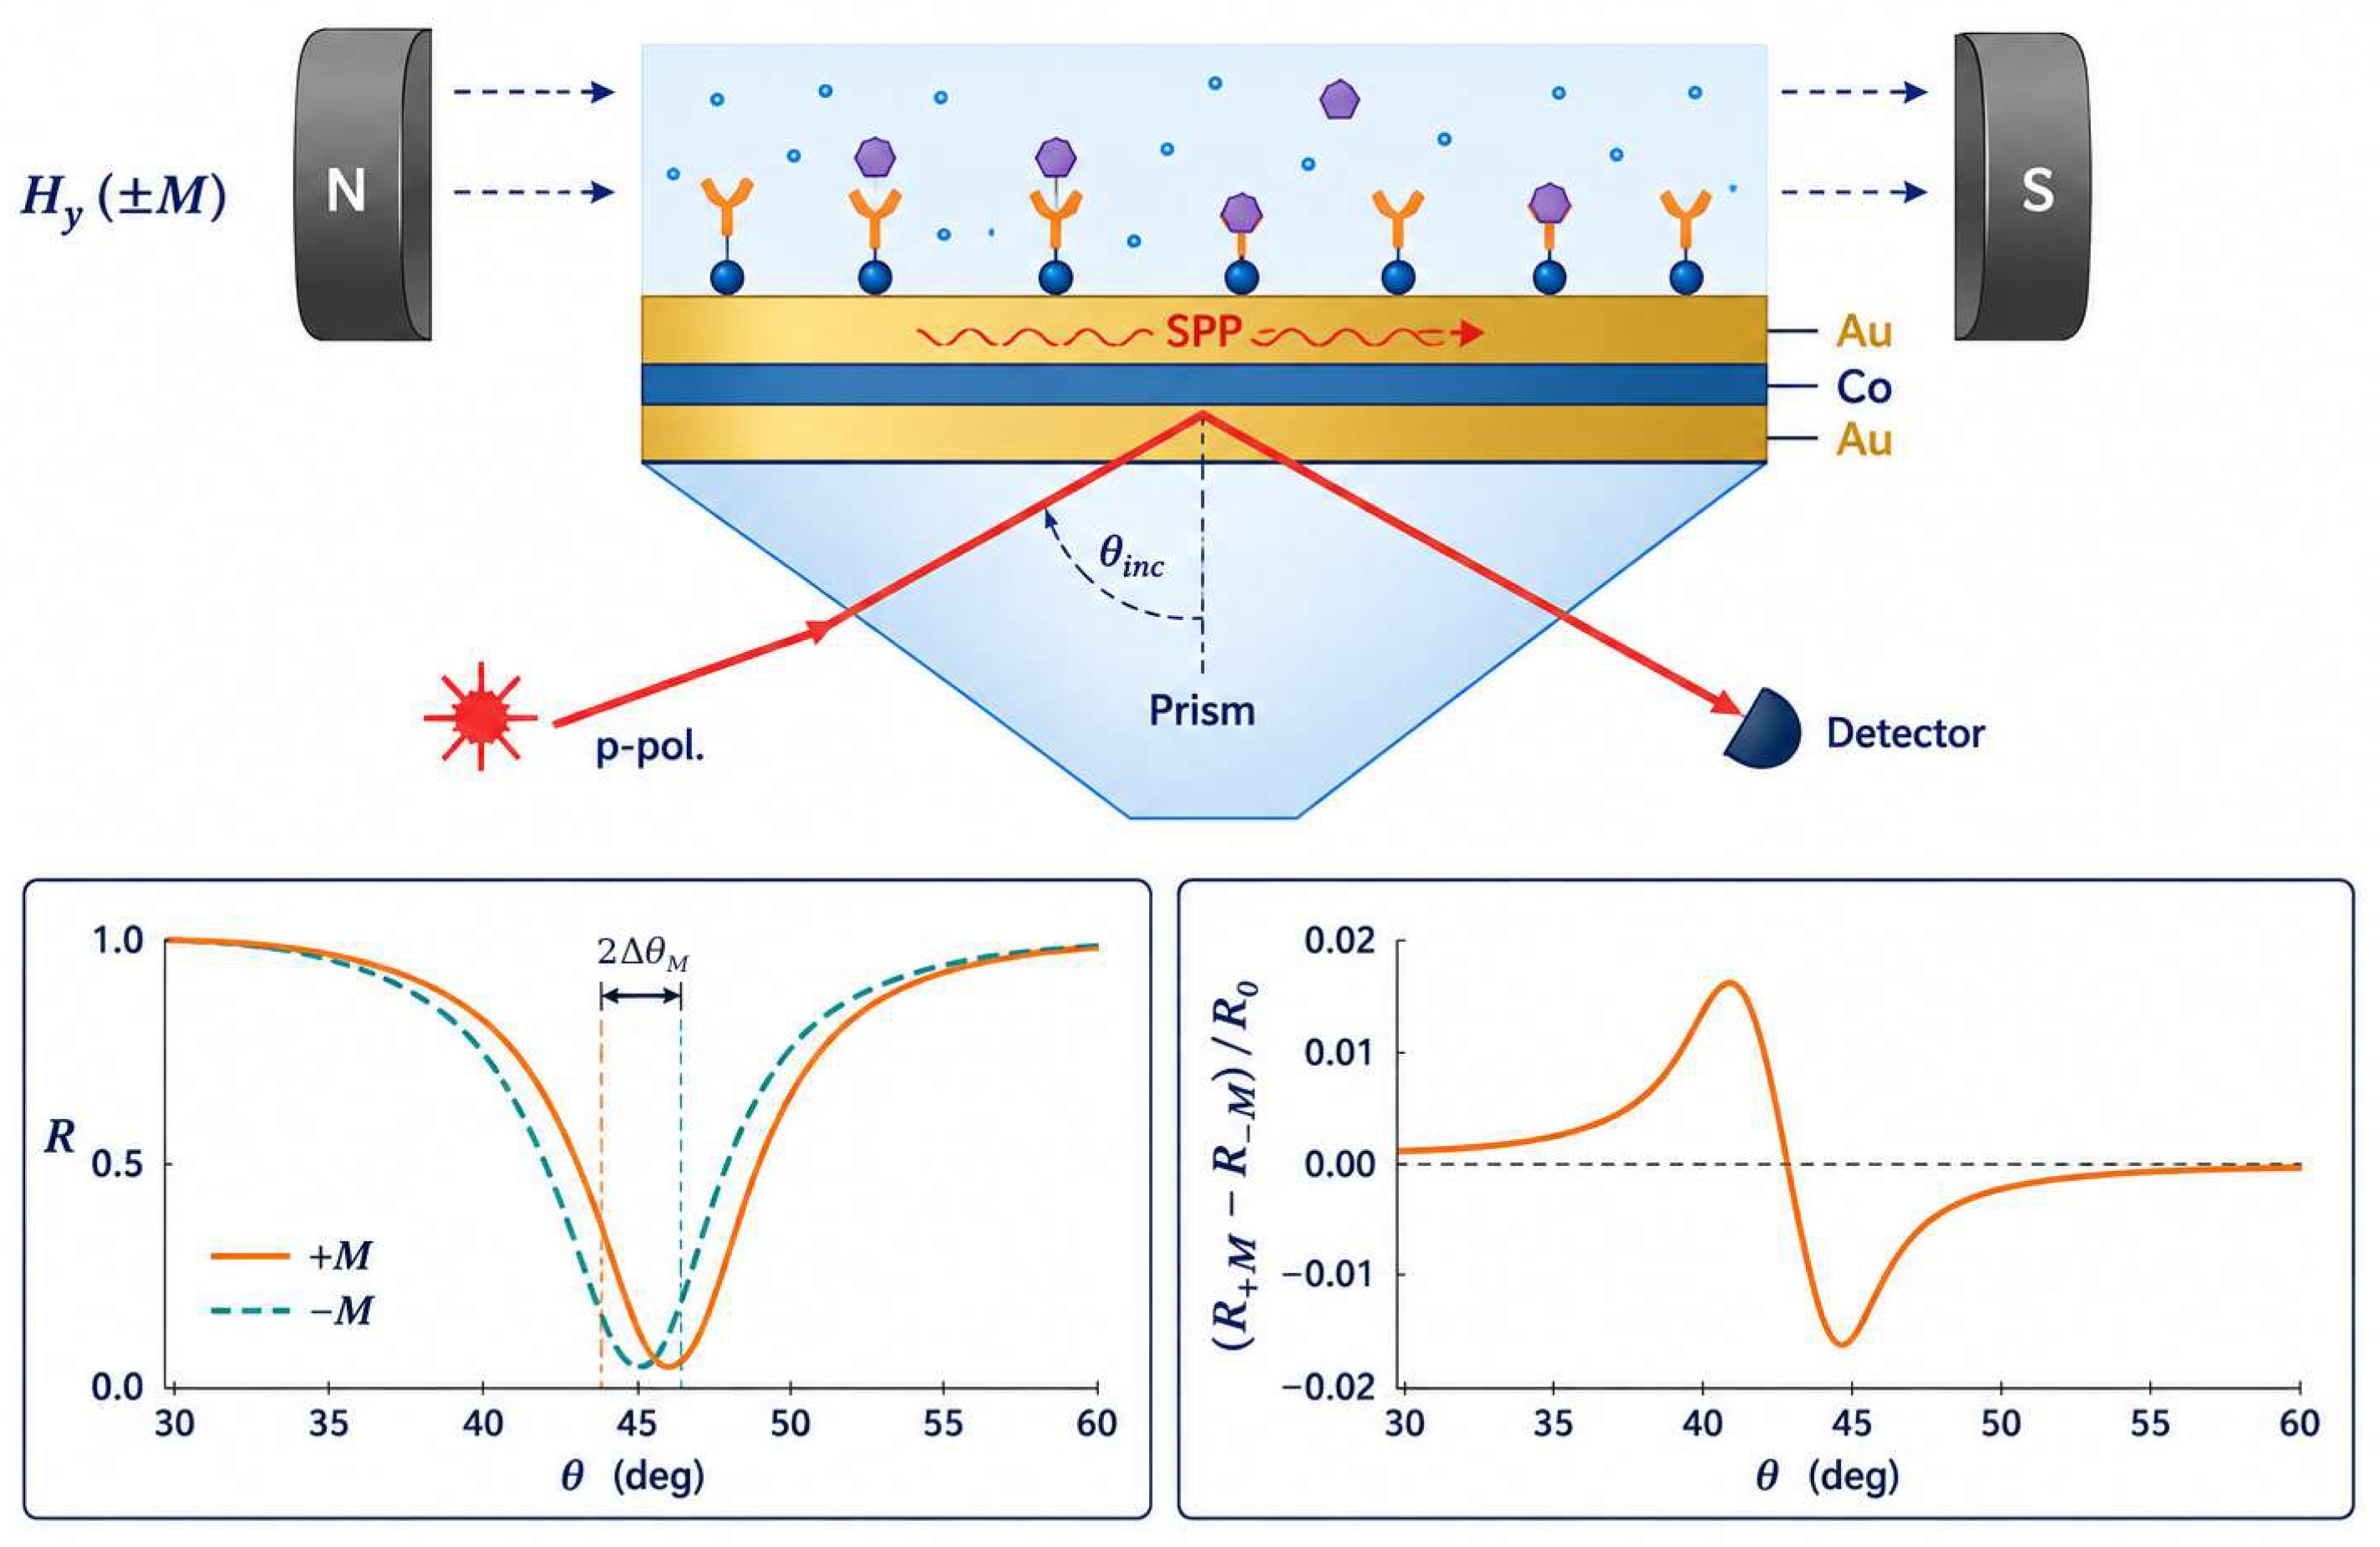
Figure 7.
Calculated magneto-optic surface plasmon resonance (MO-SPR) sensitivity, SMOSPR, of Co/Ag (blue symbols) and Co/Au (red symbols) bilayers (Co, 8 nm; Ag or Au, 35 nm) as a function of incidence angle θ. (a,b) Gaseous sensing medium (air–helium) at 632.8 nm (a) and 785 nm (b); (c,d) liquid sensing medium (water–methanol) at 632.8 nm (c) and 785 nm (d). Sensitivity is expressed as the percentage change of the field-modulated reflected intensity per refractive-index unit (%/RIU); note the different vertical scales. The results are numerical simulations. Reprinted from Ref. [14] under the terms of the CC BY 4.0 license.
Figure 7.
Calculated magneto-optic surface plasmon resonance (MO-SPR) sensitivity, SMOSPR, of Co/Ag (blue symbols) and Co/Au (red symbols) bilayers (Co, 8 nm; Ag or Au, 35 nm) as a function of incidence angle θ. (a,b) Gaseous sensing medium (air–helium) at 632.8 nm (a) and 785 nm (b); (c,d) liquid sensing medium (water–methanol) at 632.8 nm (c) and 785 nm (d). Sensitivity is expressed as the percentage change of the field-modulated reflected intensity per refractive-index unit (%/RIU); note the different vertical scales. The results are numerical simulations. Reprinted from Ref. [14] under the terms of the CC BY 4.0 license.
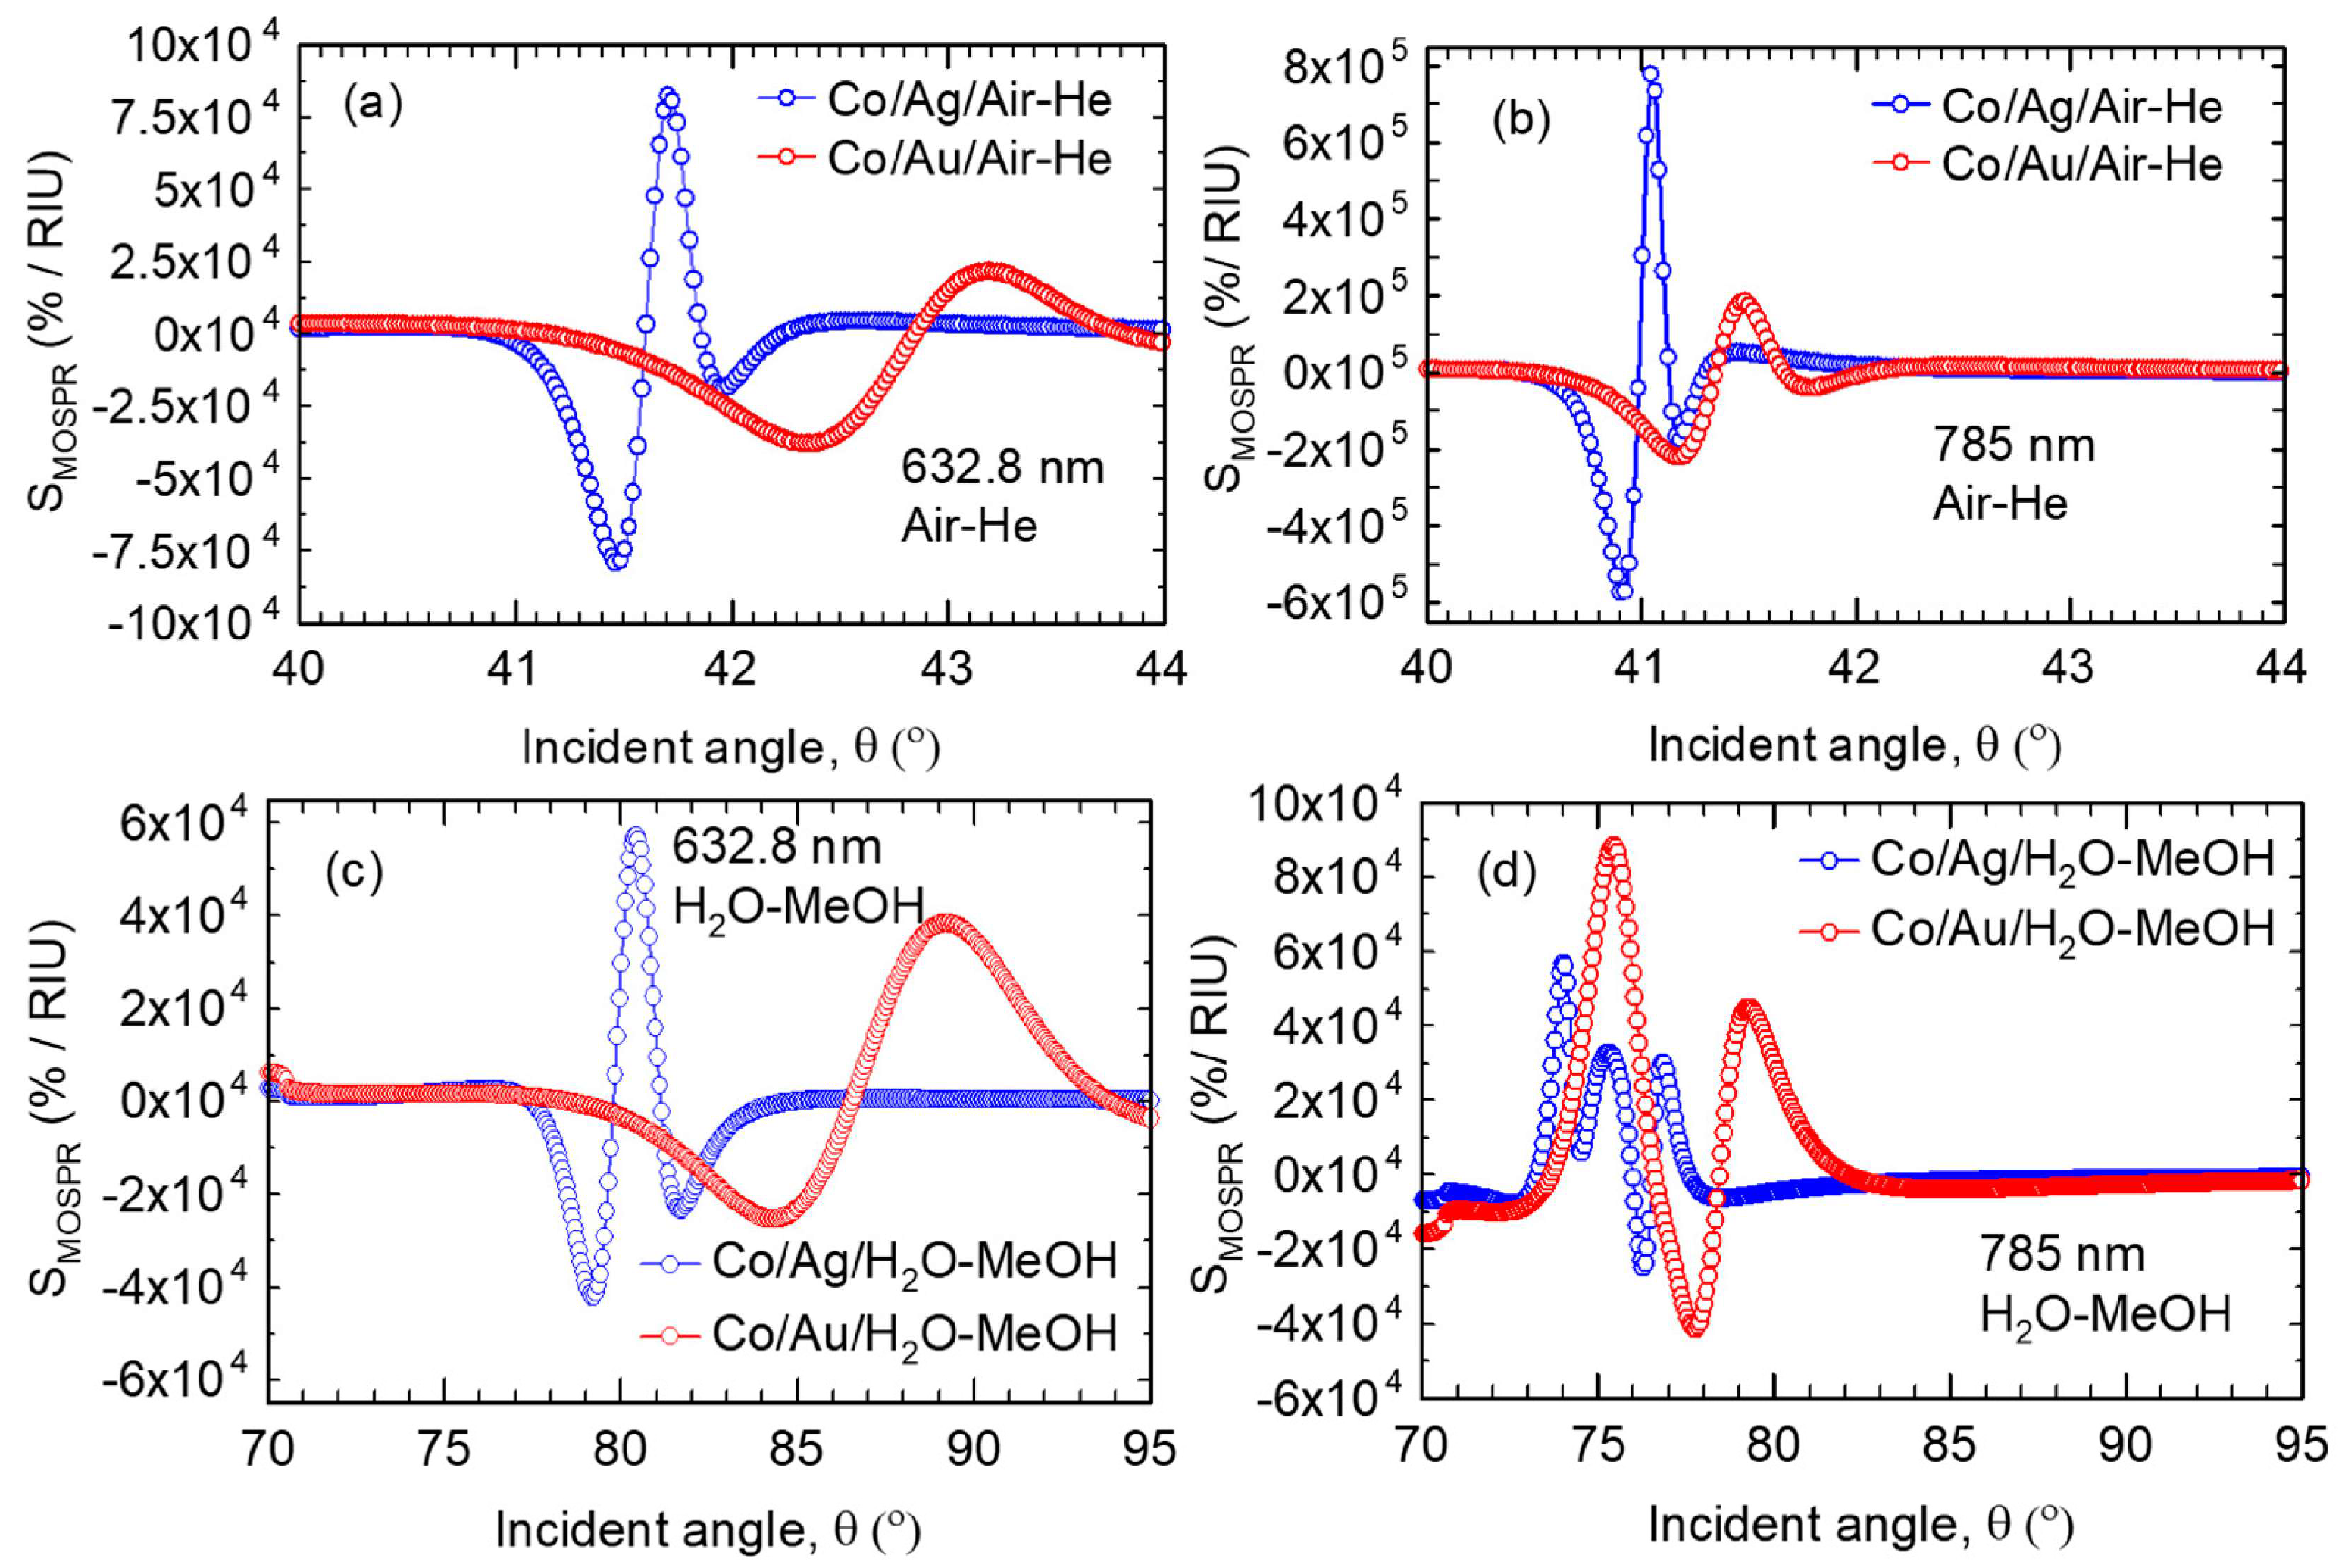
Figure 8.
Magnetoplasmonic refractometric sensing with transparent-conductive-oxide nanocrystals. (a,b) Faraday rotation (θF) and (c,d) Faraday ellipticity (εF) spectra, normalized to the applied field, of Sn-doped In2O3 (ITO) and F,In-codoped CdO (FICO) nanocrystals dispersed in CCl4, C2Cl4, and CS2. (e,f) Changes in θF (e) and εF (f) with the solvent refractive index at the fixed wavelengths marked by the vertical green bars in (a–d), measured under a 1.4 T field; symbols are experimental points for the ITO and FICO nanocrystals, and dashed lines are linear fits, shown together with reference responses of Ni–SiO2–Au arrays, Ni disks, and Au nanocrystals. Reprinted from Ref. [41] under the terms of the CC BY 4.0 license.
Figure 8.
Magnetoplasmonic refractometric sensing with transparent-conductive-oxide nanocrystals. (a,b) Faraday rotation (θF) and (c,d) Faraday ellipticity (εF) spectra, normalized to the applied field, of Sn-doped In2O3 (ITO) and F,In-codoped CdO (FICO) nanocrystals dispersed in CCl4, C2Cl4, and CS2. (e,f) Changes in θF (e) and εF (f) with the solvent refractive index at the fixed wavelengths marked by the vertical green bars in (a–d), measured under a 1.4 T field; symbols are experimental points for the ITO and FICO nanocrystals, and dashed lines are linear fits, shown together with reference responses of Ni–SiO2–Au arrays, Ni disks, and Au nanocrystals. Reprinted from Ref. [41] under the terms of the CC BY 4.0 license.
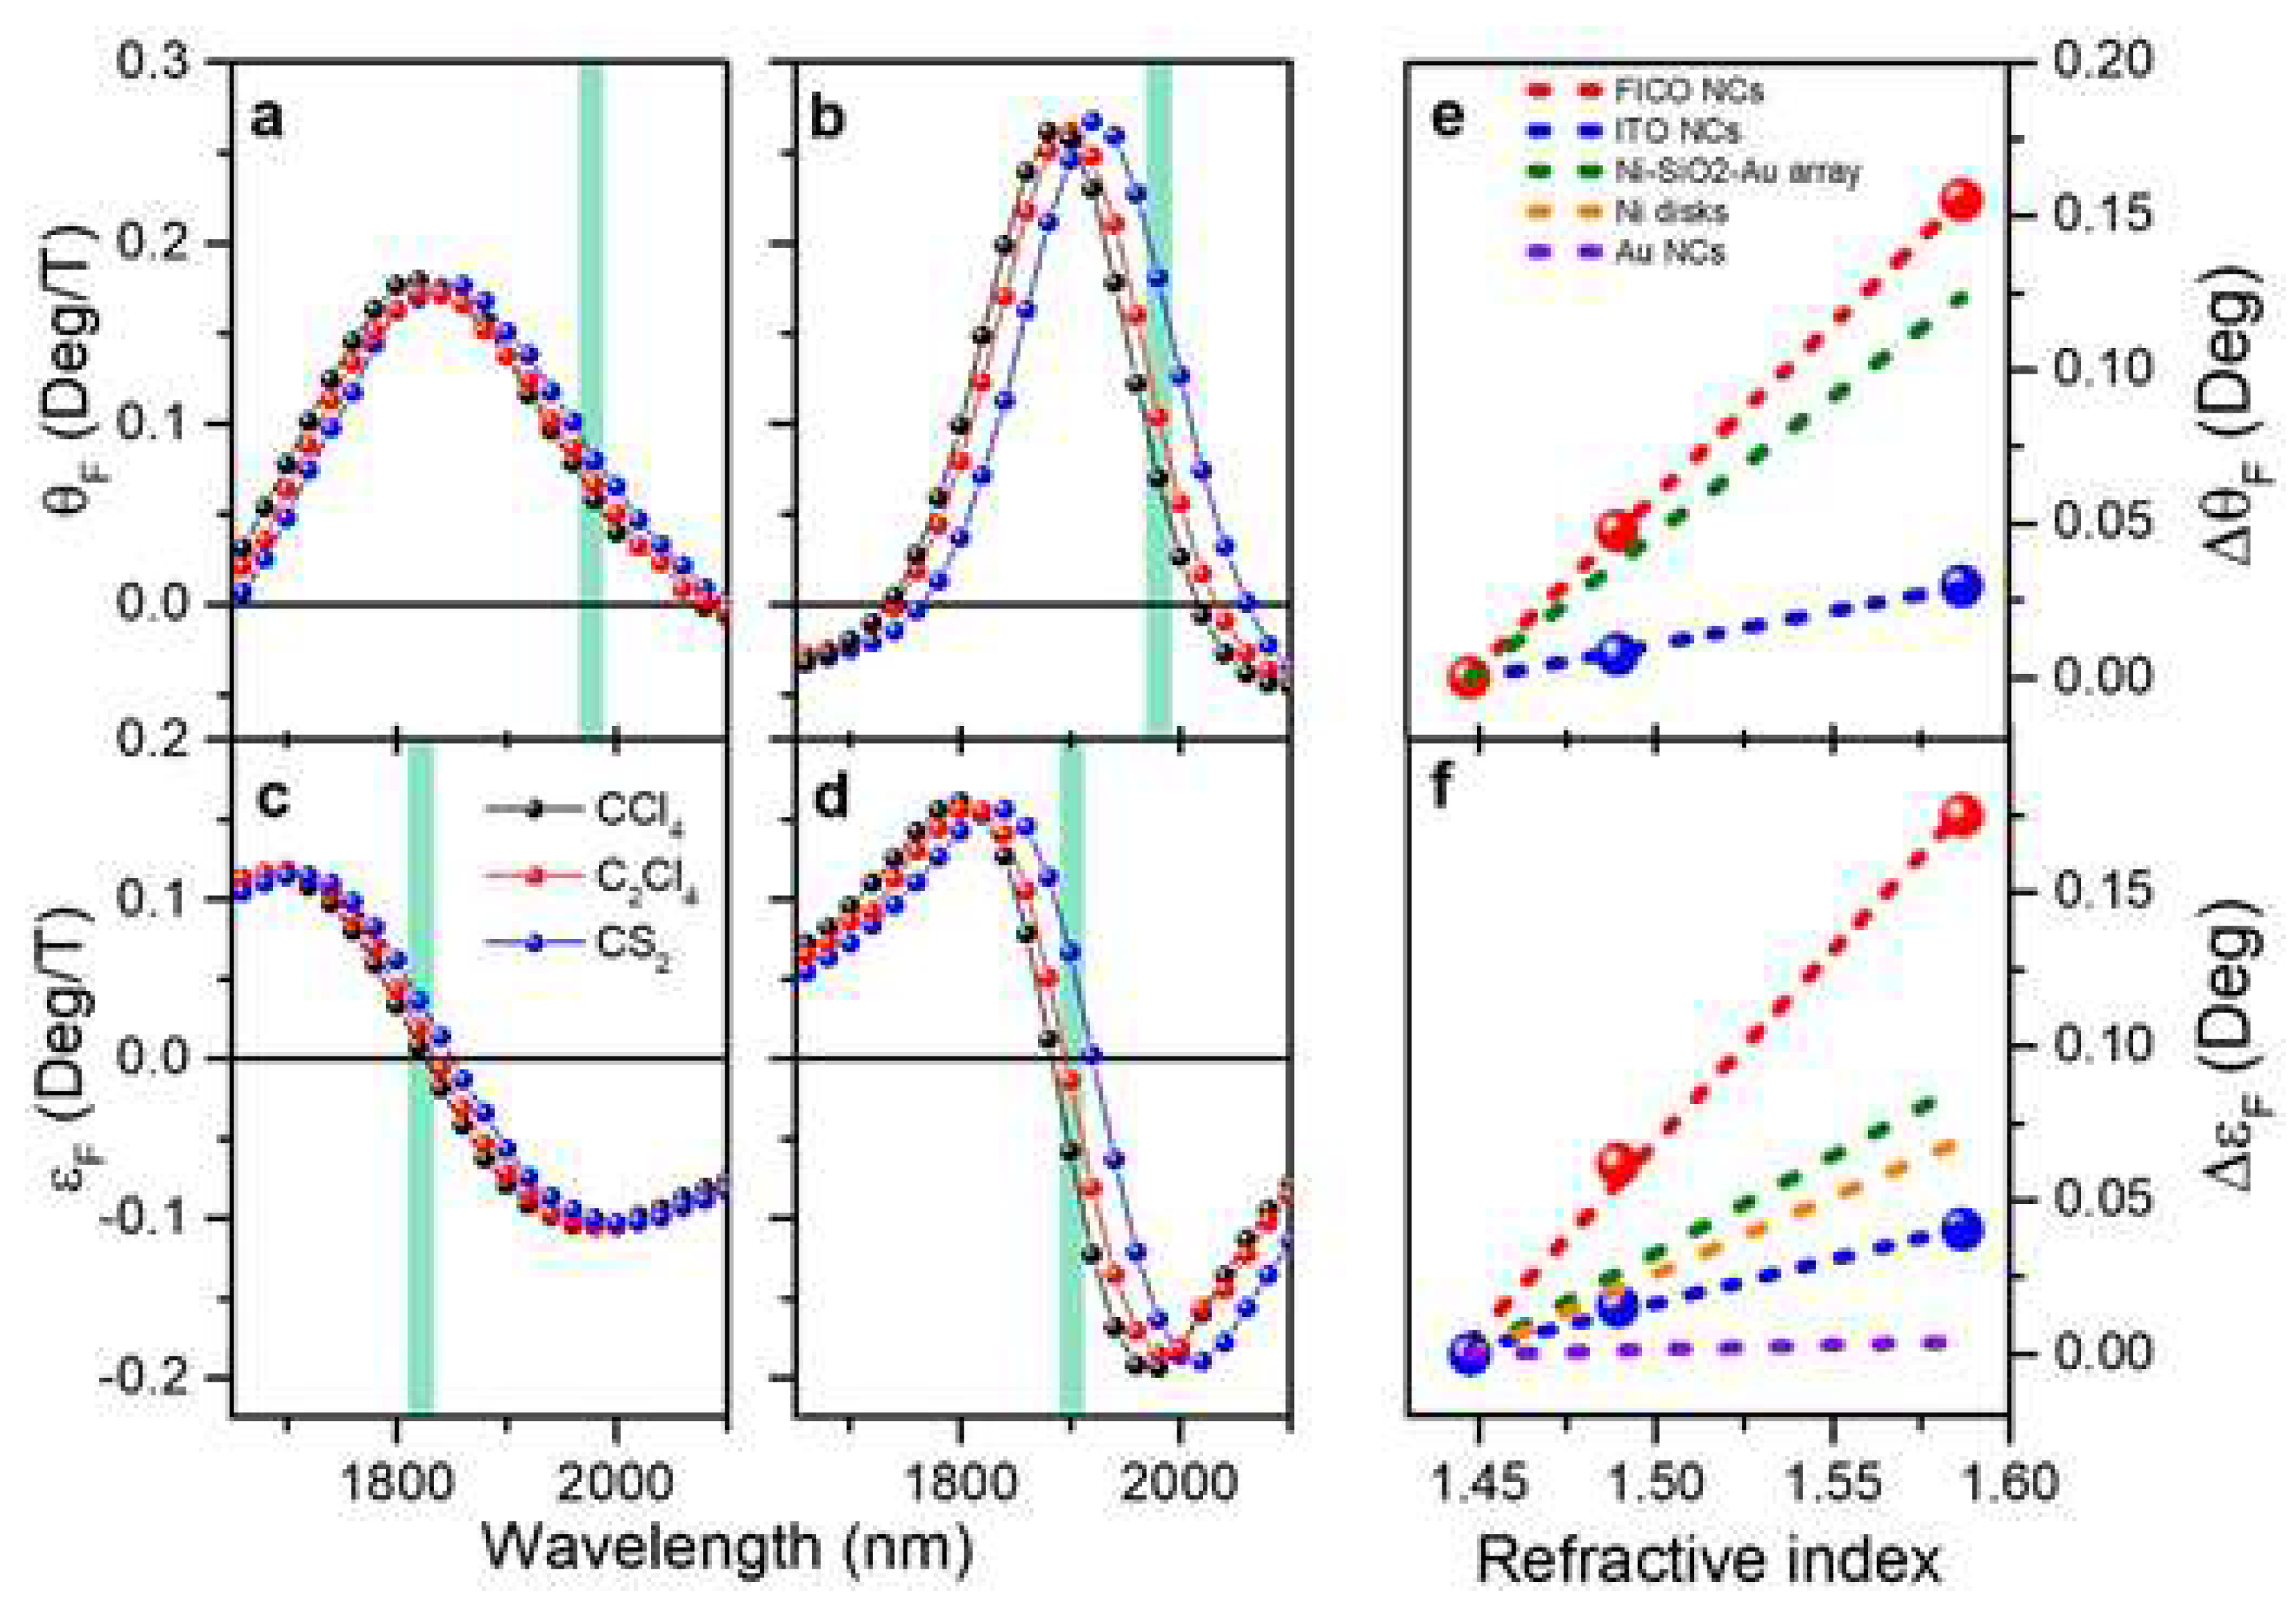
Figure 9.
Machine-learning-assisted readout of a bioassay on a gold-coated tilted fiber Bragg grating (TFBG) plasmonic biosensor. (a,b) Surface functionalization sequence (glycine-HCl, EDC–NHS activation, anti-insulin antibody immobilization, and ethanolamine blocking; colored areas) monitored by conventional cross-demodulation as a wavelength shift (a) and by the trained machine-learning model as a refractive-index (RI) shift (b); the red dashed line in (b) marks the upper limit of the training range (1.3432 RIU, an 8.2 mRIU shift from the buffer). (c,d) Insulin detection at 0.1 and 1 µg/mL retrieved by cross-demodulation (c) and by the machine-learning model (d). Arrows mark buffer injections. EDC–NHS, 1-ethyl-3-(3-dimethylaminopropyl)carbodiimide/N-hydroxysuccinimide; RIU, refractive-index unit. Reprinted from Ref. [10] under the terms of the CC BY 4.0 license.
Figure 9.
Machine-learning-assisted readout of a bioassay on a gold-coated tilted fiber Bragg grating (TFBG) plasmonic biosensor. (a,b) Surface functionalization sequence (glycine-HCl, EDC–NHS activation, anti-insulin antibody immobilization, and ethanolamine blocking; colored areas) monitored by conventional cross-demodulation as a wavelength shift (a) and by the trained machine-learning model as a refractive-index (RI) shift (b); the red dashed line in (b) marks the upper limit of the training range (1.3432 RIU, an 8.2 mRIU shift from the buffer). (c,d) Insulin detection at 0.1 and 1 µg/mL retrieved by cross-demodulation (c) and by the machine-learning model (d). Arrows mark buffer injections. EDC–NHS, 1-ethyl-3-(3-dimethylaminopropyl)carbodiimide/N-hydroxysuccinimide; RIU, refractive-index unit. Reprinted from Ref. [10] under the terms of the CC BY 4.0 license.
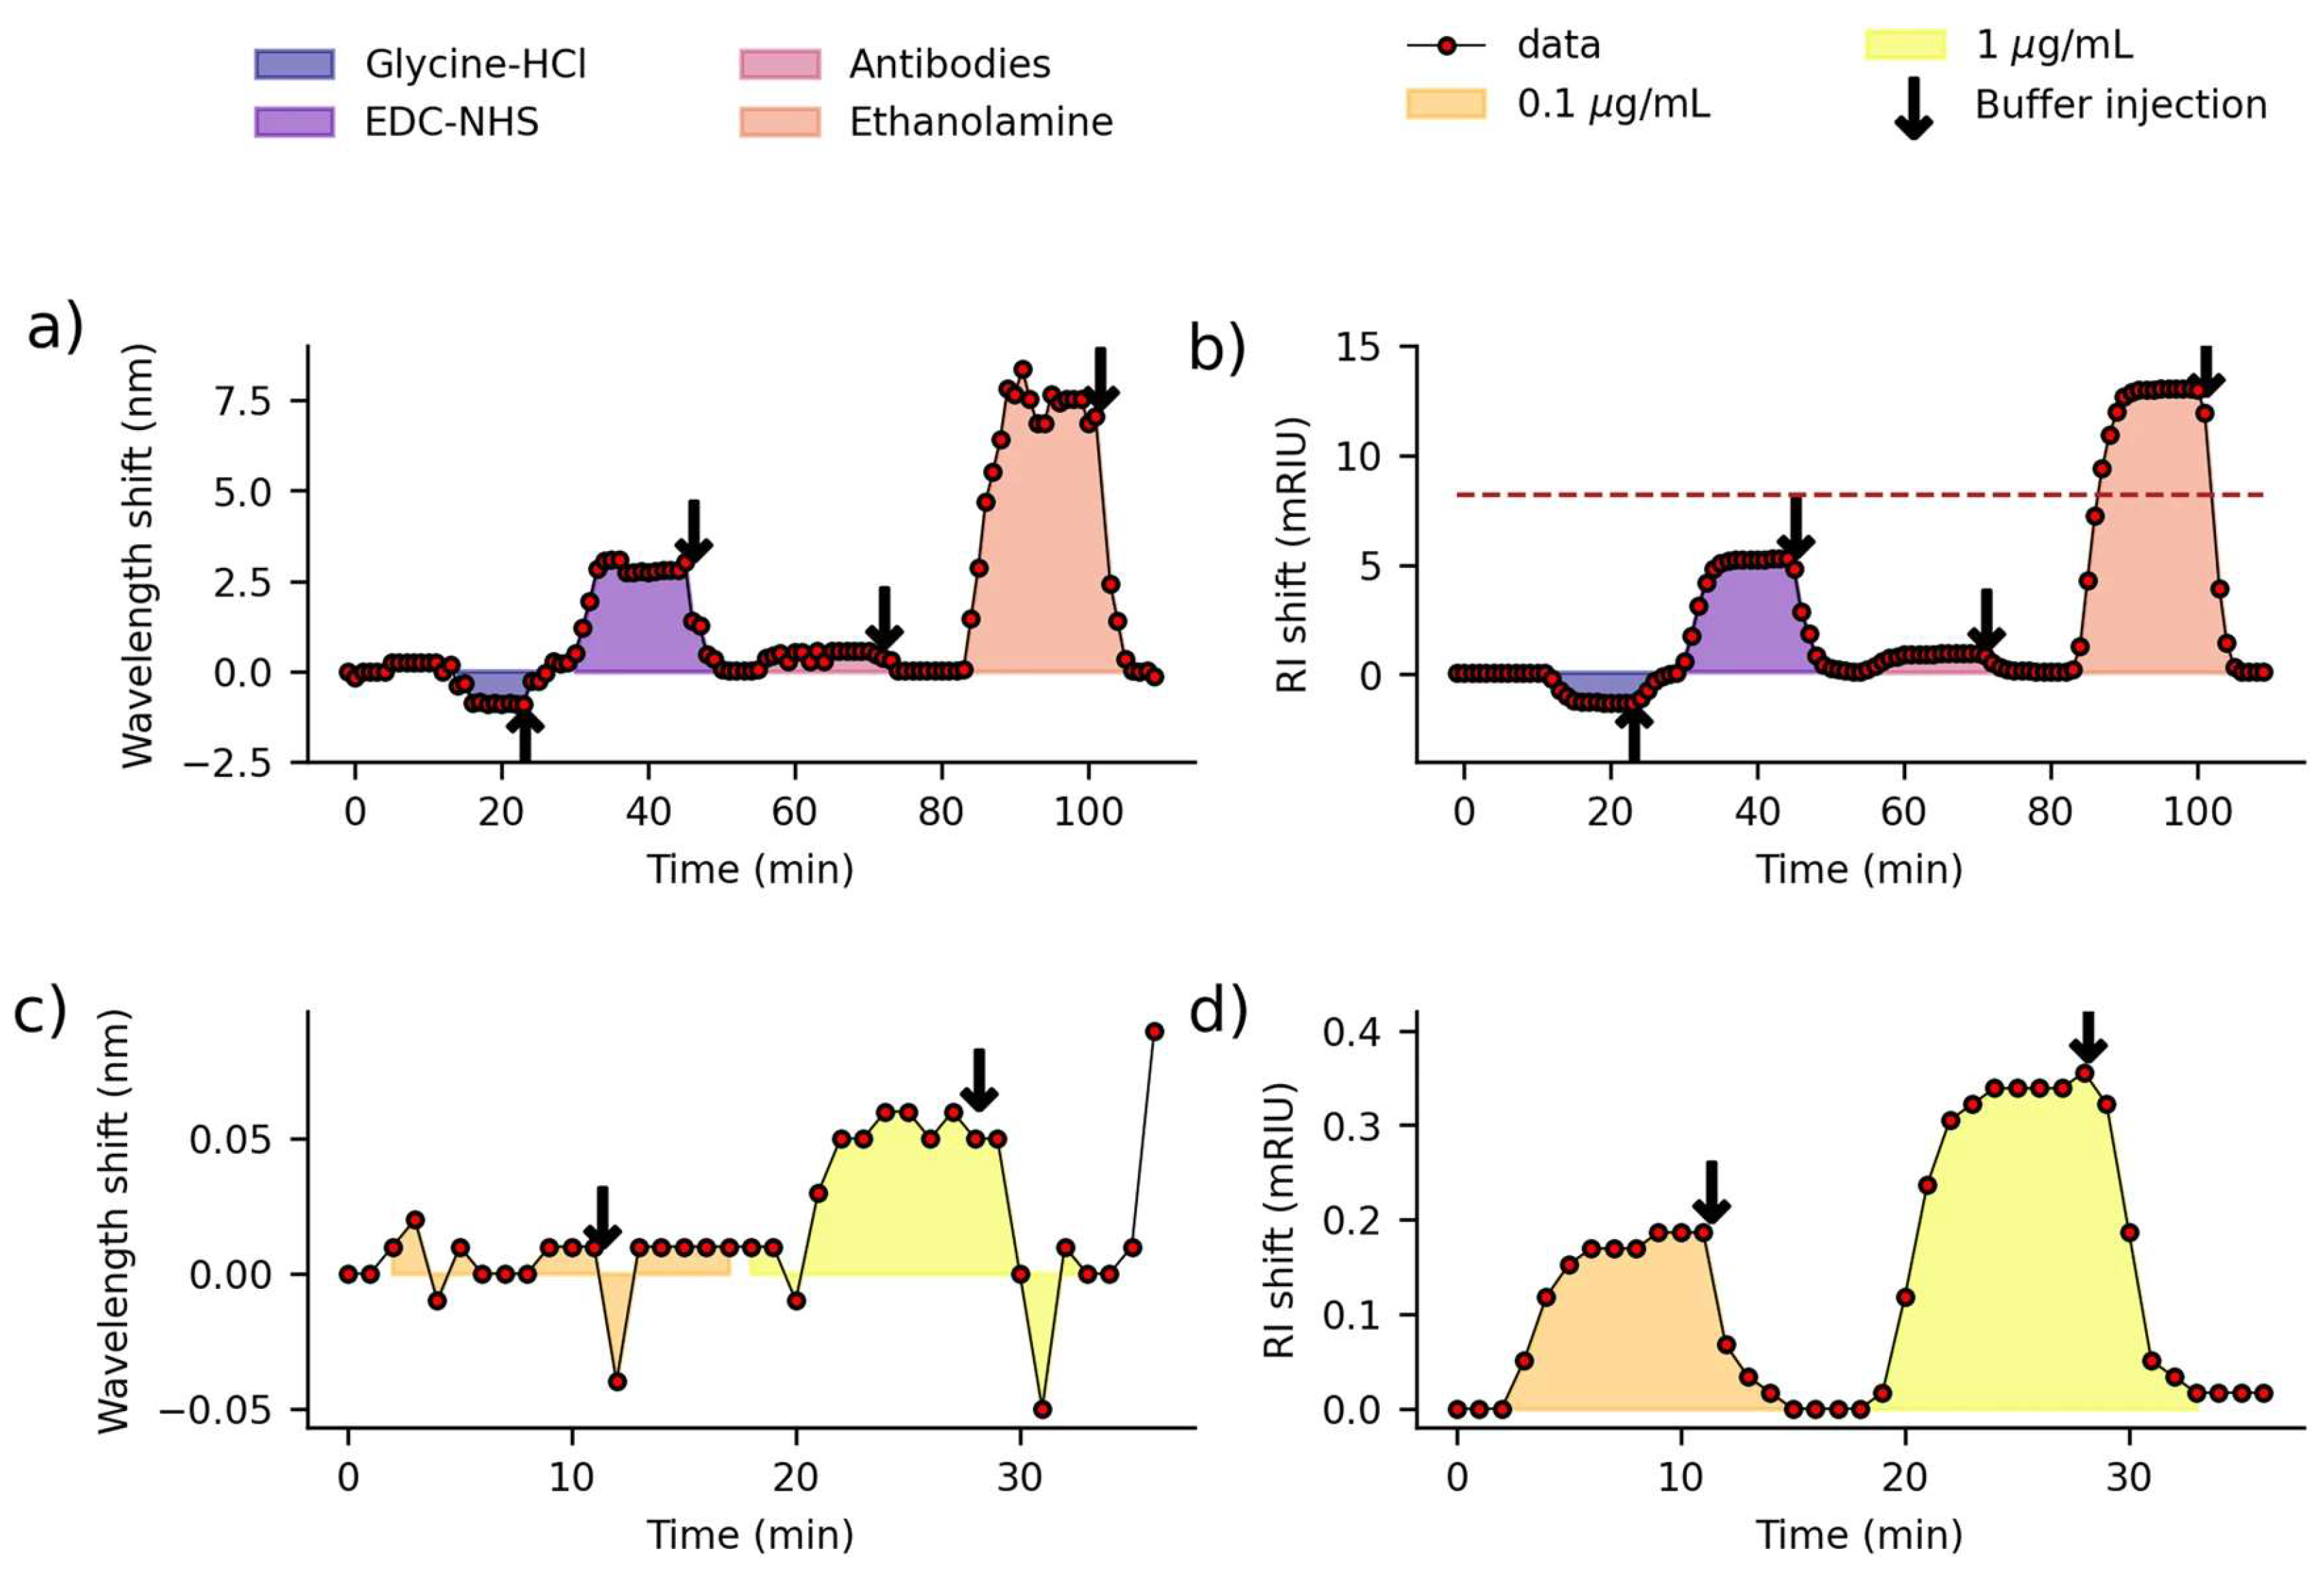
Figure 10.
Machine-learning-based detection of cancer from surface-enhanced Raman scattering (SERS) spectra of plasma exosomes. (a) Study design: healthy controls (n = 210) and patients with cancer (n = 543) were divided into training (n = 50 and 183) and held-out test (n = 160 and 360) sets, with ~100 spectra per subject used for binary classification. (b) Per-spot outputs of the convolutional neural network (CNN) classifier for spectra acquired on a gold-nanoparticle-aggregate substrate, displayed as heat maps and averaged to give a diagnostic score. (c) Scores of individual subjects in the training (n = 233) and test (n = 520) sets, grouped as healthy controls (HC) and lung, breast, colon, liver, pancreatic, and stomach cancer. (d) Score distributions by group in the test set. (e) Receiver operating characteristic (ROC) curve for the entire test set (area under the curve (AUC) = 0.970; 95% confidence interval, 0.957–0.982). (f) Precision–recall curve (area under the precision–recall curve, 0.987; F1 score, 0.943). Reprinted from Ref. [44] under the terms of the CC BY 4.0 license.
Figure 10.
Machine-learning-based detection of cancer from surface-enhanced Raman scattering (SERS) spectra of plasma exosomes. (a) Study design: healthy controls (n = 210) and patients with cancer (n = 543) were divided into training (n = 50 and 183) and held-out test (n = 160 and 360) sets, with ~100 spectra per subject used for binary classification. (b) Per-spot outputs of the convolutional neural network (CNN) classifier for spectra acquired on a gold-nanoparticle-aggregate substrate, displayed as heat maps and averaged to give a diagnostic score. (c) Scores of individual subjects in the training (n = 233) and test (n = 520) sets, grouped as healthy controls (HC) and lung, breast, colon, liver, pancreatic, and stomach cancer. (d) Score distributions by group in the test set. (e) Receiver operating characteristic (ROC) curve for the entire test set (area under the curve (AUC) = 0.970; 95% confidence interval, 0.957–0.982). (f) Precision–recall curve (area under the precision–recall curve, 0.987; F1 score, 0.943). Reprinted from Ref. [44] under the terms of the CC BY 4.0 license.
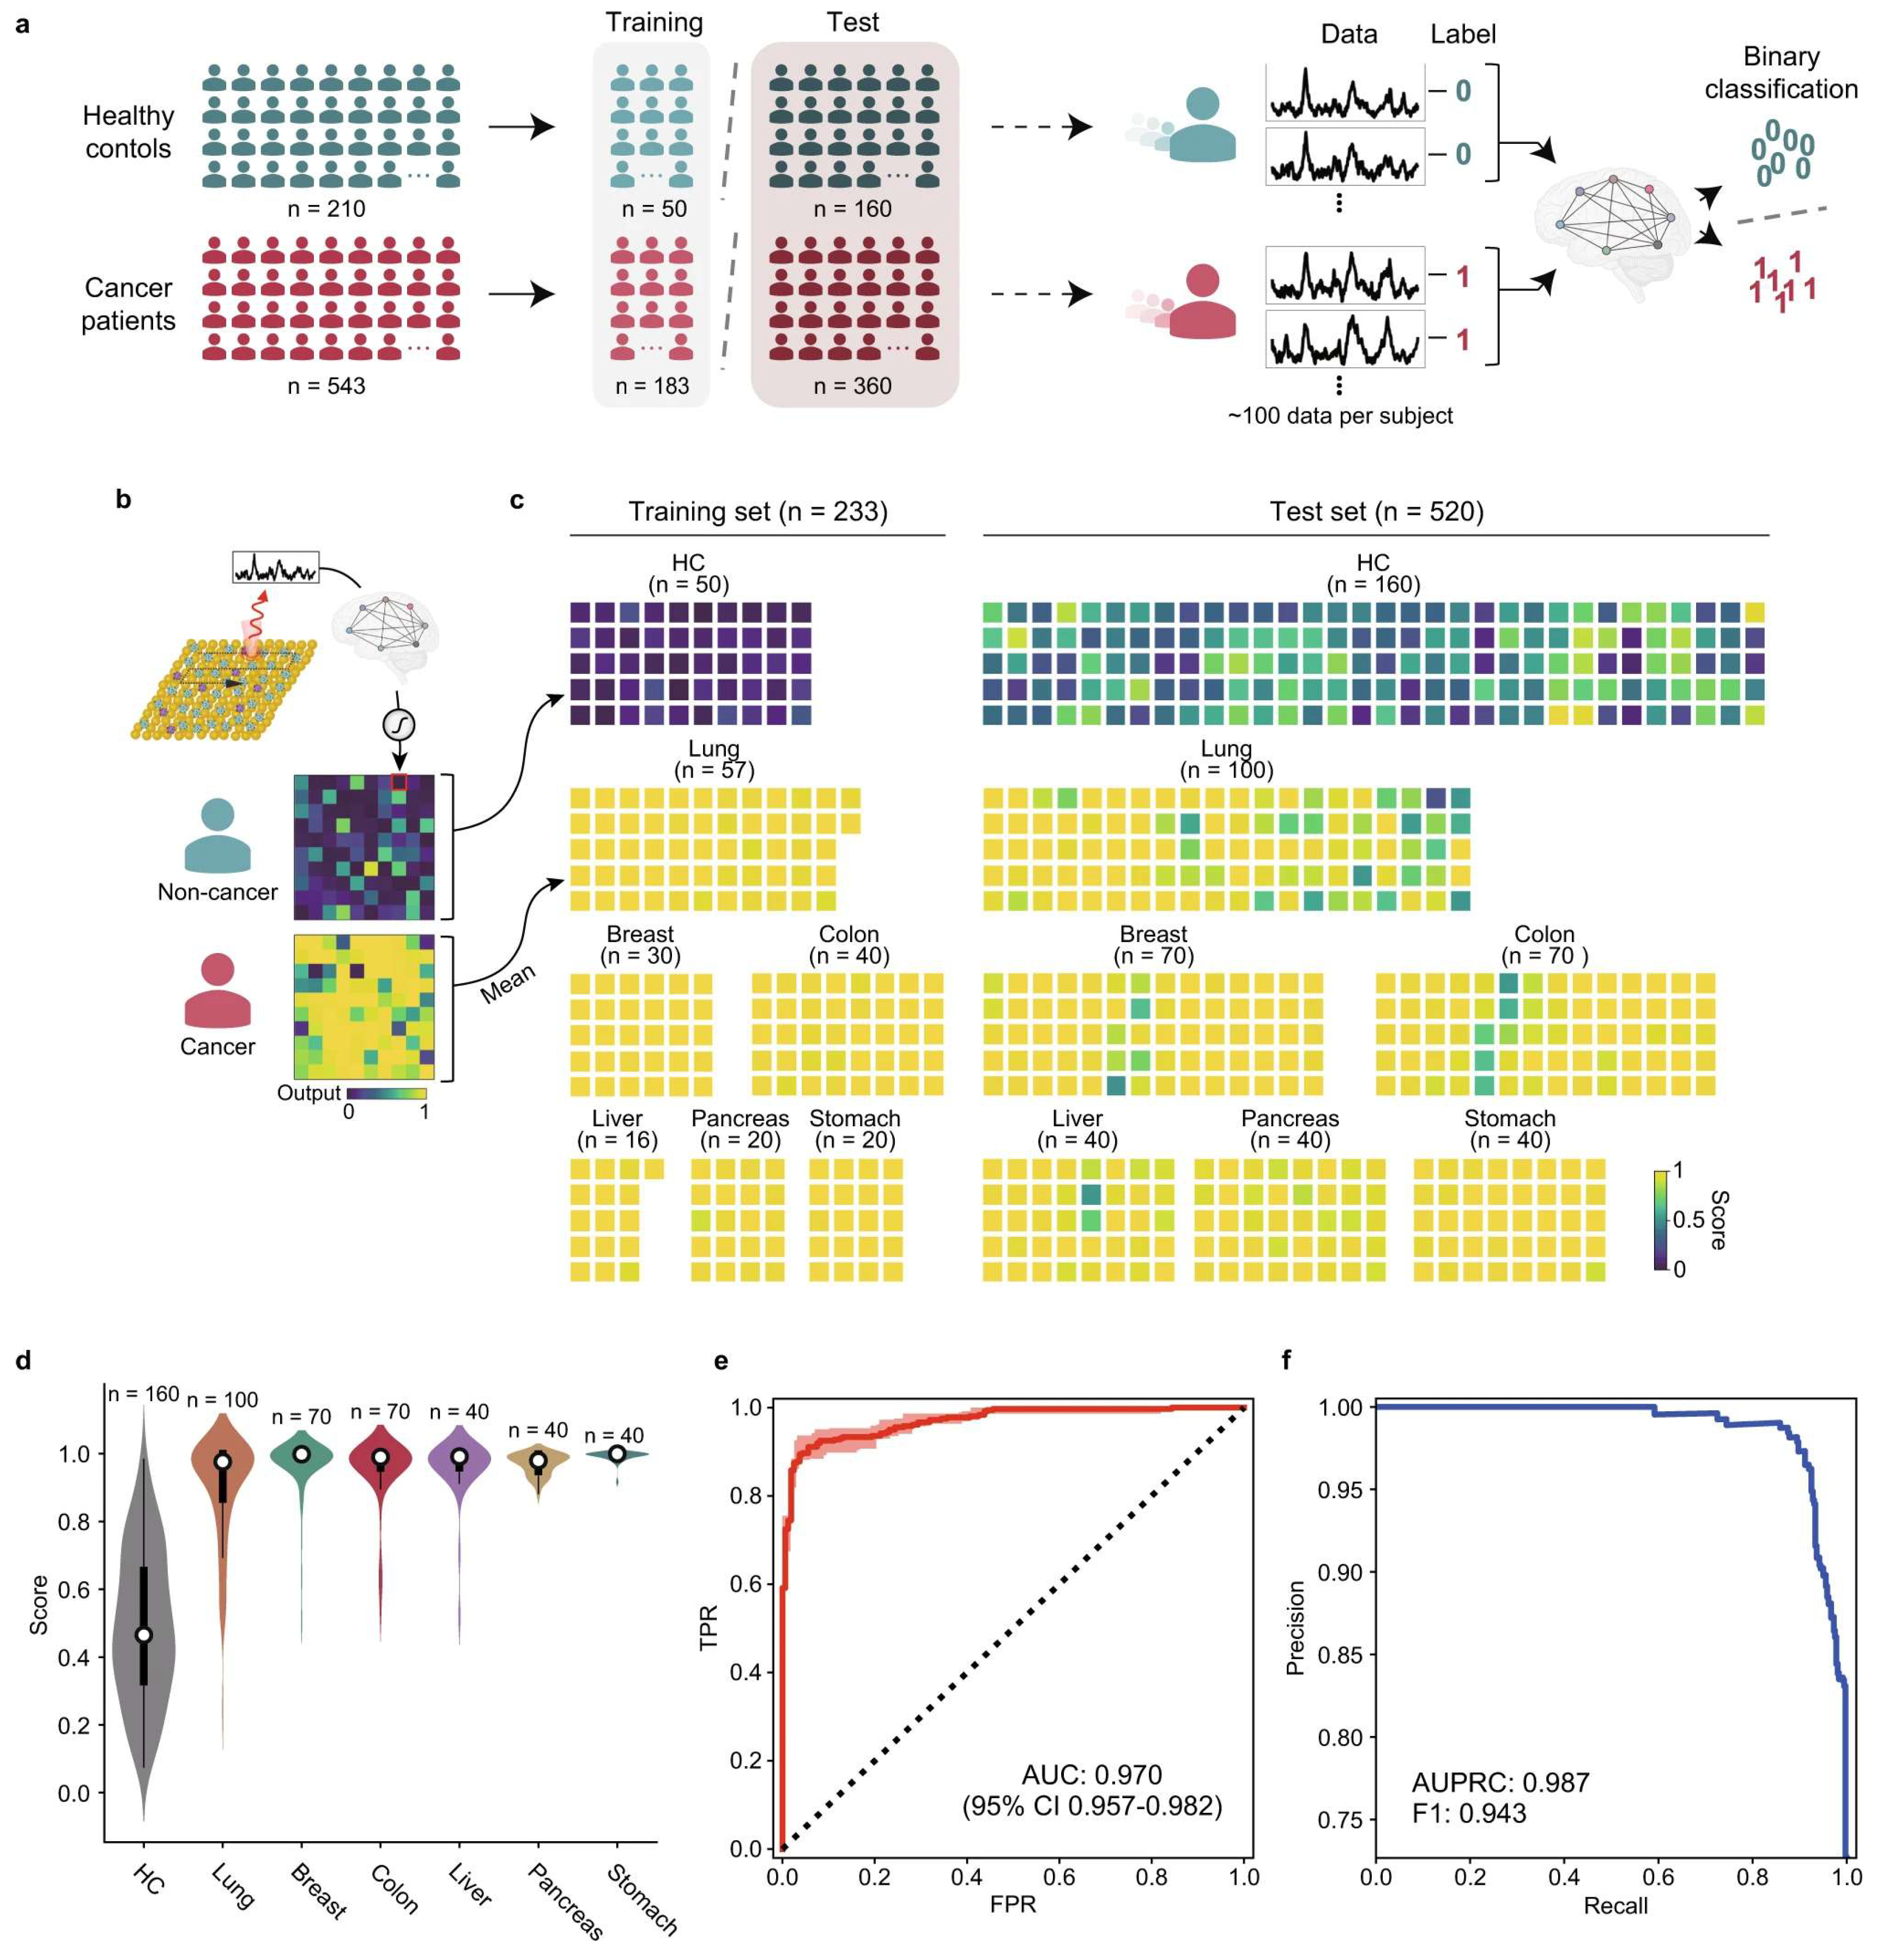
Figure 11.
Clinical verification of a portable nanozyme-catalyzed metasurface plasmon sensing platform (Nano-ELISPR) for cancer biomarker screening. (a,c,e) Carcinoembryonic antigen (CEA), cancer antigen 125 (CA125), and α-fetoprotein (AFP) concentrations measured by the platform in clinical serum samples plotted against the hospital clinical results, with linear fits (red lines; R2 = 0.961, 0.880, and 0.911, respectively) and clinical normal values (dashed blue lines). (b,d,f) Corresponding receiver operating characteristic (ROC) curves. Reprinted from Ref. [49] under the terms of the CC BY 4.0 license.
Figure 11.
Clinical verification of a portable nanozyme-catalyzed metasurface plasmon sensing platform (Nano-ELISPR) for cancer biomarker screening. (a,c,e) Carcinoembryonic antigen (CEA), cancer antigen 125 (CA125), and α-fetoprotein (AFP) concentrations measured by the platform in clinical serum samples plotted against the hospital clinical results, with linear fits (red lines; R2 = 0.961, 0.880, and 0.911, respectively) and clinical normal values (dashed blue lines). (b,d,f) Corresponding receiver operating characteristic (ROC) curves. Reprinted from Ref. [49] under the terms of the CC BY 4.0 license.
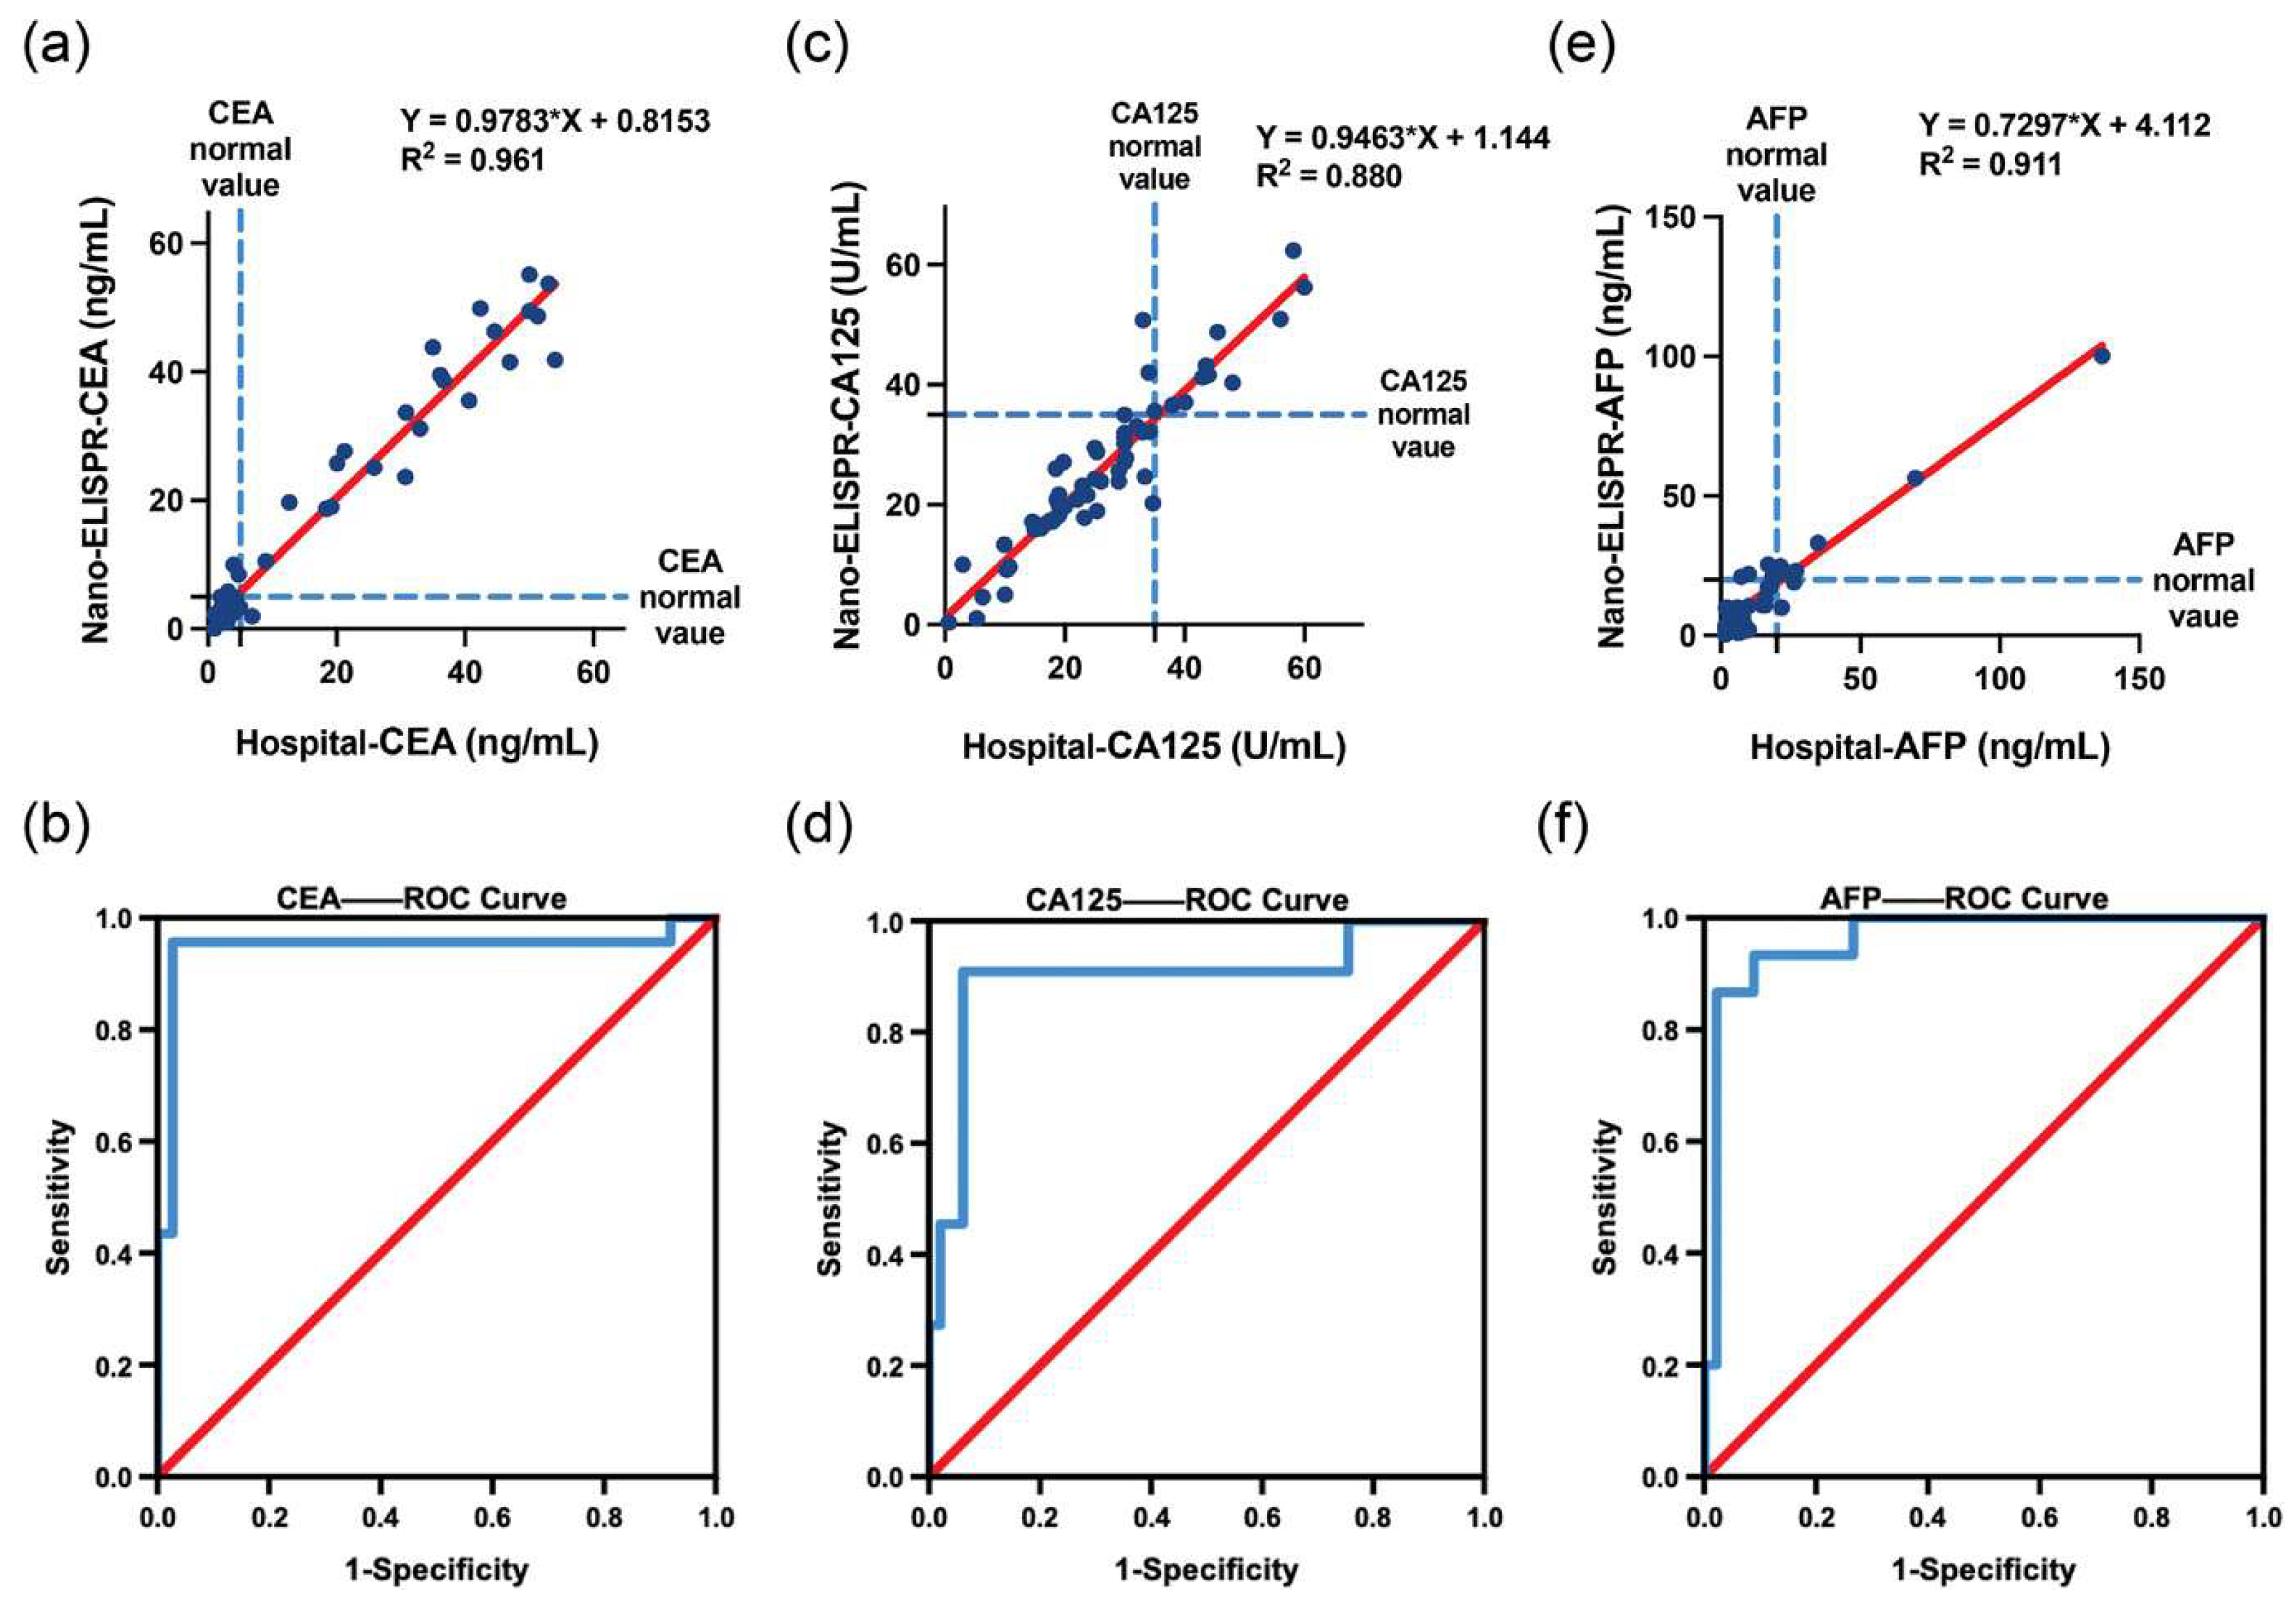
Figure 12.
Evidence and translation pathway for evaluating optical and magnetoplasmonic technologies. (a) Analytical and numerical models establish electromagnetic behavior and guide device design but cannot independently demonstrate application-level performance. (b) Controlled benchtop experiments test the predicted response under reproducible laboratory conditions. (c) Complex-sample studies reveal matrix effects, interferents, variability, and selectivity limitations that may not appear in idealized systems. (d) Field or application-environment testing evaluates robustness under realistic operating conditions. (e) Clinical or regulatory validation, where applicable, establishes safety, reproducibility, and compliance. (f) The deployed system integrates validated sensing, data acquisition, communication, and decision support. The downward arrow denotes increasing evidence and translation readiness rather than increasing response magnitude.
Figure 12.
Evidence and translation pathway for evaluating optical and magnetoplasmonic technologies. (a) Analytical and numerical models establish electromagnetic behavior and guide device design but cannot independently demonstrate application-level performance. (b) Controlled benchtop experiments test the predicted response under reproducible laboratory conditions. (c) Complex-sample studies reveal matrix effects, interferents, variability, and selectivity limitations that may not appear in idealized systems. (d) Field or application-environment testing evaluates robustness under realistic operating conditions. (e) Clinical or regulatory validation, where applicable, establishes safety, reproducibility, and compliance. (f) The deployed system integrates validated sensing, data acquisition, communication, and decision support. The downward arrow denotes increasing evidence and translation readiness rather than increasing response magnitude.
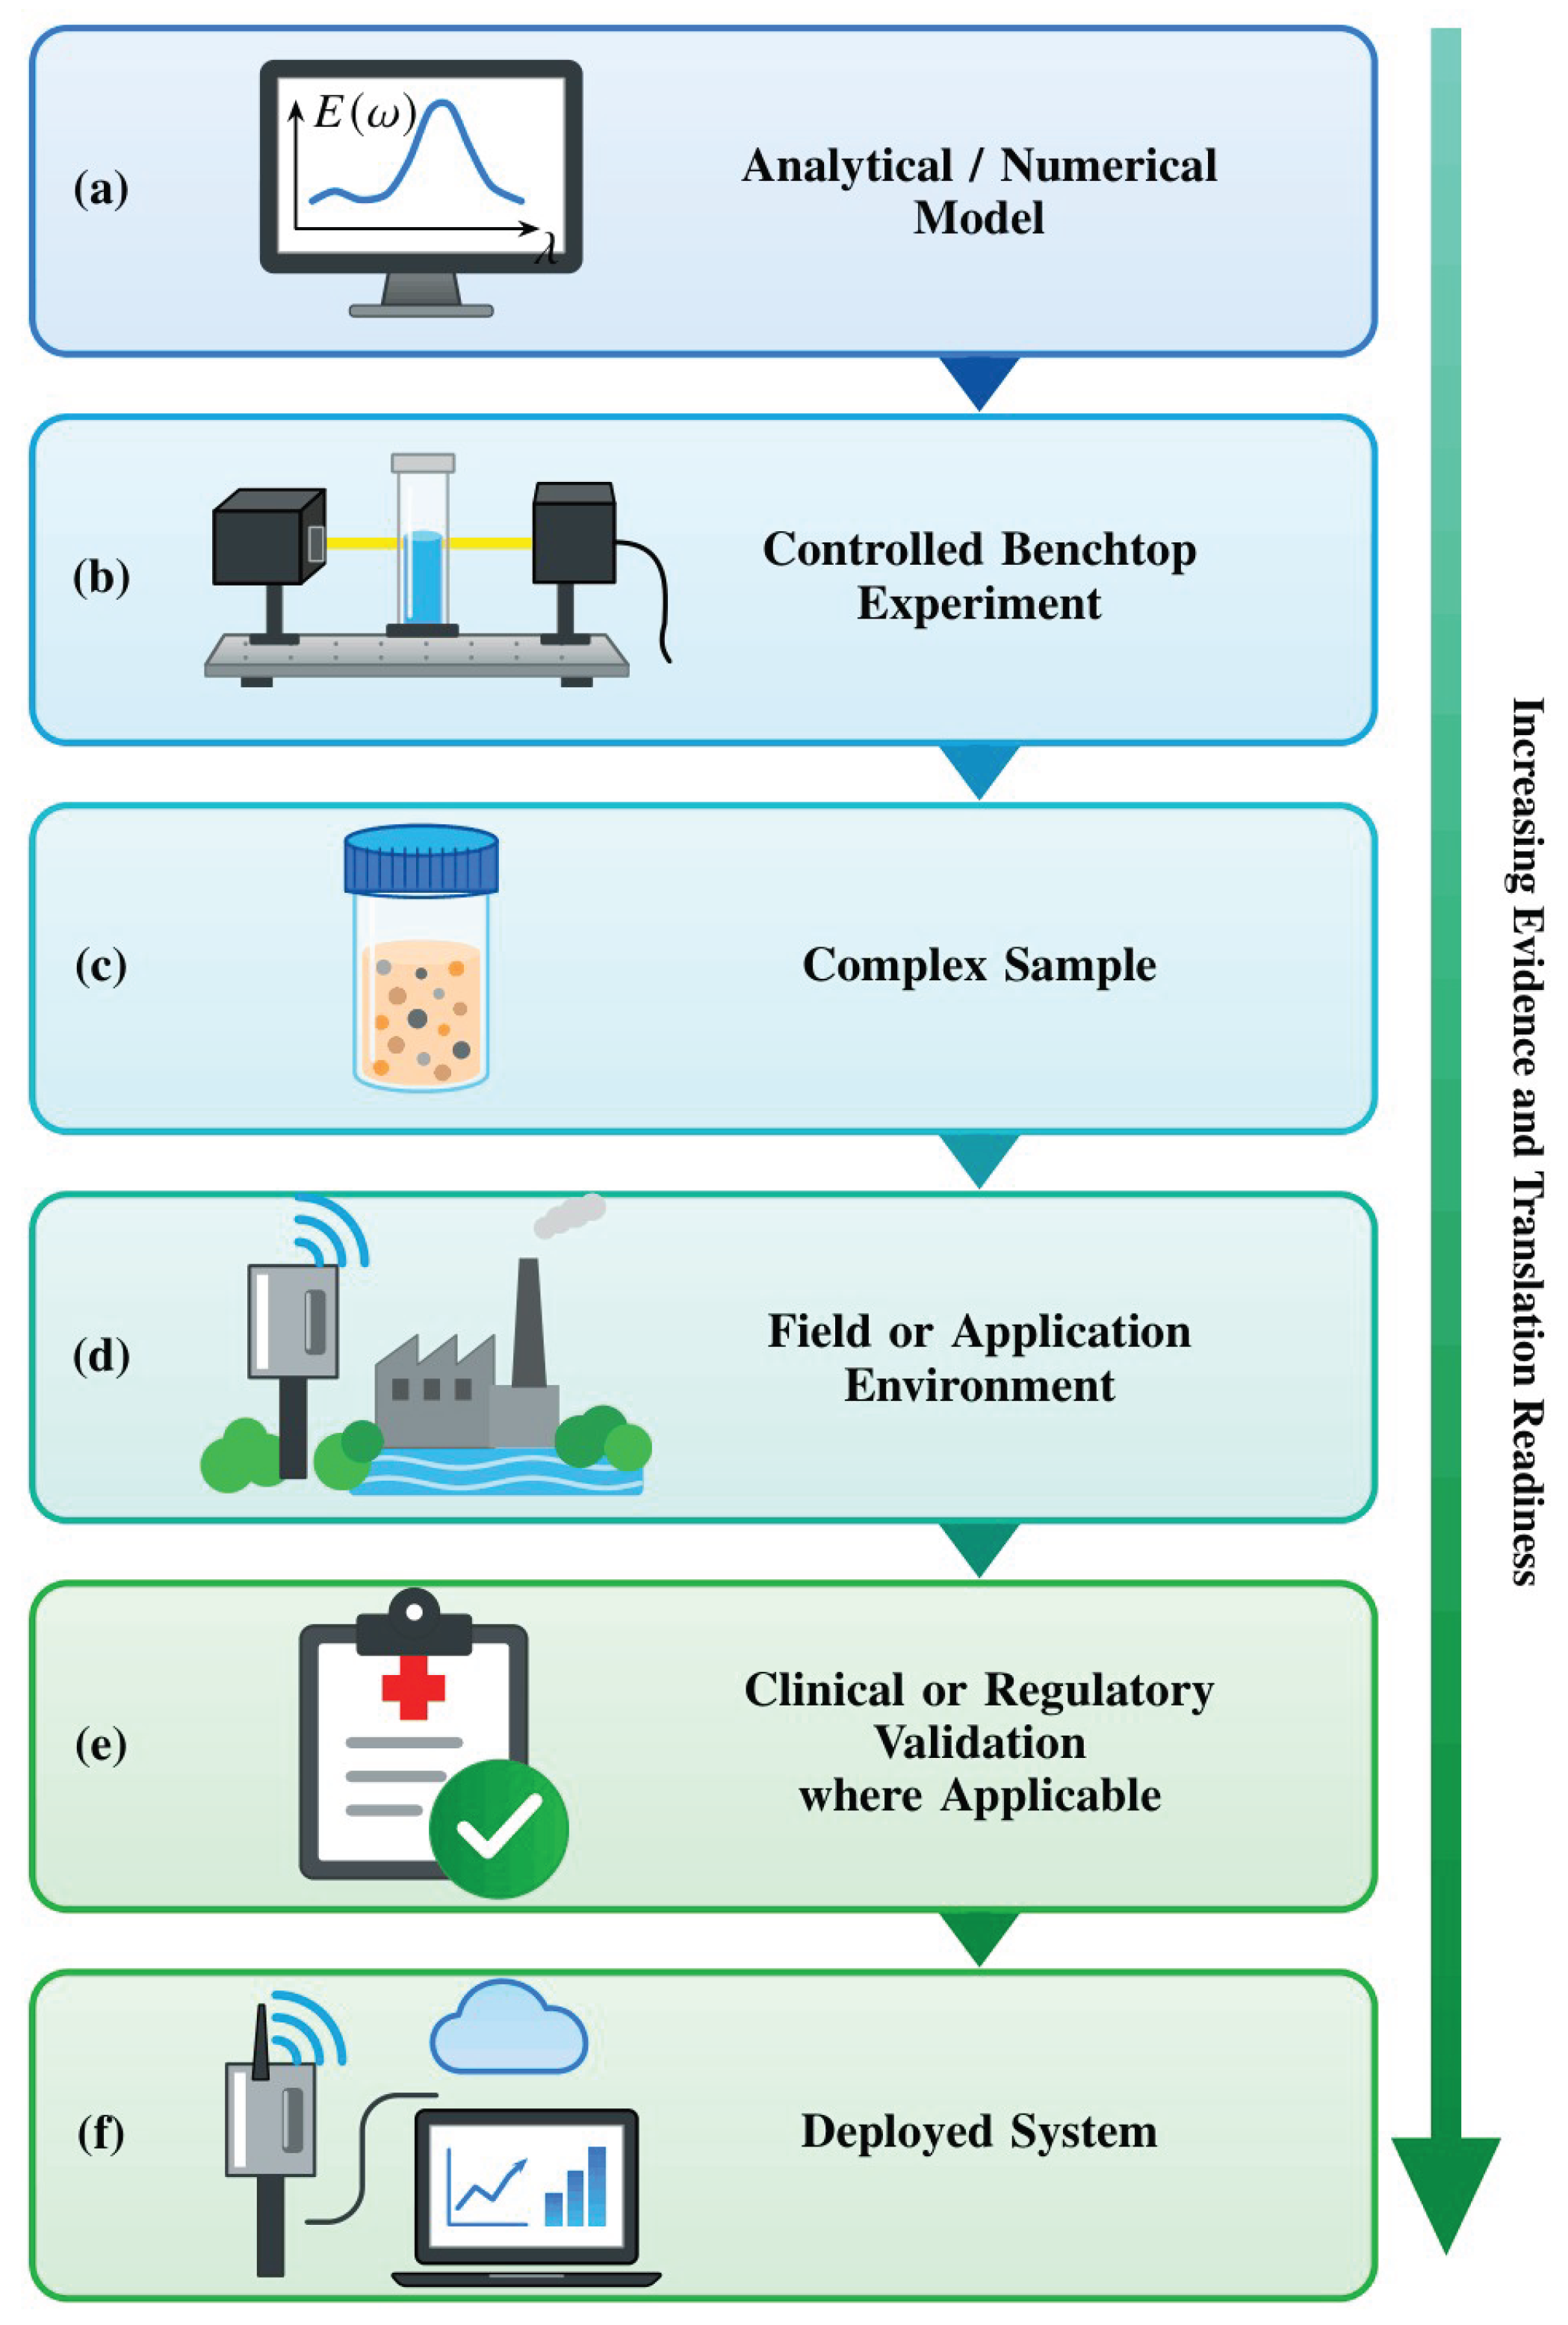

Table 1.
Comparison of the principal optical biosensing platform classes.
| Platform | Transduction Principle | Typical Sensitivity | Penetration Depth | Approx. TRL 1 | Representative Evidence |
|---|---|---|---|---|---|
| Prism-coupled SPR (Kretschmann) | Propagating surface plasmon polariton at a metal–dielectric interface; angular or wavelength interrogation | 102–103 °/RIU (angular); 103–104 nm/RIU (spectral) | ~200 nm | 6–8 | Commercial instruments; reviews of prism, grating, and fiber SPR architectures [3,4] |
| Fiber-optic or grating-coupled SPR | Evanescent coupling to a cladding mode or tilted-grating plasmon | 102–103 nm/RIU | 100–300 nm | 4–6 | Comb-like tilted fiber Bragg grating sensors with machine-learning-assisted readout [10] |
| Localized SPR (LSPR; nanoparticles, nanostructures) | Non-propagating dipolar plasmon confined to sub-wavelength metal nanostructures | 102–104 nm/RIU (structure-dependent) | 10–30 nm | 3–6 | Nanostructure biosensor reviews; simulated waveguide-coupled design reaching 111,000 nm/RIU [11,12,13] |
| Magneto-optic SPR (MO-SPR) | SPR coupled to the transverse magneto-optical Kerr effect (TMOKE) under an applied magnetic field | Intensity sensitivity comparable to or exceeding that of SPR; adds a field-modulated magneto-optical channel | ~200 nm | 2–4 | Ultranarrow-resonance heterostructure; Co/Ag and Co/Au bilayer simulations; Au–Co alloy immunoassay [8,14,15] |
| Whispering-gallery-mode (WGM) microresonator | High-Q circulating optical mode in a dielectric microsphere, microdisk, or microtoroid | Single-molecule to attomolar detection under idealized conditions | ~100 nm | 2–4 | Resonator-to-sensor review [16] |
| Metasurface or photonic-crystal cavity | Engineered resonant nanostructure array with tailored spectral response | Highly design-dependent; high-Q simulated designs common | <100 nm | 2–6 | Femtomolar-class designs surveyed in [1]; high-Q silicon metasurface with ~8 fM DNA detection in buffer and testing in clinical eluates [17] |
1 TRL estimates are the authors’ qualitative synthesis, based on the proportion of cited literature reporting validated clinical or field performance versus laboratory or simulated performance for each class; they are not a formal technology-readiness assessment of any single device. Sensitivity and analytical limit of detection are different quantities; the entries reflect different observables and are not direct numerical rankings. TRL ranges are illustrative at the platform-class level, not verified readiness ratings of individual products. LSPR, localized surface plasmon resonance; MO-SPR, magneto-optic surface plasmon resonance; Q, quality factor; RIU, refractive-index unit; SPR, surface plasmon resonance; TMOKE, transverse magneto-optical Kerr effect; TRL, technology readiness level; WGM, whispering gallery mode.
Table 2.
Nine-axis taxonomy for disambiguating optical biosensor performance claims.
| Axis | Working Definition | Illustrative Contrast |
|---|---|---|
| Measurand | The physical or chemical quantity ultimately being determined | Analyte concentration (e.g., cortisol, ng/mL) vs. bulk refractive index (RIU) [23] |
| Recognition mechanism | Why the target binds or interacts at the sensing surface | Antibody–antigen affinity vs. non-specific adsorption or enrichment |
| Transduction pathway | How a recognition event is converted into an optical signal | Refractometric SPR shift vs. plasmon-enhanced fluorescence vs. SERS |
| Observable | What the instrument physically records | Resonance angle vs. resonance wavelength vs. reflected intensity |
| Interrogation mode | The scanned variable used to locate the resonance | Angular scan vs. spectral scan vs. phase-sensitive detection |
| Device architecture | The physical embodiment of the sensing element | Prism-coupled thin film vs. nanoparticle colloid vs. tilted fiber grating |
| Role of magnetism (if any) | Whether a magnetic component enriches the analyte during sample delivery or provides a field-modulated readout channel | Magnetic bead pre-concentration (sample delivery) vs. TMOKE differential readout (readout) [15] |
| System integration level | Degree of packaging, from open bench rig to enclosed cartridge | Benchtop attenuated total reflection (ATR) setup vs. fiber-pigtailed point-of-care cartridge |
| Evidence strength | The type and rigor of validation behind the reported number | Numerical simulation vs. buffer-phase proof of concept vs. matrix-validated prototype |
ATR, attenuated total reflection; RIU, refractive-index unit; SERS, surface-enhanced Raman scattering; SPR, surface plasmon resonance; TMOKE, transverse magneto-optical Kerr effect.
Table 3.
Sources of matrix dependence, instrumental uncertainty, and reporting error that separate buffer-phase claims from practical biosensing performance.
Table 3.
Sources of matrix dependence, instrumental uncertainty, and reporting error that separate buffer-phase claims from practical biosensing performance.
| Source | Effect on Sensor Response | Representative Evidence |
|---|---|---|
| Non-specific protein adsorption | Elevated baseline signal; reduced apparent selectivity | Reviewed for biosensing in general and for plasmonic clinical analysis [19,24] |
| Surface fouling over repeated use | Progressive sensitivity loss; drift between measurements | Identified as a translation barrier for clinical and biomedical deployment [6] |
| Antibody surface-coverage dependence | Matrix interference depends on immobilization density | Quantified directly in microfluidic capillary immunoassays [25] |
| Bulk vs. surface refractive-index conflation | Reported sensitivity depends on which response was actually measured | Discriminated with narrow-bandwidth resonance combs [9] |
| Batch-to-batch fabrication variation | Device-to-device spread obscures the true limit of detection | Under-reported in the two-dimensional-material and polymer sensor literature [26,27] |
| Assumed vs. achieved instrumental resolution | Derived limit of detection depends on an assumed angular or spectral resolution that may not be achieved in the field | Explicit in a numerical cortisol-sensing case study (Section 6.1) [23] |
Table 4.
Two-dimensional material classes used to enhance plasmonic biosensor performance: enhancement mechanisms, fabrication maturity, and reproducibility concerns.
Table 4.
Two-dimensional material classes used to enhance plasmonic biosensor performance: enhancement mechanisms, fabrication maturity, and reproducibility concerns.
| Material Class | Sensitivity-Enhancement Mechanism | Fabrication Maturity | Principal Reproducibility Concern |
|---|---|---|---|
| Graphene | Biomolecule adsorption via π–π stacking and strong interfacial field enhancement increase the resonance response | Widely available; chemical vapor deposition (CVD) growth and transfer common | Transfer-induced defects and wrinkling affect layer-to-layer consistency |
| MXenes (e.g., Ti3C2Tx) | Metallic conductivity, large surface area, and tunable surface terminations; used across photoluminescence, colorimetric, SPR, SERS, and electrochemiluminescence transduction [27,35] | Etching-based synthesis scalable, but termination chemistry is batch-sensitive [30,35] | Oxidation of aqueous colloids within days to weeks; termination-group variability alters the optical response [31,32,33] |
| Black phosphorus (phosphorene) | Strong anisotropic light–matter interaction; simulated angular sensitivity and FOM increase with layer number [23] | Literature dominated by simulations; experimental exfoliation is air-sensitive | Ambient degradation, driven largely by adsorbed water, within hours to days [34]; rarely addressed in simulation-only studies |
| Transition-metal dichalcogenides (e.g., MoS2) | Bandgap-tunable absorption enhances field confinement at resonance | CVD growth maturing; layer-number control still at bench scale | Variation in layer number and defect density across growth batches |
CVD, chemical vapor deposition; FOM, figure of merit; SERS, surface-enhanced Raman scattering; SPR, surface plasmon resonance.
Table 5.
Technology-readiness mapping for the translation of optical and magnetoplasmonic biosensors.
Table 5.
Technology-readiness mapping for the translation of optical and magnetoplasmonic biosensors.
| TRL Band | Development Stage | Evidence Required at This Stage | Typical Literature Evidence |
|---|---|---|---|
| 1–2 | Basic principle; simulated design | Physical mechanism; simulated sensitivity and FOM; explicitly stated assumed instrumental resolution | Numerical SPR, LSPR, and MO-SPR design studies [13,14,23] |
| 3–4 | Proof of concept in idealized buffer | Experimental sensitivity in PBS or equivalent; limit of detection from replicate blank and low-concentration measurements, Equation (6) [37]; fabrication method; single-device performance | Bench-scale MXene and MO-SPR demonstrations [15,27,35,39] |
| 5–6 | Validated prototype in a relevant or real matrix | Matrix-specific performance (serum, saliva, blood, urine); reproducibility across independently fabricated units; interface and oxidation stability over realistic timescales | Clinical-analysis SPR literature and matrix-interference studies [19,25,26]; portable metasurface plasmon platform benchmarked against hospital results in 60 clinical sera (Figure 11) [49] |
| 7–8 | System demonstration; field-tested device | Device-to-device and batch-to-batch variation reported; calibration procedure and measurement uncertainty stated; benchmarking against a benchtop counterpart | Commercial prism-coupled SPR instrumentation, deployed mainly for research rather than diagnostic use [3,4] |
| 9 | Deployed diagnostic product | Regulatory validation and verification under the applicable IVD framework; post-market performance monitoring | Requirements defined by the IFCC validation and verification position statement [50] |
TRL bands are adapted for optical biosensor translation and do not correspond exactly to agency-specific medical-product TRL definitions. Clinical or regulatory validation (Figure 12, stage (e)) typically spans TRL 8–9, depending on the applicable regulatory pathway, whereas TRL 9 denotes the deployed product. FOM, figure of merit; IFCC, International Federation of Clinical Chemistry and Laboratory Medicine; IVD, in vitro diagnostic; LSPR, localized surface plasmon resonance; MO-SPR, magneto-optic surface plasmon resonance; PBS, phosphate-buffered saline; SPR, surface plasmon resonance; TRL, technology readiness level.
Disclaimer/Publisher’s Note: The statements, opinions and data contained in all publications are solely those of the individual author(s) and contributor(s) and not of MDPI and/or the editor(s). MDPI and/or the editor(s) disclaim responsibility for any injury to people or property resulting from any ideas, methods, instructions or products referred to in the content. |
© 2026 by the authors. Licensee MDPI, Basel, Switzerland. This article is an open access article distributed under the terms and conditions of the Creative Commons Attribution (CC BY) license.
Copyright: This open access article is published under a Creative Commons CC BY 4.0 license, which permit the free download, distribution, and reuse, provided that the author and preprint are cited in any reuse.