

Submitted:
12 November 2026
Posted:
17 November 2026
You are already at the latest version
Abstract
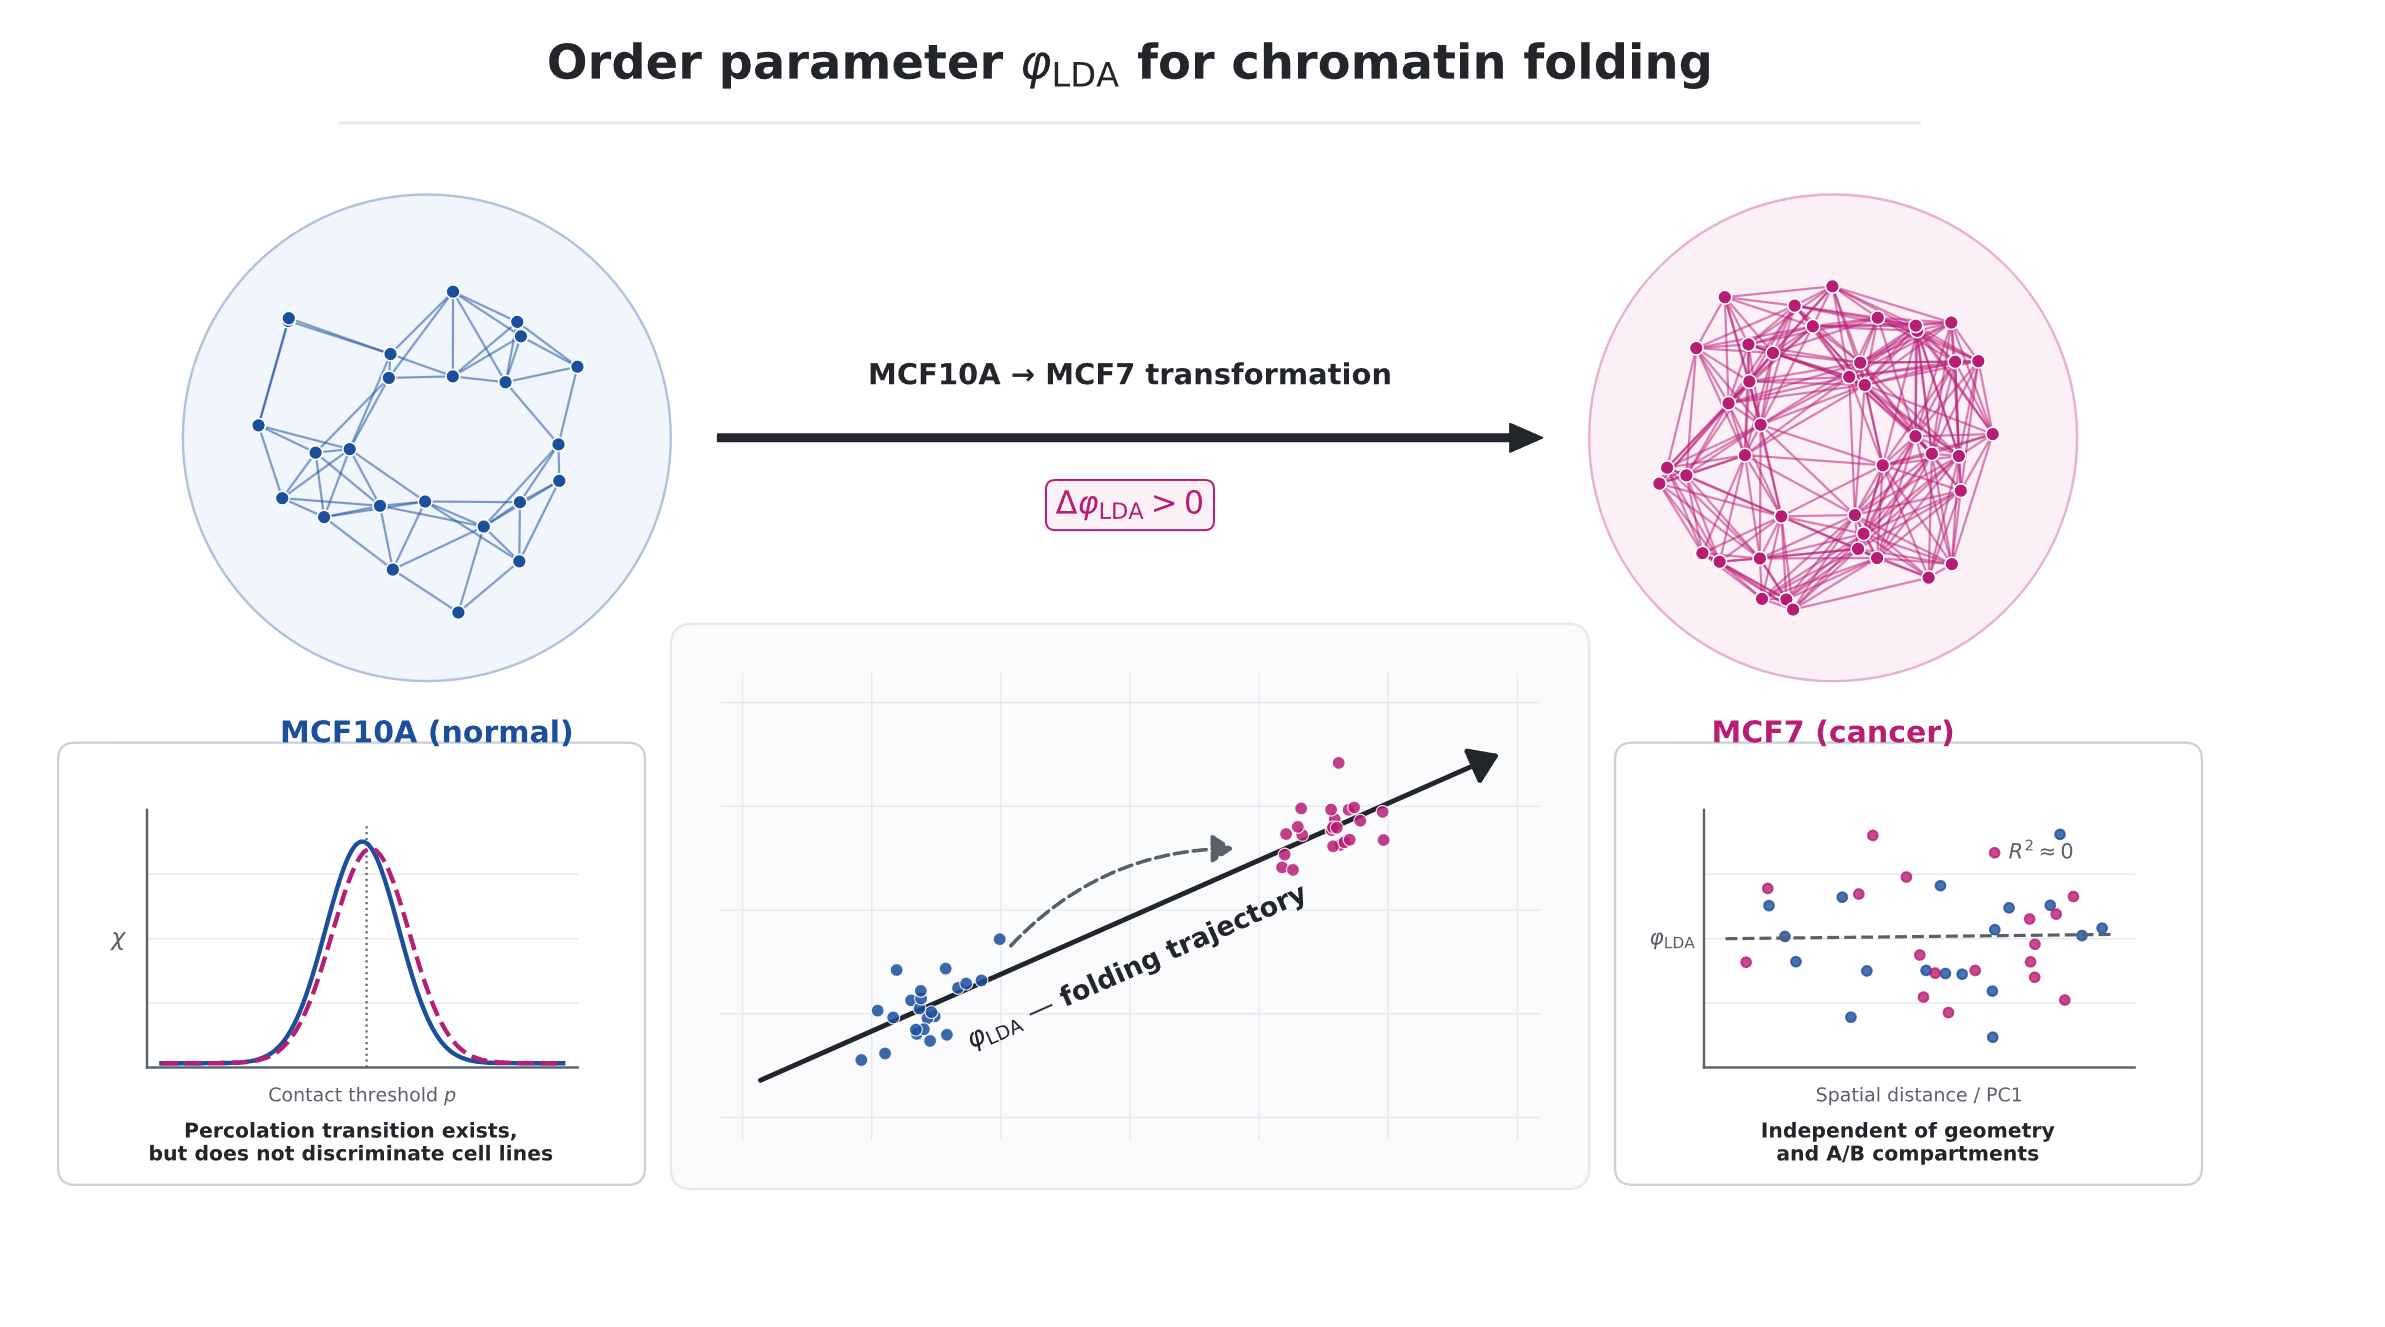
Geometric methods (Poincaré embedding, directionality index, insulation score) describe what changes in the TAD hierarchy upon cell transformation, but do not provide a scalar parameter characterizing the mechanism of reorganization. We propose an order parameter φ based on a physical model of chromatin graph percolation. We show that a percolation transition exists at min_sep = 1 (tc ≈ 1%, S(∞) ≈ 0.945) but does not discriminate between cell lines due to the diagonal backbone of Hi-C. As the main parameter, we propose φLDA - the projection onto the frst discriminant axis of LDA trained on features (contact count, degree in the top-20% graph, PC1, Poincar´e radius). On three chromosomes (chr17, chr19, chr1), φLDA shifts signifcantly under MCF10A → MCF7 transformation: ∆φ = +0.49/ +0.97/ + 0.54 (p = 10−4, Cohen’s d = 0.32–0.89). The shift is linearly uncorrelated with geometry: |corr(φLDA, rnorm)| < 0.2. The link to A/B compartments is weak (|corr| < 0.3) with a sign fip between lines, indicating compartment reorientation upon transformation. The parameter is robust to feature composition (CV < 7%) and consistent with logistic regression (Pearson r = 0.993–1.000 across the three chromosomes); Random Forest achieves higher classifcation accuracy (AUC 0.95–0.98) but does not provide an interpretable axis. At 100 kb resolution (8 GSE63525 lines), the direction of the shift is preserved, but the absolute values of φLDA depend on resolution. φLDA complements the geometric metrics of our previous work [1] as an independent physical order parameter.
Keywords:
TAD
; Hi-C
; chromatin graph percolation
; order parameter
; linear discriminant analysis (LDA)
; MCF10A / MCF7
; chromatin folding trajectory
; A/B compartments
1. Introduction
The spatial organization of chromatin in the cell nucleus is hierarchical: from loops and TADs (topologically associating domains) to A/B compartments and chromosome territories. Upon cell transformation (e.g., MCF10A → MCF7), this hierarchy is reorganized, and quantitative description of such reorganization is one of the central problems of computational genomics.
Existing methods can be divided into two groups. Geometric methods (Poincaré embedding, directionality index, insulation score) describe what changes: embedding radius, TAD boundaries, directionality of contacts. Statistical methods (PCA, clustering) describe where changes occur: which compartments or TADs are reorganized. However, neither provides a scalar order parameter that would characterize the mechanism — i.e., the physical quantity along which the system moves upon transformation.
In our previous work [1], we showed that Poincaré embedding yields geometric metrics (, ) that describe the shift but do not explain it. In the present work, we propose a physical model: chromatin graph, percolation, and an order parameter based on linear discriminant analysis (LDA).
1.1. Main Results
- A percolation transition in 40 kb Hi-C exists at (, ) but does not discriminate between lines due to the diagonal backbone.
- shifts significantly under MCF10A → MCF7 on three chromosomes: (, –).
- is linearly uncorrelated with geometry: .
- The link to A/B is weak () with a sign flip — compartment reorientation.
- The parameter is robust to feature composition (CV ) and consistent with logistic regression (–); Random Forest is more accurate (AUC –) but does not yield an interpretable axis.
2. Theory
2.1. Chromatin Graph and Percolation
Consider a Hi-C matrix at resolution (40 kb or 100 kb), where N is the number of bins. We define the chromatin graph :
- nodes — bins;
- edges , where is the normalized contact weight, is the threshold.
Normalization. We use sqrt(O/E):
with clipping and symmetrization .
Threshold. Edges are kept by top- of weights, . The threshold is defined as the quantile of the weight distribution.
2.2. Percolation Analysis
For a grid of thresholds (in percent of the supergraph top-20%), we compute:
- — fraction of nodes in the giant connected component;
- — susceptibility, where is the number of clusters of size s;
- — the percolation transition point.
Candidate order parameter: .
2.3. Order Parameter
The percolation at 40 kb Hi-C turns out to be insensitive to biology (see Section 4.1). We therefore introduce an alternative parameter based on linear discriminant analysis (LDA).
Why LDA? The task is not classification (MCF10A vs MCF7), but finding a one-dimensional axis along which the system shifts upon transformation. LDA and logistic regression both yield a single axis; their projections are almost identical on all three chromosomes ( on chr17, on chr19, on chr1; Table 2), confirming that the LDA axis is not an artifact of the LDA-specific objective (maximizing between/within variance ratio). A Random Forest classifier achieves a higher cross-validated AUC (– vs. – for LDA), indicating non-linear components of the MCF10A/MCF7 difference that LDA does not capture. However, Random Forest does not provide a single interpretable axis — feature importance is a global score, not a per-bin projection. We therefore choose LDA as the simplest method that yields a one-dimensional, interpretable, and reproducible axis, and report the Random Forest comparison as a limitation (Section 5).
Per-bin features ():
- 1.
- — total contacts of the bin;
- 2.
- — degree in the top-20% graph;
- 3.
- — first PCA component of the row-correlation matrix (A/B compartments, Lieberman-Aiden [2]);
- 4.
- — norm of the point in the Poincaré disk (radius ).
LDA. A binary classifier MCF10A (class 0) vs MCF7 (class 1) is trained on the combined array , with features standardized (zero mean, unit variance) prior to LDA.
Order parameter:
where is the first discriminant axis (maximizing the ratio of between-class to within-class variance).
Aggregation:
2.4. Relation to Geometry
Geometric metrics of the previous work [1]:
- — shift of the mean Poincaré radius (chr17/chr1/chr19: );
- — shift of the power-law exponent (not significant, –).
Independence criterion: (Pearson correlation). If satisfied, carries information not contained in geometry (in the linear sense).
2.5. Hypothesis
Proposition 1.
Under MCF10A → MCF7 transformation, the system shifts along the axis: , the shift is consistent across chromosomes, and it is linearly uncorrelated with geometry.
3. Methods
3.1. Data
Primary pair (MCF10A/MCF7). Hi-C matrices at 40 kb, hg19, from GSE66733 [3]: chr17 (), chr1 (), chr19 (). Normalization sqrt(O/E), diagonal zeroed.
Poincaré embedding. For each matrix, we build an embedding in the two-dimensional Poincaré disk (v1 version, 6 hierarchical levels, of loci per level). The result is bin coordinates in the Poincaré disk and their one-to-one correspondence to genomic positions; these coordinates are used below only as the source of the radius for one of the features (see Section 2).
Independent validation. To test reproducibility on independent lines, we used 8 cell lines from GSE63525 [4] at 100 kb resolution (chr1, after discarding 214 bins with zero coverage): K562 and KBM7 (cancer), HMEC, HUVEC, IMR90, NHEK, GM12878, and 4DNFIZGCA8AH (normal).
3.2. Building the Chromatin Graph
For each Hi-C matrix A, we build a weighted graph . Nodes are bins; edges are pairs with (diagonal excluded). The edge weight is the normalized contact , where is the expected number of contacts from marginals (see Section 2). Edges are kept by threshold: top- by weight, , yielding three density levels of the graph for robustness.
3.3. Percolation Analysis
For a grid of thresholds (200 equidistant points, in percent of the top-20% supergraph edges), we compute three quantities: the fraction of nodes in the giant connected component , the susceptibility , and the percolation transition point . Connected components are found via the union-find algorithm. The candidate order parameter is .
3.4. LDA Parameter
The parameter is built in four steps:
- 1.
- For each line, four per-bin features are computed: , , PC1, and (see Section 2).
- 2.
- Features are standardized (zero mean, unit variance) on the combined MCF10A + MCF7 array.
- 3.
- A linear discriminant analysis (LDA) with one component is trained; the axis maximizes the ratio of between-class to within-class variance.
- 4.
- Each bin is projected onto the axis: .
For each run, per-bin values of and summary statistics (mean, median, ) are saved.
3.5. Statistics
The significance of the shift is assessed by a permutation test (10 000 random permutations of MCF10A/MCF7 labels; two-sided p-value). Confidence intervals are obtained by bootstrap (5 000 iterations, 95% percentile interval). The relation of to features is quantified by Pearson and Spearman coefficients separately for each line.
3.6. Robustness
Robustness of is checked along four axes:
- feature composition: full set (4 features) / without / without PC1;
- graph threshold: ;
- chromosome: chr17, chr19, chr1;
- resolution: 40 kb (MCF10A/MCF7) vs 100 kb (GSE63525).
For each axis, the coefficient of variation is computed; the robustness criterion is .
3.7. Reproducibility
All code and data are available at github.com/andytimoffilim/TAD_Scale-Dependent_ConcordancePoincare_REPO. Python 3.11, numpy, scipy, scikit-learn, matplotlib. Hi-C data are from GEO (GSE66733, GSE63525); they are not stored in the repository due to size, but are accessible via the GEO links.
4. Results
4.1. Percolation: Transition Exists but Is not Biological
For chr17 (40 kb), both lines exhibit a percolation transition: peaks at (MCF10A) and (MCF7), (Fig. 1). The transition is stable across supergraphs: yield identical .
However, does not discriminate between lines: for all integral candidates. The reason is the diagonal backbone of Hi-C, which percolates at equally in both lines.
Exclusion of the diagonal backbone. To test whether the diagonal backbone is responsible for the insensitivity of , we repeated the analysis with (pairs kb, kb, Mb were excluded). The difference in between lines grows with : . However, this growth is accompanied by a drop in from 27 to 1–2 and a leftward shift of to 0.1%, indicating a sparsity artifact: at 40 kb, after removing short-range contacts, the graph has too few edges for a meaningful percolation transition.
4.2. Shifts Significantly Upon Transformation
Consistency: positive sign on all three chromosomes; everywhere (minimum over the grid of 10 000 permutations); Cohen’s – (small-to-large effect).
Comparison with other classifiers. To verify that the LDA axis is not an artifact of the LDA-specific objective, we compared LDA with logistic regression and Random Forest on the same four features (Table 2). The LDA and logistic-regression projections are almost identical on all three chromosomes ( on chr17, on chr19, on chr1). A Random Forest classifier achieves a higher cross-validated AUC ( / / vs. / / for LDA on chr17/chr19/chr1), indicating non-linear components of the difference that LDA does not capture; however, Random Forest does not provide a single interpretable axis.
The high Random Forest AUC (–) should be interpreted with caution: MCF10A and MCF7 are processed in separate experiments, and part of the non-linear signal captured by Random Forest may reflect batch effects (sequencing depth, library preparation) rather than biology. The LDA axis, in contrast, is linear and focuses on structural features (, ), giving a lower but more interpretable AUC (–).
4.3. Is Linearly Uncorrelated with Geometry
The Pearson correlation of with is – across all three chromosomes (, Fig. 3a). This is 2.5–15 times below the threshold of from the criterion.
Importantly, enters the LDA features, but its weight is minimal ( for chr17/chr19/chr1). Thus LDA itself does not select geometry for discrimination — the lack of correlation is not by construction, but a matter of fact.
4.4. Link to A/B Compartments
The Pearson correlation of with PC1 is weak (Fig. 3b): (chr17), (chr19), (chr1) for MCF10A/MCF7.
The sign flip on chr17 and chr1 is a stable pattern. Physical interpretation: reorientation of A/B compartments relative to the folding trajectory upon transformation. does not reduce to PC1.
The formal criterion is not satisfied (), but the sign flip is a meaningful result, not an absence of relation.
4.5. Dominant Feature
LDA weights (chr17/chr19/chr1):
- : (dominant);
- : (opposite sign — structural shift);
- PC1: (weak);
- : (minimal).
Physically, measures the contact level and density of strong bonds, which change upon transformation.
4.6. Robustness to Feature Composition

Table 3.
Robustness of to feature composition (chr17, 40 kb, ).
| Variant | Features | (mean) | (median) |
| full | n, deg, PC1, r | ||
| no_r_norm | n, deg, PC1 | ||
| no_pc1 | n, deg, r |
CV across variants: (mean), (median). The criterion CV is satisfied.
4.7. Robustness to
For , the sign of is preserved, and significance () holds everywhere. The absolute magnitude varies: (mean) , (median) . The main result is for (Methods); all three values are reported here.
4.8. Independent Validation on GSE63525
To test reproducibility on independent lines, we projected 8 GSE63525 cell lines (100 kb, chr1) onto the LDA axis trained on K562 (cancer) vs HMEC (normal). Note that MCF10A/MCF7 are at 40 kb while GSE63525 lines are at 100 kb; the absolute values are therefore not directly comparable, only the direction of the MCF10A → MCF7 shift is meaningful.
Direction is reproduced. MCF10A , MCF7 , : MCF7 is closer to K562, MCF10A — to HMEC. The direction of the MCF10A → MCF7 shift is thus consistent with the K562 → HMEC axis.
Cancer/normal does not cluster. The 8 GSE63525 lines do not separate by cancer/normal status (Table 4): the LDA axis distinguishes the specific pair K562/HMEC, not a general phenotype. The reason is different resolution (40 vs 100 kb) and different scale of (mean at 100 kb vs at 40 kb after bp normalization — a 10-fold difference that shifts the projection by a constant offset but does not change the direction of the axis).
Per-line normalization does not help. We also tested per-line normalization (z-score or percentile rank) before projection. In both cases LDA collapses to a zero axis (), because per-line normalization removes the between-line differences that LDA is designed to capture — a mathematical property of LDA, not a limitation of the data.
Limitation. trained on the MCF pair (40 kb) depends on resolution and on the training pair. This is not a general cancer biomarker, but a measure of the shift along the MCF10A → MCF7 folding trajectory.
5. Discussion
5.1. Mechanism: Reorganization as a Shift Along the Folding Trajectory
The results show that under MCF10A → MCF7 transformation, chromatin shifts along a single axis , determined by the balance of “contact level” () and “density of strong bonds” (). This shift is:
- 1.
- consistent across three chromosomes ();
- 2.
- linearly uncorrelated with geometry ();
- 3.
- weakly linked to A/B compartments (, with a sign flip).
Physical interpretation: describes the folding trajectory of chromatin — a one-dimensional path in the space of structural features along which the system moves upon transformation. This complements the geometric metrics of the previous work [1]: geometry (Poincaré embedding) describes what changes (radius, hierarchy), while describes why (contact level and bond density).
5.2. Relation to the Literature
Chromatin percolation. The percolation model on a chromatin graph has previously been used to describe globular and fractal chromatin [2,5]. Our results show that at 40 kb Hi-C a percolation transition exists (), but does not discriminate between cell lines. This is a limitation of 40 kb resolution: the diagonal backbone percolates equally in both lines, and removing it destroys the transition (Section 4.1).
A/B compartments. The sign flip of the correlation between and PC1 between MCF10A and MCF7 (chr17, chr1) is consistent with literature data on compartment reorientation in cancer [4]. This is not a reduction of to PC1, but a reorientation of A/B relative to the folding trajectory.
5.3. Limitations
- 1.
- Two lines (MCF10A/MCF7) — an isogenic pair. Although the direction of the shift is reproduced on GSE63525 (100 kb), the absolute values of depend on resolution. Validation on more lines at 40 kb is needed.
- 2.
- Three chromosomes (chr17, chr19, chr1) — not the whole genome. chr19 (short) yields the largest effect (); chr1 (large) yields a medium one ().
- 3.
- 40 kb is a coarse resolution for percolation. Removing the diagonal backbone (min_sep ) increases the inter-line difference in , but simultaneously destroys the percolation transition ( drops from 27 to 1–2). A 5–10 kb resolution is required for a correct percolation analysis without the diagonal (see Section 4.1 for details).
- 4.
- GSE63525 (100 kb) does not reproduce cancer/normal. The LDA axis separates the specific K562/HMEC pair, not a general phenotype. Per-line normalization (z-score, rank) collapses LDA — mathematically inevitable.
- 5.
- No RNA-seq in the current version. Linking to gene expression (an RNA-seq-augmented ) is a subject for future work.
- 6.
- LDA is linear. The order parameter captures only linear combinations of the four features, giving a cross-validated AUC of – across the three chromosomes. A Random Forest classifier achieves AUC –, indicating that non-linear components of the MCF10A/MCF7 difference are not captured by . Part of this non-linear signal may reflect batch effects (MCF10A and MCF7 were processed in separate experiments), which a non-linear classifier can exploit. A non-linear generalization (e.g., an autoencoder-based embedding projected onto a one-dimensional axis) is a subject for future work.
5.4. Outlook
- Single-cell Hi-C — validation of at the single-cell level.
- Other species (mouse, Drosophila) — testing the universality of the parameter.
- RNA-seq integration — with expression features (LDA on genes), probing the link to transcription.
- 5–10 kb resolution — correct percolation analysis without the diagonal backbone.
- More lines at 40 kb — validation on independent isogenic pairs.
6. Conclusions
We have proposed a physical order parameter describing the folding trajectory of chromatin under MCF10A → MCF7 transformation. The parameter:
- shifts significantly on three chromosomes (, , –);
- is linearly uncorrelated with geometry ();
- is weakly linked to A/B with a sign flip (compartment reorientation);
- is robust to feature composition (CV ) and to the threshold.
complements the geometric metrics of the previous work [1] as an independent physical order parameter. Future work — validation on single-cell data, other species, and with RNA-seq integration.
References
- Timofeev, A. Scale-Dependent Concordance of Poincaré Embedding and TAD Hierarchy 2026. GitHub: https://github.com/andytimoffilim/TAD_Scale-DependentConcordancePoincare.
- Lieberman-Aiden, E.; et al. Comprehensive mapping of long-range interactions reveals folding principles of the human genome. Science 2009, 326, 289–293.
- Barutcu, A.R.; et al. Chromatin interaction analysis reveals changes in small chromosome and telomere clustering between epithelial and breast cancer cells. Genome Biology 2015, 16, 214. GSE66733.
- Rao, S.S.P.; et al. A 3D map of the human genome at kilobase resolution reveals principles of chromatin looping. Cell 2014, 159, 1665–1680. GSE63525.
- Bancaud, A.; et al. Molecular crowding affects diffusion and binding of nuclear proteins in heterochromatin and reveals the fractal nature of chromatin. EMBO Journal 2009, 28, 3785–3798.
Figure 1.
Percolation transition on chr17 (40 kb). (a) ; (b) . Peak of at .
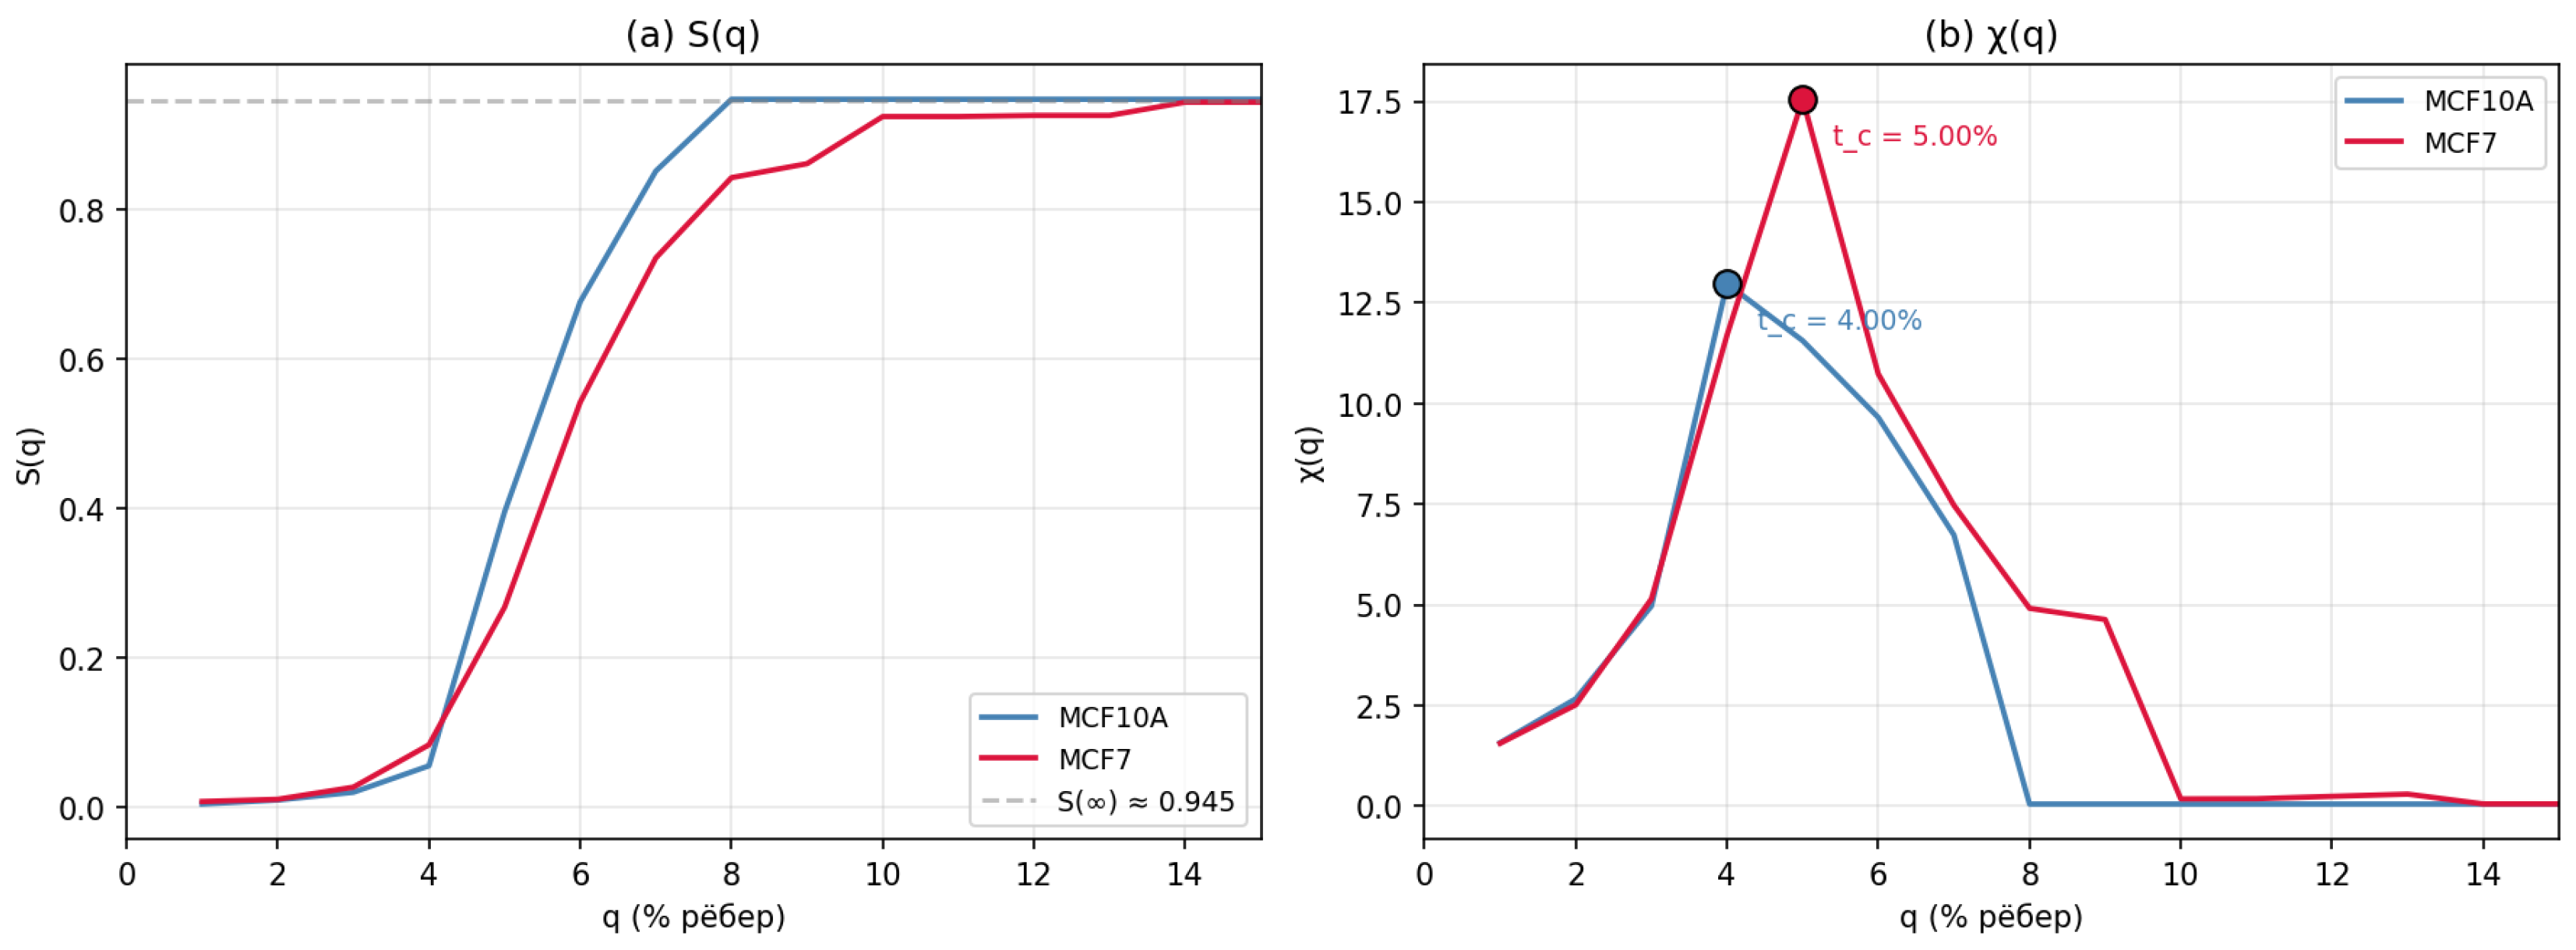
Figure 2.
Shift of under MCF10A → MCF7 transformation on three chromosomes. Error bars — bootstrap 95% CI.
Figure 2.
Shift of under MCF10A → MCF7 transformation on three chromosomes. Error bars — bootstrap 95% CI.
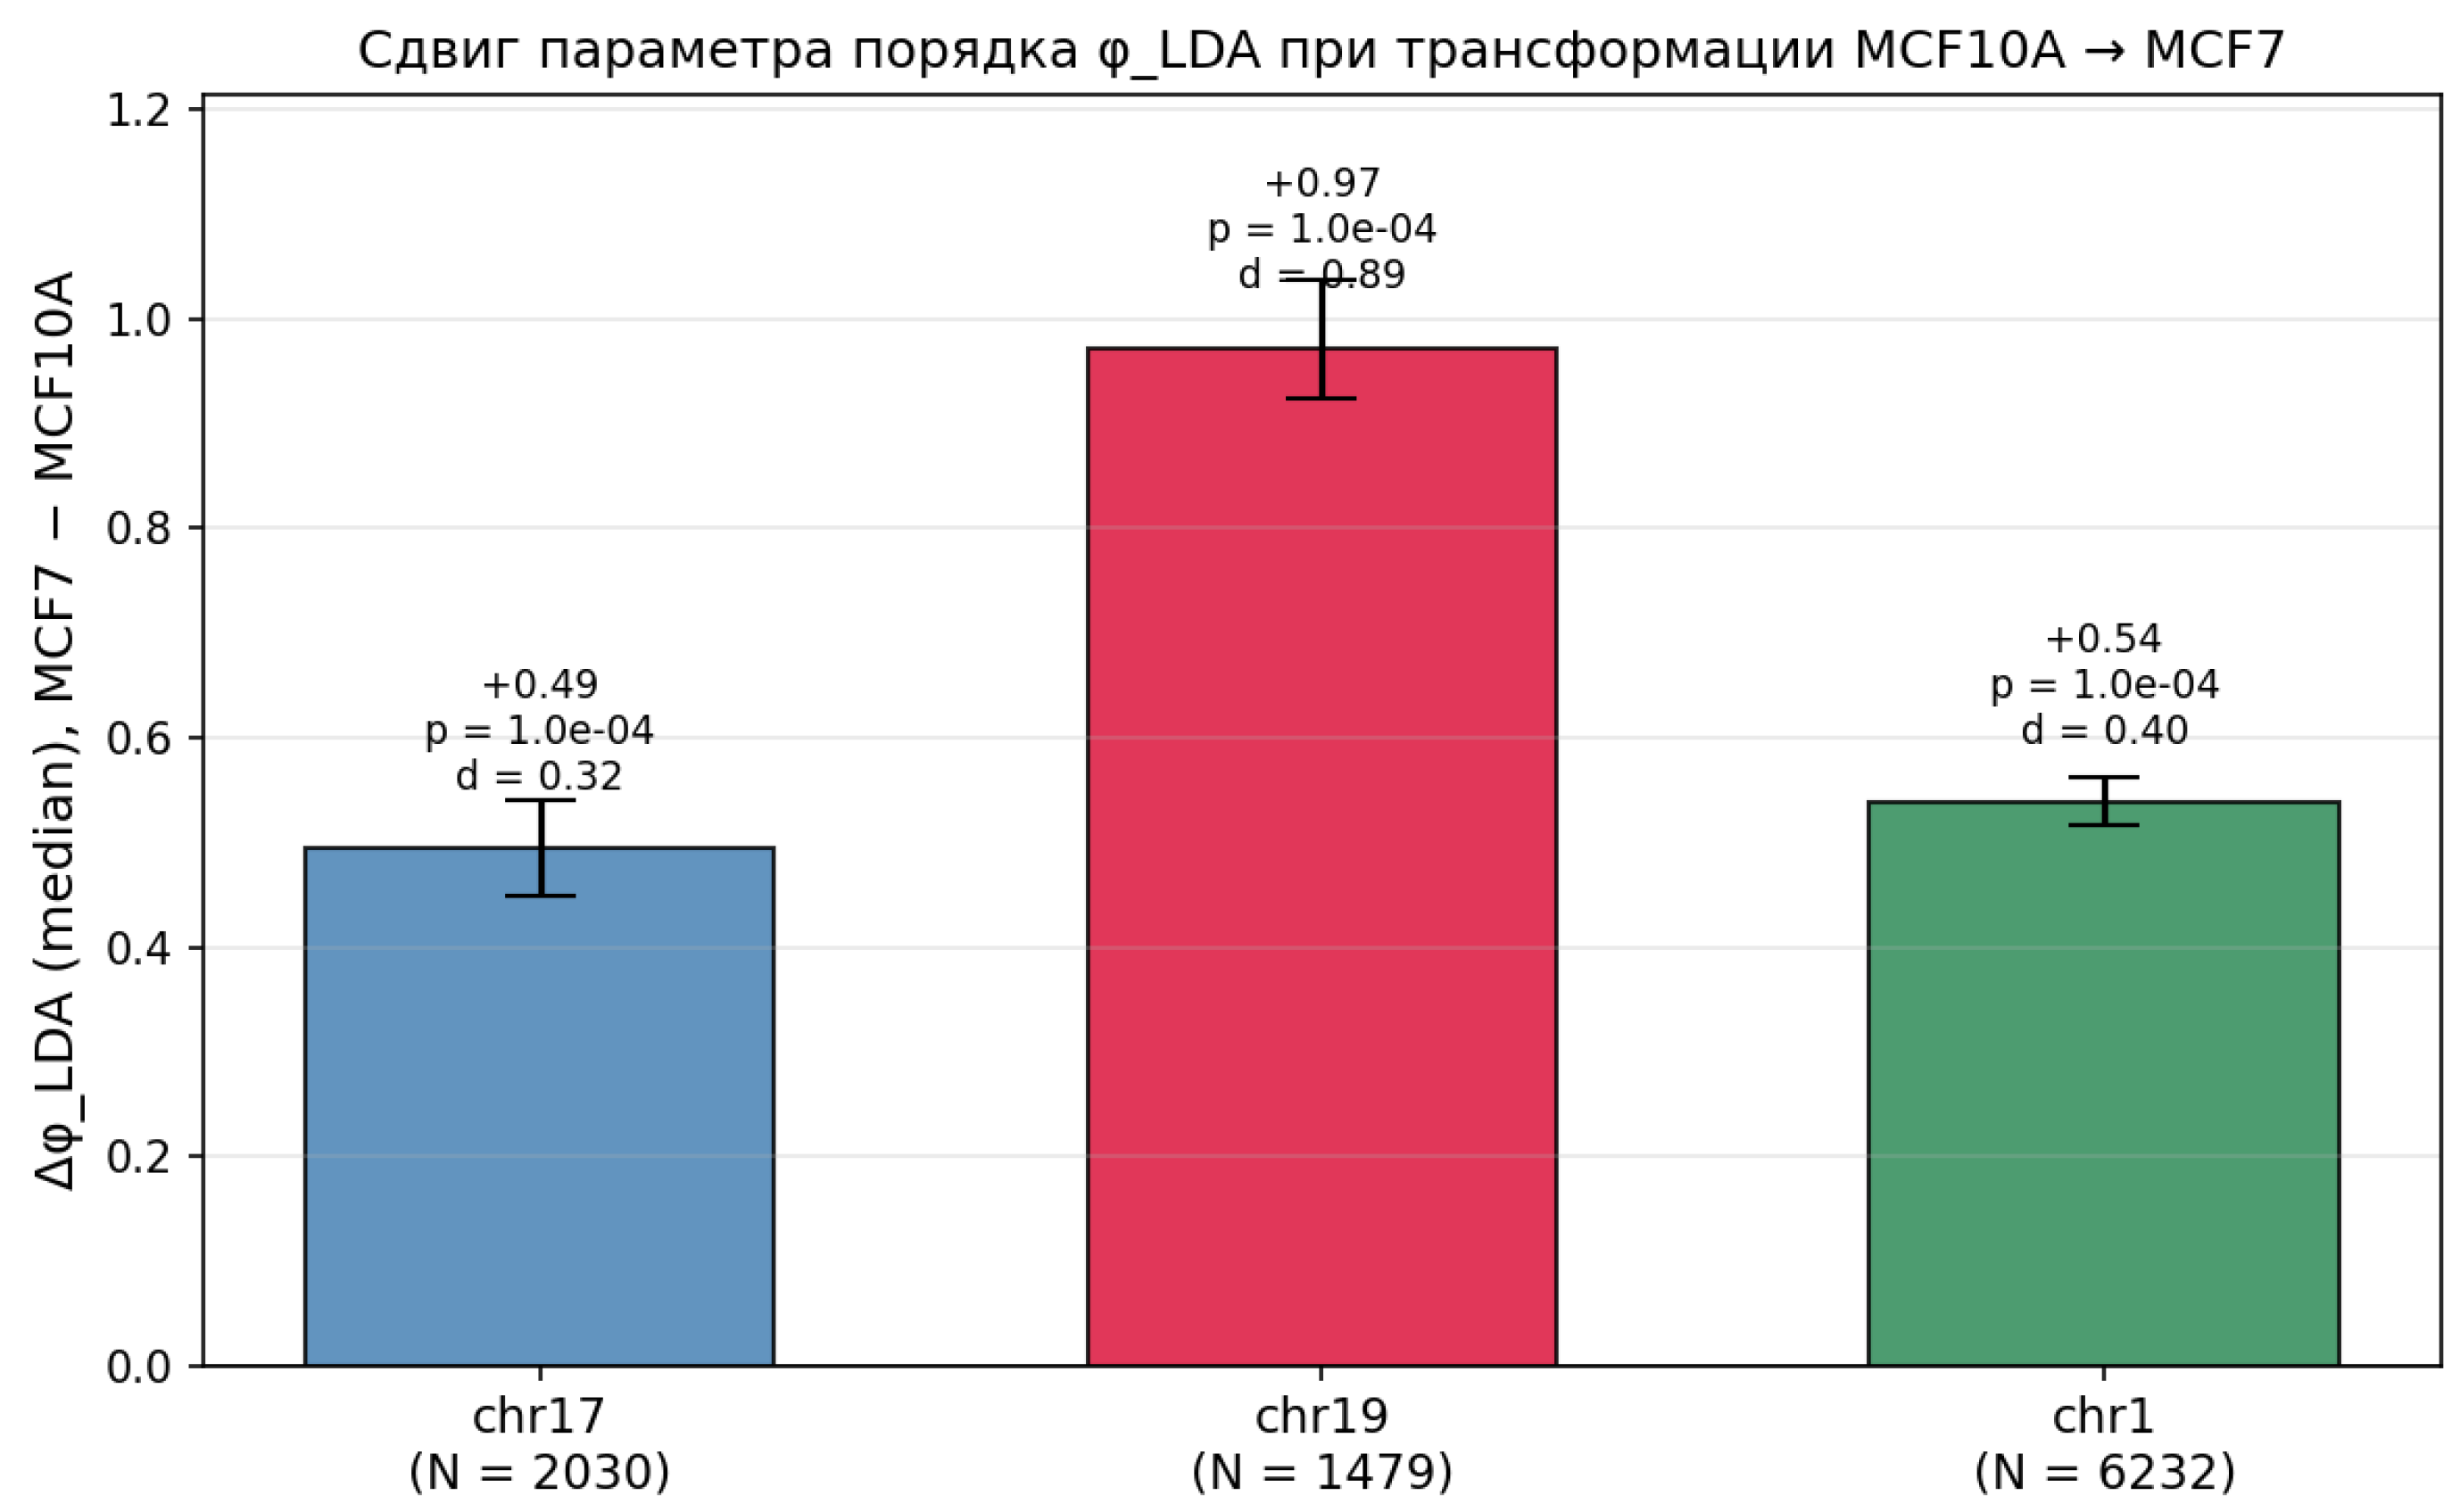
Figure 3.
(a) Linear uncorrelatedness of with geometry: . (b) Link to A/B compartments: , but the sign flips between lines.
Figure 3.
(a) Linear uncorrelatedness of with geometry: . (b) Link to A/B compartments: , but the sign flips between lines.
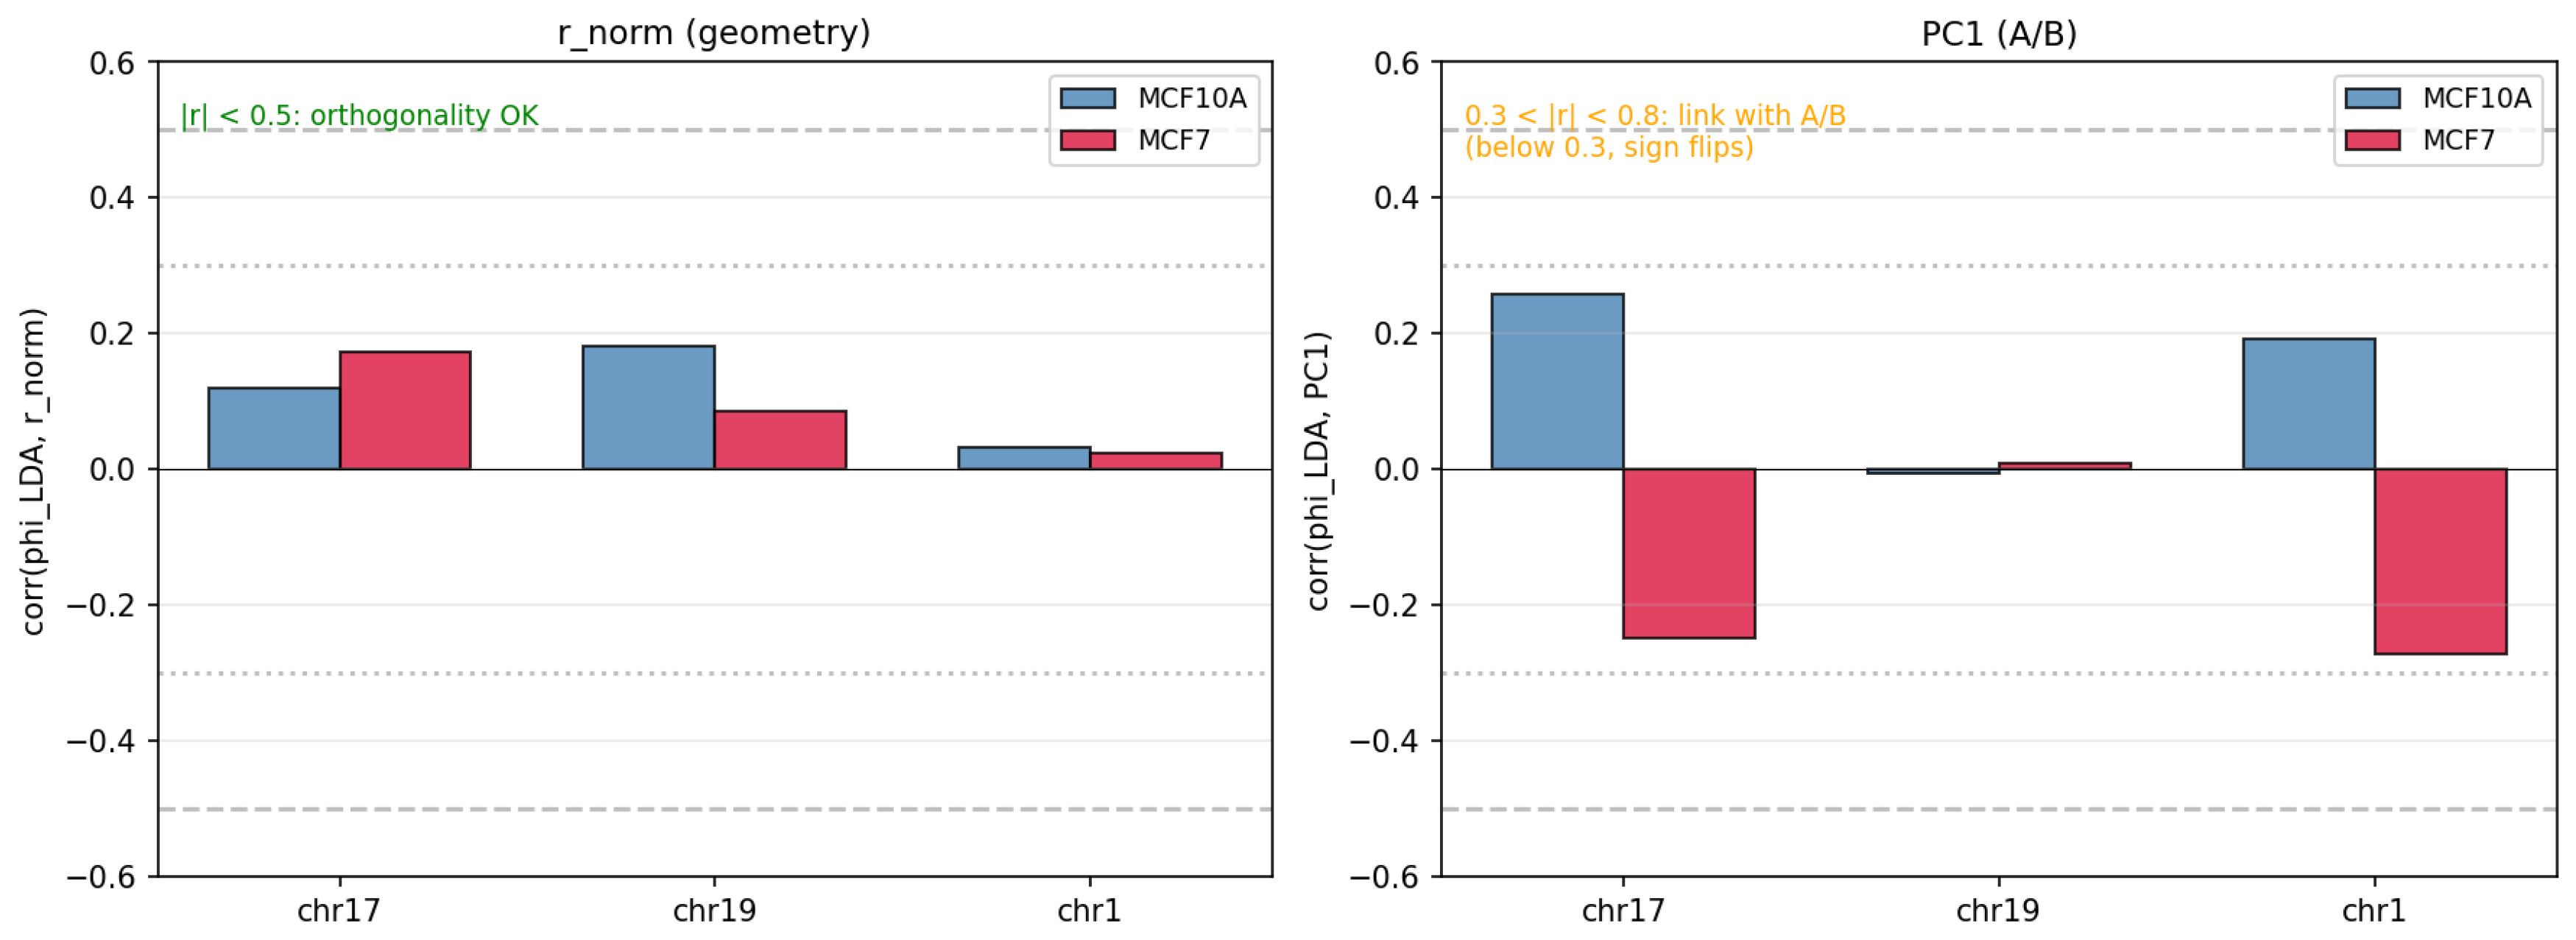
Table 1.
Shift of under MCF10A → MCF7 transformation.
| Chromosome | N | (mean) | (median) | 95% CI (median) | Cohen’s d |
| chr17 | 2030 | ||||
| chr19 | 1479 | ||||
| chr1 | 6232 |
Table 2.
Comparison of classifiers on the same four features (40 kb). AUC — 5-fold cross-validated ROC AUC. LDA and logistic regression yield almost identical projections (–); Random Forest achieves a higher AUC but does not yield a single interpretable axis.
Table 2.
Comparison of classifiers on the same four features (40 kb). AUC — 5-fold cross-validated ROC AUC. LDA and logistic regression yield almost identical projections (–); Random Forest achieves a higher AUC but does not yield a single interpretable axis.
| Chromosome | Method | AUC (5-fold CV) | (median) | Axis? | Interpretable? |
| chr17 | LDA | yes (1D) | yes (weights) | ||
| Logistic regression | yes (1D) | yes (weights) | |||
| Random Forest | — | no | no (importance) | ||
| chr19 | LDA | yes (1D) | yes (weights) | ||
| Logistic regression | yes (1D) | yes (weights) | |||
| Random Forest | — | no | no (importance) | ||
| chr1 | LDA | yes (1D) | yes (weights) | ||
| Logistic regression | yes (1D) | yes (weights) | |||
| Random Forest | — | no | no (importance) |
Table 4.
Projection of 8 GSE63525 lines (100 kb) onto the LDA axis trained on K562 (cancer) vs HMEC (normal). MCF10A/MCF7 (40 kb) are shown for reference. Lines are sorted by ; note that cancer (K562, KBM7) and normal lines are interleaved — the axis does not separate them.
Table 4.
Projection of 8 GSE63525 lines (100 kb) onto the LDA axis trained on K562 (cancer) vs HMEC (normal). MCF10A/MCF7 (40 kb) are shown for reference. Lines are sorted by ; note that cancer (K562, KBM7) and normal lines are interleaved — the axis does not separate them.
| Line | Type | (median) | Resolution |
| MCF10A | normal | 40 kb | |
| MCF7 | cancer | 40 kb | |
| GM12878 | normal | 100 kb | |
| KBM7 | cancer | 100 kb | |
| HUVEC | normal | 100 kb | |
| NHEK | normal | 100 kb | |
| K562 | cancer | 100 kb | |
| IMR90 | normal | 100 kb | |
| HMEC | normal | 100 kb | |
| 4DNF | normal | 100 kb |
Disclaimer/Publisher’s Note: The statements, opinions and data contained in all publications are solely those of the individual author(s) and contributor(s) and not of MDPI and/or the editor(s). MDPI and/or the editor(s) disclaim responsibility for any injury to people or property resulting from any ideas, methods, instructions or products referred to in the content. |
© 2026 by the authors. Licensee MDPI, Basel, Switzerland. This article is an open access article distributed under the terms and conditions of the Creative Commons Attribution (CC BY) license (http://creativecommons.org/licenses/by/4.0/).
Copyright: This open access article is published under a Creative Commons CC BY 4.0 license, which permit the free download, distribution, and reuse, provided that the author and preprint are cited in any reuse.