

Submitted:
14 November 2026
Posted:
17 November 2026
You are already at the latest version
Abstract
Despite the fact that manufacturing has been observed to be a force of productivity growth and structural change in developing economies, its performance in Zimbabwe has not been given due attention in the last decade with the exception of one or two anecdotal studies albeit in a qualitative manner. This study examines the sector’s contribution to the national output and constraints which affect it from 2014 to 2023. Using World Bank national-accounts data, the Confederation of Zimbabwe Industries (CZI) annual manufacturing survey, a structured literature synthesis and a structured questionnaire of the industry, we investigate manufacturing value added (MVA), capacity utilisation, employment and import dependence. MVA’s share of GDP was not a consistent trend, but was seen to be the lowest around 11% during 2017, highest around 21.5% during 2022, and lowest around 13.8% during 2023, with the sector’s poorest relative position corresponding to the 2019–2020 economic contraction. Since 2009, capacity utilisation has been between 32% and 57%, meaning there was 43.9% of the installed capacity that was not being used in 2022, and manufacturers import about 45% of their inputs, largely because they are not available domestically. The key constraints that are identified are the electricity supply of 1272 MW, compared to the demand of 2100 MW, the damage to transport and water infrastructure, the policy instability and exposure to exchange-rate movement. We do not believe that the problem is how big industry is in Zimbabwe, but how much of its capacity is being used and the depth of local input supply, as well as export competitiveness and policy predictability, and we begin to enlist a few priorities to address the manufacturing challenge in this country.
Keywords:
Zimbabwe
; manufacturing
; capacity utilisation
; value addition
; structural transformation
1. Introduction
Historically, late-industrialising economies have been able to increase productivity, redirect labour from low-productivity activities and expand their exports beyond primary commodities through manufacturing. Manufacturing is the path through which late-industrialising economies historically have expanded productivity, reallocate labour from low-productivity sectors, and diversify their export base away from primary commodities [1]. The sector in Zimbabwe has a high degree of economic integration with agricultural, mining and forestry outputs, and transforms them into foodstuffs and beverages, metal products, chemicals and transport equipment, among other products [2,3]. It has long been highlighted in the national policy debate as playing an important role in the employment, export revenues and diversification of the economy [4].
However, over a longer timeframe it’s been weaker in the sector’s position. According to [5] Zimbabwe has experienced extended deindustrialisation, a process of contraction in formal manufacturing and growth of informal trading, while firm-level evidence indicates that productivity has increased slowly over the last two decades of structural change [6]. This debate has been consistently hampered by the documentation of outdated production technology, which is not competitive in exports [7], and by the persistent infrastructure deficits and policy uncertainty, as well as the local supply of inputs and equipment not addressing the dependence on imported inputs and equipment [8]. The manufacturers also complained that buttressed by the cheaper imports, local products would not be able to penetrate the local market [9].
It is difficult to measure the contribution of the sector because of the structure of the national accounts. The industrial sector, which includes mining, manufacturing, construction, electricity, water and gas, increased its contribution to Zimbabwe’s GDP from approximately 23.7% in 2014 to over 40% by 2022, reflecting the growing importance of extractive industries, particularly mining [10]. The situation for manufacturing has been different, however, so its contribution can disguise its overall trend. Other sources also provide varying figures, with manufacturing accounting for 18.43% of GDP according to ZIMSTAT reporting, and about 15.7% based on World Bank reporting. Any assessment of any kind has to be clear on its source and definition of the data.
This paper has two purposes. First, it gives a uniform 10-year trend for the manufacturing sector’s contribution to economic activity as well as for the economy as a whole. Secondly, it connects this headline indicator with the operating facts behind it, such as capacity utilisation, employment dependence and import dependence, in the context of the CZI sector survey. Third, it converts the evidence into a prioritised policy agenda, with measurable indicators. The study has the following research questions:
- RQ1. Between the years 2014 and 2023, what has been the trend of the contribution of manufacturing to the Zimbabwean GDP?
- RQ2. Has the sector’s share changed compared with the overall performance?
- RQ3. What are some factors that limit the output and contribution of the sector and what do they suggest about policy?
2. Literature Review
2.1. Manufacturing, Growth and Structural Transformation
The case for manufacturing as an engine of growth is based on the Kaldorian argument that the sector has increasing returns, has the potential for technological advances and has strong linkages with other sectors [11]. Based on the evidence, [1] shows that industrialisation is still the key for catch-up in developing countries and demonstrates that the role of manufacturing as a growth engine has diminished over recent decades and is influenced by human capital. [12] Demonstrates that a considerable number of low-income countries are experiencing deindustrialisation at an income level lower than the previous industrialised countries. He calls this premature deindustrialisation. [13] Demonstrate that the shift of labour to more productive uses is a significant driver of regional variation in growth, and that this shift in Africa has not been strong enough in some cases.
There is mixed evidence for Africa. Evidence from selected African countries shows that manufacturing contributes to economic growth [14], and export-led growth strategies have been implemented, but with mixed results on its effect on manufacturing. The results suggest that how much a sector contributes is not as much a function of the presence of the sector as of its productivity, its internationalization and the policy context of the sector.
2.2. The Zimbabwean Context
The manufacturing sector in Zimbabwe is best understood in the context of the long spell of macroeconomic shocks that had undermined investment and diverted investment activity toward trading in the country, such as hyperinflation [5,15]. Three recurring themes in the Zimbabwean literature are the role of manufacturing in the economy, in employment generation and export earnings, and the policies that should be put in place to address the situation.
The sector is reported to be the second largest contributor to GDP, 18.43% of the ZWL 1.15 trillion economy at market prices in 2020. With regards to employment, the industry creates jobs directly and indirectly through raw-material suppliers, engineering services and transport, as well as demands for skills development [14]. Manufacturing diversifies exports away from primary commodities and increases export earnings [16], however, Zimbabwe has experienced an overall trade deficit in recent years as many raw materials are not being manufactured locally. The importation of concentrates is often cited as a case in point, as with the beverage industry.
2.3. Binding Constraints
Four sets of constraints are identified in the literature: infrastructure constraints (energy, transport, water and broadband), policy uncertainty, global market and exchange-rate exposure, and technological obsolescence [5,6,17]. The limiting factors are discussed empirically in this paper in terms of their impact on the outcome indicators of capacity utilisation and import dependence (see Section 4 and Section 5).
3. Data and Methods
3.1. Research Design
The study is descriptive, longitudinal, secondary data from the national accounts, and sector survey data and a structured literature synthesis. Capacity utilisation data have been analysed for the period 2014–2023 while the sub-sector employment indicators and imports are for the years 2021 and 2022, which is the period for which the CZI survey data were available to the authors.

Table 1.
Data Sources, Indicators and Analytical Approach.
| Research question | Indicator and source | Analytical approach |
| RQ1: trend in contribution | Manufacturing value added, % of GDP, 2014–2023 (World Bank, World Development Indicators) | Descriptive time-series analysis; identification of turning points |
| RQ2: relation to overall performance | GDP per capita growth, annual %, 2014–2023 (World Bank) | Visual and descriptive co-movement analysis |
| RQ3: constraints | Capacity utilisation 2009–2022; net employment and import dependence by sub-sector 2021–2022; reasons for importing (CZI, 2022) | Sub-sector comparison; frequency analysis |
| RQ3: constraints and policy | Peer-reviewed and grey literature; industry questionnaire | Thematic synthesis |
3.2. Industry Questionnaire
To supplement secondary data, an on-line questionnaire was sent to manufacturing practitioners. The results of the questionnaire are not used to estimate the contribution of the sector to GDP, but they are used as a check of the constraints identified in the literature.
3.3. Analytical Approach and Limits
The length of the series is not sufficiently long to conduct reliable inferential tests of the relationship between manufacturing and aggregate growth, e.g., cointegration or vector autoregression tests, with a 10-year observation period. The results are therefore shown in descriptive terms, and any relationships between series are discussed as co-movement, rather than causal relationships.
4. Results
4.1. Manufacturing’s Contribution to GDP and Economy
As indicated in Figure 1, the contribution of manufacturing to GDP did not increase or decrease steadily during the period of 2014 - 2023. The share declined from about 12.6% in 2014 to about 11.0% in 2017, recovered to about 15.7% by 2020, fell to about 12.5% in 2021, spiked to about 21.5% in 2022 and then returned to about 13.8% in 2023. It is an outlier in the decade, and its reversal in 2023 calls into question the meaning of structural expansion.
4.2. Capacity Utilisation
The capacity utilisation level has remained low and volatile (Figure 2). Across 2009–2022 it averaged 44.4% and ranged from 32.3% in 2009 to 57.2% in 2011. After the early peak, utilisation fell to the mid-30s in 2013–2015, recovered to between 45% and 48% in 2016–2018, dropped again to 36.4% in 2019, and reached 56.3% in 2021 and 56.1% in 2022. In 2022, 43.9% of installed capacity was idle, supporting the fact that the sector is running slightly above 50% utilization (CZI, 2022). The fact that utilisation is directly related to output means that the sector’s output is below the capacity of existing production facilities (without considering losses along the value chain).
This constitutes a pattern that is similar to a sector that is limited by operating conditions, not by the shortage of productive assets. The 2019 fall is concurrent with the 2019 macroeconomic contraction that is evident in Figure 1b, and the recovery in 2021–2022 is aligned with the aggregate economic recovery. Utilisation has never reached more than 57.2% at best.
4.3. Employment
Manufacturing’s net employment in 2021 and 2022 was positive for all manufacturing sub-sectors (Figure 3). The overall figure rose from 5% in 2021 to 13% in 2022. Gains were focused, with foodstuffs contributing 32% in 2022, compared with 1% in 2021, and paper, printing and publishing and chemicals also improving. Textiles and ginning declined from 18% in 2021 to 2% in 2022 while transport equipment decreased from 8% to 1%. The overall outlook is positive and reflects the growth of the sector and the economy over the period, however, the divergence in each sub-sector highlights that jobs are not created in equal proportions and are reliant upon conditions specific to each industry [8].
4.4. Import Dependence
Import dependence was high, and relatively constant, at 44% in 2021 and 45% in 2022 (Figure 4). It was highest in paper, printing and publishing (61%), other manufactured goods (59%) and chemicals and petroleum products (58%) and lowest in non-metallic mineral products (19%) and drinks and tobacco (20%). In some sectors, the dependence has decreased significantly over the two years, such as in non-metallic minerals (decrease from 45% to 19%), drinks and tobacco (decrease from 38% to 20%) and wood and furniture (decrease from 35% to 26%); in others, it has increased, particularly in metals (increase from 43% to 49%) and paper and printing (increase from 52% to 61%).
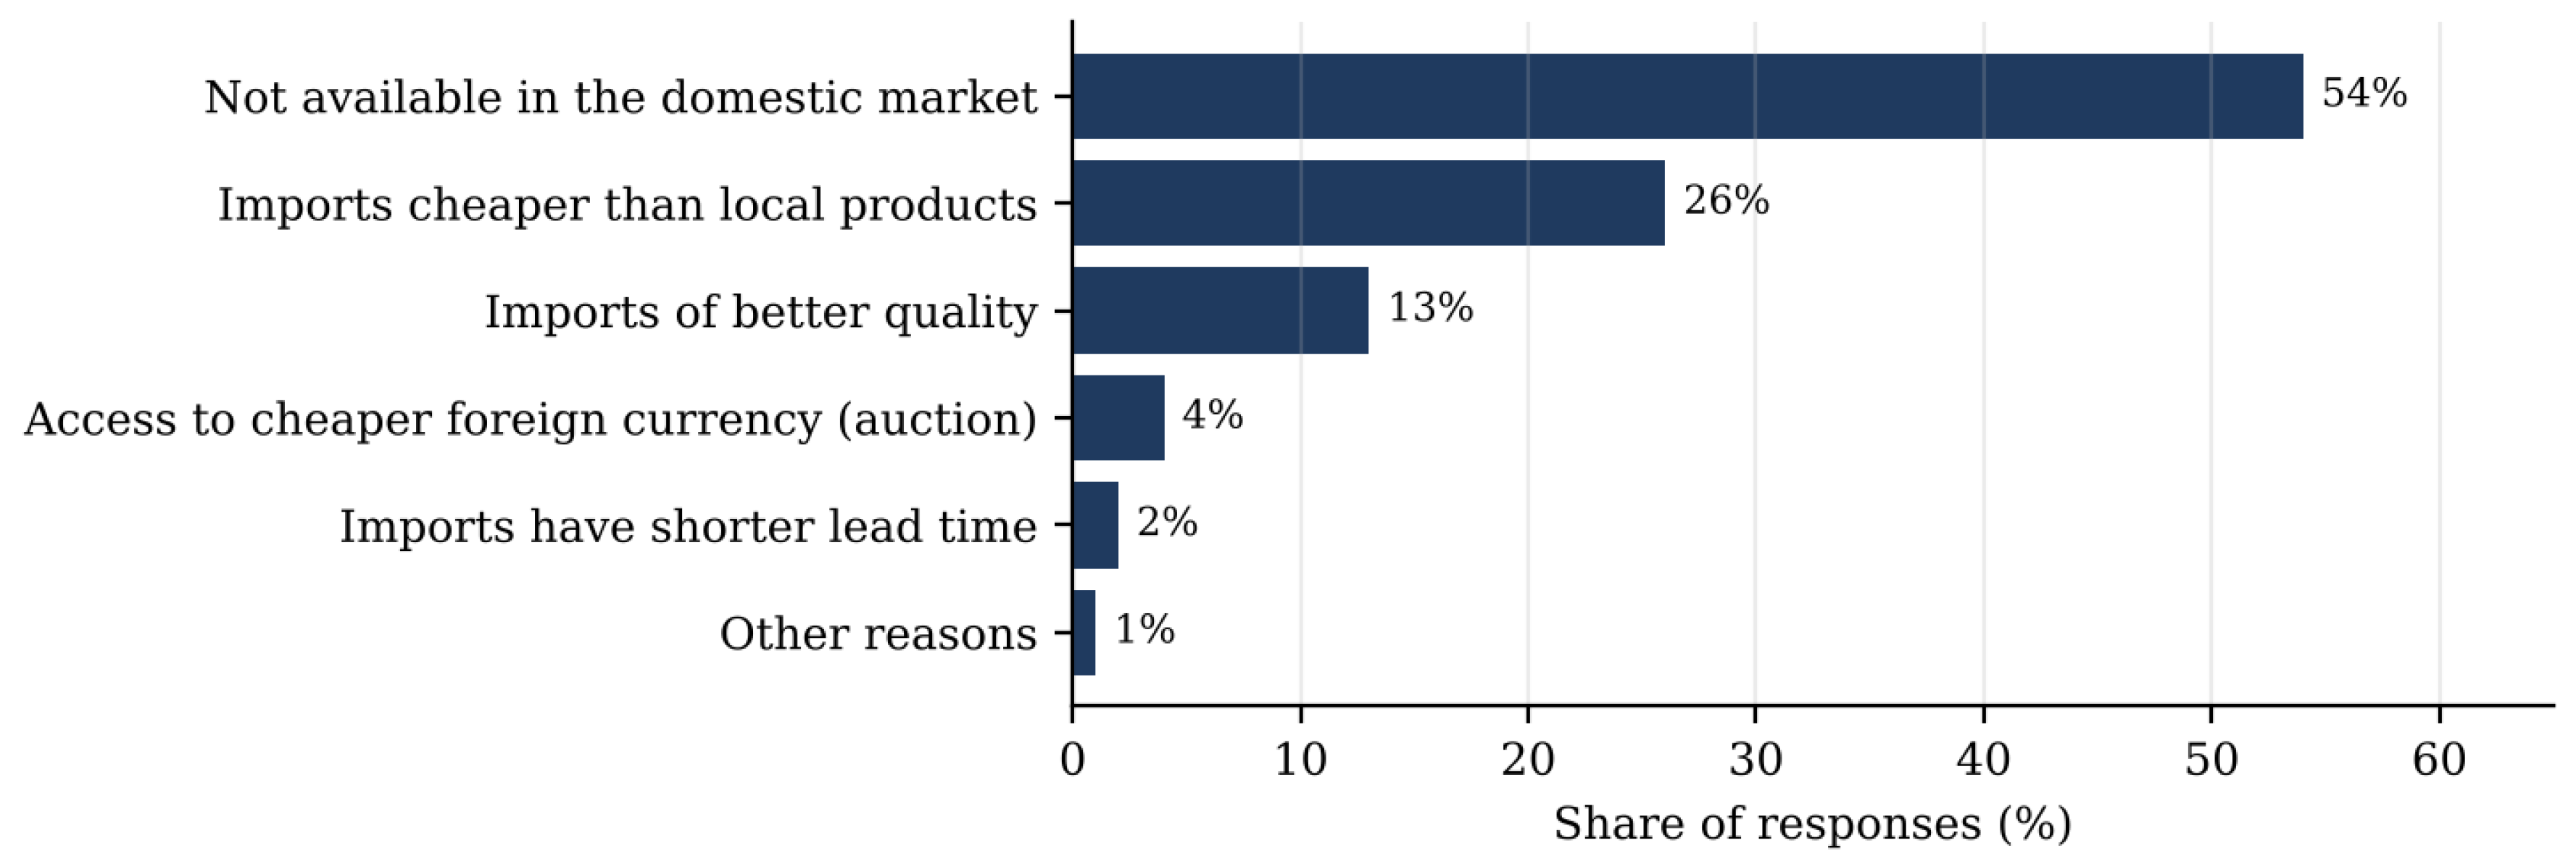
The principal motivations behind imports are related to a supply gap (Figure 5). Non-availability in the domestic market was cited as the reason for non-availability in 54% of the responses, followed by import price (26%) and import quality (13%). The rest is due to easier access to foreign currency in the auction system (4%), shorter lead times (2%) and other factors (1%). Combined, 39% of the responses relate to the competitiveness of local suppliers against imports in terms of price and/or quality, suggesting that a significant proportion of import dependency is due to the lack of competitiveness of local suppliers in relation to imports, and not to complete inability to produce locally. This aligns with industry concerns about increased competition from cheaper imports with local production, which may affect local consumption of locally made products [9].
5. Discussion: Why Underperforms the Sector Its Capacity
The findings suggest a sector with a medium size of GDP contribution, with substantial under use of plants and with high import dependency of inputs. This section explains these results in light of the constraints found in the literature.
5.1. Energy
The most obvious limitation is electricity. The Zimbabwe Power Company in the year 2024 reported a generation of 1,272 MW, whilst the requirement for generation had been put at 2,100 MW [18], which meant that available generation covered some 61% of the demand. Load shedding, which was a problem in the home, has become a problem in industry [17]. Alternatives are not installed at firms without them, and those which install them resort to using diesel generators which increases the overall cost of production, compared to utility-supplied power [17]. This mechanism directly relates the low utilisation observed in Figure 2 and the energy shortfalls.
5.2. Transport, Water and Digital Infrastructure
The poor condition of the transport infrastructure after the incapacitation of the National Railways of Zimbabwe and Air Zimbabwe has increased the cost of the industry and reduced its reach to remote customers [17]. Water storage infrastructure in Zimbabwe remains vulnerable. Much of the country’s water resources are linked to transboundary river basins shared with other SADC countries, making regional cooperation an important aspect of water management. The broader SADC region shares 15 major river basins, and approximately 70% of regional water resources across national boundaries. Furthermore, urban water systems face significant infrastructure challenges, including ageing and poorly maintained networks that affect the reliability of water service delivery. Recurrent droughts and changing rainfall patterns have reduced water availability in reservoirs and increased pressure on alternative sources such as boreholes, whose reliability may decline during prolonged dry periods [19]. The sector is technologically lagging behind South Africa and Botswana, with its broadband coverage concentrated in big towns and slow and expensive compared to regional costs and when Industry 4.0 technologies are gaining momentum [20].
5.3. Policy Uncertainty
Ambiguous and dynamic policy will increase planning and investment costs. Tariff and tax shocks have a negative impact on the functioning of firms and the credit supply by lenders [6], and past industrial policy was not successful in part because of its not being closely linked to the problems of firms. Some examples are the intermediated money transfer tax and the sugar levy that was included in the 2024 budget but was later cut after the industry raised concerns. Policy volatility decreases competitiveness with firms in more stable policy environments and makes long-term investment, which is necessary for manufacturing, less attractive.
5.4. Global Markets and Exposure to Exchange Rates, Assesses the Impact of Global Markets on Production and Employment
This volatility in world commodity prices and demand diminishes export revenues and increases profitability risks, and volatile raw material prices make pricing more difficult [5]. This will lead to an increase in the cost of imported inputs, which are about 45% of the total inputs used in the sector (Figure 4) and thus have a major effect on the sector’s local costs. The import dependence results therefore suggest that the import dependence is embedded in the cost structure of the sector and that input localisation would decrease this exposure.
5.5. Technological Obsolescence
Production using traditional methods of production reduces the competitiveness of exports to the international market [7]. Energy and input-cost disadvantages, along with this, account for much of the reason why 39% of respondents prefer imports because of quality and price (Figure 5): domestic suppliers are not only not present in some categories, but they are not competitive in others. To deal with this pressure, operational agility – the ability to be responsive to the demands of customers and markets, has been suggested as a way for Zimbabwean manufacturers to rise to the occasion [9].
6. Policy Implications
The evidence points to four priorities in a policy agenda (Table 3): Each priority is linked to an observed constraint and to an indicator which can be tracked by policymakers and industry.
Table 2.
Prioritised Action Agenda.
| Priority | Evidence | Policy instruments | Indicator to monitor |
| Industrial energy supply | Generation of 1,272 MW against 2,100 MW demand; diesel generation raises costs | Prioritise reliable supply for industrial users; modernise ageing plants; enable self-generation | Capacity utilisation; hours of supply lost |
| Input localisation | 54% of import reasons cite local non-availability; import dependence about 45% | Backward linkages with agriculture and mining; duty-free rebates on specific inputs not available locally (TheZimbabweMail, 2024) | Import dependence by sub-sector |
| Export competitiveness | Persistent import surplus; weak competitiveness of exports | Identify export drivers and diversify (Nyoni, 2019); export financing, loan guarantees and insurance; ‘Buy Zimbabwe’ procurement | Export earnings; MVA growth |
| Policy predictability and connectivity | Tax and regulatory changes deter investment; broadband expensive | Review tax rates and incentives for investment and exports; consult industry before changes; liberalise telecom licensing (African Development Bank, 2019) | Investment; broadband prices |
6.1. Industrial Policy and Trade
The policy for industrial development should be revised to highlight value addition, technology transfer and innovation as the basis for achieving competitive output out of capacity. Tax policy needs to be revised to promote investment and exports, while trade policy should aim to enter into agreements that help to expand regional and international markets. In the short run, the capacity utilisation would be enhanced if there were relaxation of the rebate regime to allow duty free importation of specific inputs to the industry as the industry is scaled up locally.
6.2. Export Growth
To correct persistent current account deficits, export drivers and an export diversification should be properly identified. Export financing such as export loans and guarantees, as well as export insurance cover, would reduce risks which are a barrier to firms to export. The ‘Buy Zimbabwe’ procurement process would ensure that the government tenders are awarded to the local producers in order to promote local manufacturing.
6.3. Infrastructure Investment
Zimbabwe is generating electricity from both its own and imports, and electricity wastage is high due to the use of old equipment in the power plants resulting in imports filling the gap [17]. The first order infrastructure priority, then, is investment in generation, and in industrial supply reliability. Telecommunications: The domestic telecommunications market would be opened by eliminating restrictions on network licences, allowing new players to enter and enabling operators to purchase/sell backbone services, resulting in traffic consolidation, incentives to upgrade to fibre and reductions in costs.
7. Limitations and Directions for Future Research
The results are subject to a number of caveats. First, the series are short and the sub-sector indicators span only two years; thus, the analysis is descriptive, and cannot be used to make causal statements. Second, the data on national accounts are subject to revisions and vary from source to source as exemplified by the differences between ZIMSTAT and World Bank data. Third, the data in the CZI are just for the firms that have responded and may not be representative of the sector; any sub-sector measure should be read as reported. Third, the constraints are derived from the literature and from the survey, rather than estimated, and so the relative magnitudes of these constraints are unknown.
The research should be continued on the same lines by using the entire World Development Indicators and ZIMSTAT, and estimating the relationship between manufacturing and aggregate growth through ARDL and vector autoregression model. A firm level panel data set would enable the direct estimation of the effect of energy shortages and dependence on energy imports on productivity and constant price series would help eliminate price effects in high inflation.
The impact of technological development and implementation of the concept of Industry 4.0 on manufacturing productivity and overall industrial development should also be investigated. This is especially relevant in developing countries like Zimbabwe, where manufacturing companies still grapple with digital transformation challenges of infrastructure, finance, and skills [21].
At the operational level, improving energy efficiency through manufacturing process optimisation also presents an important avenue for strengthening industrial productivity. Research on energy-use optimisation in CNC machining demonstrates the relevance of integrating energy considerations into manufacturing process planning [22].
8. Conclusion
Manufacturing accounted for 11% – 21.5% of Zimbabwe’s GDP during 2014 – 2023 with no discernible trend; the sector still provides a lot of employment and is a future potential export base for export diversification. Perhaps more importantly, the sector is not performing at capacity: the capacity utilisation rate has been below 57.2% since 2009 and the reliance of approximately 45% on imports means that companies are exposed to exchange-rate and supply risks. What is happening is in line with binding infrastructure, policy and technology constraints, the most pressing of which is the electricity shortage.
Therefore the challenge isn’t so much about generating more capacity, but rather about leveraging existing capacity and developing local supply. The main thrust of the agenda outlined here is reliable, industrial power, localised inputs, export financing and predictable policy. To do so would enable manufacturing to play a bigger role in employment, export revenues and inclusive growth and would prevent Zimbabwe from premature deindustrialisation that has been observed in other parts of the region.
References
- Szirmai; Verspagen, B. Manufacturing and economic growth in developing countries, 1950-2005. Struct. Change Econ. Dyn. 2015, vol. 34, 46–59. [Google Scholar] [CrossRef]
- Mani, M.; Lyons, K.W.; Gupta, S.K.; Vachtsevanos, G.; Wang, S.; Feng, S.C.; Narita, H. Sustainability characterisation for manufacturing processes. Int. J. Prod. Res. 2014, vol. 52(no. 20), 5895–5912. [Google Scholar] [CrossRef]
- Machado, G.; Winroth, M.P.; Carlsson, D.; Almström, P.; Centerholt, V.; Halin, M. Sustainable manufacturing in Industry 4.0: An Emerging Research Agenda. Int. J. Prod. Res. 2020, vol. 58(no. 5), 1462–1484. [Google Scholar] [CrossRef]
- Zimwara; Mbowa, C. CHALLENGES OF IMPLEMENTING WORLD CLASS MANUFACTURING TECHNIQUES IN ZIMBABWE. Zimb. J. Sci. Technol. 2015, vol. 10(no. 1), 152–162. [Google Scholar]
- Mlambo, S. From an industrial powerhouse to a nation of vendors: Over two decades of economic decline and deindustrialization in Zimbabwe, 1990–2015. J. Dev. Soc. 2017, 33, 99–125. [Google Scholar]
- Oostendorp, R.; Davies, R.; Rankin, N. Productivity Under Twenty Years of Structural Change in Zimbabwe’s Manufacturing Sector. GLM|LIC Policy Brief No. 28; IZA Institute of Labor Economics: Bonn; 2018.
- Siwadi, P.; Pelser, T. Developing Technological Capabilities to Resuscitate the Zimbabwean Manufacturing Sector; Mombasa, 2012. [Google Scholar]
- CZI. CZI Annual Manufacturing Sector Survey; Confederation of Zimbabwe Industries: Harare, 2022. [Google Scholar]
- Muhla, T.; Mapindu, I.; Munyau, M.; Mashava, D.; Mhlanga, S.; Goriwondo, W. Agility as a Strategy in Zimbabwean Manufacturing Industries. Zimb. J. Sci. Technol. 2024, vol. 18(no. 1), 1–11. [Google Scholar]
- World Bank. Industry (including construction) value added (% of GDP) - Zimbabwe. 2024. [Google Scholar]
- Kaldor, N. Causes of the Slow Rate of Economic Growth of the United Kingdom; Cambridge University Press: Cambridge, 1966. [Google Scholar]
- Rodrik. Premature Deindustrialisation. J. Econ. Growth 2016, vol. 21(no. 1), 1–33. [Google Scholar]
- McMillan, M.S.; Rodrik, D. Globalisation, Structural Change and Productivity Growth; NBER Working Paper No. 17143; National Bureau of Economic Research: Cambridge, 2011. [Google Scholar]
- Moyo, C.; Jeke, L. Manufacturing Sector and Economic Growth: A Panel Study of Selected African Countries. J. Bus. Econ. Rev. 2019, vol. 4(no. 3), 114–128. [Google Scholar] [CrossRef]
- Chidakwa; Chigumira, G. Pre-Crisis Macroeconomic Performance and Triggers of the Economic Crisis in Zimbabwe. In Economic Management in a Hyperinflationary Environment: The Political Economy of ZImbabwe, 1980-2008; Kararach, G., Otieno, R., Eds.; Oxford University Press: Oxford, 2020. [Google Scholar]
- Coad; Vezzani, A. Manufacturing the future: Is the manufacturing sector a driver of R&D, exports and productivity growth? JRC Working Papers on Corporate R&D and Innovation No. 06/2017, 2017; European Commission Joint Research Centre: Seville. [Google Scholar]
- Bonga, W.G.; Sithole, R. Problematic Infrastructure Factors Affecting Development in the 21st Century for Zimbabwe. World J. Econ. Financ. 2020, vol. 6(no. 1), 140–149. [Google Scholar]
- ZPC. “Generation Statistics,” 2024. Available online: https://zpc.co.zw (accessed on 23 July 2025).
- Mutandwa, H.; Vyas-Doorgapersad, S. The State of Water Infrastructure Development in Zimbabwe. Afr. J. Gov. Dev. 2023, vol. 12(no. 2), 40–57. [Google Scholar] [CrossRef]
- Mazikana, T. The Impact of Quality Service and Customer Satisfaction on Consumer Purchasing Decisions in Zimbabwe Telecommunications Industry; University of Zimbabwe: Harare, 2020. [Google Scholar]
- Muhla, T.M.; Mashava, D.; Kanyemba, G.; Mapindu, I.; Goriwondo, W.M. An Assessment of the Implementation of Industry 4.0 in Zimbabwean Manufacturing Industries. World J. Adv. Eng. Technol. Sci. 2025, vol. 15(no. 2), 970–984. [Google Scholar] [CrossRef]
- Tayisepi, N.; Mugwagwa, L.; Munyau, M.; Muhla, T.M. Integrated Energy Use Optimisation and Cutting Parameter Prediction Model - Aiding Process Planning of Ti6AI4V Machining on the CNC Lathe. J. Eng. Res. Rep. 2023, vol. 25(no. 10), 226–242. [Google Scholar] [CrossRef]
Figure 1.
(a) Manufacturing value added as a percentage of GDP and (b) GDP per capita growth, Zimbabwe, 2014–2023. Panel (b) shows that economic performance was weak in 2014–2016, recovered modestly in 2017–2018, contracted sharply in 2019 and 2020 (about −8.2% and −9.7%) and rebounded in 2021–2023. The co-movement of the two series is informative but not uniform. The share of manufacturing decreased in 2021 as production was recovering, and increased in 2020 as production declined most significantly. A share is a relative measure, it may increase if other sectors decrease in relative terms or if the relative prices and exchange-rate valuation change in a high-inflation economy. This is part of the reason that the 2022 increase may have been due to these factors, though the present data does not confirm this. The reason for the supplementary indicators below is the fact that the proportion of GDP is an unreliable gauge of manufacturing performance in Zimbabwe on its own.
Figure 1.
(a) Manufacturing value added as a percentage of GDP and (b) GDP per capita growth, Zimbabwe, 2014–2023. Panel (b) shows that economic performance was weak in 2014–2016, recovered modestly in 2017–2018, contracted sharply in 2019 and 2020 (about −8.2% and −9.7%) and rebounded in 2021–2023. The co-movement of the two series is informative but not uniform. The share of manufacturing decreased in 2021 as production was recovering, and increased in 2020 as production declined most significantly. A share is a relative measure, it may increase if other sectors decrease in relative terms or if the relative prices and exchange-rate valuation change in a high-inflation economy. This is part of the reason that the 2022 increase may have been due to these factors, though the present data does not confirm this. The reason for the supplementary indicators below is the fact that the proportion of GDP is an unreliable gauge of manufacturing performance in Zimbabwe on its own.
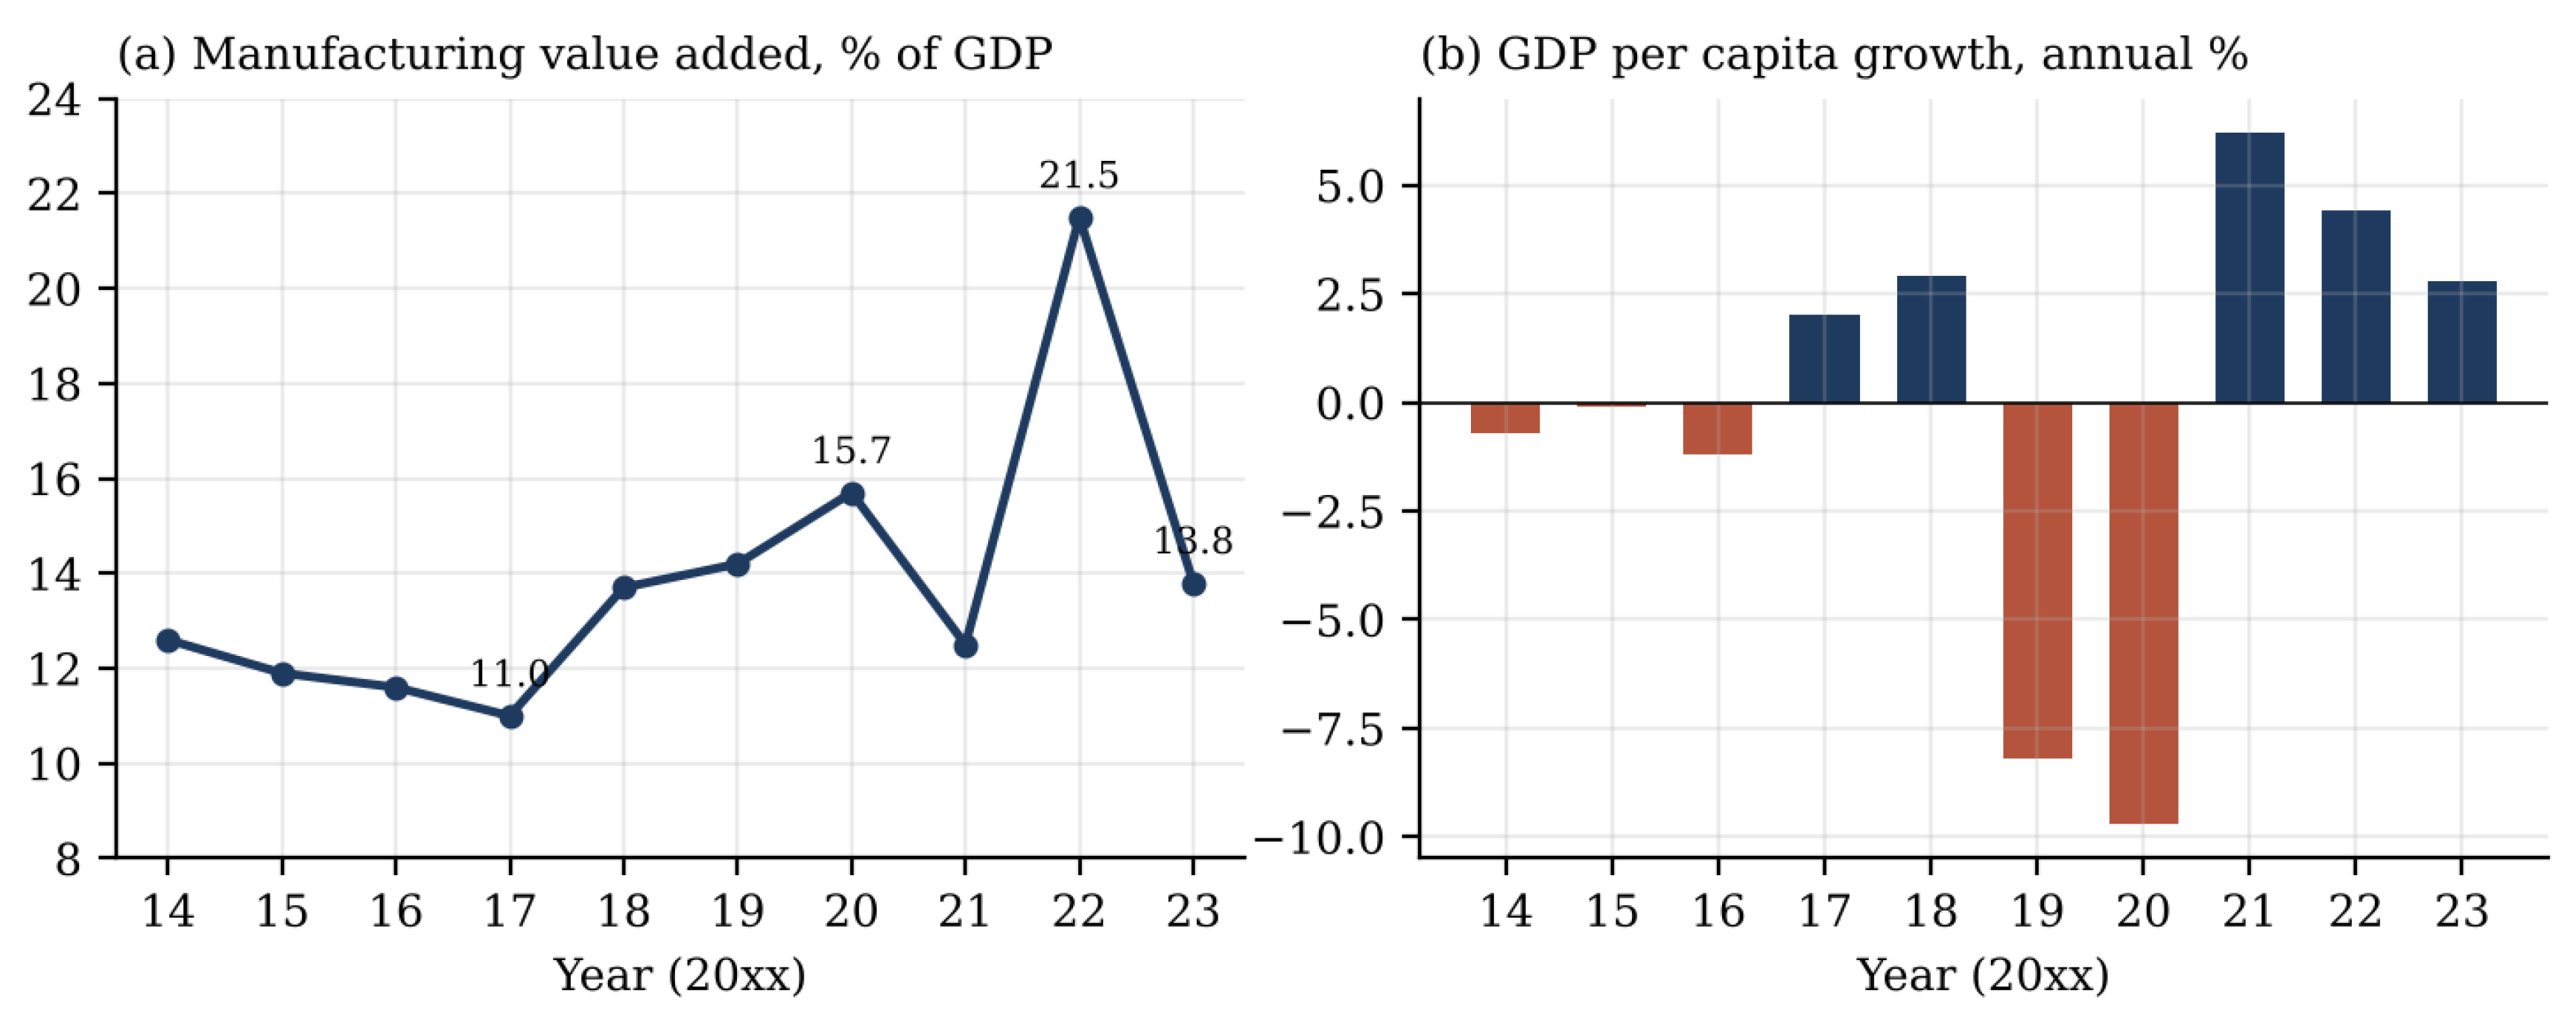
Figure 2.
Manufacturing Capacity Utilisation, Zimbabwe, 2009-2022.
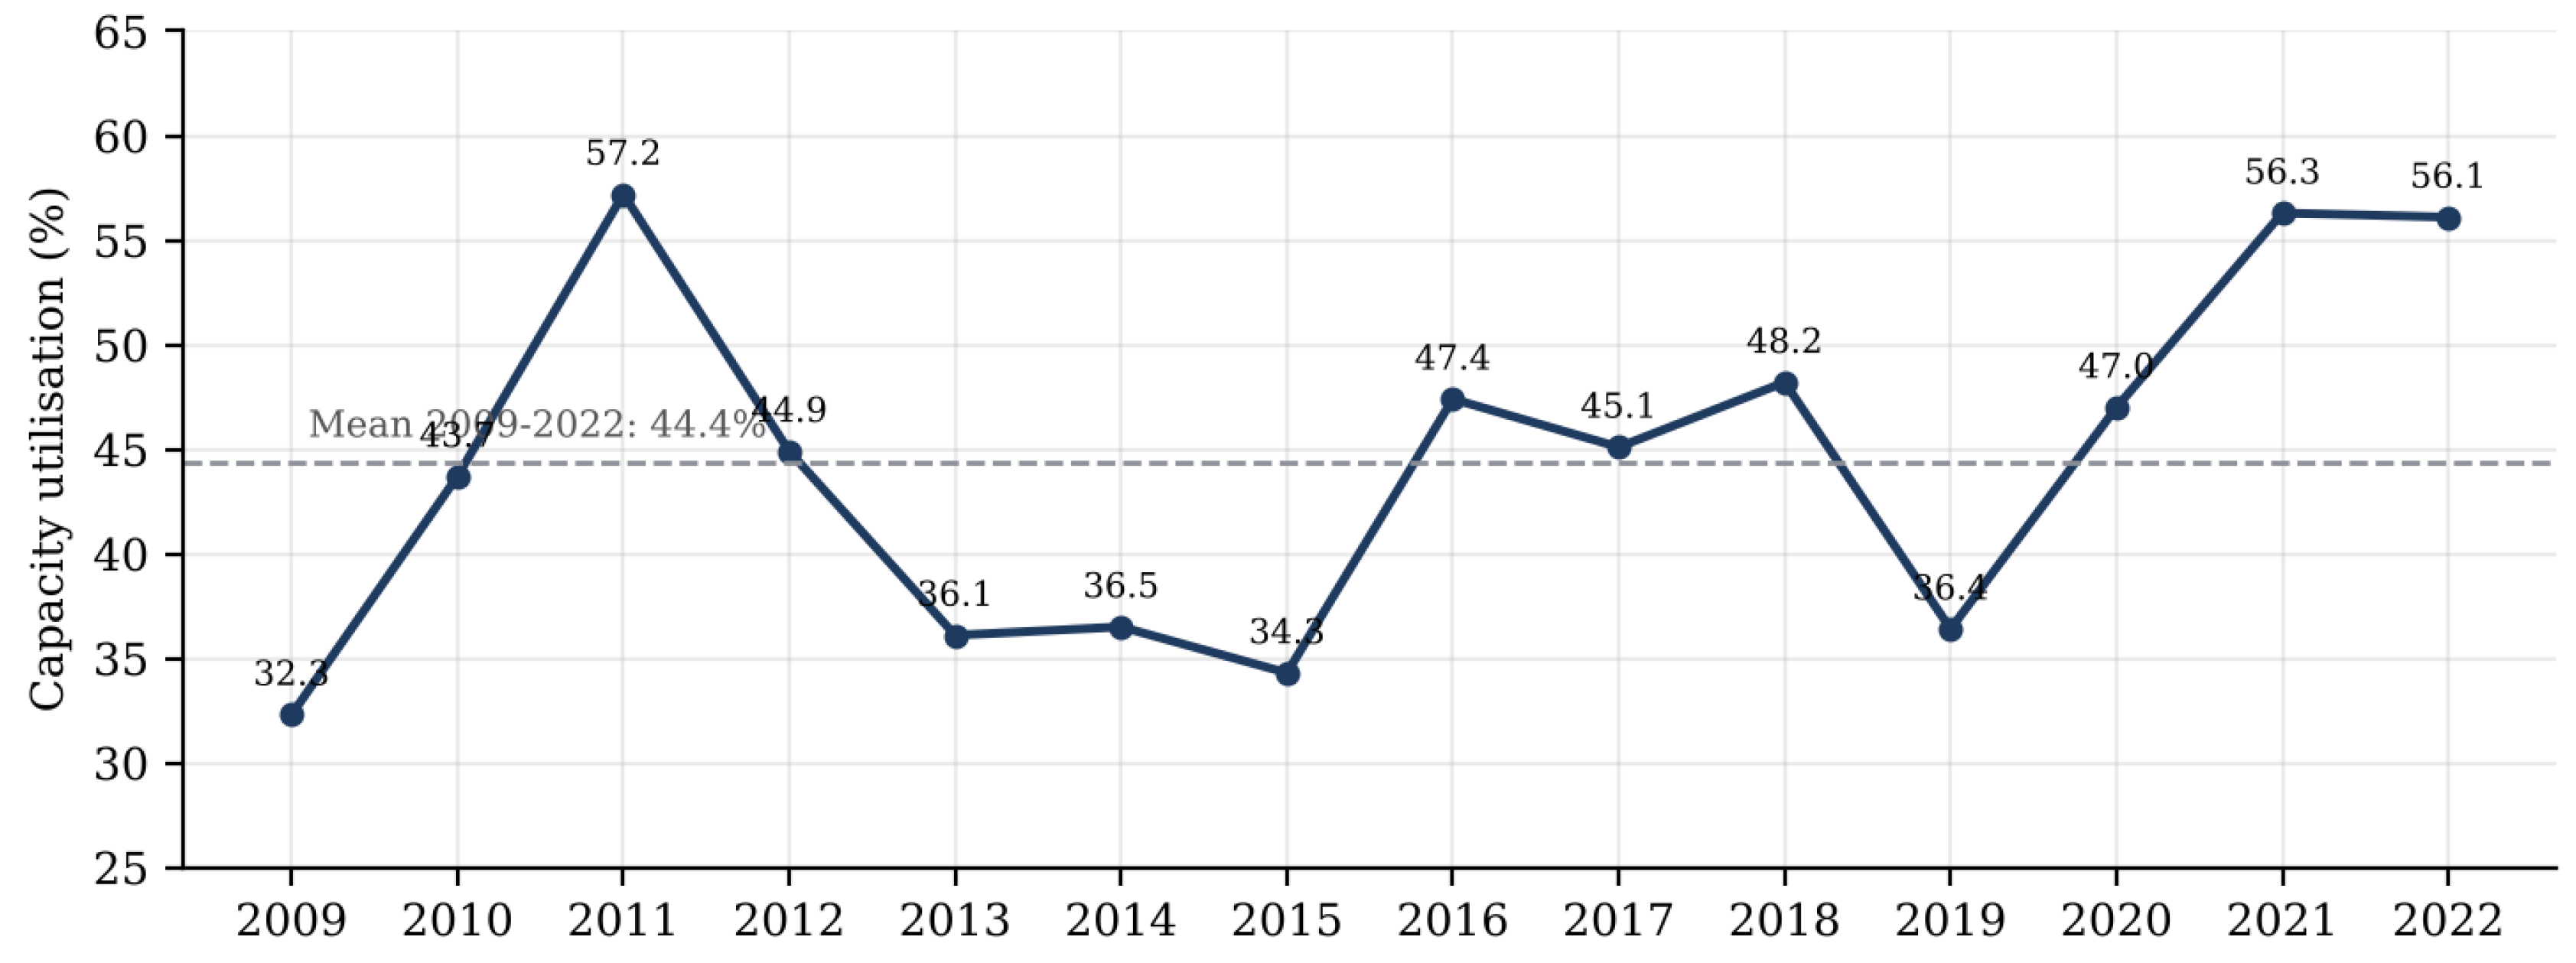
Figure 3.
Net Employment by Manufacturing Sub-Sector, [8].
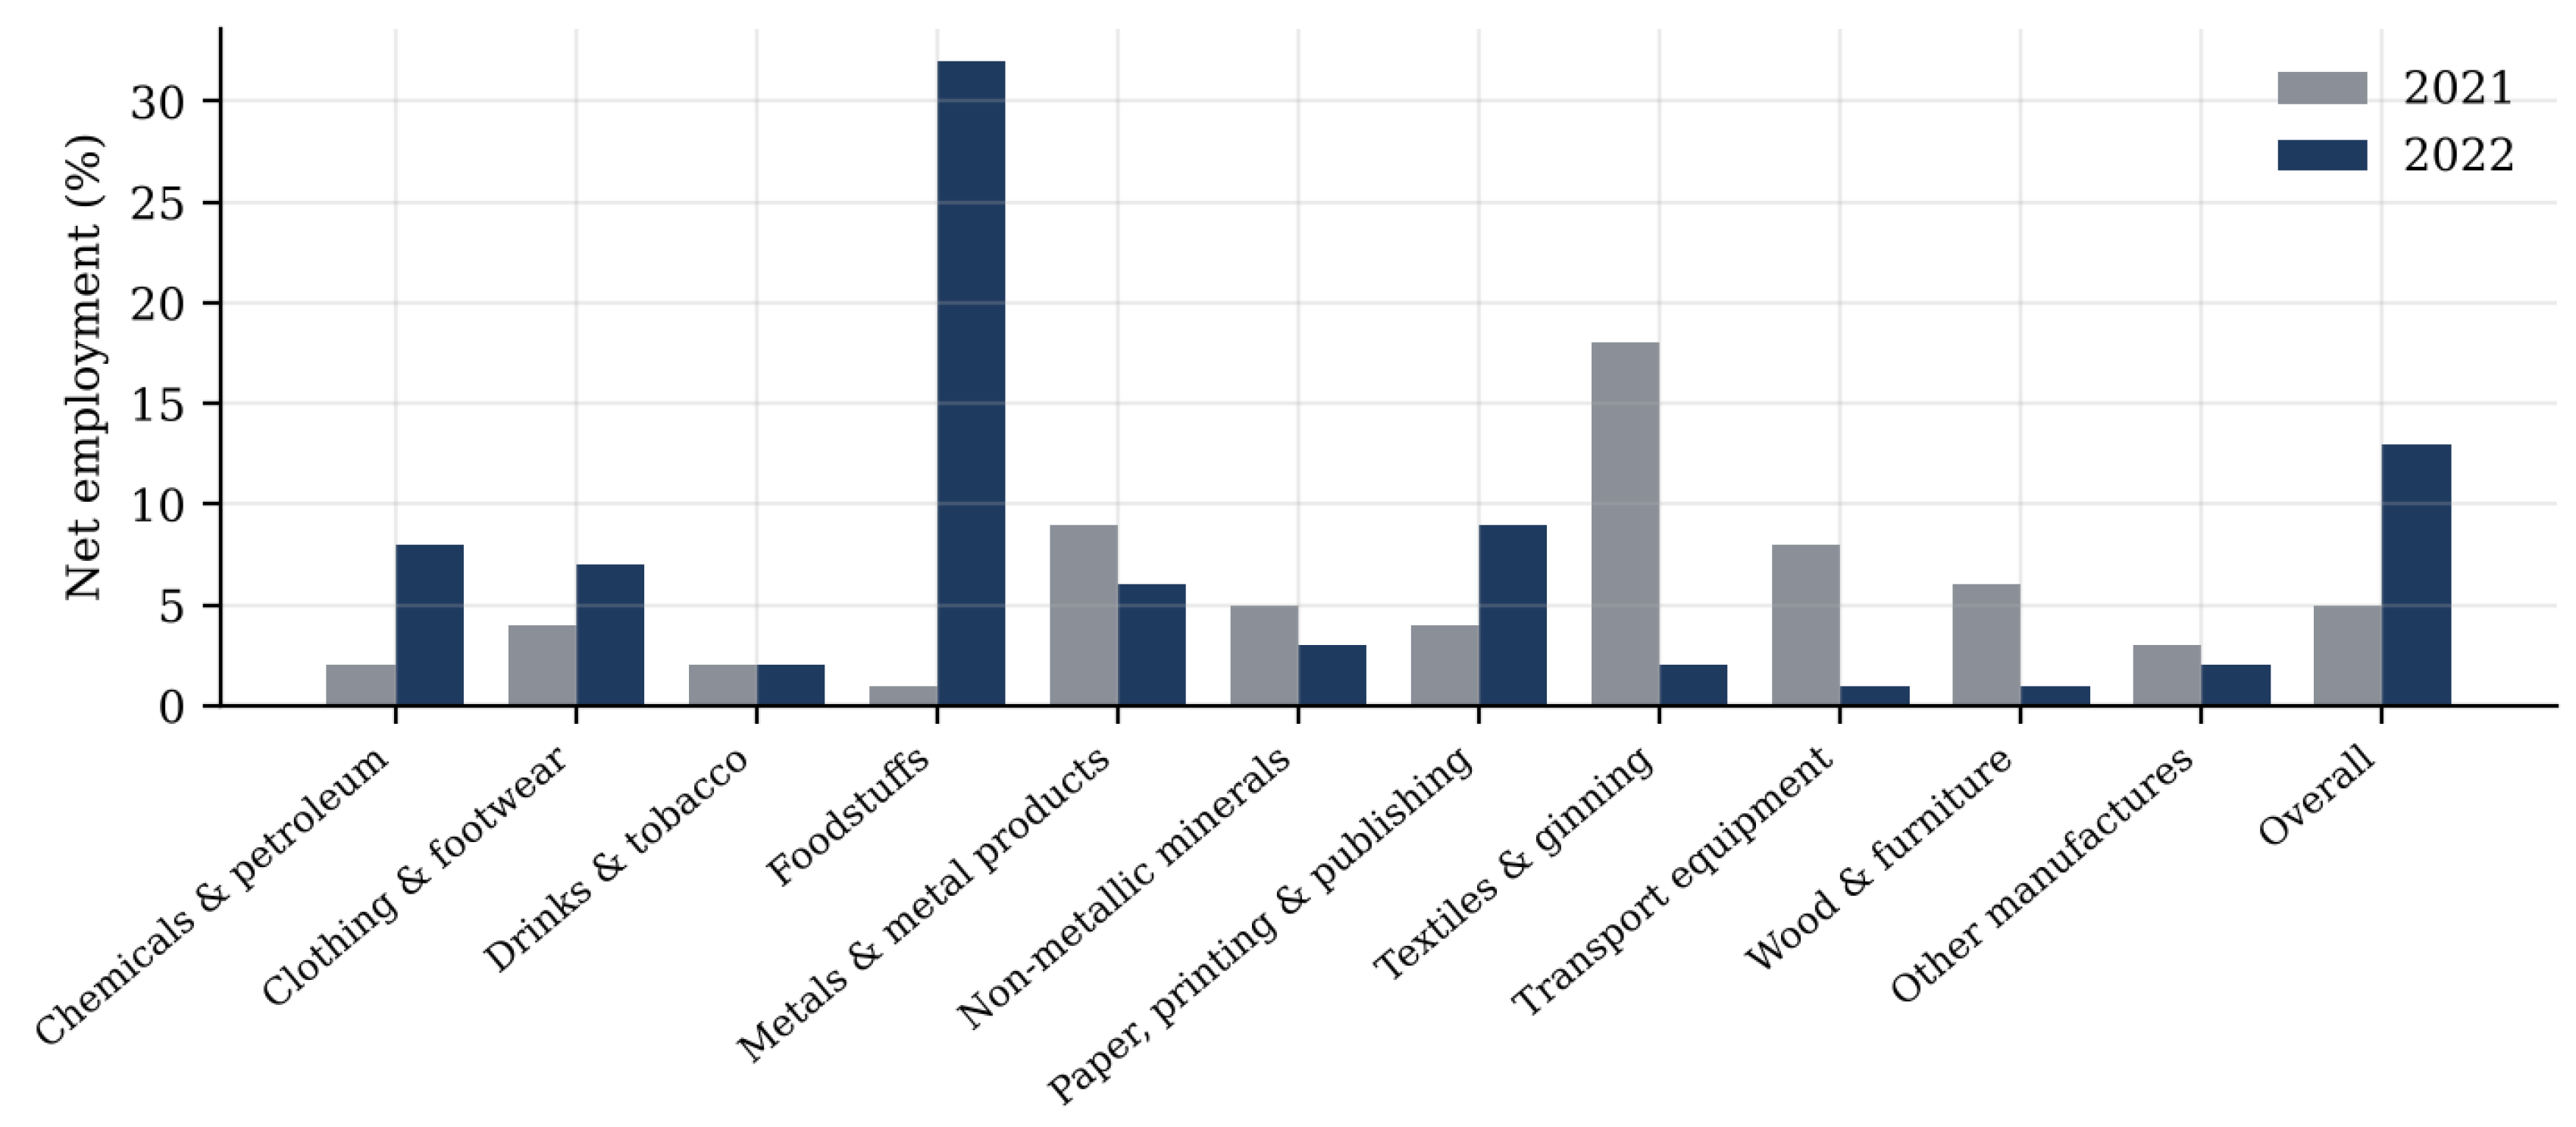
Figure 4.
Import Dependence by Manufacturing Sub-Sector, [8].
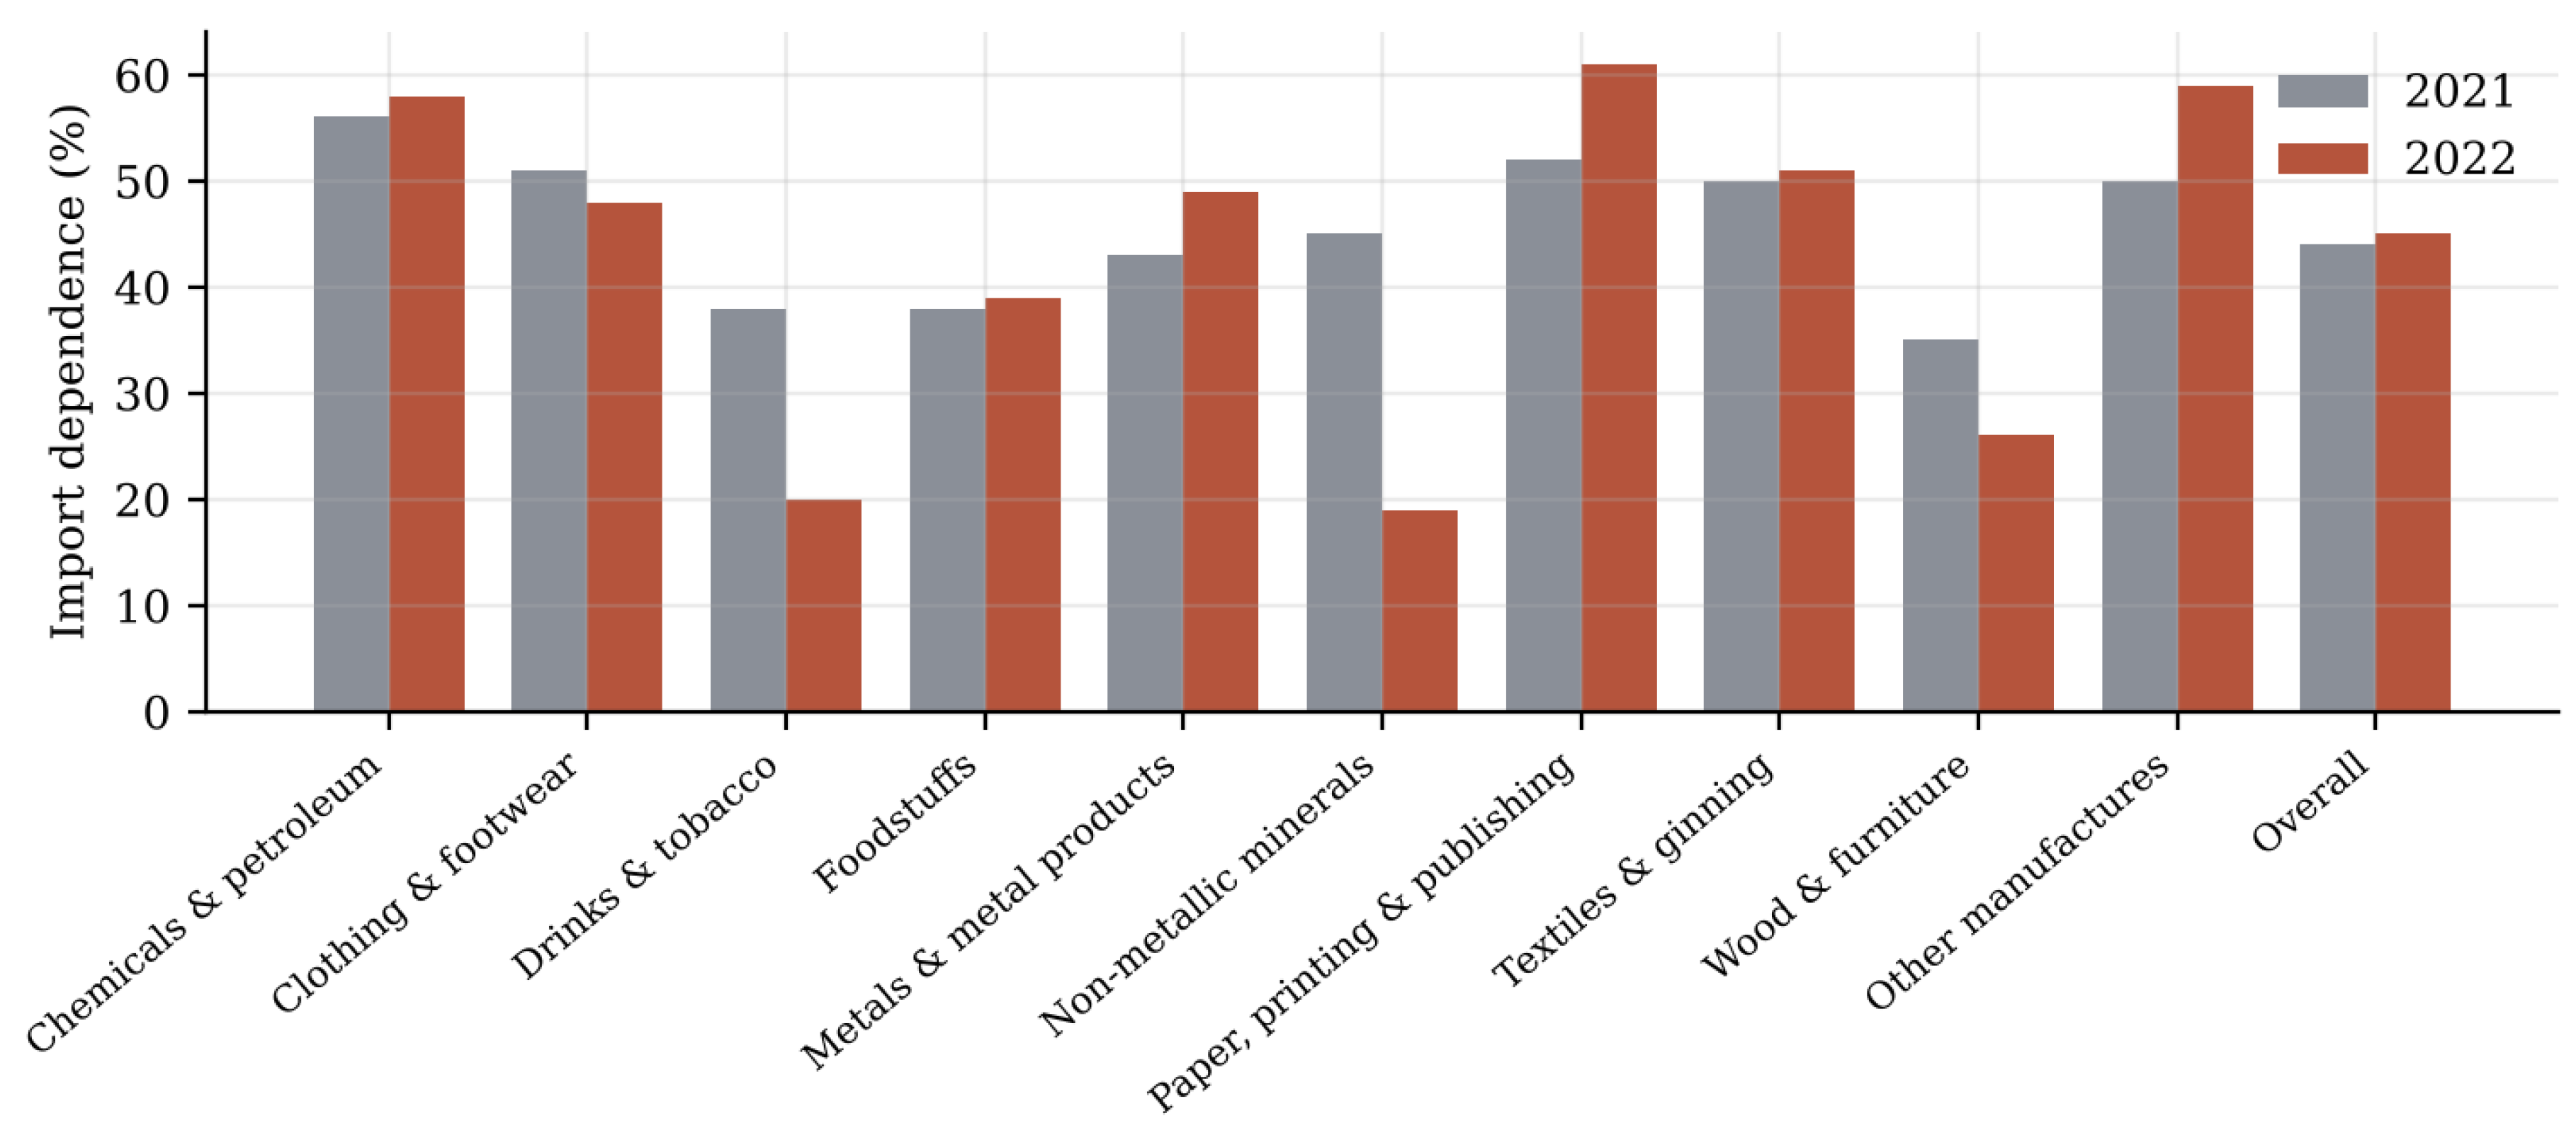
Figure 5.
Reasons for Importing Raw Materials, [8].
Disclaimer/Publisher’s Note: The statements, opinions and data contained in all publications are solely those of the individual author(s) and contributor(s) and not of MDPI and/or the editor(s). MDPI and/or the editor(s) disclaim responsibility for any injury to people or property resulting from any ideas, methods, instructions or products referred to in the content. |
© 2026 by the authors. Licensee MDPI, Basel, Switzerland. This article is an open access article distributed under the terms and conditions of the Creative Commons Attribution (CC BY) license.
Copyright: This open access article is published under a Creative Commons CC BY 4.0 license, which permit the free download, distribution, and reuse, provided that the author and preprint are cited in any reuse.