
Submitted:
13 November 2026
Posted:
17 November 2026
You are already at the latest version
Abstract
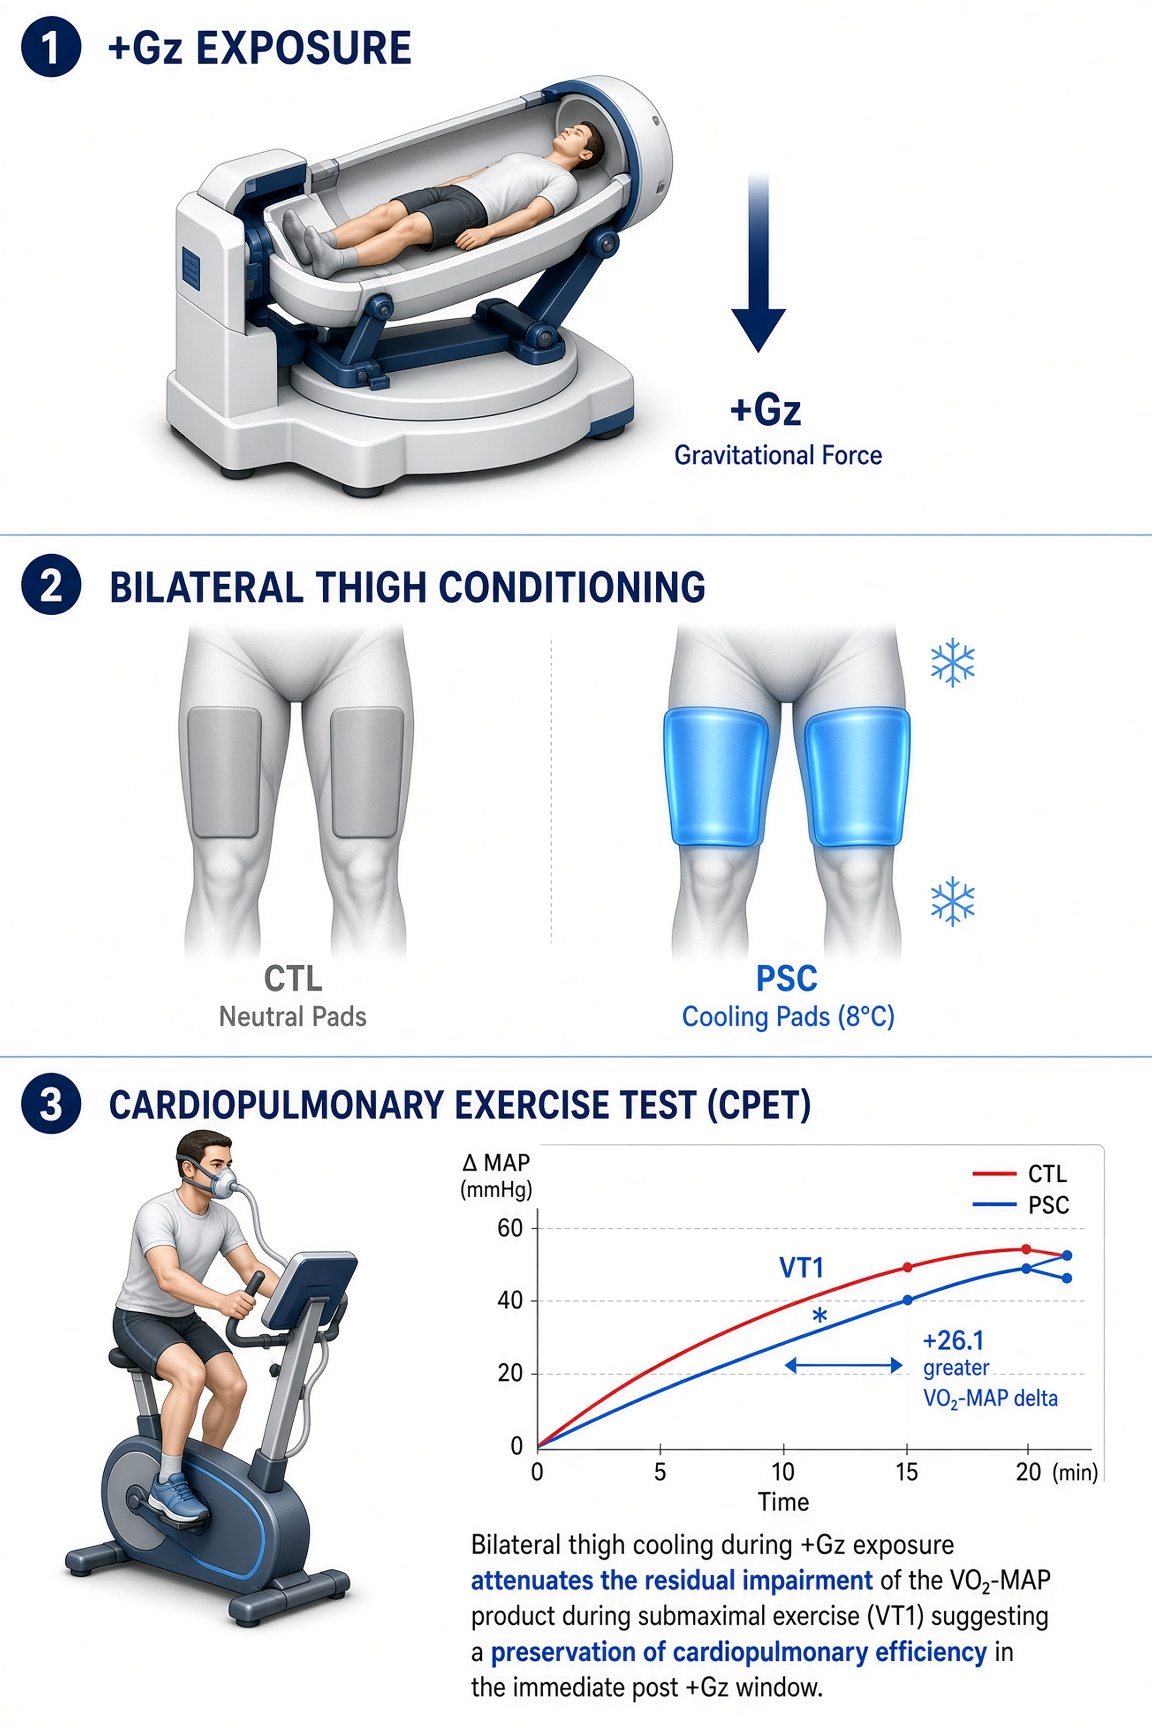
Background: Aerospace crews may need to perform physical tasks immediately after hy-pergravity (+Gz) exposure. Strategies to preserve submaximal cardiopulmonary perfor-mance in this window remain limited. Objective: To test whether peripheral skin cooling (PSC) applied during +Gz would attenuate residual effects on submaximal cardiopulmo-nary exercise performance. Methods: Eighteen healthy males completed a randomized crossover protocol on a short-arm human centrifuge. Participants underwent a standard-ized +Gz profile (up to +4 Gz) with bilateral thigh cooling or non-cooled control pads. Immediately after +Gz, cycle ergometry was performed to the first ventilatory threshold (VT1) and to volitional exhaustion. Primary outcomes were oxygen uptake (VO₂) and the body-surface-area-indexed VO₂–mean arterial pressure product at VT1. Results: The change from post-+Gz rest in the indexed VO₂–MAP product at VT1 was larger after PSC (+13.2 ± 24.7 L·mmHg·min⁻¹·m⁻², paired t-test p = 0.037). Absolute VO₂ at VT1 was also higher after PSC, but the .the distribution of differences was non-normal; consequently, the Wilcoxon signed-rank test was employed, which yielded no significant difference. No sig-nificant differences were observed at maximal exertion. Linear mixed models showed no significant Condition × Phase interaction for any primary outcome. The VT1 difference was larger when the control session preceded PSC. Conclusions: Bilateral thigh cooling during +Gz was associated with a larger rise in the indexed VO₂–MAP product from rest to VT1. The effect was modest, confined to submaximal intensity, sensitive to session or-der, and not confirmed by the mixed-model interaction or by absolute VO₂ on the preferred non-parametric test. Further studies are required before operational recommendations can be made.
Keywords:
hypergravity
; peripheral skin cooling
; cardiopulmonary exercise
; ventilatory threshold
; countermeasure
; short-arm centrifuge
1. Introduction
Optimal cardiopulmonary fitness is integral for aerospace crew performance during and after gravitational transitions [1,2]. Hypergravity (+Gz) encountered during launch and atmospheric re-entry produces rapid cranial-to-caudal fluid shifts, reduced venous return, lower-extremity venous pooling, and elevated intramuscular pressure [3,4]. These residual effects can impair subsequent exercise capacity at the very moment when crews may be required to perform physically demanding tasks such as vehicle egress, equipment handling, or casualty movement [5]. While the chronic effects of microgravity on aerobic capacity are well documented, the acute residual impact of +Gz on submaximal cardiopulmonary performance in the immediate post-exposure window remains poorly characterised.
Peripheral skin cooling (PSC) applied to the thighs offers a potential low-mass countermeasure. Ground-based studies have shown that thigh cooling increases orthostatic tolerance through cutaneous vasoconstriction and preservation of central blood volume [6,7]. Local muscle cooling can also reduce metabolic rate, slow cross-bridge cycling, and attenuate metabolite accumulation, thereby preserving contractile function [11,12]. To our knowledge, no prior investigation has examined whether PSC applied during +Gz can mitigate residual impairments in cardiopulmonary performance measured immediately afterwards.
We therefore conducted a randomised crossover study in which participants underwent a graded short-arm centrifuge +Gz profile (up to +4 Gz) with bilateral thigh cooling or non-cooled control pads, followed immediately by cycle ergometry. The primary hypothesis was that PSC would attenuate any +Gz-induced reduction in the body-surface-area-indexed VO₂–mean arterial pressure product at the first ventilatory threshold and these effects would also carry over into maximal exertion. Secondary hypotheses addressed absolute oxygen uptake, minute ventilation, and power output at the same submaximal intensity. Exploratory parameters included all other variables..
2. Materials and Methods
2.1. Participants and Ethics
Eighteen healthy men (mean age 28 years) were recruited after medical screening. Inclusion criteria included absence of cardiovascular or metabolic disease, BMI 18–26 kg·m⁻², and VO₂max ≥ 35 mL·kg⁻¹·min⁻¹. Written informed consent was obtained. The study was approved by the Ethics Committee of the Medical Council North Rhine (Ärztekammer Nordrhein 2018244) and registered at DRKS00015433. The study was conducted in accordance with the Declaration of Helsinki.
2.2. Protocol
A randomised crossover design was used with a minimum three-day washout (range 3–14 days). Order was balanced (9 PSC-first, 9 CTL-first). Each participant completed two short-arm human centrifuge sessions at the DLR Envihab facility. The +Gz profile consisted of a baseline at +1 Gz followed by stepwise increments to a maximum of +4 Gz or until termination criteria [8,9]. Twelve participants reached +4 Gz in each arm. Bilateral thigh pads (Arctic Sun 5000) circulated 8 °C water throughout the PSC session; identical non-cooled pads were used in the control session (CTL). Immediately after +Gz, participants transferred to an adjacent cycle ergometer via stretcher to prevent pre-mature muscle loading and any orthostatic events. The exercise protocol comprised seated rest, a warm-up, stepwise increments to the VT1 (software-determined on the Innocor system; experimenter not blinded), and continuation to volitional exhaustion [10,11].
2.3. Outcomes and Statistics
Primary outcome was the change from post-+Gz rest in the body-surface-area-indexed VO₂–mean arterial pressure product (VO2-MAP) at the first ventilatory threshold and at maximal exertion. Secondary outcomes included absolute VO₂, minute ventilation, and power output at the same intensity, and all outcomes at maximal exertion. Exploratory outcomes included all additional parameters at absolute and delta from rest.
Normality of paired differences was assessed with the Shapiro–Wilk test. When the difference was normal, the paired t-test was used; otherwise the Wilcoxon signed-rank test was preferred. Linear mixed models with fixed effects of Condition, Phase, and their interaction, and a random intercept for subject, were fitted to examine the phase specificity of any effect. Analyses were performed in JASP 0.98. Two-tailed p < 0.05 was considered significant.
3. Results
Post-+Gz resting values did not differ between conditions (Table 1).
At the VT1 the indexed VO₂–MAP product was higher after PSC (143.9 ± 34.4 vs. 130.8 ± 37.1 L·mmHg·min⁻¹·m⁻²). The change from rest was +13.2 ± 24.7 larger after PSC (paired t-test p = 0.037). Absolute VO₂ at VT1 was 0.20 ± 0.42 L·min⁻¹ higher after PSC (paired t p = 0.053), but the difference was non-normal and the Wilcoxon test was not significant (p = 0.21) (Table 2, Figure 1). Minute ventilation and power output showed similar non-significant trends (Table 2). The VT1 difference in the indexed VO₂–MAP product was larger when the control session preceded PSC (CTL-first mean difference +20.1 L·mmHg·min⁻¹·m⁻²; PSC-first mean difference +6.4 L·mmHg·min⁻¹·m⁻²).
No significant differences were observed at maximal exertion for any primary or secondary outcome (Table 3).
Linear mixed models confirmed a non-significant Condition × Phase interaction for all variables, including the indexed VO₂–MAP product (p = 0.21) (Table 4).
4. Discussion
The present study is the first to examine the residual effects of acute +Gz on cardiopulmonary performance in the immediate post-exposure period and to test whether PSC applied during the gravitational load modifies those effects. The principal finding was a larger rise in the body-surface-area-indexed VO₂–MAP product from post-+Gz rest to VT1 after thigh cooling. Absolute VO₂ itself did not remain significant once non-normality was accounted for, and no benefit was detected at maximal exertion or in the linear mixed-model framework. These results indicate a modest, intensity-specific association rather than a general preservation of cardiopulmonary fitness.
During +Gz, physiological responses that maintain cerebral and coronary perfusion such as tachycardia, vasoconstriction, and cranial-to-caudal fluid redistribution leave residual impairment once the load is removed [7,12]. The rapid fluid shift reduces venous return and cardiac output while producing lower-extremity venous pooling and oedema that elevate intramuscular pressure and compromise skeletal-muscle perfusion [3,5]. Concurrently, the exaggerated gravitational gradient across the lung alters ventilatory mechanics, impairs ventilation–perfusion matching, and increases the work of breathing [4,13]. Catecholamine surges that accompany high +Gz may further influence subsequent metabolic efficiency [8,14]. These residual effects have been documented by other groups after centrifugation [1] and are consistent with broader reviews of cardiovascular adaptation to gravitational stress [15,16].
PSC applied to the thighs can counteract several of these residual effects through both central and local mechanisms. Cutaneous vasoconstriction induced by cooling helps preserve central blood volume and may support post-exposure cardiac output [6,7,9,27]. At the local muscle level, reduced tissue temperature slows cross-bridge cycling and calcium handling, decreases metabolic rate, attenuates metabolite accumulation, and limits the energetic cost of contraction [17,18,19]. Cooling has also been shown to reduce inflammatory signalling and oxidative stress while improving local blood-flow regulation upon rewarming [18,20]. These local effects are particularly relevant after +Gz, where elevated intramuscular pressure already impairs perfusion [5]. Systematic reviews of pre- and per-cooling strategies confirm that cooling can improve subsequent exercise performance, primarily by reducing thermal strain and preserving muscle function [21,22]. These pathways are plausible but were not directly measured in the present study.
The present findings are consistent with an intensity-specific effect confined to the submaximal domain. The larger rise in the indexed VO₂–MAP product at VT1 suggests that cooling may have supported a higher pressure–flow product at an intensity relevant to sustained work, possibly by reducing lower-body fluid pooling and the metabolic cost of contraction. The absence of a comparable effect at maximal exertion and the non-significant Condition × Phase interaction in the mixed models indicates that any such benefit does not generalise to peak exercise or across the full exercise bout. Absolute VO₂, the traditional marker of cardiopulmonary fitness, did not remain significant on the preferred non-parametric test, underscoring that the result is limited to the derived pressure–flow product.
These observations align with earlier work showing that post-centrifugation exercise capacity can be impaired and with studies demonstrating that peripheral cooling improves orthostatic tolerance and local muscle performance under thermal or orthostatic stress [6,7,17]. No previous investigation, however, has combined +Gz exposure with immediate post-exposure cardiopulmonary exercise testing under a controlled cooling intervention. The present design therefore fills a gap between orthostatic-tolerance studies and operational requirements for physical work after launch or re-entry.
Limitations include the male-only sample, the use of a laboratory cycle-ergometer proxy rather than operational tasks such as egress or equipment handling, and the absence of direct muscle-temperature or blood-flow measurements. In addition, the software-determined ventilatory threshold was not blinded. Furthermore, the +Gz profile does not fully reproduce the multi-axis or prolonged exposures encountered in actual flight. Sample size was modest; larger studies in mixed-sex cohorts will be required to confirm the finding and to examine potential sex differences in cooling responses [23]. Repeated +Gz exposure can produce local vascular adaptations in the legs that improve G-tolerance [30] and whether a single acute cooling intervention interacts with these adaptations remains to be tested [29].
Operational implications remain preliminary. While the indexed VO₂–MAP product rose more after cooling at a submaximal intensity, the effect size was modest, did not extend to absolute VO₂ on the preferred test, and was absent at peak exercise. Whether these controlled analogue observations translate into improved performance of specific post-landing tasks remains to be determined in more operationally representative scenarios. Cycle ergometry is a laboratory proxy for operational tasks. Future investigations should evaluate dose–response relationships for cooling temperature and duration, inclusion of female participants, combination with other countermeasures, and direct assessment of task performance [24,25].
5. Conclusions
Bilateral thigh cooling during hypergravity was associated with a larger increase in the body-surface-area-indexed VO₂–mean arterial pressure product from rest to the first ventilatory threshold. The effect did not extend to absolute oxygen uptake on the preferred non-parametric test, nor to maximal exercise. Further studies in mixed-sex cohorts and with task-specific endpoints are required before operational recommendations can be made. The results of this study do provide some evidence that PSC may be an effective post +Gz countermeasure and that further studies of this nature are warranted6.
Author Contributions
Conceptualization, M.N., N.K., T.F., H.-C.G. and O.O.; methodology, M.N., N.K. and T.F.; formal analysis, M.N.; investigation, M.N., N.K., B.F., T.F. and R.B.; data curation, M.N.; writing—original draft preparation, M.N.; writing—review and editing, all authors; visualization, M.N.; supervision, O.O. and H.-C.G. All authors have read and agreed to the published version of the manuscript.
Funding
This work was supported by the German Aerospace Center (DLR), grant 50WB1832. The funder had no role in study design, data collection, analysis or manuscript preparation.
Institutional Review Board Statement
The study was conducted in accordance with the Declaration of Helsinki and approved by the Ethics Committee of the Medical Council North Rhine (Ärztekammer Nordrhein 2018244, approved 24 September 2018).
Informed Consent Statement
Informed consent was obtained from all subjects involved in the study.
Data Availability Statement
The raw data supporting the conclusions of this article will be made available by the authors on request.
Acknowledgments
We thank the volunteers and the DLR centrifuge team, including Timo Frett, Michael Arz and Guido Petrat, and the working group of Dr von der Wiesche. M.N. acknowledges non-financial support from the Innovation Centre for Innovative Therapeutics (TheraNova), Fraunhofer ITMP, Frankfurt.
Conflicts of Interest
The authors declare no conflicts of interest.
Abbreviations
The following abbreviations are used in this manuscript:
| Cardiopulmonary & Physiological Parameters | |
| VO2 | Oxygen uptake |
| VO2max | Maximal oxygen uptake |
| MAP | Mean arterial pressure |
| VT1 | First ventilatory threshold |
| VE | Minute ventilation |
| VCO2 | Carbon dioxide production |
| BP | Blood pressure |
| O2 pulse | Oxygen pulse (oxygen uptake per heartbeat) |
| RQ | Respiratory quotient |
| BMI | Body mass index |
| Aerospace & Experimental Terms | |
| +Gz | Hypergravity (acceleration in the cranial-to-caudal axis) |
| PSC | Peripheral skin cooling |
| CTL | Control (non-cooled condition) |
| DLR | German Aerospace Center (Deutsches Zentrum für Luft- und Raumfahrt) |
| Institutional & Regulatory | |
| ATS/ACCP | American Thoracic Society / American College of Chest Physicians |
| DRKS | German Clinical Trials Register (Deutsches Register Klinischer Studien) |
| Statistical Terms | |
| CI | Confidence interval |
| p | p-value (probability value) |
| SD | Standard deviation |
| Δ | Delta (representing the change or difference between values) |
References
- Norcross, J.; et al. “Egress Fitness.” NASA Technical Reports Server. 2026. Available online: https://ntrs.nasa.gov/citations/20260002435 (accessed on 28 October 2026).
- Rivas, E.; Strock, N.; Dillon, E. L.; Frisco, D. NASA HRP Evidence Report: Muscle and Aerobic Capacity. 2023. Available online: https://ntrs.nasa.gov/citations/20220019338 (accessed on 28 October 2026).
- Bonjour, J.; Bringard, A.; Antonutto, G.; Capelli, C.; Linnarsson, D.; Pendergast, D. R.; Ferretti, G. Effects of acceleration in the Gz axis on human cardiopulmonary responses to exercise. Eur. J. Appl. Physiol. 2011, 111, 2907–2917. [Google Scholar] [CrossRef] [PubMed]
- Rohdin, M.; et al. Effects of gravity on lung diffusing capacity and cardiac output in prone and supine humans. J. Appl. Physiol. 2003, 95, 3–10. [Google Scholar] [CrossRef] [PubMed]
- Bosco, C. Adaptive response of human skeletal muscle to simulated hypergravity. Acta Physiol. Scand. 1985, 124, 507–513. [Google Scholar] [CrossRef] [PubMed]
- Convertino, V. A. High sustained +Gz acceleration: physiological adaptation to high-G tolerance. J. Gravitational Physiol. 1998, 5, P51–P54. [Google Scholar]
- Durand, S.; Cui, J.; Williams, K. D.; Crandall, C. G. Skin surface cooling improves orthostatic tolerance in normothermic individuals. Am. J. Physiol.-Regul. Integr. Comp. Physiol. 2004, 286, R199–R205. [Google Scholar] [CrossRef] [PubMed]
- Seeley, A. D.; Giersch, G. E. W.; Charkoudian, N. Post-exercise body cooling: skin blood flow, venous pooling, and orthostatic intolerance. Front. Sports Act. Living 2021, 3, 658410. [Google Scholar] [CrossRef] [PubMed]
- Kagelmann, N.; et al. Peripheral skin cooling during hyper-gravity: hemodynamic reactions. Front. Physiol. 2023, 14, 1173171. [Google Scholar] [CrossRef] [PubMed]
- Nordine, M.; et al. Impact of peripheral skin cooling on neuroendocrine leukocytic and hematological reactions during hypergravity. npj Microgravity 2025, 11, 30. [Google Scholar] [CrossRef] [PubMed]
- Drinkwater, E. Effects of peripheral cooling on characteristics of local muscle. In Medicine and Sport Science; Marino, F. E., Ed.; Karger: Basel, Switzerland, 2008; pp. 74–88. [Google Scholar]
- Hyldahl, R. D.; Peake, J. M. Combining cooling or heating applications with exercise training to enhance performance and muscle adaptations. J. Appl. Physiol. 2020, 129, 353–365. [Google Scholar] [CrossRef] [PubMed]
- Rohdin, M.; Linnarsson, D. Differential changes of lung diffusing capacity and tissue volume in hypergravity. J. Appl. Physiol. 2002, 93, 931–935. [Google Scholar] [CrossRef] [PubMed]
- Han, H.; Jia, H.; Wang, Y.-F.; Song, J.-P. Cardiovascular adaptations and pathological changes induced by spaceflight: from cellular mechanisms to organ-level impacts. Mil. Med. Res. 2024, 11, 68. [Google Scholar] [CrossRef] [PubMed]
- Scott, J. M.; Stoudemire, J.; Dolan, L.; Downs, M. Leveraging spaceflight to advance cardiovascular research on Earth. Circ. Res. 2022, 130, 942–957. [Google Scholar] [CrossRef] [PubMed]
- Moore, A. D., Jr.; et al. Peak exercise oxygen uptake during and following long-duration spaceflight. J. Appl. Physiol. 2014, 117, 231–238. [Google Scholar] [CrossRef] [PubMed]
- Treigyte, V.; et al. Moderate muscle cooling and contractile function. Front. Physiol. 2023, 14, 1172817. [Google Scholar] [CrossRef] [PubMed]
- Imai, D.; et al. Effects of skin surface cooling before exercise on lactate accumulation in a cool environment. Eur. J. Appl. Physiol. 2018, 118, 551–562. [Google Scholar] [CrossRef] [PubMed]
- Christmas, K. M.; et al. Sustained cutaneous vasoconstriction and oxidative stress with cooling. J. Appl. Physiol. 2016, 120, 1245–1253. [Google Scholar]
- Bothe, T. L.; et al. Peripheral skin cooling during gravitational challenges in parabolic flight. Front. Physiol. 2025, 16, 1477311. [Google Scholar] [CrossRef] [PubMed]
- Bongers, C. C. W. G.; et al. Precooling and percooling both improve performance in the heat. Br. J. Sports Med. 2015, 49, 377–384. [Google Scholar] [CrossRef] [PubMed]
- Jiang, D.; et al. Effects of different external cooling placements prior to and during exercise on athletic performance in the heat. Front. Physiol. 2022, 13, 1091228. [Google Scholar] [CrossRef] [PubMed]
- Yanovich, R.; et al. Sex differences in human thermoregulation. Physiology 2020, 35, 177–184. [Google Scholar] [CrossRef] [PubMed]
- Alexander, A. M.; et al. Prediction of emergency capsule egress performance. Aerosp. Med. Hum. Perform. 2019, 90, 782–787. [Google Scholar] [CrossRef] [PubMed]
- ATS/ACCP. ATS/ACCP statement on cardiopulmonary exercise testing. Am. J. Respir. Crit. Care Med. 2003, 167, 211–277. [Google Scholar] [CrossRef] [PubMed]
- Pendergast, D. R.; et al. Cardiovascular and pulmonary responses to increased acceleration forces during rest and exercise. Aviat. Space Environ. Med. 2012, 83, 488–495. [Google Scholar] [CrossRef] [PubMed]
- Alba, B. K.; Castellani, J. W.; Charkoudian, N. Cold-induced cutaneous vasoconstriction in humans. Exp. Physiol. 2019, 104, 1202–1214. [Google Scholar] [CrossRef] [PubMed]
- Demir, A. E.; et al. Short-term effects of +Gz exposure on respiratory functions. Gulhane Med. J. 2026, 68, 118–126. [Google Scholar] [CrossRef]
- Briard, M.; Baatout, S. Artificial gravity for long-duration human spaceflight. Front. Space Technol. 2026, 7, 1967384. [Google Scholar] [CrossRef]
- Eiken, O.; Keramidas, M. E.; Sköldefors, H.; Kölegård, R. Human cardiovascular adaptation to hypergravity. Am. J. Physiol.-Regul. Integr. Comp. Physiol. 2022, 322, R597–R608. [Google Scholar] [CrossRef] [PubMed]
Figure 1.
Change from rest (Δ) in (A) the VO₂–MAP product and (B) oxygen uptake (VO₂) at rest, the ventilatory threshold (AT), and maximal exercise after +Gz exposure with peripheral skin cooling (PSC, blue squares) or control (CTL, red circles). Data are mean ± SD (n = 18). * p < 0.05, PSC versus CTL at AT (paired test); no significant difference was observed at maximal exercise. Lines connect phase means for visual orientation only.
Figure 1.
Change from rest (Δ) in (A) the VO₂–MAP product and (B) oxygen uptake (VO₂) at rest, the ventilatory threshold (AT), and maximal exercise after +Gz exposure with peripheral skin cooling (PSC, blue squares) or control (CTL, red circles). Data are mean ± SD (n = 18). * p < 0.05, PSC versus CTL at AT (paired test); no significant difference was observed at maximal exercise. Lines connect phase means for visual orientation only.
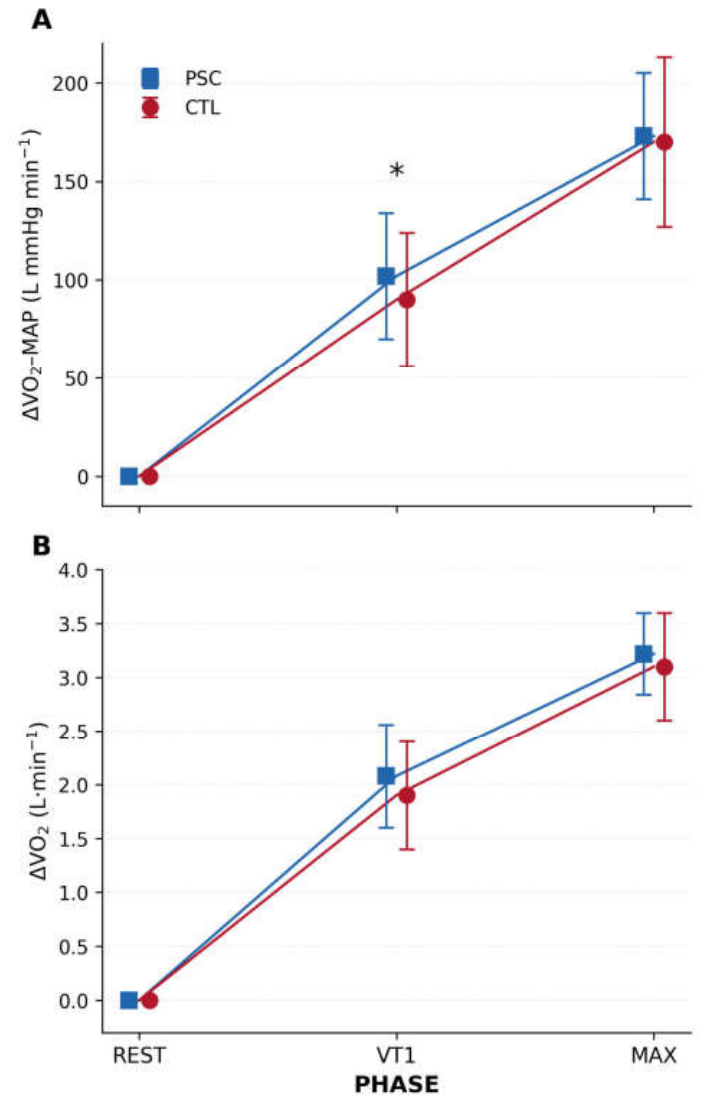

Table 1.
Absolute values at post-hypergravity (+Gz) rest.
| Parameter | PSC | CTL | Δ (PSC−CTL) | p (paired t / Wilcoxon) |
|---|---|---|---|---|
| VO₂ (L·min⁻¹) | 0.45 ± 0.14 | 0.45 ± 0.12 | −0.00 ± 0.12 | 0.97 / 0.59 |
| VO₂ (mL·kg⁻¹·min⁻¹) | 5.61 ± 1.74 | 5.63 ± 1.49 | −0.03 ± 1.56 | 0.94 / 0.55 |
| VO₂–MAP product (L·mmHg·min⁻¹) | 43.0 ± 13.5 | 43.4 ± 13.4 | −0.4 ± 10.2 | 0.89 / 0.93 |
| VO₂–MAP indexed (L·mmHg·min⁻¹·m⁻²) | 21.5 ± 6.6 | 21.8 ± 6.5 | −0.2 ± 5.1 | 0.89 / 0.93 |
| Heart rate (bpm) | 74.1 ± 10.3 | 71.9 ± 9.5 | +2.2 ± 6.6 | 0.17 / 0.19 |
| O₂ pulse (mL·beat⁻¹) | 6.21 ± 2.16 | 6.14 ± 1.64 | +0.07 ± 1.84 | 0.88 / 0.91 |
| Minute ventilation (L·min⁻¹) | 14.4 ± 5.1 | 14.6 ± 3.3 | −0.2 ± 4.8 | 0.88 / 0.86 |
| Respiratory quotient | 0.78 ± 0.06 | 0.75 ± 0.05 | +0.03 ± 0.07 | 0.14 / 0.09 |
| VE/VCO₂ | 41.6 ± 7.8 | 44.6 ± 8.9 | −3.0 ± 11.5 | 0.28 / 0.50 |
| VE/VO₂ | 32.3 ± 6.5 | 33.4 ± 6.7 | −1.1 ± 9.5 | 0.62 / 0.80 |
| Respiratory rate (breaths·min⁻¹) | 15.3 ± 2.5 | 15.5 ± 2.8 | −0.2 ± 3.1 | 0.84 / 0.80 |
| Systolic BP (mmHg) | 126.4 ± 7.9 | 126.3 ± 10.7 | +0.1 ± 12.1 | 0.97 / 0.98 |
| Diastolic BP (mmHg) | 81.9 ± 8.2 | 81.2 ± 8.2 | +0.7 ± 12.4 | 0.82 / 0.59 |
| Mean arterial pressure (mmHg) | 96.7 ± 6.9 | 96.2 ± 7.8 | +0.5 ± 8.9 | 0.85 / 0.63 |
Values are mean ± SD. n = 18. Two-tailed p-values from paired t-tests (or Wilcoxon signed-rank tests where indicated). PSC, peripheral skin cooling; CTL, control; VO₂, oxygen uptake; MAP, mean arterial pressure; VE, minute ventilation; BP, blood pressure.
Table 2.
Absolute and delta values at the first ventilatory threshold (VT1).
| Parameter | PSC | CTL | Δ (PS2. | p (paired t / Wilcoxon) |
|---|---|---|---|---|
| VO₂ (L·min⁻¹) | 2.54 ± 0.49 | 2.33 ± 0.52 | +0.20 ± 0.42 | 0.053 / 0.207 |
| VO₂ (mL·kg⁻¹·min⁻¹) | 31.70 ± 5.53 | 29.12 ± 5.86 | +2.58 ± 5.31 | 0.055 / 0.229 |
| VO₂–MAP product (L·mmHg·min⁻¹) | 286.8 ± 68.9 | 261.1 ± 76.1 | +25.8 ± 50.4 | 0.045 / 0.081 |
| VO₂–MAP indexed (L·mmHg·min⁻¹·m⁻²) | 143.9 ± 34.4 | 130.8 ± 37.1 | +13.0 ± 25.7 | 0.046 / 0.099 |
| Heart rate (bpm) | 141.3 ± 21.1 | 135.9 ± 18.4 | +5.4 ± 13.8 | 0.116 / 0.135 |
| O₂ pulse (mL·beat⁻¹) | 17.93 ± 1.88 | 17.10 ± 2.69 | +0.83 ± 2.10 | 0.110 / 0.098 |
| Minute ventilation (L·min⁻¹) | 60.2 ± 16.5 | 55.0 ± 17.8 | +5.2 ± 11.4 | 0.071 / 0.094 |
| Respiratory quotient | 0.92 ± 0.01 | 0.92 ± 0.02 | −0.00 ± 0.02 | 0.741 / 0.865 |
| VE/VCO₂ | 25.7 ± 3.5 | 25.3 ± 3.4 | +0.4 ± 2.8 | 0.556 / 0.523 |
| VE/VO₂ | 23.6 ± 3.2 | 23.3 ± 3.1 | +0.3 ± 2.5 | 0.591 / 0.766 |
| Respiratory rate (breaths·min⁻¹) | 22.7 ± 6.1 | 22.8 ± 6.3 | −0.03 ± 2.6 | 0.964 / 0.948 |
| Systolic BP (mmHg) | 169.0 ± 17.6 | 168.9 ± 23.0 | +0.1 ± 18.1 | 0.980 / 0.975 |
| Diastolic BP (mmHg) | 83.8 ± 4.9 | 81.7 ± 8.5 | +2.1 ± 8.1 | 0.282 / 0.276 |
| Mean arterial pressure (mmHg) | 112.2 ± 7.7 | 110.8 ± 11.2 | +1.4 ± 8.2 | 0.466 / 0.717 |
| Power (W) | 186.2 ± 48.5 | 172.0 ± 46.9 | +14.2 ± 32.5 | 0.082 / 0.109 |
| Power (W·kg⁻¹) | 2.33 ± 0.59 | 2.15 ± 0.54 | +0.17 ± 0.41 | 0.088 / 0.124 |
| ΔVO₂ (L·min⁻¹) | 2.09 ± 0.47 | 1.88 ± 0.48 | +0.21 ± 0.40 | 0.042 / 0.231 |
| ΔVO₂ (mL·kg⁻¹·min⁻¹) | 26.10 ± 5.46 | 23.49 ± 5.44 | +2.61 ± 4.96 | 0.040 / 0.246 |
| ΔVO₂–MAP product (L·mmHg·min⁻¹) | 243.8 ± 67.2 | 217.6 ± 72.1 | +26.1 ± 48.9 | 0.045 / 0.074 |
| ΔVO₂–MAP indexed (L·mmHg·min⁻¹·m⁻²) | 122.3 ± 33.7 | 109.1 ± 35.3 | +13.2 ± 24.7 | 0.037 / 0.081 |
| ΔHeart rate (bpm) | 67.2 ± 20.0 | 64.0 ± 19.1 | +3.2 ± 16.3 | 0.422 / 0.513 |
| ΔO₂ pulse (mL·beat⁻¹) | 11.72 ± 2.14 | 10.96 ± 2.20 | +0.77 ± 2.32 | 0.179 / 0.240 |
| ΔMinute ventilation (L·min⁻¹) | 45.8 ± 14.7 | 40.5 ± 16.8 | +5.4 ± 11.3 | 0.060 / 0.054 |
| ΔRespiratory quotient | 0.14 ± 0.06 | 0.17 ± 0.06 | −0.03 ± 0.08 | 0.143 / 0.154 |
| ΔVE/VCO₂ | −16.0 ± 7.3 | −19.3 ± 9.8 | +3.4 ± 12.0 | 0.245 / 0.495 |
| ΔVE/VO₂ | −8.7 ± 6.0 | −10.1 ± 7.1 | +1.5 ± 9.7 | 0.534 / 0.671 |
| ΔRespiratory rate (breaths·min⁻¹) | 7.4 ± 5.3 | 7.3 ± 6.3 | +0.2 ± 4.4 | 0.884 / 0.899 |
| ΔSystolic BP (mmHg) | 42.6 ± 18.9 | 42.6 ± 20.3 | +0.0 ± 22.3 | 1.000 / 0.775 |
| ΔDiastolic BP (mmHg) | 2.0 ± 8.7 | 0.6 ± 8.2 | +1.4 ± 11.4 | 0.605 / 0.586 |
| ΔMean arterial pressure (mmHg) | 15.5 ± 10.2 | 14.6 ± 9.4 | +0.9 ± 12.7 | 0.756 / 0.856 |
Values are mean ± SD. n = 18. Two-tailed p-values from paired t-tests and Wilcoxon signed-rank tests. Delta values represent the change from post-hypergravity rest. PSC, peripheral skin cooling; CTL, control; VO₂, oxygen uptake; MAP, mean arterial pressure; VE, minute ventilation; BP, blood pressure; VT1, first ventilatory threshold.
Table 3.
Absolute and delta values at maximal exertion. .
| Parameter | PSC | CTL | Δ (PSC−CTL) | p (paired t / Wilcoxon) |
|---|---|---|---|---|
| VO₂ (L·min⁻¹) | 3.67 ± 0.40 | 3.57 ± 0.53 | +0.10 ± 0.31 | 0.190 / 0.296 |
| VO₂ (mL·kg⁻¹·min⁻¹) | 45.93 ± 4.36 | 44.58 ± 5.50 | +1.35 ± 4.02 | 0.172 / 0.284 |
| VO₂–MAP product (L·mmHg·min⁻¹) | 455.9 ± 69.2 | 445.8 ± 89.7 | +10.0 ± 67.9 | 0.540 / 0.799 |
| VO₂–MAP indexed (L·mmHg·min⁻¹·m⁻²) | 228.6 ± 32.4 | 223.2 ± 41.5 | +5.4 ± 34.3 | 0.514 / 0.734 |
| Heart rate (bpm) | 180.3 ± 10.3 | 180.3 ± 9.6 | −0.0 ± 7.7 | 0.989 / 1.000 |
| O₂ pulse (mL·beat⁻¹) | 20.35 ± 1.72 | 19.76 ± 2.42 | +0.59 ± 1.44 | 0.101 / 0.133 |
| Minute ventilation (L·min⁻¹) | 126.4 ± 21.3 | 122.7 ± 26.7 | +3.7 ± 19.8 | 0.437 / 0.468 |
| Respiratory quotient | 1.16 ± 0.07 | 1.15 ± 0.06 | +0.01 ± 0.05 | 0.314 / 0.325 |
| VE/VCO₂ | 29.7 ± 3.4 | 29.8 ± 3.5 | −0.1 ± 3.2 | 0.937 / 0.932 |
| VE/VO₂ | 34.4 ± 3.6 | 34.2 ± 3.7 | +0.2 ± 2.6 | 0.807 / 0.799 |
| Respiratory rate (breaths·min⁻¹) | 42.5 ± 6.9 | 42.5 ± 8.7 | −0.0 ± 6.8 | 0.989 / 1.000 |
| Systolic BP (mmHg) | 198.1 ± 17.6 | 201.9 ± 20.6 | −3.8 ± 23.3 | 0.494 / 0.393 |
| Diastolic BP (mmHg) | 86.8 ± 7.5 | 85.6 ± 11.2 | +1.2 ± 12.4 | 0.694 / 0.458 |
| Mean arterial pressure (mmHg) | 123.9 ± 8.3 | 124.4 ± 11.7 | −0.5 ± 12.9 | 0.872 / 0.972 |
| Power (W) | 300.1 ± 38.6 | 297.1 ± 43.4 | +3.0 ± 21.8 | 0.566 / 0.646 |
| Power (W·kg⁻¹) | 3.76 ± 0.47 | 3.72 ± 0.52 | +0.04 ± 0.28 | 0.552 / 0.650 |
| ΔVO₂ (L·min⁻¹) | 3.22 ± 0.38 | 3.12 ± 0.49 | +0.10 ± 0.30 | 0.176 / 0.246 |
| ΔVO₂ (mL·kg⁻¹·min⁻¹) | 40.33 ± 4.30 | 38.95 ± 5.03 | +1.38 ± 3.93 | 0.155 / 0.284 |
| ΔVO₂–MAP product (L·mmHg·min⁻¹) | 412.8 ± 68.1 | 402.4 ± 85.3 | +10.4 ± 68.0 | 0.540 / 0.734 |
| ΔVO₂–MAP indexed (L·mmHg·min⁻¹·m⁻²) | 207.0 ± 32.3 | 201.4 ± 39.7 | +5.6 ± 34.1 | 0.514 / 0.734 |
| ΔHeart rate (bpm) | 106.2 ± 12.7 | 108.4 ± 11.2 | −2.2 ± 9.7 | 0.344 / 0.394 |
| ΔO₂ pulse (mL·beat⁻¹) | 14.14 ± 2.28 | 13.62 ± 2.28 | +0.52 ± 1.72 | 0.215 / 0.325 |
| ΔMinute ventilation (L·min⁻¹) | 112.0 ± 18.5 | 108.2 ± 25.7 | +3.9 ± 19.8 | 0.418 / 0.349 |
| ΔRespiratory quotient | 0.38 ± 0.10 | 0.40 ± 0.06 | −0.01 ± 0.09 | 0.546 / 0.468 |
| ΔVE/VCO₂ | −11.9 ± 7.7 | −14.9 ± 10.2 | +2.9 ± 11.7 | 0.300 / 0.417 |
| ΔVE/VO₂ | 2.1 ± 6.6 | 0.7 ± 8.4 | +1.4 ± 10.4 | 0.589 / 0.766 |
| ΔRespiratory rate (breaths·min⁻¹) | 27.2 ± 6.6 | 27.0 ± 8.7 | +0.2 ± 8.1 | 0.933 / 0.932 |
| ΔSystolic BP (mmHg) | 71.7 ± 16.3 | 75.6 ± 18.3 | −3.9 ± 22.8 | 0.473 / 0.377 |
| ΔDiastolic BP (mmHg) | 4.9 ± 11.7 | 4.4 ± 11.8 | +0.5 ± 17.0 | 0.907 / 0.868 |
| ΔMean arterial pressure (mmHg) | 27.2 ± 11.1 | 28.2 ± 11.5 | −1.0 ± 16.5 | 0.800 / 0.469 |
Values are mean ± SD. n = 18. Two-tailed p-values from paired t-tests and Wilcoxon signed-rank tests. Delta values represent the change from post-hypergravity rest. PSC, peripheral skin cooling; CTL, control; VO₂, oxygen uptake; MAP, mean arterial pressure; VE, minute ventilation; BP, blood pressure.
Table 4.
Linear mixed-model estimated differences (PSC−CTL) by phase.
| Parameter | Condition × Phase interaction p | VT1 simple effect (PSC−CTL) | 95% CI |
|---|---|---|---|
| VO₂ (L·min⁻¹) | 0.19 | +0.20 | −0.00 to 0.40 |
| VO₂ (mL·kg⁻¹·min⁻¹) | 0.18 | +2.58 | −0.04 to 5.20 |
| VO₂–MAP product (L·mmHg·min⁻¹) | 0.21 | +25.8 | −0.4 to 52.0 |
| VO₂–MAP indexed (L·mmHg·min⁻¹·m⁻²) | 0.21 | +13.0 | −0.2 to 26.2 |
| Heart rate (bpm) | 0.41 | +5.4 | −1.4 to 12.2 |
| O₂ pulse (mL·beat⁻¹) | 0.28 | +0.83 | −0.20 to 1.86 |
| Minute ventilation (L·min⁻¹) | 0.16 | +5.2 | −0.5 to 10.9 |
| Respiratory quotient | 0.67 | −0.00 | −0.01 to 0.01 |
| VE/VCO₂ | 0.61 | +0.4 | −0.9 to 1.7 |
| VE/VO₂ | 0.64 | +0.3 | −0.9 to 1.5 |
| Respiratory rate (breaths·min⁻¹) | 0.89 | −0.03 | −1.3 to 1.2 |
| Systolic BP (mmHg) | 0.97 | +0.1 | −8.7 to 8.9 |
| Diastolic BP (mmHg) | 0.34 | +2.1 | −1.9 to 6.1 |
| Mean arterial pressure (mmHg) | 0.51 | +1.4 | −2.5 to 5.3 |
| Power (W) | 0.15 | +14.2 | −2.2 to 30.6 |
Values are estimated mean difference (PSC−CTL) with 95% confidence interval. Models included fixed effects for Condition, Phase, and their interaction, with a random intercept for subject. The Condition × Phase interaction was non-significant for all variables (all p ≥ 0.15). n = 18. VT1, first ventilatory threshold.
Disclaimer/Publisher’s Note: The statements, opinions and data contained in all publications are solely those of the individual author(s) and contributor(s) and not of MDPI and/or the editor(s). MDPI and/or the editor(s) disclaim responsibility for any injury to people or property resulting from any ideas, methods, instructions or products referred to in the content. |
© 2026 by the authors. Licensee MDPI, Basel, Switzerland. This article is an open access article distributed under the terms and conditions of the Creative Commons Attribution (CC BY) license (http://creativecommons.org/licenses/by/4.0/).
Copyright: This open access article is published under a Creative Commons CC BY 4.0 license, which permit the free download, distribution, and reuse, provided that the author and preprint are cited in any reuse.