

Submitted:
13 November 2026
Posted:
17 November 2026
You are already at the latest version
Abstract
Low-cost inocula are promoted for composting manure in the Ecuadorian highlands, yet evidence separating substrate from inoculum effects is scarce. This study evaluated, in a completely randomised 2 × 2 factorial design with two bins per treatment, the effects of manure type (guinea pig or pig) and inoculum type (yoghurt lactic acid bacteria or Saccharomyces cerevisiae) over 12 weeks at 2622 m above sea level. Laboratory variables were measured in every bin at weeks 0, 6 and 12, and temperature was also analysed as a repeated measure. No variable differed at week 0 (p ≥ 0.155). Guinea pig bins were 2.50 °C warmer at week 6 (95% CI 0.93 to 4.07) and 0.75 °C warmer at week 12 (0.24 to 1.26), although the overall substrate effect in the repeated-measures model was not significant (p = 0.079). At week 12, guinea pig manure had more ash (+3.65 points) and fixed carbon (+4.20 points) and less total carbon (−3.07 points), and the ash balance indicated organic matter losses of 45% and 33% for guinea pig and pig manure, respectively. The inoculum affected only the week 6 microbial count, which was higher with S. cerevisiae. Manure type, rather than inoculum, explained the observed differences.
Keywords:
composting
; guinea pig manure
; pig manure
; lactic acid bacteria
; Saccharomyces cerevisiae
; split-plot design
; ash balance
1. Introduction
Small-scale livestock production in the Ecuadorian Andes generates volumes of manure that, in many rural parishes, accumulate or are returned to the soil without a treatment that stabilises the organic matter or reduces the pathogen load. In the parish of San Andrés, Chimborazo, the characterisation of agricultural and livestock residues showed notable contents of macronutrients and organic matter and low levels of heavy metals, making these residues suitable candidates for composting, and co-composting with passive aeration produced composts with germination indices of 92 to 94% [1]. In the same region, windrow composting of horticultural residues with poultry manure and sawdust exceeded 55 °C for more than two weeks and produced a stable and mature compost [2], and co-composting of market waste with pruning residues achieved substantial organic matter degradation at field scale [3]. These studies show that composting is technically feasible in the Ecuadorian highlands, but also that its performance depends on scale, mixture and management, three conditions that differ markedly between a pilot plant and a household bin.
Composting transforms organic residues into a stabilised material through the activity of microbial communities that succeed one another as temperature, pH and substrate availability change [4]. Its rate depends on a small set of interacting operational factors, including moisture, aeration, temperature, pH and the C/N ratio [5]. State-of-the-art reviews present composting as a low-cost option for solid, agricultural and food waste [6,7], but identify as constraints the long duration of the process [8], the generation of leachates and gases and the lack of uniformity in maturity indices [9]. The literature therefore distinguishes start-up parameters, such as the C/N ratio, moisture and particle size, monitoring parameters, such as temperature and pH, and final quality parameters [10].
The guinea pig (Cavia porcellus) is an emblematic species of Andean smallholder production, and its manure is often handled together with pig manure on the same farms. The literature on guinea pig manure composting is limited and comes mainly from regional journals. On one guinea pig farm, whole excreta contained 68.4% organic matter, 39.67% carbon and 3.42% nitrogen, and the compost obtained from the bedding had a pH of 6.03 [11]. In a Plackett–Burman design, the incorporation of guinea pig manure improved the pH and electrical conductivity of compost compared with cattle manure, although it raised arsenic, mercury and lead contents within the limits of the Peruvian standard [12]. Pig manure, by contrast, is well documented: its compact texture and high moisture require combination with bulking agents, and it can be a source of zoonotic pathogens when applied untreated [13,14].
Comparing manures is not trivial. Herbivore and omnivore excreta differ in their initial chemical and microbial composition, and these differences persist during composting. An experiment with sheep, cattle, pig and chicken manures showed that herbivore composts had higher pH, nitrate, total carbon and C/N ratio, whereas pig and chicken composts had higher electrical conductivity, ammonium and total nitrogen, with Firmicutes dominating the latter [15]. The guinea pig is a strict herbivore and the pig an omnivore, so manure type can be expected to shape the thermal dynamics and the transformation of organic matter independently of any added inoculum.
The initial C/N ratio, moisture and aeration determine much of the composting rate. In piles of pig manure with sawdust, an initial C/N ratio of 30 reached maturity in 49 days, whereas a ratio of 15 heated more slowly, reached a lower maximum temperature, retained higher electrical conductivity and remained immature at 63 days [16]. In co-composting pig faeces with maize stover, the aeration rate governed stability and the C/N ratio governed maturity, and the lowest initial ratio gave germination indices of only 53 to 66% [17]. For kitchen waste, the importance of factors for maturity followed the order C/N ratio, aeration and moisture [18]. Moisture in turn conditions aerobic activity; in a biosolids blend, a moisture content of 50% was the minimum for oxygen uptake rates above 1.0 mg g⁻¹ h⁻¹ [19]. Any comparison between inocula that does not control these factors confounds the biological effect of the inoculum with that of the formulation.
Composting manures with high moisture and nitrogen contents requires careful management of water and carbon. In high-moisture pig manure, the incorporation of corncob in an aerated static bin made composting possible [20], and the microbial activity of spent pig-manure sawdust litter depended on moisture content [21]. The added carbon source modifies carbon and nitrogen losses during the process [22], litter amendments alter nitrogen turnover and losses [23] and aeration modifies methane, nitrous oxide and ammonia emissions [24]. In chicken manure with sawdust, the initial C/N ratio conditioned the stability and maturity achieved [25]. These experiences, almost always obtained in piles of several cubic metres or in reactors, do not translate directly to small household bins.
The early stage of composting materials rich in soluble carbohydrates often passes through an acidic phase. Short-chain organic acids accumulated during this phase inhibit microbial growth [26], and the combination of low pH with temperatures close to 46 °C sharply reduces activity, delaying the transition from the mesophilic to the thermophilic phase [27]. Maintaining mesophilic temperatures during this phase shortens composting time [28], and the composition of the starting culture modifies acid inhibition in fed-batch systems [29]. The relationship between pH, microbial composition and odour emission in food waste composting confirms that the acidic phase has operational as well as kinetic consequences [30].
This problem has encouraged the use of inocula capable of consuming organic acids. The yeast Pichia kudriavzevii RB1 degraded the acids of a model material, raised the pH above neutrality within two days and accelerated the process by two days, although it died as the temperature rose [31]; holding the pile at 40 °C for two days allowed the yeast to remain active and also degrade the acetic acid produced during heating [32]. With acidified food waste, inoculation with Saccharomyces cerevisiae raised the temperature by 4 to 14 °C in 2 kg piles, increased the pH from 4.5 to 6.0 and extended the phase above 50 °C by three days in 15 kg piles [33]. A consortium degrading organic acids improved the composting efficiency of food waste [34], and inoculation with Bacillus almost tripled carbon dioxide production from food waste [35].
Lactic acid bacteria occupy an ambiguous position in this context. They are part of the early composting microbiota together with other acid producers [36], and their abundance in incoming waste has been associated with prolonged acidic phases [30]. However, a selected inoculum can favour degradation when it shifts the balance between lactic and acetic acid, and a microbial formulation that enriched Weissella improved the maturation of kitchen waste [37]. In cattle manure, the application of Lactobacillus acidophilus has been described in observational studies without an uninoculated control, which prevents attributing the changes to the inoculum [38]. Yoghurt bacteria, Lactobacillus delbrueckii subsp. bulgaricus and Streptococcus thermophilus, are an accessible inoculum for smallholders, but their behaviour in manure composted at thermophilic temperatures has not been documented with adequate replication.
Global evidence on inoculation is heterogeneous. A meta-analysis found positive mean effects on total nitrogen (30%), total phosphorus (46%), humification and the germination index, together with greater degradation of cellulose, hemicellulose and lignin, but marginal effects on bioavailable nutrients and a tendency to publish larger effects in higher-impact journals [39]. Reviews of composting microbiology and technology describe a succession of native communities in which Firmicutes dominate the initial mesophilic phase and various thermophilic genera the hot phase [40,41], and place microbial additives among several optimisation strategies whose outcome depends on the material and operating conditions [9].
The assessment of maturity adds a second difficulty. There is no single test of stability and maturity, so a combination of chemical and biological indicators is recommended [42], and the C/N ratio, although useful, depends on the starting material [43]. The germination index varies with the extraction ratio and sample moisture [44]. Regarding safety, regulatory criteria require maintaining 55 °C for at least three days in in-vessel systems or aerated static piles and for 15 days with five turnings in windrows [45], and their effectiveness depends on the whole mass reaching these conditions [46].
The literature on composting inoculation also shares a design problem. Many trials use a single pile per treatment and treat subsamples as replicates, which constitutes pseudoreplication and yields p-values that are not valid for inferring treatment effects [47]. The interpretation of p-values, and of their lack of significance, requires attention to power and confidence intervals [48,49].
This study examines a factorial trial with guinea pig and pig manure inoculated with yoghurt lactic acid bacteria or with S. cerevisiae in small-scale bins at 2622 m above sea level. The analysis was organised by experimental unit, treated temperature as a repeated measure, distinguished replicated information from single-bin monitoring and expressed the proximate analysis free of the moisture effect. The objective was to estimate the magnitude and precision of the effects of manure type, inoculum type and their interaction on temperature, proximate and elemental composition, electrical conductivity, pH and microbial count, and to describe the weekly dynamics of the process. The working hypothesis was that manure type, through its herbivore or omnivore origin, governs the thermal dynamics and the transformation of organic matter to a greater extent than inoculum type.
2. Materials and Methods
2.1. Study Site
The trial was conducted at the Agroindustrial Complex of the Agroindustry Programme of the Universidad Estatal de Bolívar, Laguacoto II sector (Guaranda–San Simón road, km 1.5), Guaranda canton, Bolívar province, Ecuador (01°36′52″ S; 78°59′54″ W; 2622 m above sea level). The area has a mean temperature of 14.4 °C, with a minimum of 7 °C and a maximum of 21 °C, a mean annual precipitation of 980 mm, a relative humidity of 70%, 900 h yr⁻¹ of sunshine and winds of 5 m s⁻¹. These conditions, with low ambient temperature and constant wind, favour heat and water losses from small composting volumes.
2.2. Raw Materials and Inocula
The main substrates were guinea pig manure and pig manure from local farms. Vegetable solid waste collected at the Guaranda municipal market, rice husk and black soil were used as complementary materials. The vegetable waste was weighed and chopped manually to increase the contact surface before mixing (Figure 1b). The mixtures were formulated to an initial moisture of 50 to 60% and to an initial C/N ratio of 25 in the bins assigned to lactic acid bacteria and 35 in those assigned to S. cerevisiae, so that the starting ratio was equal between substrates within each inoculum.
Two inocula were evaluated. The first was a lactic acid bacteria culture obtained from natural yoghurt containing Lactobacillus delbrueckii subsp. bulgaricus and Streptococcus thermophilus; the second was the yeast Saccharomyces cerevisiae. Each inoculum was prepared as an aqueous suspension, and each bin received 100 mL of the assigned suspension in a single application, mixed with the material when the bin was filled (Figure 1c).
2.3. Characterisation of Raw Materials
The raw materials were characterised before composting. The moisture of fresh samples was determined gravimetrically in a Memmert oven from the mass loss of subsamples of approximately 1 g weighed on a Radwag analytical balance, in two or three crucibles per material. Elemental composition (carbon, hydrogen, nitrogen and sulfur) was determined by instrumental combustion in three determinations per material, with reference to ASTM D5373 [50] and ISO 29541 [51].
2.4. Experimental Design and Bin Management
A completely randomised design with a 2 × 2 factorial arrangement was used. Factor A was manure type (a1, guinea pig; a2, pig) and factor B was inoculum type (b1, lactic acid bacteria; b2, S. cerevisiae). The four resulting treatments were T1 (guinea pig with lactic acid bacteria), T2 (guinea pig with S. cerevisiae), T3 (pig with lactic acid bacteria) and T4 (pig with S. cerevisiae), each with two independent bins, for a total of eight experimental units.
The experimental unit was the bin, each containing approximately 10 kg of fresh mixture. Each bin consisted of a horizontal plastic drum mounted on a wooden frame and fitted with a hand crank, so that the material was turned by rotating the drum (Figure 1a). The bins were managed under aerobic conditions, with turning when the temperature declined after the thermophilic peak and with watering to maintain the working moisture. The process lasted 12 weeks, after which the material was sieved (Figure 1d) and stored.
2.5. Variables and Measurement Methods
Measurements were organised at two levels of replication. At the first level, process and laboratory variables were determined in each of the eight bins at weeks 0 (start), 6 (end of the thermophilic phase) and 12 (end of the trial); these variables were electrical conductivity, temperature, pH, moisture, microbial count, ash, volatile matter, fixed carbon and total carbon. At the second level, the first bin of each treatment was monitored weekly from week 0 to week 12 for temperature, pH, process moisture and C/N ratio, with one value per treatment and week. The weekly temperature readings at weeks 0, 6 and 12 coincide with those of these bins at the first level.
Temperature was measured at the centre of each bin with a stainless-steel probe thermometer. pH was determined in aqueous suspension with a digital meter. Laboratory moisture was obtained by oven drying. The weekly pH and process moisture values are not interchangeable with the laboratory determinations on the same dates, so both records were analysed separately and were not combined. Ash was determined by incineration in a Snol 8.2/1110 muffle furnace (ASTM D3174 and ISO 18122) [52,53], volatile matter by mass loss in an inert atmosphere (ASTM D3175 and ISO 18123) [54,55] and fixed carbon by difference, as 100 minus the sum of moisture, ash and volatile matter (ASTM D3172) [56]. Total carbon was determined by elemental analysis. Electrical conductivity was measured in an aqueous extract. The microbial count was performed by direct microscopic counting after dilution and suspension and is expressed as cells per gram, because the method does not yield colony-forming units.
The sum of moisture, ash, volatile matter and fixed carbon was 100.0% in the eight bins at week 0 and in the means at weeks 6 and 12, indicating that the proximate analysis was expressed on a wet basis. Because moisture decreases during composting, a wet-basis fraction can increase through concentration alone. To separate this effect, the dry-basis fractions, Xd = Xw × 100/(100 − M), and the volatile fraction of organic matter, VM/(VM + FC), which does not depend on moisture, were calculated from the means. Organic matter loss was estimated by ash balance, assuming conservation of the mineral fraction, as 100 × [1 − A₀(100 − A₁)/(A₁(100 − A₀))], where A₀ and A₁ are the dry-basis ash contents at the start and at the date considered [57]. Total carbon, with a mean of 39.0% at week 0, exceeded wet-basis organic matter (36.0%), consistent with its expression on a dry basis.
2.6. Data Management and Quality Control
All measurements were organised in a long-format database with unique identifiers for each bin, variable and date, and each value was linked to the laboratory record sheet from which it originated. Before analysis, the internal consistency of the laboratory calculations was verified from the crucible masses, the sum of the proximate fractions and the correspondence between the values of each bin and its treatment. No value from the experimental units was removed; one fresh-sample moisture determination of black soil was excluded because it exceeded 100%. The database, intermediate calculations and analysis code are provided as Supplementary Materials.
2.7. Statistical Analysis
The analysis was organised in a matrix by objective and variable that defined the unit of analysis, the effective sample size and the applicable model for each case. The variables of each week were analysed with a two-way factorial model, yᵢⱼₖ = μ + αᵢ + βⱼ + (αβ)ᵢⱼ + εᵢⱼₖ, with sum contrasts, eight bins and four error degrees of freedom. For each effect, the difference between levels was estimated with its 95% confidence interval, calculated as d ± t₀.₉₇₅;₄ √(MSE/2), where MSE is the mean square error, together with partial eta squared. At week 0 and for temperature, an exact permutation p-value was also obtained by reassigning the factor labels within the levels of the other factor (36 possible assignments, with a minimum attainable p-value of 0.056).
Temperature at weeks 0, 6 and 12 was analysed as a repeated measure on the same bin. A split-plot-in-time model was fitted in which substrate, inoculum and their interaction were tested against between-bin variation (four degrees of freedom) and week and its interactions against within-bin variation (eight degrees of freedom). Week was treated as a factor because the three dates represent process phases that are not equally spaced in their dynamics, and neither a continuous trend nor a flexible curve can be estimated with three points. Sphericity was assessed with the Greenhouse–Geisser epsilon [58] estimated from the covariance of the residual profiles. As a check, a linear mixed model was fitted by restricted maximum likelihood with a random intercept per bin [59]. Autoregressive correlation or week-specific variance structures were not fitted because they are not identifiable with three time points and eight bins; heterogeneity of variance between weeks was addressed with per-week analyses and with a sensitivity analysis using pooled error and Satterthwaite degrees of freedom. The substrate effect across the three weeks was corrected for multiple comparisons with the Holm method [60], and the week 12 interaction was decomposed into four simple effects, also Holm-corrected.
For the laboratory variables at weeks 6 and 12, the means by substrate, the difference between substrates with its 95% confidence interval and the p-value of the factorial model for each week are reported. The consistency of each analysis was checked by verifying that the F statistic matched the ratio of mean squares and that the substrate sum of squares matched that calculated from the difference in means, 2d².
The weekly series, with one bin per treatment, were summarised by the maximum temperature, the week in which it was reached, the number of weekly readings at or above 45, 50, 52 and 55 °C, the degree-days above 40 and 45 °C calculated by trapezoidal integration, the week from which the C/N ratio remained below 18, 20, 22 and 25, and the pH range. These metrics were not subjected to hypothesis tests because the weekly monitoring did not include replicates per treatment [47].
Assumptions were assessed with studentised residuals, Cook's distance, the Shapiro–Wilk test and the Brown–Forsythe test. With two replicates per cell, the residuals of each cell are symmetrical and these tests have minimal power, so they were interpreted as descriptive diagnostics. No observation was removed. The sensitivity of the conclusions was assessed by treating the replicate as a block, expressing the proximate variables on a dry basis, log-transforming the microbial count and comparing parametric with permutation p-values. For each variable, the minimum detectable difference with a power of 0.80 and α = 0.05 was calculated using the non-central t distribution. Results were interpreted by their magnitude and confidence interval and not only by the 0.05 threshold [48,49]. Calculations were performed in Python 3.13 with statsmodels 0.15 [61] and SciPy 1.18 [62], and the reviewable operations were replicated with formulas in the spreadsheet provided as Supplementary Materials. The analysis code was drafted with the assistance of a generative AI tool and was checked and run by the authors.
3. Results
3.1. Composition of Raw Materials
The moisture of the fresh samples was 71.1 ± 0.8% in guinea pig manure and 70.3 ± 2.5% in pig manure, 79.3 ± 1.7% in vegetable waste and 27.2% in black soil (n = 2), whereas the rice husk was received practically dry (0.8 ± 0.2%). Both manures therefore entered with similar moisture, and the moisture differences between mixtures depended mainly on the proportion of vegetable waste and rice husk.
The elemental composition is summarised in Table 1. Pig manure had the highest nitrogen content (3.84 ± 0.25%) and the lowest C/N ratio (10.0), and guinea pig manure a C/N ratio of 20.7 with 1.62 ± 0.03% nitrogen. Rice husk was the most carbonaceous material (C/N of 69.8), and vegetable waste, with 21.2 ± 2.4% carbon and 1.56 ± 0.40% nitrogen, had a C/N ratio of 14.0. Black soil contributed little carbon (3.0%) and nitrogen (0.28%). The determinations for the two manures, the rice husk and the black soil were repeatable, with coefficients of variation for carbon below 7%, whereas those for vegetable waste showed greater dispersion (coefficient of variation of 11%).
Mean ± standard deviation. C, H, N and S from three instrumental combustion determinations per material. Fresh-sample moisture from three crucibles per material; for black soil, one determination above 100% was excluded (n in parentheses). The C/N ratio was calculated for each determination and then averaged.
3.2. Initial Conditions of the Bins
At week 0, none of the nine variables differed between substrates, between inocula or by their interaction (all p ≥ 0.155; Table 2). The overall means were 4.22 ± 0.24 dS m⁻¹ electrical conductivity, 32.2 ± 1.3 °C temperature, pH 6.85 ± 0.19, 54.9 ± 1.7% moisture, 4.60 ± 0.56 × 10⁶ cells g⁻¹, 9.12 ± 0.60% ash, 32.8 ± 0.8% volatile matter, 3.25 ± 1.72% fixed carbon and 39.0 ± 1.3% total carbon. Permutation p-values agreed in their interpretation with the parametric values, and no conclusion changed when the proximate variables were expressed on a dry basis, the count was log-transformed or the replicate was treated as a block.
Mean ± standard deviation of n = 2 bins per treatment. T1, guinea pig with lactic acid bacteria (LAB); T2, guinea pig with S. cerevisiae; T3, pig with LAB; T4, pig with S. cerevisiae; EC, electrical conductivity; wb, wet basis. p-values from the 2 × 2 factorial model with 1 and 4 degrees of freedom.
The absence of initial differences should be read together with the sensitivity of the design. With four error degrees of freedom, the minimum detectable difference with a power of 0.80 was about 2.7 residual standard deviations, equivalent, for example, to 4.1 °C of temperature, 4.3 points of moisture or 3.9 points of total carbon at week 0. The trial therefore started from comparable conditions within that resolution.
3.3. Temperature at Weeks 0, 6 and 12
Bin temperature rose from 32.2 °C at week 0 to 52.0 °C at week 6 and fell to 21.2 °C at week 12 (Table 3; Figure 2). In the split-plot model, week explained almost all of the variation (F₂,₈ = 2078.6; p < 0.001; Greenhouse–Geisser epsilon 0.77). The overall substrate effect was not significant (F₁,₄ = 5.49; p = 0.079; partial eta squared 0.58), the substrate × week interaction was marginal (F₂,₈ = 3.61; p = 0.076; corrected p = 0.097) and the inoculum had neither a main effect nor an interaction with week (p ≥ 0.57). The mixed model attributed a variance of 0.10 to between-bin variation compared with 0.94 for the residual variance, indicating that most variability occurred within each bin over time.
Means of n = 2 bins per treatment. Guinea pig minus pig difference in °C with a 95% confidence interval based on t with 4 degrees of freedom. p Holm, Holm correction over the three weeks. p permutation, exact value over 36 restricted assignments (minimum attainable 0.056).
The per-week analysis showed that the difference between substrates depended on the process phase. At week 0, guinea pig and pig bins had the same temperature (difference −0.05 °C; 95% CI −3.11 to 3.01). At week 6, guinea pig bins were 2.50 °C warmer (0.93 to 4.07; p = 0.011; Holm p = 0.034), and at week 12 they were 0.75 °C warmer (0.24 to 1.26; p = 0.015; Holm p = 0.034). At week 12, the interaction was significant (p = 0.024) because T1 exceeded T3 by 1.40 °C (0.68 to 2.12; Holm p = 0.023) and T2 by 1.05 °C (0.33 to 1.77; Holm p = 0.047), whereas T2 and T4 did not differ (0.10 °C; Holm p = 0.78).
Two sensitivity results qualify these differences. With the pooled error of the three weeks, the week 6 substrate effect was maintained (p = 0.013), but the week 12 effect was no longer significant (p = 0.34), because the residual variance at week 12 was about 36 times smaller than at week 0. In addition, with only four bins per level, the smallest possible permutation p-value is 0.056, a value reached by the week 6 difference, whereas the week 12 difference obtained 0.167. The thermal difference in the thermophilic phase is therefore the most robust result; that of week 12, although statistically significant in the per-week analysis, is smaller than 1 °C and depends on the variance estimate.
3.4. Laboratory Variables at Weeks 6 and 12
At weeks 6 and 12, the laboratory variables changed with manure type and not with inoculum, except for the microbial count (Table 4; Figure 3).
Means of n = 4 bins per substrate. Guinea pig minus pig difference with a 95% confidence interval calculated as d ± t₀.₉₇₅;₄ √(MSE/2), where MSE is the mean square error of the factorial model of each week. p, substrate effect in that model (1 and 4 degrees of freedom). EC, electrical conductivity; wb, wet basis.
At week 6, guinea pig bins had 2.55 points less moisture (95% CI −4.94 to −0.16) and 2.89 points less volatile matter (−5.34 to −0.44) than pig bins, with non-significant differences in ash, fixed carbon and total carbon. At week 12, guinea pig bins had 3.65 points more ash (2.31 to 4.99), 4.20 points more fixed carbon (1.58 to 6.83), 3.78 points less volatile matter (−7.38 to −0.18) and 3.07 points less total carbon (−5.86 to −0.28). The week 12 moisture difference (−4.07 points) and the electrical conductivity difference (0.74 dS m⁻¹ higher in guinea pig) had intervals that included zero. pH did not differ between substrates or inocula at any date.
Electrical conductivity increased from 4.22 dS m⁻¹ at week 0 to 5.30 at week 6 and 5.90 at week 12, with no effect of the factors.
The inoculum affected only the week 6 microbial count. Bins inoculated with S. cerevisiae had 5.91 × 10⁶ cells g⁻¹ and those inoculated with lactic acid bacteria 2.27 × 10⁶, a difference of 3.64 × 10⁶ (95% CI 2.75 to 4.53; p < 0.001). At week 12, the counts converged (1.47 and 1.33 × 10⁶; p = 0.53), and the overall count fell from 4.60 × 10⁶ at week 0 to 4.09 at week 6 and 1.40 at week 12.
3.5. Proximate Composition on A Dry Basis
Expression on a dry basis changed the reading of the proximate composition (Table 5; Figure 4). Moisture fell from 54.9% at week 0 to 45.6% at week 6 and 35.1% at week 12, and this loss explains part of the increase in the wet-basis fractions. Dry-basis ash rose from 20.2% to 23.4% and 29.6%, instead of 9.1%, 12.8% and 19.2% on a wet basis, and the volatile fraction of organic matter fell from 0.91 to 0.70 and 0.50. At week 12, the volatile fraction was 0.46 in guinea pig manure and 0.54 in pig manure, and dry-basis ash was 31.4% and 27.6%, respectively. With the ash balance, the estimated organic matter loss was 24.5% in guinea pig and 8.7% in pig manure at week 6, and 45.1% and 33.4% at week 12. Applied to total carbon, which was expressed on a dry basis, the same balance indicated carbon losses of 28.0% in guinea pig and 15.9% in pig manure at week 6, and 52.4% and 39.9% at week 12, with a mean of 46.7%. These indices were calculated from the means of each substrate and indicate that the difference between substrates is not an artefact of the different moisture of the bins.
Indices calculated from the means of each substrate and week. db, dry basis; OM, organic matter (volatile matter plus fixed carbon). OM and total carbon (C) losses by ash balance relative to week 0 [57].
3.6. Weekly Process Dynamics
The weekly series, with one bin per treatment, showed a common thermal dynamic (Figure 2; Table 6). The four bins remained below 43 °C until week 3, exceeded 53 °C at week 4 and peaked at week 5 (T1, T2 and T3) or week 4 (T4). The maximum temperature was 56.5 °C in T1, 54.8 °C in T3, 54.7 °C in T2 and 53.8 °C in T4. Only one weekly reading, that of T1 at week 5, reached 55 °C. Bins T1, T2 and T4 recorded four weekly readings at or above 45 °C and T3 three; degree-days above 45 °C were 209 in T1, 202 in T2, 169 in T3 and 167 in T4. Between weeks 7 and 8, temperature dropped by 17 to 23 °C in the four bins, and from week 9 it remained between 20.5 and 23.4 °C, above the mean air temperature.
One bin per treatment with weekly readings; no statistical inference. Degree-days by trapezoidal integration above 45 °C. Week C/N < 20, week from which the ratio remained below 20. pp, percentage points.
The pH of the series fell at week 1 to 5.4 in T1, 5.1 in T2, 6.0 in T3 and 5.6 in T4, recovered between weeks 3 and 5 to a maximum of 7.2 to 7.7 and remained between 6.3 and 6.8 from week 7 (Figure 5a). The range was 2.5 units in T2, 2.1 in T4, 1.8 in T1 and 1.4 in T3. Process moisture decreased continuously by 10 to 13 points in the four bins, ending at 45.2% in the guinea pig bins and at 48.3 and 49.0% in the pig bins (Figure 5c).
The C/N ratio of the series started at 25 in the bins with lactic acid bacteria and at 35 in those inoculated with S. cerevisiae, and fell to 15.4 in T1, 16.1 in T3, 17.0 in T2 and 18.6 in T4 (Figure 5b). With a threshold of 20, the ratio remained below it from week 7 in T1, week 9 in T3, week 11 in T2 and week 12 in T4. The order of these weeks changed with the chosen threshold: with 22 it was 6, 7, 9 and 9 weeks, and with 18 only T1, T2 and T3 met the criterion. The starting difference between inoculum groups coincides with the difference in time to the threshold.
4. Discussion
4.1. Thermal Dynamics and Manure Type
The main finding is that process differences were associated with manure type and not with inoculum type, although their magnitude and precision call for nuance. The thermal difference of 2.5 °C at week 6 has an interval that excludes zero and a large effect size, although the repeated-measures model did not detect an overall substrate effect and the substrate × week interaction was borderline. The most consistent reading is that guinea pig manure did not heat more from the outset but sustained a somewhat higher temperature towards the end of the thermophilic phase. This pattern is compatible with a greater availability of degradable substrate in the guinea pig mixture or with a more porous structure that facilitates aeration, explanations that measurements of porosity, bulk density, oxygen uptake and labile carbon fractions would allow to be distinguished.
Comparison with other studies requires attention to scale. The maximum temperature recorded, 53.8 to 56.5 °C, is lower than the peaks of 60 to 70 °C common in larger piles or reactors. In windrows of horticultural residues with poultry manure and sawdust in the Ecuadorian highlands, the temperature exceeded 55 °C for more than two weeks [2]. Small composting volumes lose heat through the surface more rapidly, and in Guaranda the mean air temperature of 14.4 °C and the constant wind accentuate this loss. The rapid fall in temperature between weeks 7 and 8 in the four bins suggests that the material available to sustain the thermophilic phase was depleted, or that moisture fell below the range that maintains aerobic activity, since the laboratory moisture at week 12 was 35%, below the minimum of 50% associated with high respiratory activity in other matrices [19].
The difference between manures agrees with evidence that the herbivore or omnivore origin of the excreta conditions the chemical and microbial composition of compost [15]. In that study, herbivore composts had higher total carbon and C/N ratio, whereas in the present trial guinea pig manure ended with less total carbon. This apparent discrepancy can be explained by the mixture and the scale, since here the manure was combined with vegetable waste, rice husk and soil, and because total carbon decreases as organic matter is mineralised. Because the formulation equalised the initial C/N ratio between substrates, the pig manure mixture, with a manure C/N ratio of 10.0 compared with 20.7 for guinea pig, required a higher proportion of carbonaceous material to reach the same starting value. This difference in structure and in the origin of carbon, rather than the overall C/N ratio, is the most likely explanation for the different degradation, consistent with the influence of the mixture on the degradation of pig manure [16].
Moisture helps to interpret the thermal difference between substrates. The guinea pig bins, which maintained a higher temperature at week 6, also had 2.55 points less moisture on that date, and the difference widened to 4.07 points at week 12. This pattern is expected when the heat generated by microbial activity increases evaporation, so that water loss acts as an indirect indicator of process intensity and not only as a consequence of the climate. Moisture in turn conditions microbial activity, which in composting materials decreases when the water content departs from the optimum range [19], and in spent pig-manure sawdust litter microbial activity varied with the initial moisture content [21]. Moisture, C/N ratio and aeration act jointly on compost stability and maturity [17,18]. In small bins exposed to wind and high-altitude radiation, replenishing water during the thermophilic phase could prolong activity and improve degradation, a simple practice that would be worth evaluating experimentally.
The scale of the bins and the high-altitude climate deserve specific consideration because they condition the comparison with the literature. The heat balance of a pile depends on the relationship between heat production from degradation, proportional to volume, and losses through the surface, proportional to the exposed area. In small bins this relationship is unfavourable, and a mean ambient temperature of 14.4 °C with winds of 5 m s⁻¹ increases convective and evaporative losses. This mechanism, although not measured in the trial, is consistent with the four bins reaching weekly peaks of 54 to 57 °C rather than the 60 to 70 °C frequent in windrows and reactors. It is also consistent with the simultaneous fall in temperature at weeks 7 and 8, with the moisture loss of 20 points between weeks 0 and 12 and with the final temperature of 20 to 23 °C remaining about 6 to 9 °C above the mean air temperature. In the Andean region, the evaluation of aeration systems for co-composting agricultural and livestock residues showed that passive aeration reduced the time and labour of the process [1], an option that could be combined with a larger composting volume to conserve heat.
In composting material from pig production facilities, the effects of season and turning frequency have been evaluated [63]. In the beef cattle feedlots of southern Alberta, Canada, composting has been reviewed as a large-scale manure management alternative [64]. These references suggest that recommendations derived from large piles need to be adapted before being applied to high-altitude household bins.
Information on guinea pig manure as a composting substrate remains scarce and heterogeneous. Guinea pig excreta from one farm contained 3.42% nitrogen [11], higher than the 1.62% measured in this trial, and another study reported 2.84% nitrogen and a C/N ratio of 11.1 in manure from caged guinea pigs [12], much lower than the ratio of 20.7 measured here. These differences are to be expected, because the nitrogen content of manure depends on diet, the proportion of forage and the amount of bedding mixed with the excreta, and guinea pig manure collected from pens usually includes forage residues that raise its carbon content. In practice, the heterogeneity of guinea pig manure implies that mixture formulation should be based on the analysis of each batch rather than on literature values. The finding that the incorporation of guinea pig manure can increase the concentration of some metals in compost [12] adds a reason to characterise the final product before agricultural use.
4.2. Basis of Expression and Organic Matter Loss
The second finding is methodological and changes the interpretation of the composition results. Because the proximate analysis was expressed on a wet basis, the decrease in moisture during the process causes ash and fixed carbon to increase even if no organic matter is lost. In this trial, moisture fell by almost 20 points between weeks 0 and 12, and wet-basis ash doubled, whereas dry-basis ash increased proportionally less. Conversion to a dry basis and the use of the volatile fraction of organic matter, which does not depend on moisture, show that the transformation was real: the volatile fraction fell from 0.91 to 0.50 and the organic matter loss estimated by ash balance averaged 40% at week 12. The ash balance method, which assumes conservation of the mineral fraction, is widely used to estimate organic matter losses in composting [57] and allows substrates with different moisture contents to be compared.
With this correction, the difference between manures remains. By week 12, guinea pig manure had lost 45% of its organic matter and pig manure 33%, and the residual volatile fraction was lower in guinea pig manure. The moisture difference between substrates at week 12 (4.1 points) is not sufficient to explain the difference in wet-basis ash, and on a dry basis the difference persists (31.4 versus 27.6%). The conclusion that guinea pig manure reached a more advanced mineralisation is consistent with its lower volatile matter and lower total carbon, whose differences from pig manure had confidence intervals that excluded zero.
Fixed carbon deserves an additional caveat. Calculated by difference, it accumulates the errors of the other three fractions, and its interpretation as stable or humified carbon is not straightforward in complex organic materials. The increase in fixed carbon from 3.3% to 22.8% on a wet basis, or from 7.2% to 35.2% on a dry basis, indicates that the fraction that is non-volatile at the test temperature increased, which is consistent with the humification described in pig manure compost [65], but it is not equivalent to a measurement of humic substances. Indicators such as the soluble carbon to nitrogen ratio, humic fractions or dehydrogenase activity provide more specific evidence of stabilisation [66,67].
The carbon loss estimated by the same balance confirms the order of the substrates. By week 12, guinea pig manure had lost 52% of its carbon and pig manure 40%, values close to the organic matter losses and with the same difference between manures, indicating that the greater mineralisation of guinea pig manure does not depend on a single analytical determination. Carbon loss was somewhat greater than organic matter loss, a difference that may arise because volatile matter and total carbon were obtained by different methods and because the elemental composition of organic matter changes during the process. The magnitude of carbon losses in manure composting depends on the carbon source supplied by the bulking material [22], and the ash balance allows them to be compared between mixtures with different moisture contents [57]. In practical terms, the greater carbon loss of guinea pig manure implies a more mineralised product but also lower carbon retention per unit of manure treated, a trade-off to be considered when the compost is valued as an organic soil amendment.
4.3. Inocula and Microbial Dynamics
The third finding is the absence of an effect of inoculum type on the physicochemical variables, with the exception of the week 6 microbial count. This result agrees with the heterogeneity of the evidence on inoculation, since the meta-analysis by Nigussie et al. [39] found positive mean effects on lignocellulose degradation and humification but marginal effects on bioavailable nutrients and a publication bias towards larger effects. Nor did the two inocula differ in thermal dynamics, suggesting that, under the conditions of the trial, the manure microbiota and the structure of the mixture weighed more than the added organism.
The size of the inoculum relative to the native microbiota helps to explain the lack of effect. The effectiveness of an acid-degrading yeast depends on its survival until the accumulated acids are consumed, which does not occur if the pile exceeds 60 °C [32], and manure provides an abundant microbial community that competes with the added organisms. When the starting material is not acidified, the benefit of an inoculum that consumes organic acids is smaller, because the acidic phase that it shortens is brief. The studies that demonstrated clear effects of S. cerevisiae or Pichia kudriavzevii used acidified food waste, with an initial pH of 4.5 or added acids [31,33], whereas here the starting pH was 6.85.
The fall in pH at week 1 of the weekly monitoring, to 5.1 in T2 and 5.4 in T1, shows that a brief acidic phase did occur, and its recovery between weeks 3 and 5 preceded the thermal peak. This sequence of events is expected when initial acidification delays the transition to the thermophilic phase [27] and is resolved by acid consumption and ammonium release. In the weekly monitoring, the pH range was greatest in the bins with S. cerevisiae and smallest in T3.
The week 6 microbial count was higher in the bins inoculated with S. cerevisiae. This result is not expected if the yeast had dominated the community, because the inoculated yeast dies when the pile reaches thermophilic temperatures [31,32] and the mean temperature at week 6 was 52 °C. However, direct microscopic counting does not distinguish live from dead cells or bacteria from yeasts, and in a compost at 52 °C most of the cells counted will be thermophilic bacteria. The most prudent explanation is that the total count reflects accumulated cell biomass and not the survival of the inoculum. In acidified food waste, S. cerevisiae favoured the proliferation of thermophilic bacteria such as Bacillus and Thermobifida during the hot phase [33], a mechanism that could explain the higher count and that identification of the counted organisms would allow to be confirmed. The convergence of the counts at week 12 coincides with the general decline in temperature and moisture during maturation.
Yoghurt lactic acid bacteria have a weak rationale as an inoculum for thermophilic manure composting. They are mesophilic or moderately thermotolerant, produce lactic acid from soluble sugars that manure contains in low proportion and are part of the early microbiota associated with acidic phases [30,36]. In the background review by Song et al. [34], the favourable effect of a lactic acid bacterium on food waste degradation is described as indirect, mediated by the stimulation of fungi that consume organic acids. In this trial, the bins with lactic acid bacteria did not differ from those inoculated with yeast in temperature, pH, moisture or composition, and the earlier stabilisation of the C/N ratio in T1 and T3 coincides with their lower starting C/N ratio.
The microbial succession of manure composting has been described in detail by amplicon sequencing and metagenomics, which show shifts in dominance linked to temperature and to the chemical composition of the material [68]. Some functional groups, such as humic-reducing microorganisms, are associated with the physicochemical parameters of each phase [69], and inoculation with a compost-derived thermophilic consortium accelerated humification and modified microbial diversity [70]. The addition of mature compost as an inoculum increased the accumulated temperature, raised the germination index to 75.4% and reduced the proportion of potential pathogens in pig manure reactors [71]. These results indicate that the most effective inoculum is often a community adapted to composting rather than a food-grade microorganism. In a 1 m³ composter with an initial C/N ratio of 30, two inocula, one of effective microorganisms and one commercial, improved process efficiency compared with a control, and bacterial and actinobacterial populations exceeded those of yeasts and filamentous fungi throughout the process [72]. None of these studies used yoghurt bacteria as an inoculum.
Controlling pH at the start of the process is another way of resolving the acidic phase without inoculation. pH control has been studied as a means of modifying the composting of household garbage [73], and aeration and mixing strategies have been proposed to reduce short-chain organic acids and rapidly establish high-rate degradation [74]. In the manures evaluated here, the near-neutral initial pH and the short duration of the acidic phase suggest that the scope for improvement by an acid-consuming inoculum was limited from the outset.
4.4. Ph, Maturity and Sanitisation
The laboratory determinations complete the pH trajectory in the advanced phases. The week 6 pH, with a mean of 8.00, is compatible with ammonium release during the thermophilic phase, and its decline to 7.32 at week 12 is consistent with the nitrification that begins when the temperature falls below 40 °C, a process that lowers pH and increases electrical conductivity [75]. Neither date showed pH differences between substrates or inocula, indicating that alkalinisation and subsequent acidification followed the same course in the four treatments. The initial trajectory is described by the weekly monitoring and the comparison between factors by the laboratory data, without combining both sources.
Regarding maturity, a C/N ratio below 20 has been proposed as an indicator of mature compost, but its value depends on the starting material and is not sufficient on its own [42,43]. In this trial, the initial C/N ratio differed between inoculum groups, with 25 in the bins with lactic acid bacteria and 35 in those inoculated with S. cerevisiae. The weeks to the threshold changed order when 18, 20, 22 or 25 was used, and the earlier stabilisation of the bins with lactic acid bacteria coincides with their lower starting ratio. For these reasons, the C/N ratio was not used to compare the treatments by their time to maturity.
Temperature and moisture in the final phase provide indirect evidence of stability, since the temperature remained between 20 and 23 °C from week 9 and did not rise again after turning. However, a temperature close to ambient may also be due to a material too dry to sustain activity, as suggested by the laboratory moisture of 35% at week 12. Distinguishing a stable compost from one that is inactive because of water shortage requires a respiration or self-heating test after rewetting the material [42]. The increase in electrical conductivity to 5.9 dS m⁻¹ at week 12 is consistent with the concentration of salts that accompanies organic matter mineralisation and the progress of nitrification [75]. Soluble salts in compost have been associated with negative effects on germination and growth, so application rates should be adjusted to the crop [76].
Sanitisation cannot be asserted either. Time–temperature criteria for compost derived from pathogen-bearing waste require 55 °C for at least three days in in-vessel systems or aerated static piles and for 15 days with five turnings in windrows [45]. In this trial, only one weekly reading of one bin reached 55 °C, so no treatment demonstrated persistence at that temperature or its attainment throughout the mass, two conditions necessary for pathogen inactivation [46]. Even when thermal criteria are met, some pathogens may persist or regrow, and their presence in composting bioaerosols has been documented by culture-based and metagenomic methods [77]. Product safety therefore requires direct analysis of indicators such as Escherichia coli and Salmonella.
Assessing maturity from several variables is more robust than relying on a single indicator. In cattle manure composted at industrial scale, chemical, microbiological and biochemical parameters made it possible to distinguish stability from maturity [78], and the comparison of wastes of different origin showed that chemical and biological changes during composting depend on the material [79]. Even for finished composts from different sources, it has been questioned whether stability and maturity can be assessed with the same set of tests [80]. Maturity parameters and heavy metal contents have also been evaluated in composts from different animal manures [81], reinforcing the need to characterise each product. In spent pig-manure sawdust litter compost, phytotoxicity disappeared during co-composting [82], but this trajectory was demonstrated with bioassays, not with the C/N ratio. For this reason, the results of this trial describe the transformation of organic matter and not the maturity of the product.
4.5. Implications for the Design of Small-Scale Composting Trials
From an applied standpoint, the results suggest that, in small high-altitude bins, the choice and proportion of manure and bulking agent carry more weight than the type of low-cost inoculum. This conclusion agrees with evidence that mixture, C/N ratio and aeration govern the rate and quality of pig manure composting [16,17] and with the finding that the incorporation of leaves shortened the maturation of pig manure from 49 to 35 days [83]. For smallholders, increasing the composting volume or protecting the bins from wind and regulating moisture during the thermophilic phase would be interventions with stronger support than the addition of yoghurt or yeast. This inference, however, comes from the literature and not from a comparison made in this trial.
For research, the trial illustrates three requirements that would improve the quality of the evidence on composting inocula. The first is to include an uninoculated control and apply defined doses of viable cells, because without them the effectiveness of the inoculum cannot be estimated [39]. The second is to treat the bin as the experimental unit, record each variable per bin at each date and analyse time as a repeated measure, instead of comparing the monitoring of a single pile [47]. The third is to express composition on a dry basis, measure maturity with combined biological and chemical indicators and record temperature daily or continuously [42,44].
The results of this work differ from those that would have been obtained with the analysis common in the literature of the field, and this difference has methodological value. Had the weekly series of one bin per treatment been treated as replicates over time, the higher temperature of T1 at week 5 and its lower C/N ratio would have been presented as inoculum effects. That interpretation confounds variation between bins with the treatment effect, because with a single bin there is no estimate of experimental error [47]. Similarly, comparing the time to a C/N ratio of 20 between treatments that started at 25 and 35 attributes to the inoculum a difference that depends on the formulation. Analysis by bin, treatment of temperature as a repeated measure and the reporting of confidence intervals produce more modest but also more reproducible conclusions, and allow other authors to reuse the variance estimates to plan trials with adequate power.
The variance estimate obtained here is of practical use for that purpose. With the residual variance of temperature at week 6, a difference of 1 °C between two treatments would require about ten bins per level to be detected with a power of 0.80, and for laboratory moisture at week 12 the minimum detectable difference with two bins per treatment was 7 points. These figures indicate that inoculation trials in small bins need more replicates than usual to estimate effects of the magnitude that the literature attributes to inocula.
5. Conclusions
In small-scale bins at 2622 m above sea level, manure type was associated with the process differences, whereas inoculum type did not modify any physicochemical variable. The guinea pig manure bins maintained a temperature 2.5 °C higher at the end of the thermophilic phase and, at 12 weeks, had more ash and fixed carbon, less volatile matter and total carbon, and an estimated organic matter loss of 45% compared with 33% for pig manure. The inoculum modified only the total microbial count at week 6.
Expressing the proximate analysis on a dry basis and applying the ash balance were necessary to separate mineralisation from concentration by drying. No bin met a sanitisation criterion, and the C/N ratio does not allow a time to maturity to be established because it started from different values between inoculum groups. The effectiveness of yoghurt lactic acid bacteria and S. cerevisiae against the native microbiota should be evaluated with an uninoculated control, defined cell doses, more replicates per treatment and biological indicators of maturity and safety.
Supplementary Materials
The supplementary information can be downloaded at the website of this paper posted on Preprints.org: Workbook S1, per-bin data at weeks 0, 6 and 12, ANOVA tables and factor means for weeks 6 and 12, weekly monitoring series, raw material composition and data dictionary; Workbook S2, statistical analyses, diagnostics, sensitivity analyses, minimum detectable differences, figure provenance and the complete analysis code, which reproduces all results from Workbook S1.
Author Contributions
Conceptualisation, O.M.Q.; methodology, J.A.G.C.; formal analysis, O.M.Q.; investigation, D.A.M.V., J.F.V.B., E.C.C.R. and M.I.P.V.; resources, J.A.G.C.; data curation, D.A.M.V., J.F.V.B., E.C.C.R. and M.I.P.V.; writing (original draft preparation), O.M.Q.; writing (review and editing), O.M.Q.; visualisation, O.M.Q.; supervision, J.A.G.C. All authors have read and agreed to the published version of the manuscript.
Funding
This research received no external funding.
Institutional Review Board Statement
Not applicable.
Informed Consent Statement
Not applicable.
Data Availability Statement
The data supporting this study, the intermediate calculations and the analysis code are provided in the Supplementary Materials.
Acknowledgments
During the preparation of this manuscript, the authors used Claude (Anthropic) for assistance with the statistical analysis code, the preparation of figures and the drafting and translation of the text. The authors have reviewed and edited the output and take full responsibility for the content of this publication.
Conflicts of Interest
The authors declare no conflicts of interest.
References
- Valverde-Orozco, V.; Gavilanes-Terán, I.; Idrovo-Novillo, J.; Carrera-Beltrán, L.; Buri-Tanguila, S.; Salazar-García, K.; Paredes, C. Characterization of agro-livestock wastes for composting in rural zones in Ecuador: The case of the parish of San Andrés. Agronomy 2022, 12, 2538. [Google Scholar] [CrossRef]
- Gavilanes-Terán, I.; Jara-Samaniego, J.; Idrovo-Novillo, J.; Bustamante, M.A.; Moral, R.; Paredes, C. Windrow composting as horticultural waste management strategy – A case study in Ecuador. Waste Manag. 2016, 48, 127–134. [Google Scholar] [CrossRef] [PubMed]
- Jara-Samaniego, J.; Pérez-Murcia, M.D.; Bustamante, M.A.; Paredes, C.; Pérez-Espinosa, A.; Gavilanes-Terán, I.; López, M.; Marhuenda-Egea, F.C.; Brito, H.; Moral, R. Development of organic fertilizers from food market waste and urban gardening by composting in Ecuador. PLoS ONE 2017, 12, e0181621. [Google Scholar] [CrossRef] [PubMed]
- de Bertoldi, M.; Vallini, G.; Pera, A. The biology of composting: A review. Waste Manag. Res. 1983, 1, 157–176. [Google Scholar] [CrossRef]
- Diaz, L.F.; Savage, G.M. Factors that affect the process. Waste Manag. Ser. 2007, 8, 49–65. [Google Scholar] [CrossRef]
- Cerda, A.; Artola, A.; Font, X.; Barrena, R.; Gea, T.; Sánchez, A. Composting of food wastes: Status and challenges. Bioresour. Technol. 2018, 248, 57–67. [Google Scholar] [CrossRef] [PubMed]
- Gajalakshmi, S.; Abbasi, S.A. Solid waste management by composting: State of the art. Crit. Rev. Environ. Sci. Technol. 2008, 38, 311–400. [Google Scholar] [CrossRef]
- Ayilara, M.S.; Olanrewaju, O.S.; Babalola, O.O.; Odeyemi, O. Waste management through composting: Challenges and potentials. Sustainability 2020, 12, 4456. [Google Scholar] [CrossRef]
- Onwosi, C.O.; Igbokwe, V.C.; Odimba, J.N.; Eke, I.E.; Nwankwoala, M.O.; Iroh, I.N.; Ezeogu, L.I. Composting technology in waste stabilization: On the methods, challenges and future prospects. J. Environ. Manag. 2017, 190, 140–157. [Google Scholar] [CrossRef] [PubMed]
- Azim, K.; Soudi, B.; Boukhari, S.; Perissol, C.; Roussos, S.; Thami Alami, I. Composting parameters and compost quality: A literature review. Org. Agric. 2018, 8, 141–158. [Google Scholar] [CrossRef]
- Murray-Núñez, R.; Orozco-Benítez, G.; Martínez-Orozco, S.; Avila-Ramos, F.; Bautista-Trujillo, G.; Carmona-Gasca, C.; Martínez-González, S. Composición química de excremento entero, composta y lixiviado de la cama de cuyes (Cavia porcellus) [Chemical composition of whole excreta, compost and leachate from guinea pig (Cavia porcellus) bedding]. Abanico Agrofor. (In Spanish) 2023, 5, e2022-12. [Google Scholar] [CrossRef]
- Ortiz-Dongo, L.F.; Mendez-Revollar, Y.; Solórzano-Acosta, R.; Lastra, S.; Carrión-Carrera, G. Compost quality optimization through Plackett-Burman's design. Int. J. Recycl. Org. Waste Agric. 2025, 14, 142508. [Google Scholar] [CrossRef]
- Imbeah, M. Composting piggery waste: A review. Bioresour. Technol. 1998, 63, 197–203. [Google Scholar] [CrossRef]
- Matiz-Villamil, A.; Méndez-Carranza, K.J.; Pascagaza-Pulido, A.F.; Rendón-Rendón, T.; Noriega-Noriega, J.; Pulido-Villamarín, A. Trends in the management of organic swine farm waste by composting: A systematic review. Heliyon 2023, 9, e18208. [Google Scholar] [CrossRef] [PubMed]
- Wan, J.; Wang, X.; Yang, T.; Wei, Z.; Banerjee, S.; Friman, V.-P.; Mei, X.; Xu, Y.; Shen, Q. Livestock manure type affects microbial community composition and assembly during composting. Front. Microbiol. 2021, 12, 621126. [Google Scholar] [CrossRef] [PubMed]
- Huang, G.F.; Wong, J.W.C.; Wu, Q.T.; Nagar, B.B. Effect of C/N on composting of pig manure with sawdust. Waste Manag. 2004, 24, 805–813. [Google Scholar] [CrossRef] [PubMed]
- Guo, R.; Li, G.; Jiang, T.; Schuchardt, F.; Chen, T.; Zhao, Y.; Shen, Y. Effect of aeration rate, C/N ratio and moisture content on the stability and maturity of compost. Bioresour. Technol. 2012, 112, 171–178. [Google Scholar] [CrossRef] [PubMed]
- Tang, R.; Liu, Y.; Ma, R.; Zhang, L.; Li, Y.; Li, G.; Lin, J.; Li, Q.; Yuan, J. Effect of moisture content, aeration rate, and C/N on maturity and gaseous emissions during kitchen waste rapid composting. J. Environ. Manag. 2023, 326, 116662. [Google Scholar] [CrossRef] [PubMed]
- Liang, C.; Das, K.C.; McClendon, R.W. The influence of temperature and moisture contents regimes on the aerobic microbial activity of a biosolids composting blend. Bioresour. Technol. 2003, 86, 131–137. [Google Scholar] [CrossRef] [PubMed]
- Zhu, N.W. Composting of high moisture content swine manure with corncob in a pilot-scale aerated static bin system. Bioresour. Technol. 2006, 97, 1870–1875. [Google Scholar] [CrossRef] [PubMed]
- Tiquia, S.M.; Tam, N.F.Y.; Hodgkiss, I.J. Microbial activities during composting of spent pig-manure sawdust litter at different moisture contents. Bioresour. Technol. 1996, 55, 201–206. [Google Scholar] [CrossRef]
- Barrington, S.; Choinière, D.; Trigui, M.; Knight, W. Effect of carbon source on compost nitrogen and carbon losses. Bioresour. Technol. 2002, 83, 189–194. [Google Scholar] [CrossRef] [PubMed]
- Eklind, Y.; Kirchmann, H. Composting and storage of organic household waste with different litter amendments. II: Nitrogen turnover and losses. Bioresour. Technol. 2000, 74, 125–133. [Google Scholar] [CrossRef]
- Shen, Y.; Ren, L.; Li, G.; Chen, T.; Guo, R. Influence of aeration on CH4, N2O and NH3 emissions during aerobic composting of a chicken manure and high C/N waste mixture. Waste Manag. 2011, 31, 33–38. [Google Scholar] [CrossRef] [PubMed]
- Gao, M.; Liang, F.; Yu, A.; Li, B.; Yang, L. Evaluation of stability and maturity during forced-aeration composting of chicken manure and sawdust at different C/N ratios. Chemosphere 2010, 78, 614–619. [Google Scholar] [CrossRef] [PubMed]
- Cheung, H.N.B.; Huang, G.H.; Yu, H. Microbial-growth inhibition during composting of food waste: Effects of organic acids. Bioresour. Technol. 2010, 101, 5925–5934. [Google Scholar] [CrossRef] [PubMed]
- Sundberg, C.; Smårs, S.; Jönsson, H. Low pH as an inhibiting factor in the transition from mesophilic to thermophilic phase in composting. Bioresour. Technol. 2004, 95, 145–150. [Google Scholar] [CrossRef] [PubMed]
- Smårs, S.; Gustafsson, L.; Beck-Friis, B.; Jönsson, H. Improvement of the composting time for household waste during an initial low pH phase by mesophilic temperature control. Bioresour. Technol. 2002, 84, 237–241. [Google Scholar] [CrossRef] [PubMed]
- Sundberg, C.; Jönsson, H. Process inhibition due to organic acids in fed-batch composting of food waste – influence of starting culture. Biodegradation 2005, 16, 205–213. [Google Scholar] [CrossRef] [PubMed]
- Sundberg, C.; Yu, D.; Franke-Whittle, I.; Kauppi, S.; Smårs, S.; Insam, H.; Romantschuk, M.; Jönsson, H. Effects of pH and microbial composition on odour in food waste composting. Waste Manag. 2013, 33, 204–211. [Google Scholar] [CrossRef] [PubMed]
- Nakasaki, K.; Araya, S.; Mimoto, H. Inoculation of Pichia kudriavzevii RB1 degrades the organic acids present in raw compost material and accelerates composting. Bioresour. Technol. 2013, 144, 521–528. [Google Scholar] [CrossRef] [PubMed]
- Nakasaki, K.; Hirai, H. Temperature control strategy to enhance the activity of yeast inoculated into compost raw material for accelerated composting. Waste Manag. 2017, 65, 29–36. [Google Scholar] [CrossRef] [PubMed]
- Yi, P.; Li, Q.; Zhou, X.; Liang, R.; Ding, X.; Wu, M.; Wang, K.; Li, J.; Wang, W.; Lu, G.; Zhu, T. Inoculation of Saccharomyces cerevisiae for facilitating aerobic composting of acidified food waste. Environ. Sci. Pollut. Res. 2024, 31, 55507–55521. [Google Scholar] [CrossRef] [PubMed]
- Song, C.; Zhang, Y.; Xia, X.; Qi, H.; Li, M.; Pan, H.; Xi, B. Effect of inoculation with a microbial consortium that degrades organic acids on the composting efficiency of food waste. Microb. Biotechnol. 2018, 11, 1124–1136. [Google Scholar] [CrossRef] [PubMed]
- Mironov, V.; Zhukov, V.; Efremova, K.; Brinton, W.F. Enhancing aerobic composting of food waste by adding hydrolytically active microorganisms. Front. Microbiol. 2024, 15, 1487165. [Google Scholar] [CrossRef] [PubMed]
- Partanen, P.; Hultman, J.; Paulin, L.; Auvinen, P.; Romantschuk, M. Bacterial diversity at different stages of the composting process. BMC Microbiol. 2010, 10, 94. [Google Scholar] [CrossRef] [PubMed]
- Jiang, H.; Zhang, Y.; Cui, R.; Ren, L.; Zhang, M.; Wang, Y. Effects of two different proportions of microbial formulations on microbial communities in kitchen waste composting. Microorganisms 2023, 11, 2605. [Google Scholar] [CrossRef] [PubMed]
- Lee, J.; Choi, H.S.; Le, T.Y.L.; Hwang, S.-G. Temporal nutrient and microbial functional dynamics in a cattle manure composting system inoculated with Lactobacillus acidophilus. Appl. Sci. 2025, 15, 12969. [Google Scholar] [CrossRef]
- Nigussie, A.; Dume, B.; Ahmed, M.; Mamuye, M.; Ambaw, G.; Berhiun, G.; Biresaw, A.; Aticho, A. Effect of microbial inoculation on nutrient turnover and lignocellulose degradation during composting: A meta-analysis. Waste Manag. 2021, 125, 220–234. [Google Scholar] [CrossRef] [PubMed]
- Aguilar-Paredes, A.; Valdés, G.; Araneda, N.; Valdebenito, E.; Hansen, F.; Nuti, M. Microbial community in the composting process and its positive impact on the soil biota in sustainable agriculture. Agronomy 2023, 13, 542. [Google Scholar] [CrossRef]
- Finore, I.; Feola, A.; Russo, L.; Cattaneo, A.; Di Donato, P.; Nicolaus, B.; Poli, A.; Romano, I. Thermophilic bacteria and their thermozymes in composting processes: A review. Chem. Biol. Technol. Agric. 2023, 10, 7. [Google Scholar] [CrossRef]
- Wichuk, K.M.; McCartney, D. Compost stability and maturity evaluation — a literature review. Can. J. Civ. Eng. 2010, 37, 1505–1523. [Google Scholar] [CrossRef]
- Bernal, M.P.; Alburquerque, J.A.; Moral, R. Composting of animal manures and chemical criteria for compost maturity assessment. A review. Bioresour. Technol. 2009, 100, 5444–5453. [Google Scholar] [CrossRef] [PubMed]
- Kong, Y.; Zhang, J.; Yang, Y.; Liu, Y.; Zhang, L.; Wang, G.; Liu, G.; Dang, R.; Li, G.; Yuan, J. Determining the extraction conditions and phytotoxicity threshold for compost maturity evaluation using the seed germination index method. Waste Manag. 2023, 171, 502–511. [Google Scholar] [CrossRef] [PubMed]
- U.S. Environmental Protection Agency. Appendix B to Part 503—Pathogen Treatment Processes. Federal Register 58 FR 9387; Standards for the Use or Disposal of Sewage Sludge. 40 C.F.R. Part 503; U.S. EPA: Washington, DC, USA, 1993. [Google Scholar]
- Wichuk, K.M.; McCartney, D. A review of the effectiveness of current time–temperature regulations on pathogen inactivation during composting. J. Environ. Eng. Sci. 2007, 6, 573–586. [Google Scholar] [CrossRef]
- Hurlbert, S.H. Pseudoreplication and the design of ecological field experiments. Ecol. Monogr. 1984, 54, 187–211. [Google Scholar] [CrossRef]
- Greenland, S.; Senn, S.J.; Rothman, K.J.; Carlin, J.B.; Poole, C.; Goodman, S.N.; Altman, D.G. Statistical tests, P values, confidence intervals, and power: A guide to misinterpretations. Eur. J. Epidemiol. 2016, 31, 337–350. [Google Scholar] [CrossRef] [PubMed]
- Wasserstein, R.L.; Lazar, N.A. The ASA's statement on p-values: Context, process, and purpose. Am. Stat. 2016, 70, 129–133. [Google Scholar] [CrossRef]
- ASTM D5373-21; Standard Test Methods for Determination of Carbon, Hydrogen and Nitrogen in Analysis Samples of Coal and Carbon in Analysis Samples of Coal and Coke. ASTM International: West Conshohocken, PA, USA, 2021.
- ISO 29541:2010; Solid Mineral Fuels—Determination of Total Carbon, Hydrogen and Nitrogen Content—Instrumental Method. International Organization for Standardization: Geneva, Switzerland, 2010.
- ASTM D3174-12(2018)e1; Standard Test Method for Ash in the Analysis Sample of Coal and Coke from Coal; ASTM International. West Conshohocken, PA, USA, 2018.
- ISO 18122:2022; Solid Biofuels—Determination of Ash Content. International Organization for Standardization: Geneva, Switzerland, 2022.
- ASTM D3175-20; Standard Test Method for Volatile Matter in the Analysis Sample of Coal and Coke. ASTM International: West Conshohocken, PA, USA, 2020.
- ISO 18123:2023; Solid Biofuels—Determination of Volatile Matter. International Organization for Standardization: Geneva, Switzerland, 2023.
- ASTM D3172-13(2021)e1; Standard Practice for Proximate Analysis of Coal and Coke; ASTM International. West Conshohocken, PA, USA, 2021.
- Paredes, C.; Roig, A.; Bernal, M.P.; Sánchez-Monedero, M.A.; Cegarra, J. Evolution of organic matter and nitrogen during co-composting of olive mill wastewater with solid organic wastes. Biol. Fertil. Soils 2000, 32, 222–227. [Google Scholar] [CrossRef]
- Greenhouse, S.W.; Geisser, S. On methods in the analysis of profile data. Psychometrika 1959, 24, 95–112. [Google Scholar] [CrossRef]
- Bates, D.; Mächler, M.; Bolker, B.; Walker, S. Fitting linear mixed-effects models using lme4. J. Stat. Softw. 2015, 67, 1–48. [Google Scholar] [CrossRef]
- Holm, S. A simple sequentially rejective multiple test procedure. Scand. J. Stat. 1979, 6, 65–70. [Google Scholar]
- Seabold, S.; Perktold, J. Statsmodels: Econometric and Statistical Modeling with Python. In Proceedings of the 9th Python in Science Conference; van der Walt, S., Millman, J., Eds.; 2010; pp. 92–96. [Google Scholar] [CrossRef]
- Virtanen, P.; Gommers, R.; Oliphant, T.E.; Haberland, M.; Reddy, T.; Cournapeau, D.; Burovski, E.; Peterson, P.; Weckesser, W.; Bright, J.; et al. SciPy 1.0: Fundamental algorithms for scientific computing in Python. Nat. Methods 2020, 17, 261–272. [Google Scholar] [CrossRef] [PubMed]
- Cook, K.L.; Ritchey, E.L.; Loughrin, J.H.; Haley, M.; Sistani, K.R.; Bolster, C.H. Effect of turning frequency and season on composting materials from swine high-rise facilities. Waste Manag. 2015, 39, 86–95. [Google Scholar] [CrossRef] [PubMed]
- Larney, F.J.; Hao, X. A review of composting as a management alternative for beef cattle feedlot manure in southern Alberta, Canada. Bioresour. Technol. 2007, 98, 3221–3227. [Google Scholar] [CrossRef] [PubMed]
- Huang, G.F.; Wu, Q.T.; Wong, J.W.C.; Nagar, B.B. Transformation of organic matter during co-composting of pig manure with sawdust. Bioresour. Technol. 2006, 97, 1834–1842. [Google Scholar] [CrossRef] [PubMed]
- Bernal, M.P.; Paredes, C.; Sánchez-Monedero, M.A.; Cegarra, J. Maturity and stability parameters of composts prepared with a wide range of organic wastes. Bioresour. Technol. 1998, 63, 91–99. [Google Scholar] [CrossRef]
- Tiquia, S.M. Microbiological parameters as indicators of compost maturity. J. Appl. Microbiol. 2005, 99, 816–828. [Google Scholar] [CrossRef] [PubMed]
- Liu, S.; Zhao, J.; Feng, W.-L.; Zhang, Z.-J.; Gu, Y.-F.; Wang, Y.-P. Microbial community succession of cow manure and tobacco straw composting. Front. Microbiomes 2024, 3, 1301156. [Google Scholar] [CrossRef] [PubMed]
- Xi, B.; Zhao, X.; He, X.; Huang, C.; Tan, W.; Gao, R.; Zhang, H.; Li, D. Successions and diversity of humic-reducing microorganisms and their association with physical-chemical parameters during composting. Bioresour. Technol. 2016, 219, 204–211. [Google Scholar] [CrossRef] [PubMed]
- Xu, J.; Jiang, Z.; Li, M.; Li, Q. A compost-derived thermophilic microbial consortium enhances the humification process and alters the microbial diversity during composting. J. Environ. Manag. 2019, 243, 240–249. [Google Scholar] [CrossRef] [PubMed]
- Jiao, Z.; Zhang, L.; Zhang, A.; Li, R.; Zhang, K.; Wu, Z.; Kang, Z.; Wei, Y.; Zhang, L.; Wang, Y.; Shi, X.; Li, J. Mature compost enhanced the harmlessness level in co-composting swine manure and carcasses in large-scale silo reactors. Front. Microbiol. 2024, 15, 1494332. [Google Scholar] [CrossRef] [PubMed]
- Gaspar, S.S.; Assis, L.L.R.; Carvalho, C.A.; Buttrós, V.H.; Ferreira, G.M.R.; Schwan, R.F.; Pasqual, M.; Rodrigues, F.A.; Rigobelo, E.C.; Castro, R.P.; Dória, J. Dynamics of microbiota and physicochemical characterization of food waste in a new type of composter. Front. Sustain. Food Syst. 2022, 6, 960196. [Google Scholar] [CrossRef]
- Nakasaki, K.; Yaguchi, H.; Sasaki, Y.; Kubota, H. Effects of pH control on composting of garbage. Waste Manag. Res. 1993, 11, 117–125. [Google Scholar] [CrossRef]
- Bergersen, O.; Bøen, A.S.; Sørheim, R. Strategies to reduce short-chain organic acids and synchronously establish high-rate composting in acidic household waste. Bioresour. Technol. 2009, 100, 521–526. [Google Scholar] [CrossRef] [PubMed]
- Sánchez-Monedero, M.A.; Roig, A.; Paredes, C.; Bernal, M.P. Nitrogen transformation during organic waste composting by the Rutgers system and its effects on pH, EC and maturity of the composting mixtures. Bioresour. Technol. 2001, 78, 301–308. [Google Scholar] [CrossRef] [PubMed]
- Gondek, M.; Weindorf, D.C.; Thiel, C.; Kleinheinz, G. Soluble salts in compost and their effects on soil and plants: A review. Compost Sci. Util. 2020, 28, 59–75. [Google Scholar] [CrossRef]
- Ma, R.; Peng, L.; Tang, R.; Jiang, T.; Chang, J.; Li, G.; Wang, J.; Yang, Y.; Yuan, J. Bioaerosol emission characteristics and potential risks during composting: Focus on pathogens and antimicrobial resistance. J. Hazard. Mater. 2025, 481, 136466. [Google Scholar] [CrossRef] [PubMed]
- Gómez-Brandón, M.; Lazcano, C.; Domínguez, J. The evaluation of stability and maturity during the composting of cattle manure. Chemosphere 2008, 70, 436–444. [Google Scholar] [CrossRef] [PubMed]
- Goyal, S.; Dhull, S.K.; Kapoor, K.K. Chemical and biological changes during composting of different organic wastes and assessment of compost maturity. Bioresour. Technol. 2005, 96, 1584–1591. [Google Scholar] [CrossRef] [PubMed]
- Paradelo, R.; Prieto, B.; Sandu, R.-G.; Barral, M.T.; Moldes, A.B. Can stability and maturity be evaluated in finished composts from different sources? Compost Sci. Util. 2010, 18, 22–31. [Google Scholar] [CrossRef]
- Ko, H.J.; Kim, K.Y.; Kim, H.T.; Kim, C.N.; Umeda, M. Evaluation of maturity parameters and heavy metal contents in composts made from animal manure. Waste Manag. 2008, 28, 813–820. [Google Scholar] [CrossRef] [PubMed]
- Tiquia, S.M.; Tam, N.F.Y. Elimination of phytotoxicity during co-composting of spent pig-manure sawdust litter and pig sludge. Bioresour. Technol. 1998, 65, 43–49. [Google Scholar] [CrossRef]
- Huang, G.F.; Fang, M.; Wu, Q.T.; Zhou, L.X.; Liao, X.D.; Wong, J.W.C. Co-composting of pig manure with leaves. Environ. Technol. 2001, 22, 1203–1212. [Google Scholar] [CrossRef] [PubMed]
Figure 1.
Composting bins and handling of the material. (a) Horizontal drum bin mounted on a wooden frame with a hand crank for turning. (b) Manual chopping of the vegetable solid waste. (c) Filling of a bin with the mixture. (d) Sieving of the final compost.
Figure 1.
Composting bins and handling of the material. (a) Horizontal drum bin mounted on a wooden frame with a hand crank for turning. (b) Manual chopping of the vegetable solid waste. (c) Filling of a bin with the mixture. (d) Sieving of the final compost.
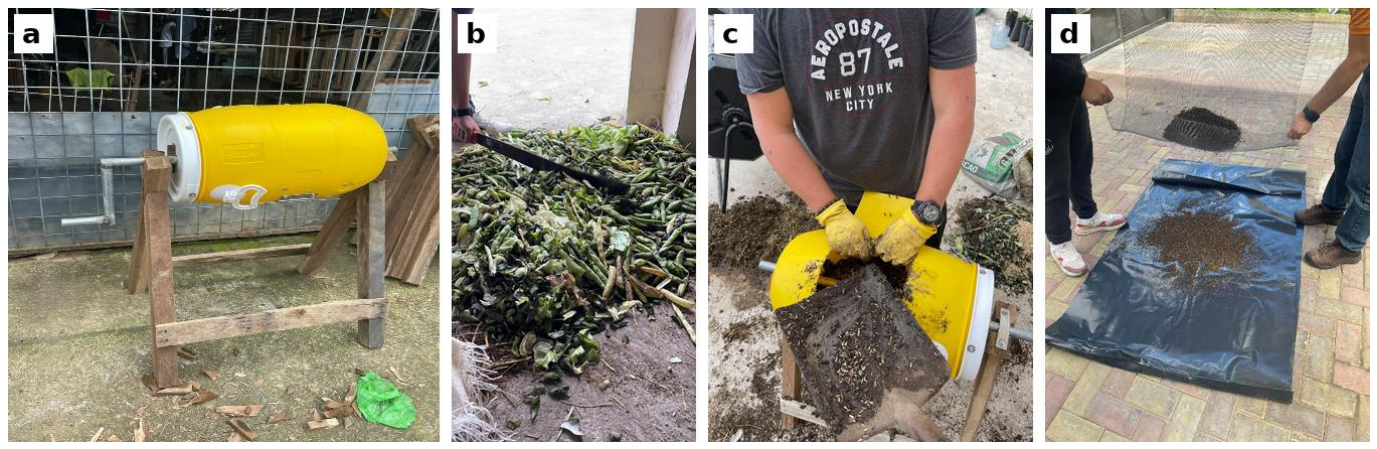
Figure 2.
Temperature at the centre of the bins over 12 weeks. Lines show the weekly series of one bin per treatment; open symbols show each of the two bins per treatment at weeks 0, 6 and 12. Horizontal lines mark 45 °C (dotted) and 55 °C (dashed). T1, guinea pig with lactic acid bacteria (LAB); T2, guinea pig with S. cerevisiae; T3, pig with LAB; T4, pig with S. cerevisiae.
Figure 2.
Temperature at the centre of the bins over 12 weeks. Lines show the weekly series of one bin per treatment; open symbols show each of the two bins per treatment at weeks 0, 6 and 12. Horizontal lines mark 45 °C (dotted) and 55 °C (dashed). T1, guinea pig with lactic acid bacteria (LAB); T2, guinea pig with S. cerevisiae; T3, pig with LAB; T4, pig with S. cerevisiae.
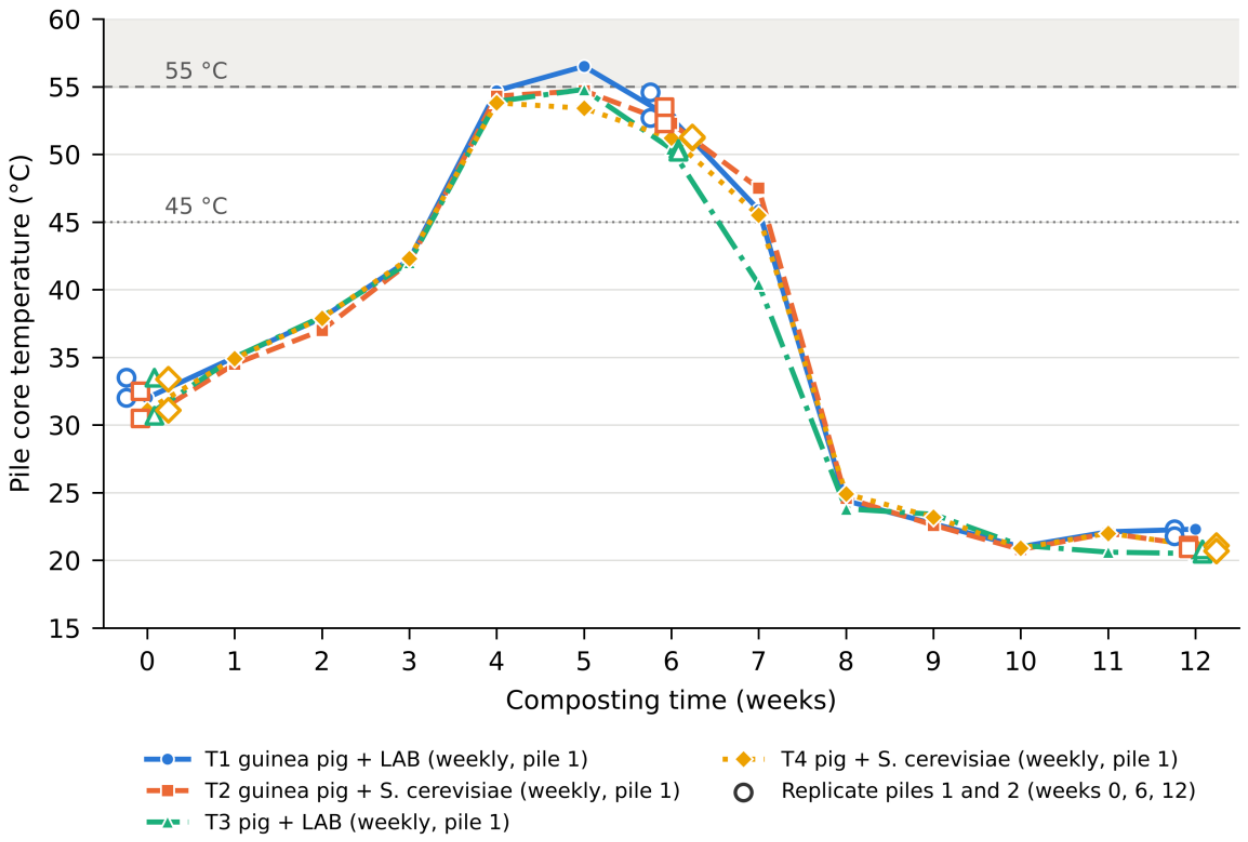
Figure 3.
Standardised differences between substrates (guinea pig minus pig, in residual standard deviation units) with 95% confidence intervals. Intervals were calculated with the mean square error of the factorial model of each week. For weeks 6 and 12, the variables in Table 4 are shown.
Figure 3.
Standardised differences between substrates (guinea pig minus pig, in residual standard deviation units) with 95% confidence intervals. Intervals were calculated with the mean square error of the factorial model of each week. For weeks 6 and 12, the variables in Table 4 are shown.
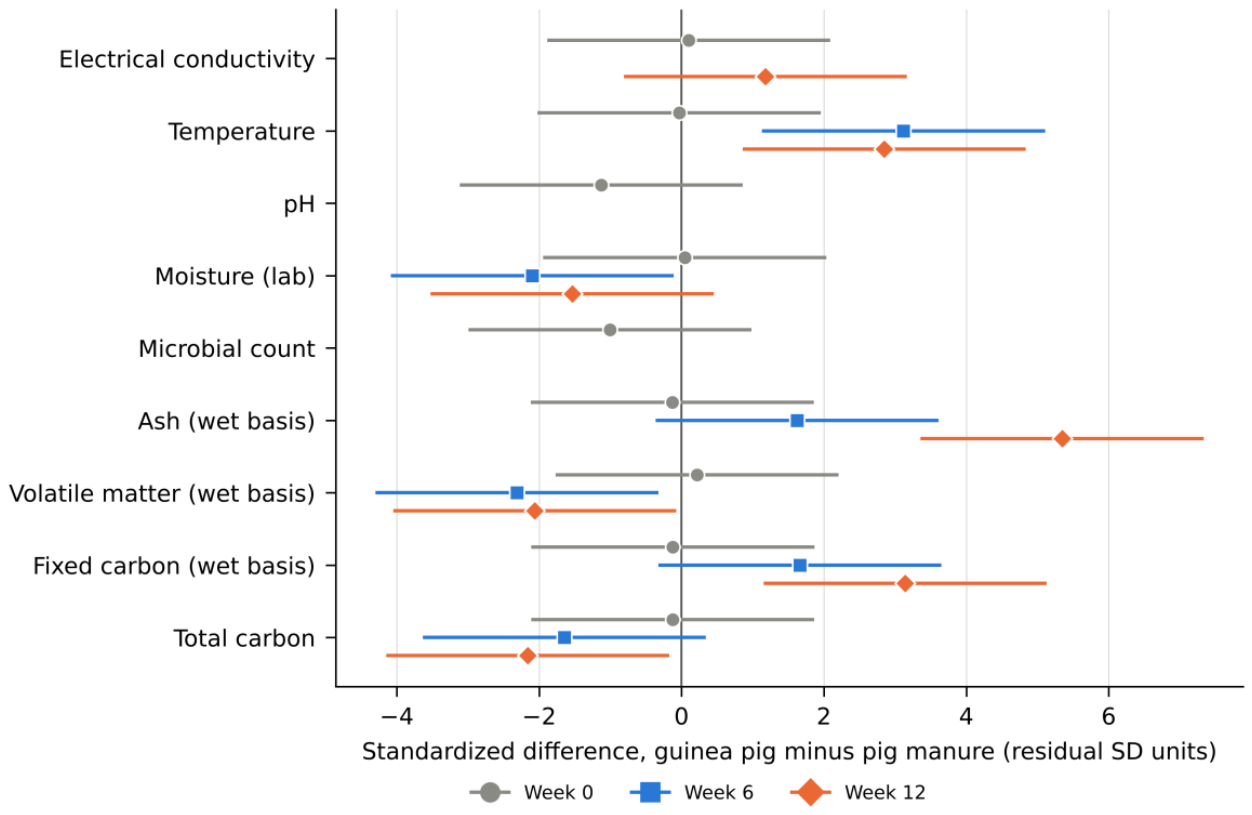
Figure 4.
Proximate composition by substrate and week expressed on an as-received basis (a) and on a dry basis (b). Bars show the means of each substrate and week.
Figure 4.
Proximate composition by substrate and week expressed on an as-received basis (a) and on a dry basis (b). Bars show the means of each substrate and week.
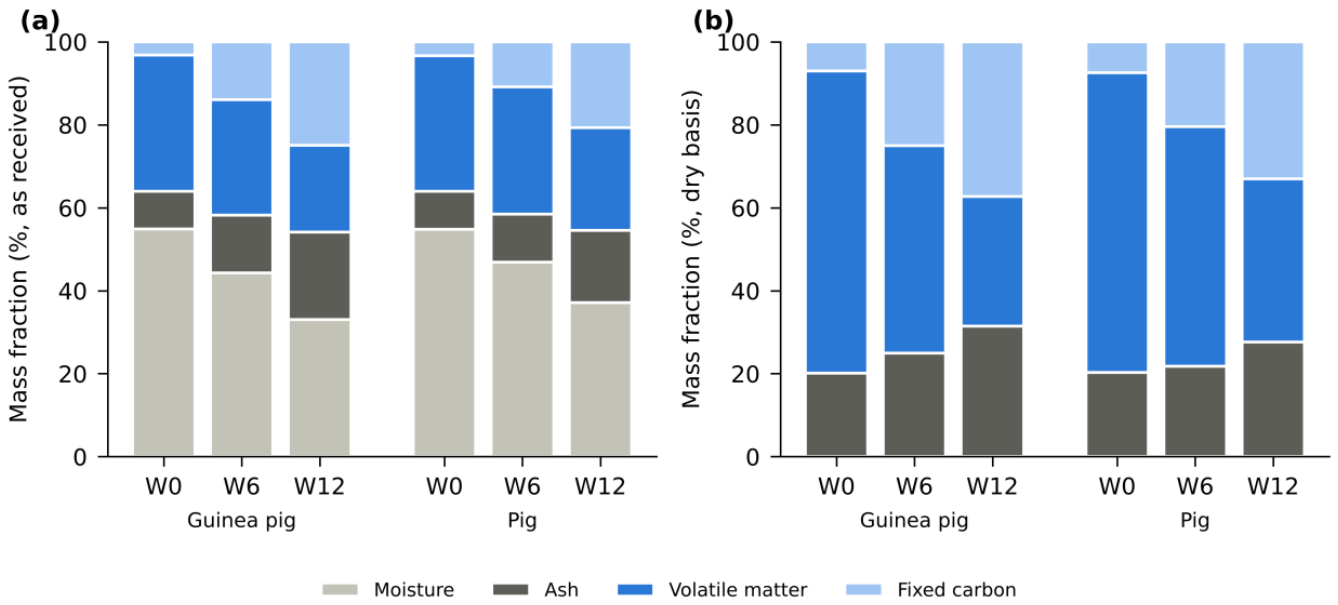
Figure 5.
Weekly evolution of pH (a), C/N ratio (b) and process moisture (c) in one bin per treatment. No dispersion bars are shown because the weekly monitoring was carried out on one bin per treatment. The horizontal line in (b) marks a C/N ratio of 20.
Figure 5.
Weekly evolution of pH (a), C/N ratio (b) and process moisture (c) in one bin per treatment. No dispersion bars are shown because the weekly monitoring was carried out on one bin per treatment. The horizontal line in (b) marks a C/N ratio of 20.
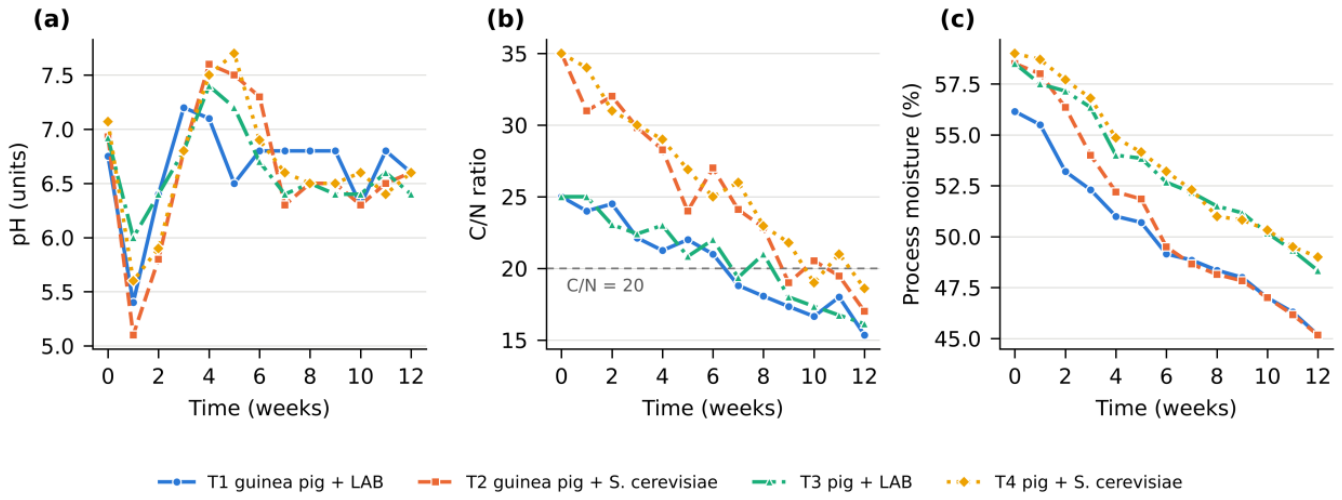

Table 1.
Moisture of fresh samples and elemental composition of the raw materials.
| Material | Moisture (%) | C (%) | H (%) | N (%) | S (%) | C/N |
| Guinea pig manure | 71.1 ± 0.8 | 33.43 ± 0.33 | 5.87 ± 0.19 | 1.62 ± 0.03 | 0.19 ± 0.01 | 20.7 ± 0.2 |
| Pig manure | 70.3 ± 2.5 | 38.39 ± 2.68 | 7.24 ± 0.53 | 3.84 ± 0.25 | 0.28 ± 0.03 | 10.0 ± 0.1 |
| Vegetable solid waste | 79.3 ± 1.7 | 21.23 ± 2.40 | 2.33 ± 0.69 | 1.56 ± 0.40 | 0.19 ± 0.05 | 14.0 ± 2.1 |
| Rice husk | 0.8 ± 0.2 | 34.21 ± 0.53 | 5.85 ± 0.09 | 0.49 ± 0.02 | 0.14 ± 0.01 | 69.8 ± 3.4 |
| Black soil | 27.2 (2) | 2.97 ± 0.16 | 1.28 ± 0.01 | 0.28 ± 0.02 | 0.00 ± 0.00 | 10.8 ± 0.3 |
Table 2.
Process and laboratory variables at week 0 by treatment and p-values of the factorial analysis of variance.
Table 2.
Process and laboratory variables at week 0 by treatment and p-values of the factorial analysis of variance.
| Variable | T1 | T2 | T3 | T4 | p substrate | p inoculum | p interaction |
| Temperature (°C) | 32.75 ± 1.06 | 31.50 ± 1.41 | 32.10 ± 1.98 | 32.25 ± 1.63 | 0.966 | 0.643 | 0.559 |
| pH | 6.80 ± 0.08 | 6.69 ± 0.35 | 6.90 ± 0.03 | 7.01 ± 0.09 | 0.186 | 0.957 | 0.436 |
| EC (dS m⁻¹) | 4.31 ± 0.16 | 4.14 ± 0.18 | 4.11 ± 0.51 | 4.29 ± 0.16 | 0.892 | 0.982 | 0.444 |
| Laboratory moisture (%) | 55.38 ± 0.02 | 54.41 ± 2.45 | 53.34 ± 0.83 | 56.30 ± 1.97 | 0.951 | 0.433 | 0.162 |
| Microbial count (×10⁶ cells g⁻¹) | 4.53 ± 0.40 | 4.10 ± 0.11 | 5.03 ± 0.78 | 4.74 ± 0.70 | 0.229 | 0.422 | 0.874 |
| Ash (%, wb) | 9.04 ± 0.62 | 9.11 ± 0.43 | 9.50 ± 0.23 | 8.83 ± 1.19 | 0.863 | 0.587 | 0.506 |
| Volatile matter (%, wb) | 32.76 ± 1.82 | 33.00 ± 0.40 | 32.21 ± 0.30 | 33.14 ± 0.11 | 0.772 | 0.433 | 0.636 |
| Fixed carbon (%, wb) | 2.83 ± 1.19 | 3.49 ± 2.41 | 4.96 ± 1.36 | 1.73 ± 0.88 | 0.872 | 0.311 | 0.155 |
| Total carbon (%) | 38.78 ± 2.13 | 39.03 ± 0.09 | 38.30 ± 1.97 | 39.88 ± 0.46 | 0.871 | 0.431 | 0.554 |
Table 3.
Temperature at the centre of the bins at weeks 0, 6 and 12 and substrate effect by week.
| Week | T1 | T2 | T3 | T4 | Guinea pig − pig (95% CI) | p substrate | p Holm | p permutation | p inoculum | p interaction |
| 0 | 32.75 | 31.50 | 32.10 | 32.25 | -0.05 (-3.11; 3.01) | 0.966 | 0.966 | 0.944 | 0.643 | 0.559 |
| 6 | 53.65 | 52.90 | 50.30 | 51.25 | 2.50 (0.93; 4.07) | 0.011 | 0.034 | 0.056 | 0.868 | 0.207 |
| 12 | 22.05 | 21.00 | 20.65 | 20.90 | 0.75 (0.24; 1.26) | 0.015 | 0.034 | 0.167 | 0.095 | 0.024 |
Table 4.
Laboratory variables by substrate at weeks 6 and 12 and difference between substrates.
| Variable | Week | Guinea pig | Pig | Difference (95% CI) | p |
| Moisture (%) | 6 | 44.31 | 46.86 | -2.55 (-4.94; -0.16) | 0.042 |
| Moisture (%) | 12 | 33.07 | 37.14 | -4.07 (-9.28; 1.14) | 0.096 |
| Ash (%, wb) | 6 | 13.92 | 11.58 | 2.34 (-0.49; 5.17) | 0.083 |
| Ash (%, wb) | 12 | 21.03 | 17.38 | 3.65 (2.31; 4.99) | 0.002 |
| Volatile matter (%, wb) | 6 | 27.81 | 30.70 | -2.89 (-5.34; -0.44) | 0.030 |
| Volatile matter (%, wb) | 12 | 20.96 | 24.74 | -3.78 (-7.38; -0.18) | 0.044 |
| Fixed carbon (%, wb) | 6 | 13.96 | 10.86 | 3.10 (-0.56; 6.76) | 0.078 |
| Fixed carbon (%, wb) | 12 | 24.93 | 20.73 | 4.20 (1.57; 6.83) | 0.011 |
| Total carbon (%) | 6 | 34.80 | 35.31 | -0.51 (-1.12; 0.10) | 0.084 |
| Total carbon (%) | 12 | 28.95 | 32.02 | -3.07 (-5.86; -0.28) | 0.038 |
| EC (dS m⁻¹) | 12 | 6.27 | 5.53 | 0.74 (-0.49; 1.97) | 0.173 |
| Temperature (°C) | 6 | 53.27 | 50.78 | 2.49 (0.92; 4.06) | 0.011 |
| Temperature (°C) | 12 | 21.52 | 20.78 | 0.74 (0.23; 1.25) | 0.015 |
Table 5.
Proximate composition on a dry basis, volatile fraction of organic matter and organic matter and carbon losses estimated by ash balance.
Table 5.
Proximate composition on a dry basis, volatile fraction of organic matter and organic matter and carbon losses estimated by ash balance.
| Substrate | Week | Moisture (%) | Ash (%, db) | Volatile matter (%, db) | Fixed carbon (%, db) | Volatile fraction of OM | OM loss (%) | C loss (%) |
| Guinea pig | 0 | 54.9 | 20.1 | 72.9 | 7.0 | 0.91 | — | — |
| Guinea pig | 6 | 44.3 | 25.0 | 49.9 | 25.1 | 0.67 | 24.5 | 28.0 |
| Guinea pig | 12 | 33.1 | 31.4 | 31.3 | 37.2 | 0.46 | 45.1 | 52.4 |
| Pig | 0 | 54.8 | 20.3 | 72.3 | 7.4 | 0.91 | — | — |
| Pig | 6 | 46.9 | 21.8 | 57.8 | 20.4 | 0.74 | 8.7 | 15.9 |
| Pig | 12 | 37.1 | 27.6 | 39.4 | 33.0 | 0.54 | 33.4 | 39.9 |
| Overall mean | 0 | 54.9 | 20.2 | 72.6 | 7.2 | 0.91 | — | — |
| Overall mean | 6 | 45.6 | 23.4 | 53.8 | 22.8 | 0.70 | 17.3 | 22.5 |
| Overall mean | 12 | 35.1 | 29.6 | 35.2 | 35.2 | 0.50 | 39.8 | 46.7 |
Table 6.
Descriptive metrics of the weekly series of temperature, C/N ratio, pH and process moisture.
Table 6.
Descriptive metrics of the weekly series of temperature, C/N ratio, pH and process moisture.
| Treatment | Tmax (°C) | Week of Tmax | Readings ≥ 45 °C | Readings ≥ 55 °C | Degree-days > 45 °C | Initial → final C/N | Week C/N < 20 | Minimum pH | pH range | Moisture loss (pp) |
| T1 | 56.5 | 5 | 4 | 1 | 209 | 25 → 15.3 | 7 | 5.4 | 1.8 | 11.0 |
| T2 | 54.7 | 5 | 4 | 0 | 202 | 35 → 17.0 | 11 | 5.1 | 2.5 | 13.3 |
| T3 | 54.8 | 5 | 3 | 0 | 169 | 25 → 16.1 | 9 | 6.0 | 1.4 | 10.2 |
| T4 | 53.8 | 4 | 4 | 0 | 167 | 35 → 18.6 | 12 | 5.6 | 2.1 | 10.0 |
Disclaimer/Publisher’s Note: The statements, opinions and data contained in all publications are solely those of the individual author(s) and contributor(s) and not of MDPI and/or the editor(s). MDPI and/or the editor(s) disclaim responsibility for any injury to people or property resulting from any ideas, methods, instructions or products referred to in the content. |
© 2026 by the authors. Licensee MDPI, Basel, Switzerland. This article is an open access article distributed under the terms and conditions of the Creative Commons Attribution (CC BY) license (http://creativecommons.org/licenses/by/4.0/).
Copyright: This open access article is published under a Creative Commons CC BY 4.0 license, which permit the free download, distribution, and reuse, provided that the author and preprint are cited in any reuse.