

Submitted:
13 November 2026
Posted:
16 November 2026
You are already at the latest version
Abstract
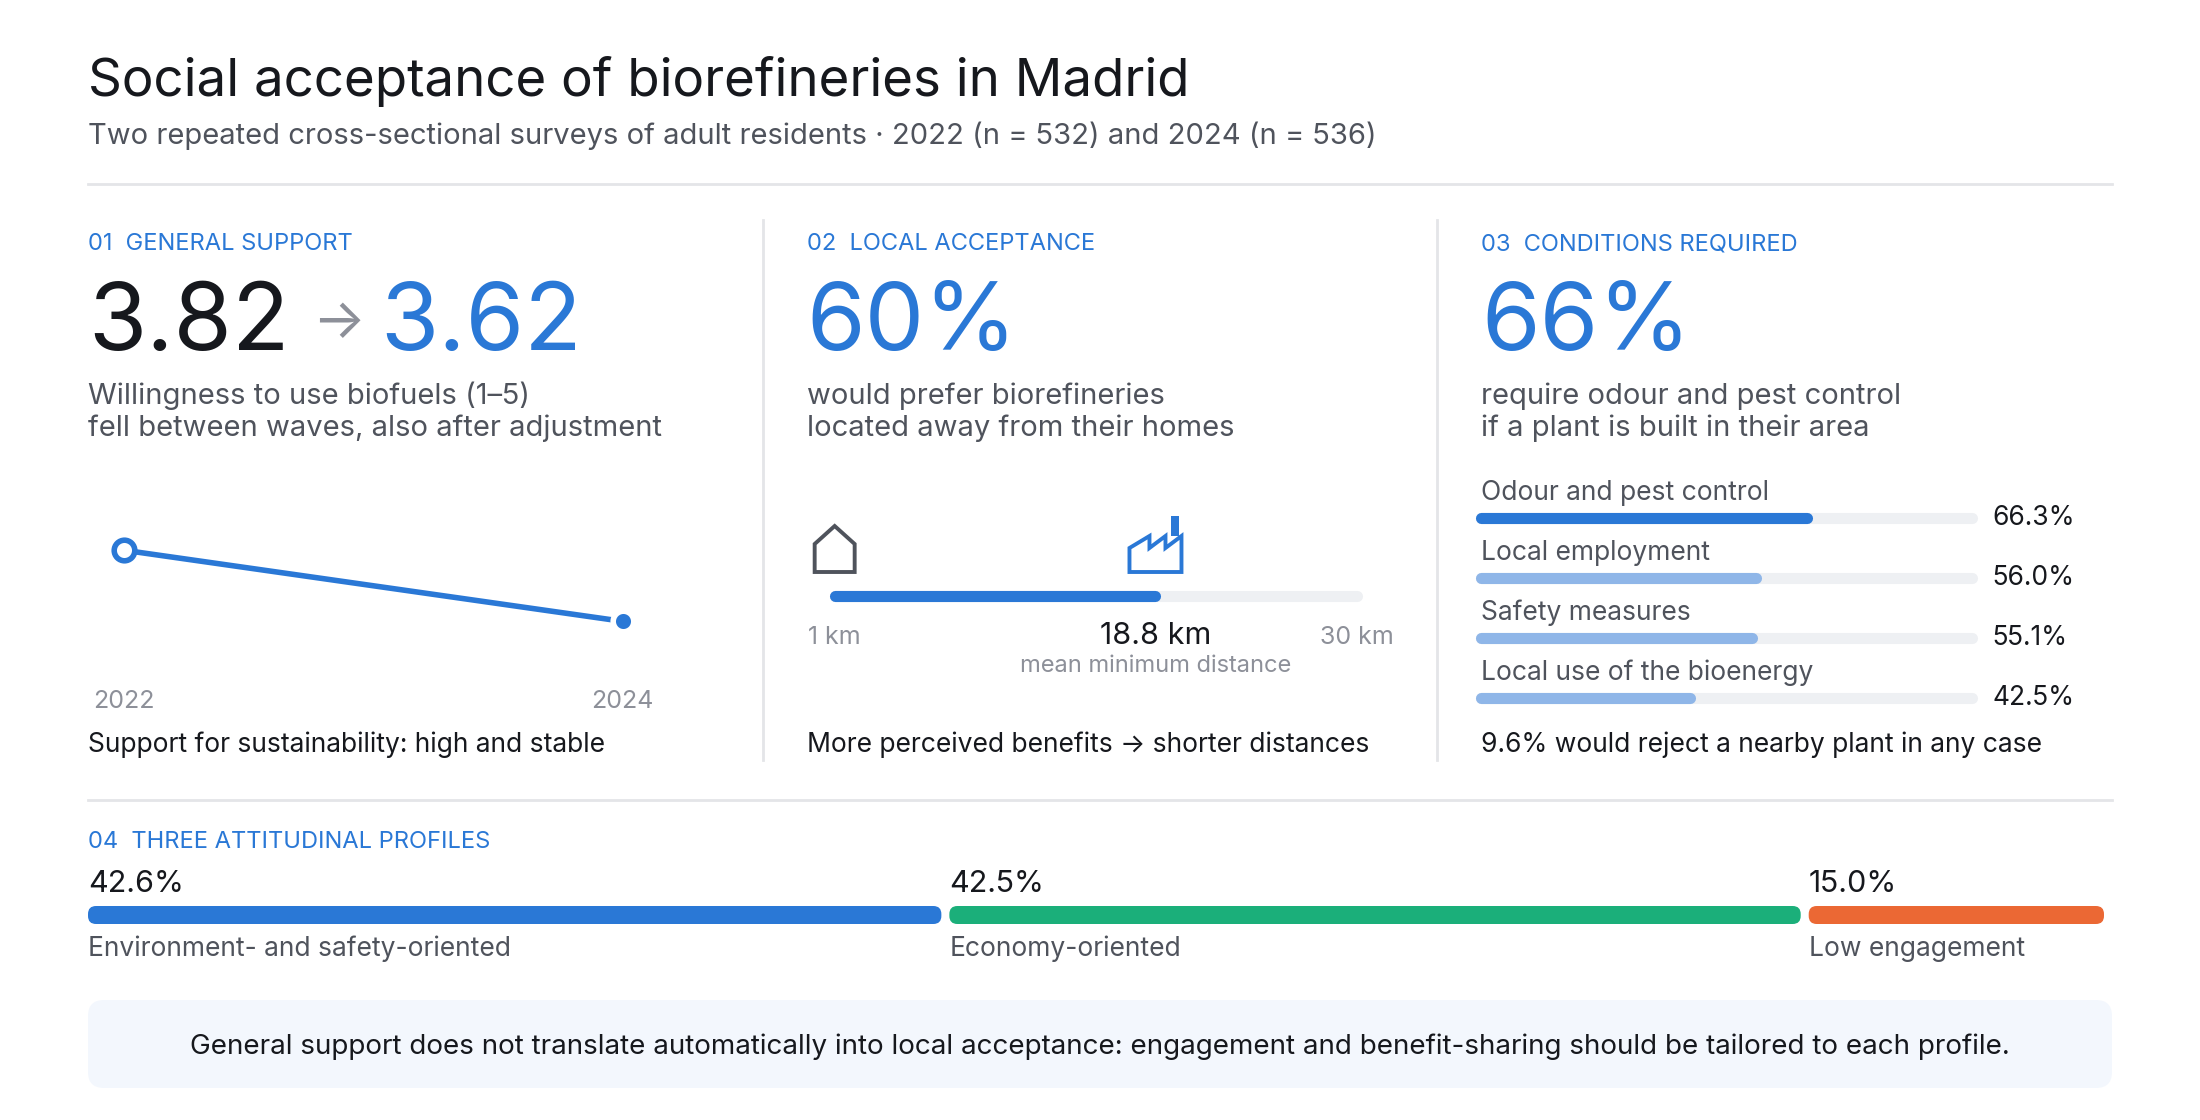
Biorefineries that convert organic waste and biomass into biogas, biomethane, other biofuels and bio-based products can contribute to the energy transition and the circular bioeconomy, but their deployment depends on local social acceptance. This study examines public attitudes towards sustainability, biofuels and biorefinery siting in the Community of Madrid (Spain) using two repeated cross-sectional online surveys (October 2022, n = 532; November 2024, n = 536) from a non-probability online panel with gender and age quotas. Wave differences were estimated with covariate-adjusted regressions, associations with rank correlations and linear models, and attitudinal profiles with hierarchical and k-means clustering. Support for sustainability remained high and stable, whereas willingness to use biofuels declined (adjusted difference −0.22 on a 1–5 scale; p = 0.002). About 60% of respondents preferred biorefineries located away from their homes, and the mean stated minimum acceptable distance was 18.8 km on a 1–30 km scale. Perceiving that sustainability benefits outweigh local nuisances was associated with shorter acceptable distances. Odour control, local employment and plant safety were the most frequently required conditions. Three profiles were identified: environment- and safety-oriented (42.6%), economy-oriented (42.5%) and low sustainability engagement (15.0%). General support does not translate automatically into local acceptance, calling for differentiated engagement and benefit-sharing strategies.
Keywords:
biorefineries
; biogas
; bioenergy
; circular bioeconomy
; social acceptance
; energy transition
; facility siting
; public perception
; repeated cross-sectional survey
; Spain
1. Introduction
The decarbonisation of energy systems requires not only renewable electricity but also renewable gases and fuels for uses that are difficult to electrify, such as industrial heat, heavy transport and parts of the gas grid [1,2]. Biorefineries contribute to this goal by converting biomass and organic residues into biofuels, bioenergy (electricity and heat) and higher-value bio-based products [3,4]. When they are fed with municipal biowaste, agricultural residues or sewage sludge, they also connect energy supply with waste management and the circular bioeconomy [5,6], a transition that also depends on citizen involvement [7].
European and Spanish policy frameworks have raised expectations for this type of infrastructure. The REPowerEU plan set an EU-wide target of 35 billion cubic metres of sustainable biomethane production per year by 2030 [8], and the revised Renewable Energy Directive strengthened targets for renewable fuels in industry and transport [9]. In Spain, the Climate Change and Energy Transition Law [10], the Biogas Roadmap approved in March 2022 [11] and the updated National Integrated Energy and Climate Plan 2023–2030 [12] identify biogas and other bio-based energy carriers as part of the decarbonisation pathway. The Waste and Contaminated Soils Law 7/2022 [13], which transposes European waste directives [14,15], requires separate collection of biowaste and increases the pressure to valorise organic residues. At the regional level, the Community of Madrid adopted a Circular Economy Law in 2024 [16].
Achieving these targets depends on building plants close to feedstock sources, gas grids and consumers. These facilities are often perceived as waste infrastructure rather than energy infrastructure, and local opposition can delay or block projects [17,18]. The Community of Madrid offers two recent examples. In Cubas de la Sagra, in the south of the region, a biogas plant proposed in 2023 was abandoned in 2024 after months of protests by residents of the town and neighbouring municipalities and an unfavourable municipal planning report [19]. In Colmenar Viejo, in the north, a plant converting biowaste into biomethane obtained a favourable municipal technical report for its building licence in July 2026 [20], but residents’ associations have taken the project to court, citing health and environmental concerns and procedural irregularities [21]. The social dimension of the circular bioeconomy is therefore a practical condition for the energy transition, not only a matter of public opinion [22,23].
1.1. Social Acceptance of Biorefineries and Bioenergy Facilities
Research on the social acceptance of renewable energy distinguishes between socio-political, market and community acceptance [22]. General support for renewable technologies can coexist with resistance to specific projects, and this gap has been explained by perceived local costs and benefits, trust, procedural and distributive justice, and place attachment rather than by selfish motives alone [23,24,25]. Simplified labels such as NIMBY (Not In My Back Yard) have been criticised for attributing opposition to irrational or self-interested attitudes [24,26].
Studies specifically addressing biorefineries and biogas plants remain comparatively scarce [27,28]. Peck et al. [29] analysed the understanding and support of the biorefinery concept among European policy-makers; McGuire et al. [30] and Marciano et al. [31] found that trust and perceived benefits shaped support for forest-based biorefineries in Maine (USA); Lee et al. [32] showed that communities that seem favourable may still perceive net welfare losses from nearby biorefineries; Kokkinos et al. [33] modelled acceptance of waste biorefineries with fuzzy cognitive maps; and Soland et al. [17] reported relatively high acceptance among residents living near existing biogas plants in Switzerland. Other studies have highlighted the role of perceived environmental risk, information and institutional trust in bioenergy and biofuel acceptance [34,35,36,37]. Most of this evidence comes from single cross-sectional surveys, policy elites or rural contexts. Less is known about how residents of densely populated metropolitan regions evaluate biorefineries, how these evaluations relate to general sustainability attitudes, and whether they change during periods of regulatory change.
Attitudinal models such as the Theory of Planned Behaviour [38] have been used to study intentions to use bioenergy [36]. The survey analysed here was not designed to measure subjective norms or perceived behavioural control, so it does not test that model. Instead, the study draws on the social acceptance literature to examine general sustainability attitudes, perceived knowledge, willingness to use biofuels, perceived benefits and nuisances of biorefineries, stated siting distance and the conditions under which residents would accept a plant in their municipality.
1.2. Aim and Hypotheses
The study examines the social conditions for deploying biorefineries in the Community of Madrid, the most densely populated region of Spain. It uses two independent survey waves conducted in 2022 and 2024, which coincided with the approval and early implementation of Law 7/2022 [13]. Its objectives are (i) to describe attitudes towards sustainability, biofuels and biorefineries in both waves; (ii) to test the associations stated in four hypotheses; and (iii) to identify attitudinal profiles that may inform engagement strategies. The hypotheses are formulated as associations, consistent with the observational design:
- H1. More positive attitudes towards sustainability are associated with greater perceived knowledge of sustainability measures.
- H2. Stronger endorsement of source separation of waste is associated with a more favourable evaluation of composting.
- H3. Willingness to use biofuels is positively associated with the importance given to their environmental benefits and to economic incentives.
- H4. The perception that the benefits of biorefineries outweigh their nuisances is associated with greater support for biorefineries and with shorter stated minimum acceptable distances.
Changes between waves are reported descriptively and, where the measures are comparable, estimated with models adjusted for sample composition. They are not interpreted as individual change.
2. Materials and Methods
2.1. Design and Data Collection
The study is based on two repeated cross-sectional surveys of residents of the Community of Madrid aged 18 and over. Different respondents participated in each wave, so the design supports comparisons of aggregate distributions over time but not of individual change. Data were collected through computer-assisted web interviewing (CAWI) using SurveyMonkey’s online panel for the region. The first wave took place from 20 to 31 October 2022, after the approval of Law 7/2022; the second from 1 to 5 November 2024, while municipalities were preparing waste fees based on the polluter-pays principle [13].
The target was 500 completed questionnaires per wave, with quota targets for gender and age based on official population statistics [39]. The final dataset contains 1068 questionnaires (532 in 2022 and 536 in 2024). Because the panel is opt-in and non-probabilistic, quotas do not make the sample a probability sample and no sampling margin of error is reported [40,41]. Results are therefore interpreted as estimates for the achieved samples. No weights were applied, and the dataset contains no duplicate records. For respondents outside the United States, SurveyMonkey draws its sample from third-party panel partners; its quality procedures include attention-check questions, identity and location verification and the exclusion of duplicate respondents [42]. Incentives were managed by the panel partners and were not reported to the research team. The achieved samples differed in age, education, employment status and income (Section 3.1); in particular, the share of respondents aged 65 or over fell from 16.0% to 4.7%. These differences were addressed with covariate-adjusted models and an age-and-gender standardisation used as a sensitivity analysis.
2.2. Questionnaire
The questionnaire (Supplementary Materials S1) was based on previous studies of the acceptance of renewable energy and bio-based products [27,37,43]. It comprised 20 closed questions and two optional open questions organised in five blocks: sociodemographic variables (gender, age group, postal code, educational level [44,45], household size, employment status, net monthly household income and left–right self-placement on a 1–10 scale); attitudes towards sustainability (Q9–Q11); source separation and waste treatment (Q12–Q13); biofuels (Q14–Q16); and biorefineries (Q17–Q20). Table 1 summarises the measures used.
Before Q17, respondents read that biorefineries produce biofuels, bioenergy, pharmaceutical inputs and biopolymers and that low-cost biogas production requires facilities close to the population that uses it.
Q20 changed between waves. In 2022 respondents ranked five concerns; in 2024 three further options were added (air or water pollution, health risks and loss of property value) after these issues appeared in media and social media debates about local projects. Likewise, the requirement that a plant should not reduce the value of housing or local businesses was added to Q19 in 2024. These items are analysed within each wave, and only the five common Q20 options are compared across waves (Section 2.3).
2.3. Data Preparation and Statistical Analysis
Two indices were computed as the mean of their items on the original 1–5 scale: sustainability attitude (four items on climate urgency, circular economy, new solutions for organic waste and public promotion of sustainable fuels; Cronbach’s α = 0.89, n = 988 with complete items) and perceived sustainability knowledge (four items on awareness of sectoral measures and information on waste management, waste-derived fuels and treatment plants; α = 0.83, n = 968). A biorefinery support index was computed as the mean of four favourable Q17 items (benefits outweigh nuisances, contribution to sustainability, trust and willingness to pay more; α = 0.77) for respondents answering at least three items. Rankings (Q10–Q12, Q15 and Q16) were reversed so that higher scores indicate higher priority where means are reported; for Q20, mean ranks are reported, with 1 indicating the greatest concern. Because rankings are ipsative—a higher position for one option implies lower positions for the others—correlations among ranked options are partly negative by construction and were not used to infer independent motivations, and internal consistency coefficients were not computed for ranked items. Eight Q14 responses coded 0 (outside the 1–5 scale) were treated as missing.
For Q20, 42 respondents in 2022 and 37 in 2024 had the maximum code for every option, a pattern that is incompatible with a ranking and was treated as non-response; 10 further incomplete rankings in 2022 and 10 in 2024 were also excluded, leaving 480 and 489 valid rankings. Because the number of options changed from five to eight, mean ranking scores cannot be compared directly across waves: in 2022 the five options necessarily occupy all positions, whereas in 2024 they compete with three new options. For the wave comparison, the five common options were therefore re-ranked from 1 to 5 within each 2024 response according to their relative order, and the resulting distributions were compared with Mann–Whitney tests. This comparison assumes that the relative order of the common options is not affected by the addition of new options, an assumption that cannot be verified with the available data.
Wave differences for continuous and Likert-type variables are reported as means with Welch’s t tests and Cohen’s d, and as ordinary least squares estimates of the wave coefficient adjusted for gender, age group, educational level and income (heteroscedasticity-consistent HC3 standard errors and 95% confidence intervals). As a sensitivity analysis, means were also standardised to the pooled age-by-gender distribution. Proportions were compared with χ² tests. Associations were estimated with Spearman’s ρ and with linear models including the same covariates. Valid n is reported for each analysis because item non-response varied. Given the number of tests, the analysis is exploratory; p-values are reported exactly, results close to 0.05 are not described as significant, and effect sizes are emphasised.
Attitudinal profiles were identified with a two-step procedure in SPSS: hierarchical clustering to explore the number of groups, followed by k-means clustering (k = 3) on five standardised variables: the importance given to economic, environmental and safety reasons for using biofuels (Q15) and the sustainability attitude and knowledge indices. The analysis included 961 respondents with complete data. Because three of the input variables derive from a ranking, part of the separation between profiles reflects trade-offs imposed by the ranking format. The robustness of the solution was assessed in Python (scikit-learn 0.24) by replicating it with k-means (adjusted Rand index, ARI), comparing silhouette coefficients for two to six clusters, re-estimating it in 50 random 80% subsamples and clustering each wave separately. Profiles were described by support for biorefineries, willingness to use biofuels, distance, ideology and sociodemographic variables (χ² tests with Cramér’s V).
Original analyses were carried out with IBM SPSS Statistics v30. All figures reported in this version were recomputed from the deposited dataset with Python 3.8 (pandas, SciPy, statsmodels 0.12 and scikit-learn 0.24); the analysis code is provided as Supplementary Material S3. Generative AI (Claude Opus 5.5, Anthropic) was used to draft the analysis code used to verify the reported results.
3. Results
3.1. Sample Characteristics
Table 2 compares the composition of both waves. The gender distribution did not differ (χ²(2) = 1.68, p = 0.432), but the 2024 sample was younger (χ²(5) = 44.91, p < 0.001), with more respondents aged 25–34 (24.5% vs. 17.4%) and fewer aged 65 or over (4.7% vs. 16.0%). Educational level (χ²(7) = 19.99, p = 0.006), employment status (χ²(8) = 32.08, p < 0.001) and income (χ²(7) = 41.65, p < 0.001) also differed: the proportion of households with net incomes of €3000 or more rose from 21.0% to 32.8%, and the share of retired respondents fell from 12.0% to 3.5%. These differences are consistent with changes in the composition of the online panel and are considered in the comparisons below. Compared with official statistics for the adult population of the region [46,47], the gender distribution was close to that of the population, but both samples over-represented people with higher education (62.4% and 67.0% vs. about 41%) and under-represented people aged 55 or over, markedly so in 2024 (16.8% vs. 38.7%; 26.6% vs. 38.2% in 2022).
3.2. Attitudes Towards Sustainability and Perceived Knowledge (H1)
Attitudes towards sustainability were very positive and stable (Figure 1; Table 3). Around 80% of respondents agreed that climate change requires urgent measures, that the circular economy should be promoted and that new solutions for organic waste and more sustainable fuels are needed. The attitude index was 4.20 in 2022 and 4.15 in 2024 (adjusted difference −0.03, 95% CI [−0.16, 0.09], p = 0.599). Perceived knowledge was lower and also stable (3.45 and 3.39; adjusted difference −0.06 [−0.18, 0.07], p = 0.362). Fewer than half of the respondents felt sufficiently informed about fuels derived from waste, such as biogas (49.8% in 2022 and 46.1% in 2024), or about waste-to-fuel plants (44.0% and 40.6%).
Sustainability attitude and perceived knowledge were positively but weakly correlated (ρ = 0.20, p < 0.001, n = 1016), which supports H1 while indicating that positive attitudes coexist with limited perceived knowledge. Women reported more positive attitudes than men (4.31 vs. 4.05; Welch t = −4.13, p < 0.001). Priorities for climate action (Q10) and environmental concerns (Q11) are reported in Supplementary Table S2; reducing and reusing were the most frequently prioritised actions and were placed among the top three more often in 2024 than in 2022 (reducing, 77.8% vs. 70.3%, p = 0.007; reusing, 81.1% vs. 69.2%, p < 0.001), whereas renewing declined (13.3% vs. 19.6%, p = 0.009). The shares placing each environmental issue among their top three concerns did not differ between waves (all p > 0.20).
3.3. Waste Separation and Treatment (H2)
Composting was the treatment most often ranked first in both waves (34.0% of valid rankings in 2022 and 38.3% in 2024), followed by pyrolysis (27.6% and 23.8%); controlled landfill (23.5% and 19.0%) and incineration (17.0% and 20.1%) occupied the last positions (Supplementary Figure S1). On the reversed 1–4 priority score, the priority given to composting increased slightly (2.74 to 2.89; adjusted difference 0.17 [0.02, 0.31], p = 0.022) and the priority given to landfill decreased (2.46 to 2.30; adjusted difference −0.20 [−0.35, −0.05], p = 0.008); both effects were small (|d| ≤ 0.15). Agreement that source separation is essential was high (4.35 and 4.23 on a 1–5 scale).
Endorsement of source separation was moderately associated with the perceived effectiveness of composting (ρ = 0.42, p < 0.001, n = 969) but only weakly with the priority assigned to composting in the ranking (ρ = 0.08, p = 0.012, n = 973). H2 is therefore supported for the evaluation of composting as an effective treatment, but the association with its relative priority among treatment options is negligible. Sustainability attitudes were also associated with the perceived effectiveness of composting (ρ = 0.42) and pyrolysis (ρ = 0.26; both p < 0.001).
3.4. Willingness to Use Biofuels and Its Correlates (H3)
Willingness to use biofuels instead of other fuels was moderately high but declined between waves (Figure 2). The share answering 4 or 5 fell from 64.9% to 56.9%, and the mean fell from 3.82 to 3.62 (Welch t = 3.01, p = 0.003, d = 0.19, n = 1002). The decline persisted after adjusting for gender, age, education and income (−0.22 [−0.36, −0.08], p = 0.002) and after age-and-gender standardisation (3.82 vs. 3.62). Willingness also differed by income (F(7, 994) = 3.82, p < 0.001); respondents in the lowest income band (up to €499) reported the lowest mean (3.00, n = 38).
Among reasons to use biofuels (Q15), environmental benefits received the highest mean priority (4.08 on a reversed 1–6 scale) and were ranked first by 33.5% of respondents with valid rankings, followed by lower cost (18.4%). Among reasons not to use them (Q16), higher cost (21.5% ranked first), insufficient testing (16.1%) and lower safety (15.7%) were most prominent. These distributions did not change appreciably between waves (Supplementary Table S2).
Willingness to use biofuels was associated with sustainability attitude (ρ = 0.37, p < 0.001, n = 998), weaklier with perceived knowledge (ρ = 0.12, p < 0.001) and with the priority given to environmental benefits (ρ = 0.15, p < 0.001, n = 974), and not with the priority given to economic incentives (ρ = −0.06, p = 0.081). In a model with sociodemographic covariates (Table 4), sustainability attitude (b = 0.32 [0.23, 0.41], p < 0.001) and the priority of environmental benefits (b = 0.05 [0.01, 0.09], p = 0.009) were positively associated with willingness, whereas the priority of economic incentives (b = 0.01 [−0.03, 0.04], p = 0.817) and perceived knowledge (b = 0.01 [−0.07, 0.09], p = 0.883) were not. The 2024 wave remained associated with lower willingness (b = −0.23 [−0.37, −0.10], p < 0.001). H3 is supported for environmental benefits but not for economic incentives. The model explained a modest share of variance (adjusted R² = 0.13).
3.5. Perceptions of Biorefineries, Siting Distance and Conditions for Acceptance (H4)
Perceptions of biorefineries were moderately favourable (Figure 3). Two thirds of respondents would use biorefinery products because they generate trust (66.7%) and agreed that biorefineries contribute to a more sustainable economic model (64.9%), but 59.8% would prefer them not to be located near their homes, and fewer than half agreed that their sustainability benefits outweigh local nuisances (48.2%). None of these items changed significantly between waves after adjustment (Table 3). Willingness to pay more for biorefinery products decreased slightly (3.60 to 3.48), but the difference was not statistically significant (Welch p = 0.057; adjusted p = 0.081).
The mean stated minimum acceptable distance between a biorefinery and the respondent’s home (Q18) was 18.8 km (SD = 8.2; median = 17 km; n = 1007). Responses were constrained to 1–30 km, and 19.7% chose the maximum of 30 km, so the mean underestimates the distance preferred by part of the sample (Figure 4a). Distances did not differ significantly between waves (18.5 and 19.1 km; Mann–Whitney p = 0.085; adjusted difference 1.03 km [−0.03, 2.09], p = 0.057). These values describe a hypothetical scenario and should not be read as observed opposition to specific projects.
The perception that benefits outweigh nuisances was associated with agreement that biorefineries contribute to sustainability (ρ = 0.42, p < 0.001, n = 1003) and with shorter acceptable distances (ρ = −0.18, p < 0.001, n = 1005). In a model with sociodemographic covariates, each additional point of agreement with this statement was associated with a 1.39 km shorter distance (95% CI [−1.93, −0.85], p < 0.001), whereas trust and perceived sustainability were not independently associated with distance (Figure 4b). Among respondents who strongly disagreed that benefits outweigh nuisances, 50.7% chose the maximum distance, compared with 12.7–17.9% of those who agreed. The preference for keeping biorefineries away from home was positively associated with distance (ρ = 0.20, p < 0.001). Overall, the biorefinery support index correlated with willingness to use biofuels (ρ = 0.35) and negatively with distance (ρ = −0.13; both p < 0.001). These results support H4, although the associations with distance are weak.
When asked which requirements they would consider essential if a plant were built in their municipality (Q19; Figure 5), respondents most often selected odour and pest control (66.3%), local employment (56.0%) and safety measures (55.1%), followed by supplying the bioenergy produced to local demand (42.5%). In 2024, 39.7% also required that the plant should not reduce the value of housing or local businesses. The proportions for the common items did not differ significantly between waves (all p ≥ 0.09). A minority (9.6%) stated that they would not accept a plant in their municipality or a nearby one under any circumstances; this group chose longer distances (20.5 vs. 18.6 km; Mann–Whitney p = 0.015).
3.6. Concerns About a Nearby Plant
In 2022, when five options were available, the possibility that the plant might be unsafe was most often ranked first (34.6%), followed by odours and pests (23.5%), construction nuisance (17.3%), visual impact (13.5%) and truck traffic (11.0%; Figure 6a). In 2024, health risks (26.0% ranked first; 53.6% in the top three) and air or water pollution (18.0%; 49.5%) led the ranking of eight options, followed by odours and pests (42.5% in the top three) and safety (41.1%); loss of property value was placed in the top three by 32.3% (Figure 6b). More than half of the 2024 respondents (53.4%) ranked one of the three new options first.
When the five common options are compared by their relative order (mean relative rank, 1 = greatest concern), the hierarchy of concerns was largely stable. Odours remained among the two main concerns (2.60 in 2022 and 2.62 in 2024; p = 0.488), safety lost some relative priority (2.53 to 2.67; p = 0.034; ranked first by 34.6% and 26.6%), as did construction nuisance (2.96 to 3.16; p = 0.009), whereas truck traffic (3.35 to 3.15; p = 0.012) and visual impact (3.56 to 3.41; p = 0.031) gained some. These differences are small and depend on the assumption described in Section 2.3. The data do not show a general reduction in concern between 2022 and 2024; the lower mean scores obtained in 2024 on the original coding are an artefact of adding three options to the ranking.
3.7. Attitudinal Profiles
The cluster analysis identified three profiles (Figure 7; Table 5). Cluster 1, environment- and safety-oriented (n = 409; 42.6%), gave above-average priority to the environmental and safety benefits of biofuels and below-average priority to their economic benefits. Cluster 2, economy-oriented (n = 408; 42.5%), showed the opposite pattern. Both groups held positive sustainability attitudes. Cluster 3, low sustainability engagement (n = 144; 15.0%), had much lower sustainability attitudes (z = −1.88) and perceived knowledge (z = −0.68).
Support for biorefineries was similar in Clusters 1 and 2 (3.70 and 3.77 on the support index) and lower in Cluster 3 (2.97; F(2, 954) = 74.75, p < 0.001); the same pattern appeared for willingness to use biofuels (3.83, 3.88 and 3.11). Stated distance did not differ between profiles (18.1–18.9 km; F = 0.43, p = 0.649), indicating that proximity reservations cut across them. Cluster 3 placed itself slightly further to the right (6.06 vs. 5.31 and 4.92 on the 1–10 scale; F = 4.41, p = 0.013). Profiles differed weakly by age (Cramér’s V = 0.11, p = 0.008), gender (V = 0.11, p = 0.005) and income (V = 0.13, p = 0.003): respondents aged 45 or over were more frequent in Cluster 2, and men and younger respondents in Cluster 3. The distribution of profiles did not differ between waves (χ²(2) = 2.35, p = 0.309).
The replication reproduced the reported solution (ARI = 0.99). Silhouette coefficients were low for all solutions (0.22–0.24 for two to six clusters), the solution was moderately stable across 80% subsamples (mean ARI = 0.69; minimum 0.30), and it was reproduced well within the 2022 wave (ARI = 0.90) but less so within the 2024 wave (ARI = 0.36). The profiles should therefore be read as a heuristic segmentation of overlapping orientations, not as sharply separated population groups.
4. Discussion
4.1. General Support and Local Reservations
The results show a familiar pattern in the social acceptance of energy infrastructure [22,23]: strong and stable support for sustainability goals and for the contribution of biorefineries to a more sustainable economy, together with reservations about having a plant nearby. Only about half of the respondents agreed that the benefits of a nearby biorefinery outweigh its nuisances, six in ten preferred plants to be located away from their homes, and one in five chose the maximum distance allowed. Similar gaps between general and local acceptance have been reported for biorefineries and biogas plants [17,30,32]. Our data do not allow these reservations to be labelled as NIMBY attitudes: they come from a hypothetical scenario, and the association between perceived benefits and distance suggests that they partly reflect a weighing of expected local costs and benefits [24,48].
For energy planning, this distinction matters. The conditions most frequently required—odour and pest control, safety, local employment and supplying the bioenergy produced to local demand—are design and governance features that project developers and authorities can address. They are consistent with literature that links acceptance to distributive and procedural justice and to tangible local benefits [23,49,50]. Since biomethane and biogas plants need proximity to feedstock and grids, these conditions should be considered early in siting and design rather than in later communication campaigns.
4.2. Biofuels in the Energy Transition
The decline in willingness to use biofuels between 2022 and 2024 is the most robust change observed. It was small but persisted after adjusting for sample composition. The study does not identify its causes. The 2024 wave was conducted after a period of energy price volatility and public debate about waste fees, but these factors were not measured, and differences in panel composition that are not captured by the covariates cannot be ruled out. Willingness was associated mainly with sustainability attitudes and, to a lesser extent, with the priority given to environmental benefits; the priority of economic incentives was not associated with it, even though cost was the reason most often given for not using biofuels. This combination suggests that cost works as a barrier rather than as a motivation and that environmental arguments are relevant mainly for people already committed to sustainability [34,35].
Perceived knowledge about waste-derived fuels and treatment plants was low and stable, and it was only weakly related to attitudes and willingness. Providing information may be necessary but is unlikely to be sufficient: in line with critiques of information-deficit approaches [23,25], the evidence points to the importance of trust, perceived fairness and visible local benefits.
4.3. Heterogeneous Orientations
The profiles indicate that the arguments considered most relevant for biofuels vary: about four in ten respondents prioritised environmental and safety benefits, and a similar proportion prioritised economic benefits. Because these orientations were derived from a ranking, they express relative priorities rather than absolute levels of concern. The low-engagement profile (15%) combined weak sustainability attitudes with lower support for biorefineries and biofuels, but did not require larger distances. Since the clustering solution is only moderately stable, these profiles can inform hypotheses for segmented engagement—emphasising safety and environmental performance for some audiences and employment and economic returns for others—but the study does not test the effectiveness of such messages [31,51].
4.4. Implications
Four implications follow, framed as potential lines of action rather than demonstrated effects. First, siting and design should address odour control and safety from the outset, and performance should be monitored and reported transparently. Second, local benefits—employment, supply of bioenergy to local demand and fiscal returns to the municipality—should be defined and communicated explicitly, which is consistent with community benefit frameworks [49]. Third, participatory processes before siting decisions may improve perceived procedural fairness [23,50]. Fourth, information on waste-derived fuels and biorefineries should be practical and adapted to different audiences, recognising that information alone is unlikely to change local acceptance.
4.5. Limitations
Some limitations should be borne in mind when interpreting these results. The data come from an online panel with quotas rather than from probability samples, and the composition of the two waves differed somewhat, particularly in age and income. Compared with the adult population of the region, both samples included more people with higher education and fewer older adults, so the findings may give greater weight to the views of younger and more educated residents. Covariate adjustment and standardisation reduce, but cannot fully remove, possible selection effects. Because the two waves are independent cross-sections, they capture aggregate differences rather than individual change, and the associations observed should not be read as causal. The changes made to Q19 and Q20 between waves limit the comparability of those items; in particular, the Q20 comparison assumes that the relative order of the options common to both waves is comparable. The ranking format makes several measures ipsative, which should be considered when reading the correlational and cluster analyses. Distance was assessed through a hypothetical scenario with a limited range of options. Finally, the study focuses on a single, highly urbanised region. Future research could extend it to rural areas and to residents living near specific projects, ideally combining surveys with qualitative methods.
5. Conclusions
In the Community of Madrid, residents strongly support sustainability goals and generally view biorefineries as part of a more sustainable economy, but this support coexists with reservations about nearby facilities and with a decline in willingness to use biofuels between 2022 and 2024. Perceiving that benefits outweigh local nuisances is associated with accepting plants at shorter distances, and the conditions most often required—odour control, safety, local employment and local use of the energy produced—identify concrete aspects of project design and governance. Attitudinal orientations differ across the population, although the profiles identified should be treated as heuristic. For the energy transition, these findings imply that deploying biorefineries and biogas plants depends on combining technical and economic planning with early attention to local impacts, fair distribution of benefits and public participation.
Supplementary Materials
The following supporting information can be downloaded at the website of this paper posted on Preprints.org. S1: Questionnaire (Spanish and English) and codebook; S2: Supplementary tables and figures (Table S1: wave comparisons for all items; Table S2: rankings for Q10, Q11, Q15 and Q16 by wave; Figure S1: waste treatment priorities and perceived effectiveness by wave; Figure S2: correlation matrix of biorefinery perception variables); S3: Analysis code used to verify the reported results.
Author Contributions
Conceptualization, M.G., M.M.-G., J.D. and M.R.-F.; methodology, M.G., M.M.-G., J.D. and M.R.-F.; validation, M.G., M.M.-G. and A.C.-A.; formal analysis, M.G. and A.C.-A.; investigation, M.G., M.M.-G., A.C.-A. and J.R.-L.; data curation, M.G., A.C.-A. and J.R.-L.; writing—original draft preparation, M.G., M.M.-G., A.C.-A. and J.R.-L.; writing—review and editing, M.G., M.M.-G. and A.C.-A.; visualization, M.G. and A.C.-A.; funding acquisition, M.G., J.D. and M.R.-F. All authors have read and agreed to the published version of the manuscript.
Funding
This research was funded by MCIN/AEI/10.13039/501100011033 and by “ERDF A way of making Europe”, grant number PID2021-127019OB-I00 (eCOMCIENCIA project), and by the Community of Madrid, grant numbers TEC-2024/BIO-177 (BIVALIA-CM) and S2018/EMT-4344 (BIOTRES-CM). M.M.-G. acknowledges financial support from the Community of Madrid, grant number 2023-T1/ECO-29202.
Institutional Review Board Statement
The study was conducted in accordance with the Declaration of Helsinki. The 2022 and 2024 surveys were non-interventional, non-biomedical online questionnaires administered to adult members of the SurveyMonkey panel, which did not transfer any directly identifying personal data to the research team; the dataset received and analysed by the authors is anonymous. Favourable opinion of the Research Ethics Committee of Universidad Rey Juan Carlos (220420254072025).
Informed Consent Statement
Informed consent was obtained from all participants. Before starting the questionnaire, participants were informed of the purpose of the research, the anonymous nature of the survey and the use of the data, and participation was voluntary.
Data Availability Statement
The original data presented in the study are openly available in Zenodo at https://doi.org/10.5281/zenodo.24038559, together with the questionnaire, codebook and SPSS outputs. The deposited dataset contains 1068 records (532 from the 2022 wave and 536 from the 2024 wave). The code used to verify the reported results is provided as Supplementary Material S3.
Acknowledgments
During the preparation of this manuscript, the authors used Claude Opus 5.5 (Anthropic) for the purposes of drafting code to verify the statistical results.
Conflicts of Interest
The authors declare no conflicts of interest. The funders had no role in the design of the study; in the collection, analyses or interpretation of data; in the writing of the manuscript; or in the decision to publish the results.
Abbreviations
The following abbreviations are used in this manuscript:
| ARI | Adjusted Rand index |
| CAWI | Computer-assisted web interviewing |
| CI | Confidence interval |
| NIMBY | Not In My Back Yard |
| OLS | Ordinary least squares |
| PNIEC | National Integrated Energy and Climate Plan (Spain) |
| SD | Standard deviation |
References
- United Nations Framework Convention on Climate Change. The Paris Agreement. Available online: https://unfccc.int/process-and-meetings/the-paris-agreement (accessed on 4 November 2026).
- European Commission. The European Green Deal; COM(2019) 640 final; European Commission: Brussels, Belgium, 2019.
- Calvo-Flores, F.G.; Martin-Martinez, F.J. Biorefineries: Achievements and Challenges for a Bio-Based Economy. Front. Chem. 2022, 10, 973417. [CrossRef]
- Islam, N.F.; Gogoi, B.; Saikia, R.; Yousaf, B.; Narayan, M.; Sarma, H. Encouraging Circular Economy and Sustainable Environmental Practices by Addressing Waste Management and Biomass Energy Production. Reg. Sustain. 2024, 5, 100174. [CrossRef]
- Bauer, F.; Coenen, L.; Hansen, T.; McCormick, K.; Palgan, Y.V. Technological Innovation Systems for Biorefineries: A Review of the Literature. Biofuels Bioprod. Biorefining 2017, 11, 534–548. [CrossRef]
- Geissdoerfer, M.; Savaget, P.; Bocken, N.M.P.; Hultink, E.J. The Circular Economy—A New Sustainability Paradigm? J. Clean. Prod. 2017, 143, 757–768. [CrossRef]
- Carbonell-Alcocer, A.; Romero-Luis, J.; Gértrudix-Barrio, M.; Borges-Rey, E. Educating for a Sustainable Future through the Circular Economy: Citizen Involvement and Social Change. Comunicar 2022, 30, 21–32. [CrossRef]
- European Commission. REPowerEU Plan; COM(2022) 230 final; European Commission: Brussels, Belgium, 2022.
- European Parliament; Council of the European Union. Directive (EU) 2023/2413 of 18 October 2023 Amending Directive (EU) 2018/2001, Regulation (EU) 2018/1999 and Directive 98/70/EC as Regards the Promotion of Energy from Renewable Sources. Off. J. Eur. Union 2023, L 2023/2413.
- Jefatura del Estado. Ley 7/2021, de 20 de mayo, de Cambio Climático y Transición Energética. Boletín Oficial del Estado 2021, 121. Available online: https://www.boe.es/eli/es/l/2021/05/20/7 (accessed on 4 November 2026).
- Ministerio para la Transición Ecológica y el Reto Demográfico. Hoja de Ruta del Biogás; MITECO: Madrid, Spain, 2022.
- Ministerio para la Transición Ecológica y el Reto Demográfico. Plan Nacional Integrado de Energía y Clima 2023–2030; MITECO: Madrid, Spain, 2024. Available online: https://www.miteco.gob.es/es/energia/estrategia-normativa/pniec-23-30.html (accessed on 4 November 2026).
- Jefatura del Estado. Ley 7/2022, de 8 de abril, de Residuos y Suelos Contaminados para una Economía Circular. Boletín Oficial del Estado 2022, 85. Available online: https://www.boe.es/buscar/act.php?id=BOE-A-2022-5809 (accessed on 4 November 2026).
- European Parliament; Council of the European Union. Directive (EU) 2018/851 of 30 May 2018 Amending Directive 2008/98/EC on Waste. Off. J. Eur. Union 2018, L 150, 109–140.
- European Parliament; Council of the European Union. Directive (EU) 2019/904 of 5 June 2019 on the Reduction of the Impact of Certain Plastic Products on the Environment. Off. J. Eur. Union 2019, L 155, 1–19.
- Comunidad de Madrid. Ley 1/2024, de 17 de abril, de Economía Circular de la Comunidad de Madrid. Boletín Oficial del Estado 2024. Available online: https://www.boe.es/diario_boe/txt.php?id=BOE-A-2024-14999 (accessed on 4 November 2026).
- Soland, M.; Steimer, N.; Walter, G. Local Acceptance of Existing Biogas Plants in Switzerland. Energy Policy 2013, 61, 802–810. [CrossRef]
- Macht, J.; Klink-Lehmann, J.; Hartmann, M. Don’t Forget the Locals: Understanding Citizens’ Acceptance of Bio-Based Technologies. SSRN 2023. [CrossRef]
- García Reina, H. Adiós a la planta de biogás en Cubas de la Sagra [Goodbye to the biogas plant in Cubas de la Sagra]. Madridiario, 5 September 2024. Available online: https://www.madridiario.es/adios-planta-biogas-cubas-sagra-acciona-baja-propio-proyecto (accessed on 5 November 2026).
- Ayuntamiento de Colmenar Viejo. Informe de la Arquitecta Municipal: Licencia de Obra de la Planta de Tratamiento de Biorresiduos de Colmenar Viejo [Municipal Architect’s Report: Building Licence for the Colmenar Viejo Biowaste Treatment Plant]; Ayuntamiento de Colmenar Viejo: Colmenar Viejo, Spain, 17 July 2026. Available online: https://colmenarviejo.com/ayuntamiento/concejalias/urbanismo-actividades-y-disciplina/urbanismo/informacion-publica-licencia-de-obra-planta-de-tratamiento-biorresiduos-de-colmenar-viejo/5-informe-arquitecta-municipal-licencia-de-obra-17-julio-2026.pdf (accessed on 5 November 2026).
- Guerrero, D. La planta de biogás de Colmenar Viejo se enfrenta a su primera demanda judicial este lunes [The Colmenar Viejo biogas plant faces its first lawsuit this Monday]. Cadena SER, 16 October 2026. Available online: https://cadenaser.com/cmadrid/2026/10/16/la-planta-de-biogas-de-colmenar-viejo-se-enfrenta-a-su-primera-demanda-judicial-este-lunes-ser-madrid-norte/ (accessed on 5 November 2026).
- Wüstenhagen, R.; Wolsink, M.; Bürer, M.J. Social Acceptance of Renewable Energy Innovation: An Introduction to the Concept. Energy Policy 2007, 35, 2683–2691. [CrossRef]
- Batel, S. Research on the Social Acceptance of Renewable Energy Technologies: Past, Present and Future. Energy Res. Soc. Sci. 2020, 68, 101544. [CrossRef]
- Devine-Wright, P. Rethinking NIMBYism: The Role of Place Attachment and Place Identity in Explaining Place-Protective Action. J. Community Appl. Soc. Psychol. 2009, 19, 426–441. [CrossRef]
- Aitken, M. Why We Still Don’t Understand the Social Aspects of Wind Power: A Critique of Key Assumptions within the Literature. Energy Policy 2010, 38, 1834–1841. [CrossRef]
- Freudenburg, W.R.; Pastor, S.K. NIMBYs and LULUs: Stalking the Syndromes. J. Soc. Issues 1992, 48, 39–61. [CrossRef]
- Segreto, M.; Principe, L.; Desormeaux, A.; Torre, M.; Tomassetti, L.; Tratzi, P.; Paolini, V.; Petracchini, F. Trends in Social Acceptance of Renewable Energy Across Europe—A Literature Review. Int. J. Environ. Res. Public Health 2020, 17, 9161. [CrossRef]
- Rodríguez-Segura, F.J.; Osorio-Aravena, J.C.; Frolova, M.; Terrados-Cepeda, J.; Muñoz-Cerón, E. Social Acceptance of Renewable Energy Development in Southern Spain: Exploring Tendencies, Locations, Criteria and Situations. SSRN 2022. [CrossRef]
- Peck, P.; Bennett, S.J.; Bissett-Amess, R.; Lenhart, J.; Mozaffarian, H. Examining Understanding, Acceptance, and Support for the Biorefinery Concept among EU Policy-Makers. Biofuels Bioprod. Biorefining 2009, 3, 361–383. [CrossRef]
- McGuire, J.B.; Leahy, J.E.; Marciano, J.A.; Lilieholm, R.J.; Teisl, M.F. Social Acceptability of Establishing Forest-Based Biorefineries in Maine, United States. Biomass Bioenergy 2017, 105, 155–163. [CrossRef]
- Marciano, J.A.; Lilieholm, R.J.; Teisl, M.F.; Leahy, J.E.; Neupane, B. Factors Affecting Public Support for Forest-Based Biorefineries: A Comparison of Mill Towns and the General Public in Maine, USA. Energy Policy 2014, 75, 301–311. [CrossRef]
- Lee, G.E.; Loveridge, S.; Joshi, S. Local Acceptance and Heterogeneous Externalities of Biorefineries. Energy Econ. 2017, 67, 328–336. [CrossRef]
- Kokkinos, K.; Lakioti, E.; Papageorgiou, E.; Moustakas, K.; Karayannis, V. Fuzzy Cognitive Map-Based Modeling of Social Acceptance to Overcome Uncertainties in Establishing Waste Biorefinery Facilities. Front. Energy Res. 2018, 6, 112. [CrossRef]
- Dessì, F.; Ariccio, S.; Albers, T.; Alves, S.; Ludovico, N.; Bonaiuto, M. Sustainable Technology Acceptability: Mapping Technological, Contextual, and Social-Psychological Determinants of EU Stakeholders’ Biofuel Acceptance. Renew. Sustain. Energy Rev. 2022, 158, 112114. [CrossRef]
- Emmerich, P.; Hülemeier, A.-G.; Jendryczko, D.; Baumann, M.J.; Weil, M.; Baur, D. Public Acceptance of Emerging Energy Technologies in Context of the German Energy Transition. Energy Policy 2020, 142, 111516. [CrossRef]
- Halder, P.; Pietarinen, J.; Havu-Nuutinen, S.; Pöllänen, S.; Pelkonen, P. The Theory of Planned Behavior Model and Students’ Intentions to Use Bioenergy: A Cross-Cultural Perspective. Renew. Energy 2016, 89, 627–635. [CrossRef]
- Eskelinen, T.; Sydd, O.; Kajanus, M.; Fernández Gutiérrez, D.; Mitsou, M.; Soriano Disla, J.M.; Sevilla, M.V.; Ib Hansen, J. Fortifying Social Acceptance When Designing Circular Economy Business Models on Biowaste Related Products. Sustainability 2022, 14, 14983. [CrossRef]
- Ajzen, I. The Theory of Planned Behavior. Organ. Behav. Hum. Decis. Process. 1991, 50, 179–211. [CrossRef]
- Instituto Nacional de Estadística. Cifras Oficiales de Población de los Municipios Españoles. Available online: https://www.ine.es/jaxiT3/Tabla.htm?t=2881 (accessed on 4 November 2026).
- Baker, R.; Brick, J.M.; Bates, N.A.; Battaglia, M.; Couper, M.P.; Dever, J.A.; Gile, K.J.; Tourangeau, R. Summary Report of the AAPOR Task Force on Non-Probability Sampling. J. Surv. Stat. Methodol. 2013, 1, 90–143. [CrossRef]
- American Association for Public Opinion Research. AAPOR Code of Professional Ethics and Practices: Disclosure Standards. Available online: https://aapor.org/standards-and-ethics/disclosure-standards/ (accessed on 4 November 2026).
- SurveyMonkey. ESOMAR 37 Questions to Help Buyers of Online Samples. Available online: https://www.surveymonkey.com/mp/legal/esomar-37/ (accessed on 4 November 2026).
- Romero-Luis, J.; Gertrudix, M.; Gertrudis Casado, M.d.C.; Carbonell-Alcocer, A. Biotechnology and Bio-Based Products Perceptions in the Community of Madrid: A Representative Survey Dataset. Data 2023, 8, 84. [CrossRef]
- Instituto Nacional de Estadística. Clasificación Nacional de Educación 2014 (CNED-2014); INE: Madrid, Spain, 2014.
- UNESCO Institute for Statistics. International Standard Classification of Education: ISCED 2011; UNESCO Institute for Statistics: Montreal, QC, Canada, 2012.
- Instituto Nacional de Estadística. Estadística Continua de Población: Población Residente por Fecha, Sexo y Edad, Comunidades Autónomas (Table 56940). Available online: https://www.ine.es/jaxiT3/Tabla.htm?t=56940 (accessed on 5 November 2026).
- Instituto Nacional de Estadística. Encuesta de Población Activa: Población de 16 y más Años por Nivel de Formación Alcanzado, Sexo y Comunidad Autónoma (Table 66017). Available online: https://www.ine.es/jaxiT3/Tabla.htm?t=66017 (accessed on 5 November 2026).
- Wang, Y.; Shen, C.; Bartsch, K.; Zuo, J. Exploring the Trade-Off between Benefit and Risk Perception of NIMBY Facility: A Social Cognitive Theory Model. Environ. Impact Assess. Rev. 2021, 87, 106555. [CrossRef]
- World Resources Institute. Clean Energy Projects Can Overcome Barriers with Community Benefits Frameworks. Available online: https://www.wri.org/insights/clean-energy-community-benefits-agreements (accessed on 4 November 2026).
- Axon, S.; Morrissey, J. Just Energy Transitions? Social Inequities, Vulnerabilities and Unintended Consequences. Build. Cities 2020, 1, 393–411. [CrossRef]
- Hübner, G.; Leschinger, V.; Müller, F.J.Y.; Pohl, J. Broadening the Social Acceptance of Wind Energy—An Integrated Acceptance Model. Energy Policy 2023, 173, 113360. [CrossRef]
Figure 1.
Agreement with sustainability attitude and perceived knowledge items by wave (% answering 4 or 5 on a 1–5 scale). The first four items form the sustainability attitude index and the last four the perceived knowledge index. Valid n per item: 2022, 455–511; 2024, 479–516.
Figure 1.
Agreement with sustainability attitude and perceived knowledge items by wave (% answering 4 or 5 on a 1–5 scale). The first four items form the sustainability attitude index and the last four the perceived knowledge index. Valid n per item: 2022, 455–511; 2024, 479–516.
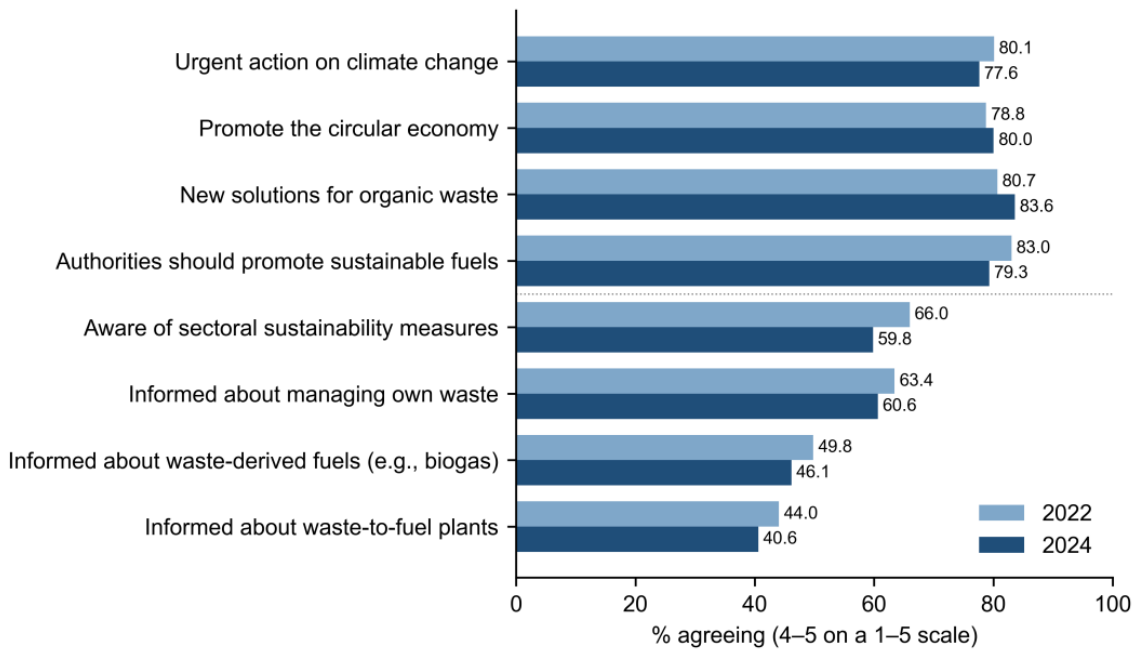
Figure 2.
Distribution of self-reported likelihood of using biofuels instead of other fuels if given the opportunity (Q14; 1 = very unlikely, 5 = totally likely), by wave. Values are percentages of valid responses.
Figure 2.
Distribution of self-reported likelihood of using biofuels instead of other fuels if given the opportunity (Q14; 1 = very unlikely, 5 = totally likely), by wave. Values are percentages of valid responses.
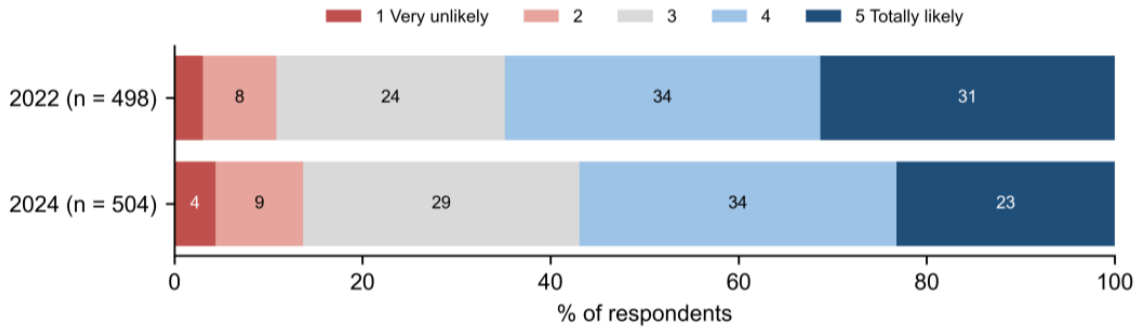
Figure 3.
Agreement with statements about biorefineries by wave (Q17; % answering 4 or 5 on a 1–5 scale). Valid n: 2022, 499–501; 2024, 503–505.
Figure 3.
Agreement with statements about biorefineries by wave (Q17; % answering 4 or 5 on a 1–5 scale). Valid n: 2022, 499–501; 2024, 503–505.
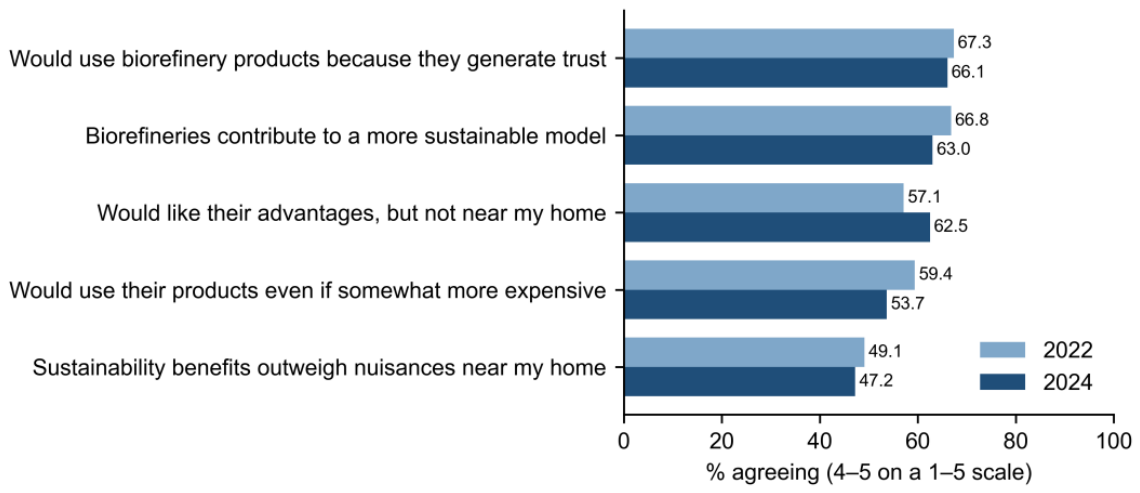
Figure 4.
(a) Distribution of the stated minimum acceptable distance between a biorefinery and the respondent’s home (Q18; response range 1–30 km) by wave. (b) Mean distance (95% confidence interval) by agreement that the sustainability benefits of a nearby biorefinery outweigh its nuisances (1 = totally disagree, 5 = totally agree); pooled waves, n = 1005.
Figure 4.
(a) Distribution of the stated minimum acceptable distance between a biorefinery and the respondent’s home (Q18; response range 1–30 km) by wave. (b) Mean distance (95% confidence interval) by agreement that the sustainability benefits of a nearby biorefinery outweigh its nuisances (1 = totally disagree, 5 = totally agree); pooled waves, n = 1005.
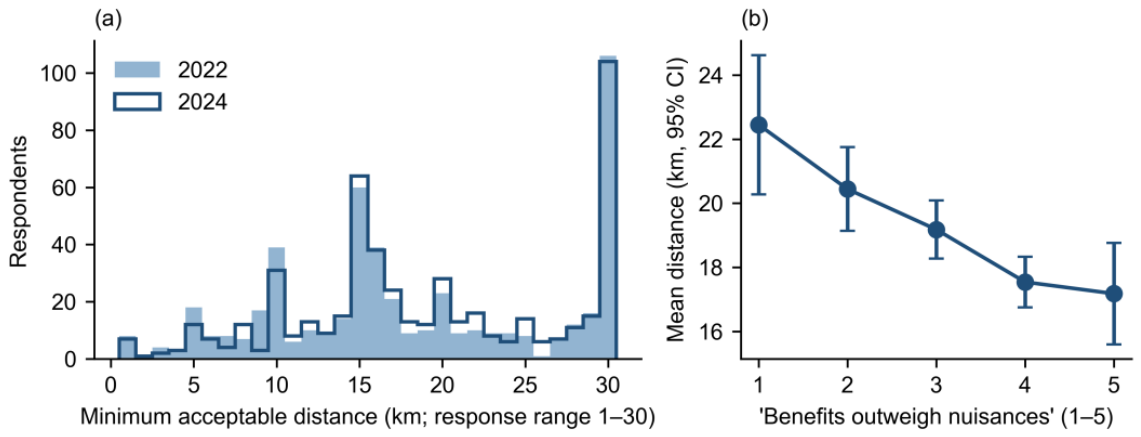
Figure 5.
Requirements considered essential to accept a biorefinery in the respondent’s municipality, by wave (Q19; multiple response; % of respondents). * Option added in 2024 (n/a, not asked in 2022). 2022, n = 532; 2024, n = 536.
Figure 5.
Requirements considered essential to accept a biorefinery in the respondent’s municipality, by wave (Q19; multiple response; % of respondents). * Option added in 2024 (n/a, not asked in 2022). 2022, n = 532; 2024, n = 536.
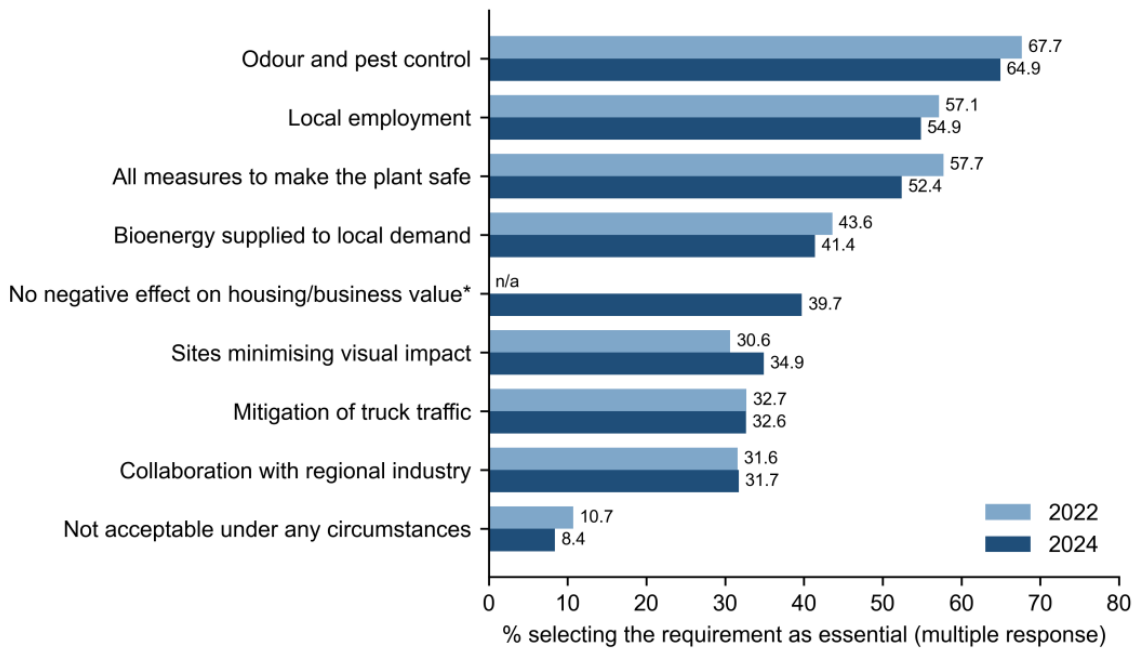
Figure 6.
Concerns about the installation of a waste treatment plant near the respondent’s home (Q20). (a) Percentage ranking each of the five options common to both waves first; 2024 rankings were re-ranked among these five options. (b) Percentage ranking each option among the top three in 2024 (eight options); options added in 2024 are shown in orange. Valid complete rankings: 2022, n = 480; 2024, n = 489.
Figure 6.
Concerns about the installation of a waste treatment plant near the respondent’s home (Q20). (a) Percentage ranking each of the five options common to both waves first; 2024 rankings were re-ranked among these five options. (b) Percentage ranking each option among the top three in 2024 (eight options); options added in 2024 are shown in orange. Valid complete rankings: 2022, n = 480; 2024, n = 489.
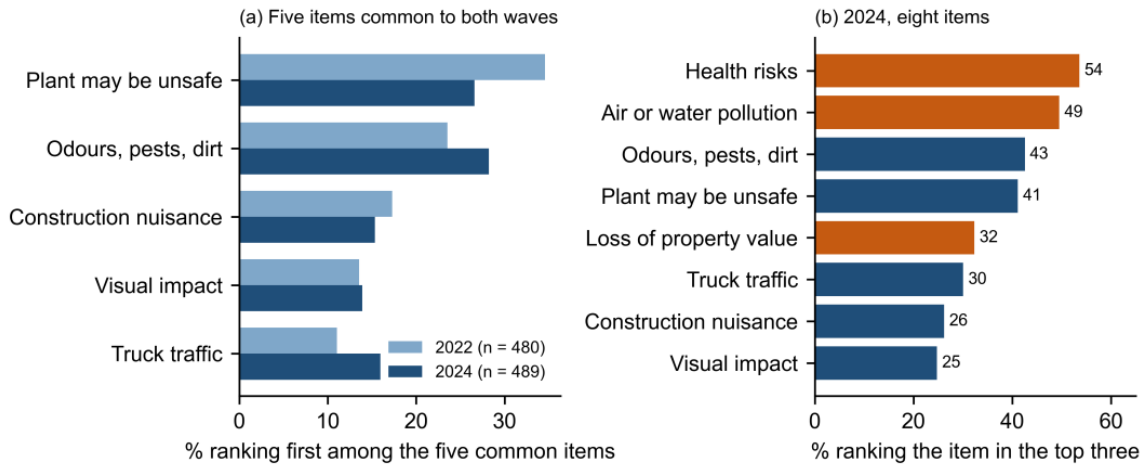
Figure 7.
Cluster centroids (standardised scores) of the five clustering variables. The three motive variables derive from the ranking of reasons to use biofuels (Q15), so higher priority for one motive implies lower priority for others. n = 961.
Figure 7.
Cluster centroids (standardised scores) of the five clustering variables. The three motive variables derive from the ranking of reasons to use biofuels (Q15), so higher priority for one motive implies lower priority for others. n = 961.
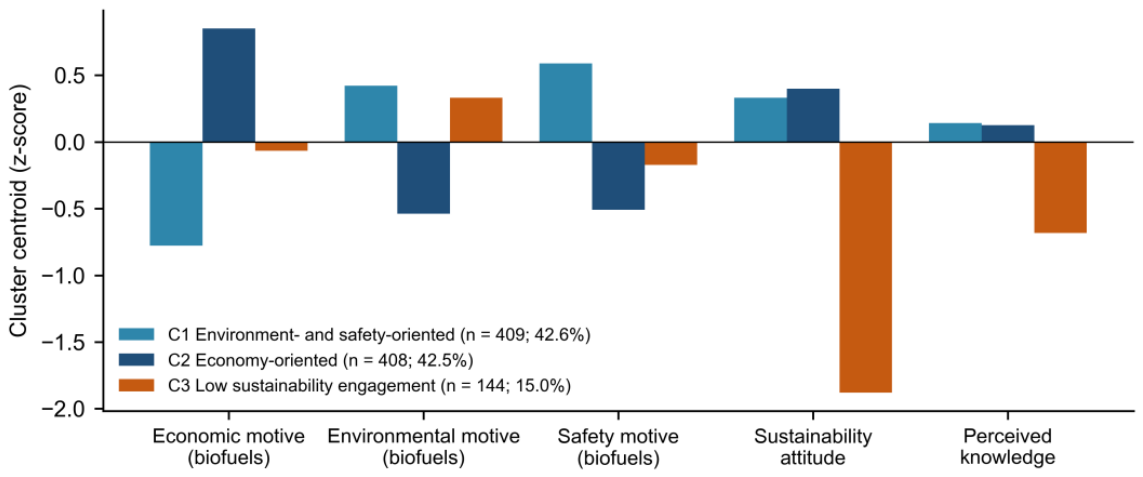

Table 1.
Measures used in the analysis.
| Block (questions) | Measure | Response format | Hypothesis |
|---|---|---|---|
| Sustainability (Q9) | Attitude index (4 items); perceived knowledge index (4 items) | Agreement, 1–5 | H1 |
| Sustainability (Q10–Q11) | Priority of climate actions (7R); environmental concerns | Rankings (7 and 8 options) | Descriptive |
| Waste treatment (Q12–Q13) | Priority of four treatments; agreement with source separation and treatment effectiveness | Ranking (4 options); agreement, 1–5 | H2 |
| Biofuels (Q14) | Likelihood of using biofuels instead of other fuels | 1–5 | H3 |
| Biofuels (Q15–Q16) | Reasons to use (6) and not to use (7) biofuels | Rankings | H3 |
| Biorefineries (Q17) | Benefits vs. nuisances, not near home, sustainability, trust, pay more | Agreement, 1–5 | H4 |
| Biorefineries (Q18) | Minimum acceptable distance from home | 1–30 km | H4 |
| Biorefineries (Q19) | Essential requirements for a plant in the municipality | Multiple response (9 options; 8 in 2022) | Descriptive |
| Biorefineries (Q20) | Concerns about a nearby plant | Ranking (5 options in 2022; 8 in 2024) | Descriptive |
Table 2.
Sample composition by wave and reference values for the adult population of the Community of Madrid (%).
Table 2.
Sample composition by wave and reference values for the adult population of the Community of Madrid (%).
| Variable | Category | Sample 2022 | Population 2022 | Sample 2024 | Population 2024 |
|---|---|---|---|---|---|
| Gender | Man | 46.8 | 47.1 | 49.4 | 47.2 |
| Woman | 52.6 | 52.9 | 50.4 | 52.8 | |
| Prefer not to say | 0.6 | — | 0.2 | — | |
| Education | Up to lower secondary | 15.4 | 33.7 | 9.5 | 34.1 |
| Upper secondary / intermediate VET | 22.2 | 25.5 | 23.5 | 24.8 | |
| Higher education (total) | 62.4 | 40.8 | 67.0 | 41.2 | |
| – of which higher VET | 16.2 | — | 12.9 | — | |
| – of which bachelor’s degree | 31.2 | — | 35.6 | — | |
| – of which master’s or doctorate | 15.0 | — | 18.5 | — | |
| Age | 18–24 | 9.2 | 9.1 | 12.1 | 9.5 |
| 25–34 | 17.4 | 14.8 | 24.5 | 15.2 | |
| 35–44 | 22.1 | 18.0 | 25.2 | 16.8 | |
| 45–54 | 24.7 | 20.1 | 21.3 | 19.8 | |
| 55–64 | 10.6 | 15.9 | 12.1 | 16.1 | |
| 65 or over | 16.0 | 22.3 | 4.7 | 22.6 | |
| Income | Up to €999 | 11.3 | — | 8.8 | — |
| €1000–1999 | 37.6 | — | 23.7 | — | |
| €2000–2999 | 30.1 | — | 34.7 | — | |
| €3000 or more | 21.0 | — | 32.8 | — |
Sample: n = 532 (2022) and 536 (2024); income is net monthly household income. Gender χ²(2) = 1.68, p = 0.432; age χ²(5) = 44.91, p < 0.001; education χ²(7) = 19.99, p = 0.006; employment χ²(8) = 32.08, p < 0.001; income χ²(7) = 41.65, p < 0.001 (2022 vs. 2024); gender n = 530 and 536; age n = 530 and 535. Population: gender and age, residents aged 18 and over on 1 October 2022 and 1 October 2024 (INE, Continuous Population Statistics) [46]; education, residents aged 16 and over, annual averages for 2022 and 2024 (INE, Labour Force Survey), which does not distinguish higher VET from university levels [47]. No comparable official distribution of net monthly household income is available; —, not available. VET, vocational education and training.
Table 3.
Differences between waves in selected measures.
| Measure (scale) | 2022 M (SD) | 2024 M (SD) | d | Adjusted difference [95% CI] | p (adj.) |
|---|---|---|---|---|---|
| Sustainability attitude index (1–5) | 4.20 (1.02) | 4.15 (0.94) | 0.05 | −0.03 [−0.16, 0.09] | 0.599 |
| Perceived knowledge index (1–5) | 3.45 (0.98) | 3.39 (0.91) | 0.06 | −0.06 [−0.18, 0.07] | 0.362 |
| Willingness to use biofuels (1–5) | 3.82 (1.05) | 3.62 (1.07) | 0.19 | −0.22 [−0.36, −0.08] | 0.002 |
| Benefits outweigh nuisances (1–5) | 3.36 (1.04) | 3.25 (1.08) | 0.10 | −0.12 [−0.26, 0.02] | 0.086 |
| Prefer not near home (1–5) | 3.62 (1.04) | 3.71 (1.04) | −0.09 | 0.08 [−0.06, 0.21] | 0.270 |
| Contribute to sustainability (1–5) | 3.80 (0.93) | 3.73 (0.90) | 0.08 | −0.07 [−0.19, 0.05] | 0.243 |
| Products generate trust (1–5) | 3.82 (0.99) | 3.77 (0.94) | 0.05 | −0.04 [−0.16, 0.09] | 0.541 |
| Would pay more (1–5) | 3.60 (1.04) | 3.48 (1.07) | 0.12 | −0.12 [−0.26, 0.02] | 0.081 |
| Minimum acceptable distance (km) | 18.46 (8.46) | 19.11 (7.98) | −0.08 | 1.03 [−0.03, 2.09] | 0.057 |
| Composting priority (1–4) | 2.74 (1.12) | 2.89 (1.08) | −0.13 | 0.17 [0.02, 0.31] | 0.022 |
| Landfill priority (1–4) | 2.46 (1.13) | 2.30 (1.10) | 0.15 | −0.20 [−0.35, −0.05] | 0.008 |
d: Cohen’s d (2022 minus 2024). Adjusted difference: OLS coefficient for 2024 vs. 2022, controlling for gender, age group, educational level and income; HC3 standard errors; n = 962–1018 depending on the measure. Valid n per wave: 455–516.
Table 4.
Linear model of willingness to use biofuels (Q14, 1–5).
| Predictor | b | 95% CI | p |
|---|---|---|---|
| Sustainability attitude index | 0.32 | [0.23, 0.41] | <0.001 |
| Perceived knowledge index | 0.01 | [−0.07, 0.09] | 0.883 |
| Priority: environmental benefits (Q15, 1–6) | 0.05 | [0.01, 0.09] | 0.009 |
| Priority: economic incentives (Q15, 1–6) | 0.01 | [−0.03, 0.04] | 0.817 |
| Wave 2024 (ref. 2022) | −0.23 | [−0.37, −0.10] | <0.001 |
OLS with HC3 standard errors, controlling for gender, age group, educational level and income (coefficients not shown). n = 946; adjusted R² = 0.13.
Table 5.
Characteristics of the attitudinal profiles.
| Characteristic | C1 Environment/safety | C2 Economy | C3 Low engagement | Test |
|---|---|---|---|---|
| n (%) | 409 (42.6) | 408 (42.5) | 144 (15.0) | |
| Biorefinery support index (1–5) | 3.70 | 3.77 | 2.97 | F = 74.75, p < 0.001 |
| Willingness to use biofuels (1–5) | 3.83 | 3.88 | 3.11 | |
| Minimum acceptable distance (km) | 18.7 | 18.9 | 18.1 | F = 0.43, p = 0.649 |
| Left–right self-placement (1–10) | 5.31 | 4.92 | 6.06 | F = 4.41, p = 0.013 |
| Women (%) | 54.7 | 51.0 | 38.5 | V = 0.11, p = 0.005 |
| Aged 45 or over (%) | 40.3 | 51.2 | 34.0 | V = 0.11, p = 0.008 |
| 2022 / 2024 (n) | 206 / 203 | 192 / 216 | 78 / 66 | χ² = 2.35, p = 0.309 |
Clustering variables: priority of economic, environmental and safety reasons to use biofuels (Q15) and sustainability attitude and knowledge indices (z-scores). V: Cramér’s V for the full categorical variable.
Disclaimer/Publisher’s Note: The statements, opinions and data contained in all publications are solely those of the individual author(s) and contributor(s) and not of MDPI and/or the editor(s). MDPI and/or the editor(s) disclaim responsibility for any injury to people or property resulting from any ideas, methods, instructions or products referred to in the content. |
© 2026 by the authors. Licensee MDPI, Basel, Switzerland. This article is an open access article distributed under the terms and conditions of the Creative Commons Attribution (CC BY) license.
Copyright: This open access article is published under a Creative Commons CC BY 4.0 license, which permit the free download, distribution, and reuse, provided that the author and preprint are cited in any reuse.