

Submitted:
15 November 2026
Posted:
16 November 2026
You are already at the latest version
Abstract
Transcriptome-wide differences in RNA modification-associated signals are often interpreted alongside lists of responsive sites, although the two may not be equally reproducible. We reanalysed published xPore measurements from wild-type and METTL3-knockout HEK293T cells to examine whether widespread WT–KO responses were accompanied by stable site-level rankings. From 62,222 centered-adenosine positions, we selected 1,293 DRACH sites and matched each to a non-DRACH site based on sequencing coverage and baseline knockout modification rate. Sites were ranked by WT–KO differences (contrasts) of two replicate pairs; the third contrast was examined retrospectively. Although positive WT–KO responses were common in both motif classes, site-level agreement differed markedly. After centering responses within five-nucleotide sequence contexts, Spearman correlations between the two-contrast rankings and the third contrast were 0.815 (95% CI 0.786–0.841) for DRACH sites and −0.021 for matched non-DRACH sites (−0.080 to 0.035). Among the 129 highest-ranked sites (top 10%) per contrast, 87 DRACH sites but only two non-DRACH sites appeared in all three sets. Reproducibility followed independent m6A evidence rather than the motif: GLORI-supported sites ranked reproducibly in both classes (ρ = 0.88 and 0.73), whereas unsupported non-DRACH sites did not (ρ = 0.00). Single non-DRACH contrasts had near-zero reliability, so more replicates would not stabilize their rankings, and part of the non-DRACH response also appeared between same-condition replicates. These findings show that widespread perturbation-associated responses can coexist with poor reproducibility of individual site identities, highlighting the need to evaluate aggregate signals and site-level stability separately and to prioritize reproducible, independently supported sites for follow-up.
Keywords:
RNA modifications
; epitranscriptomics
; DRACH motif
; nanopore direct RNA sequencing
; site-level reproducibility
; differential RNA modification
; xPore
; METTL3
1. Introduction
Chemical modifications of RNA can affect transcript processing, stability and translation, with N6-methyladenosine (m6A) among the most extensively studied marks in mammalian messenger RNA (Delaunay et al., 2024; Ahi and Singh, 2025). The proteins that deposit, remove or recognize these modifications can change their activity or availability in response to cellular conditions (Jalali and Ahi, 2026). As a result, transcriptome-wide modification measurements are increasingly used to investigate responses to perturbation. Yet the extent of an apparent response and the reliability with which its individual sites are identified are different questions. A broad shift may persist even when the nucleotide positions ranked as most responsive change between measurements.
Early m6A maps identified a non-random distribution along mammalian transcripts, with enrichment around stop codons and within characteristic sequence motifs (Dominissini et al., 2012; Meyer et al., 2012). Methods have since moved beyond antibody-enriched regions toward measurements at individual nucleotide positions (Garcia-Campos et al., 2019; Hu et al., 2022). Chemical conversion methods such as GLORI provide quantitative estimates of m6A at single-base resolution (Liu et al., 2023), while nanopore direct RNA sequencing records electrical signals that may carry information about RNA modifications (Wawrzyniak et al., 2026). xPore models these signals to estimate modification-associated fractions and differences between conditions; m6Anet uses read-level signal features to predict m6A (Pratanwanich et al., 2021; Hendra et al., 2022). The nanopore-derived outputs are not direct chemical measurements, and their interpretation depends on the assumptions and performance of the respective analysis methods.
Sequence context is especially important for nanopore measurements. Although mammalian m6A is enriched in the DRACH motif, experiments with synthetic RNA have detected modification-dependent signal changes in both DRACH and non-DRACH sequences (Leger et al., 2021). The signal associated with a modified nucleotide may also extend into neighbouring sequence windows (Leger et al., 2021). Recent comparisons of nanopore modification-detection tools have reported differences in accuracy across methods, chemistries and modification types, while tests of modification-aware basecalling have documented false-positive predictions associated with neighbouring modifications (Luo et al., 2026; Diensthuber et al., 2026). These findings warrant caution when comparing responses assigned to different sequence contexts.
Reproducibility is a separate concern. A reanalysis of antibody-based m6A sequencing found variable recovery of enriched regions and limited agreement in reported modification changes across studies (McIntyre et al., 2020). Those findings cannot be assumed to hold for nanopore-derived estimates, but they illustrate why broad response patterns and recurring site identities should be evaluated separately. Even within one assay, agreement in response direction does not establish concordance of rankings or recovery of the same highest-ranked sites. A related statistical consideration is regression to the mean: sites selected because they show the largest response in one measurement tend to show smaller responses when measured again, and the extent of this shrinkage depends on the reliability of the measurement (Barnett et al., 2005; Palmer and Pe'er, 2017).
Here, we reanalyse published xPore data from wild-type and METTL3-knockout HEK293T cells (Pratanwanich et al., 2021). By comparing coverage- and baseline-matched DRACH and non-DRACH sites, we assess whether rankings derived from two replicate contrasts agree with a third contrast examined retrospectively. We also examine five-nucleotide context, alternative ranking scores and the relationship between aggregate responses and the identity of individual responsive sites. Because the DRACH consensus reflects the sequence preference of the METTL3–METTL14 complex, DRACH sites are expected to contain a larger proportion of METTL3-dependent m6A than non-DRACH sites; the comparison therefore contrasts a population enriched in genuine targets with a population in which most responses are expected to arise from other sources. Motif membership was nevertheless treated as a probabilistic label rather than as evidence of modification, and independent single-base m6A maps (Koh et al., 2019; Liu et al., 2023) were used to separate the contribution of the motif from that of methylation itself. We further tested whether non-DRACH responses could be explained by signal spill-over from nearby modified bases, whether additional replicates would be expected to stabilize their rankings, and whether reproducible site identities were linked to functionally characterized m6A genes.
2. Materials and Methods
2.1. Data Source and Site Classification
We reanalysed publicly available xPore results from nanopore direct RNA sequencing of wild-type (WT), METTL3-knockout (KO) and knockdown HEK293T cells (Pratanwanich et al., 2021). The data were obtained from Supplementary Data 3 of the original publication, which reports site-level modification-rate estimates and sequencing coverage for three replicate-labelled measurements per condition. We used these processed estimates without repeating nanopore signal processing or modification calling. These estimates are model-based modification-rate weights derived from a two-component mixture model of nanopore current intensities, rather than chemical stoichiometry, and were reported only for positions that passed the coverage and filtering criteria of the original study (Pratanwanich et al., 2021). The METTL3-knockout HEK293T cells, their generation and their validation are described in that study and were not re-examined here. Because some METTL3-knockout lines express alternatively spliced, catalytically active METTL3 isoforms (Poh et al., 2022), residual METTL3-dependent methylation in the knockout samples cannot be excluded. For each corresponding WT–KO replicate contrast, the modification-associated response was defined as the estimated WT modification rate minus the KO rate. WT and KO measurements were paired by their replicate labels (WT1 with KO1, WT2 with KO2 and WT3 with KO3), because the source table did not indicate whether replicates with the same label shared a sequencing run or flow cell; all six possible pairings were therefore also analysed (Section 2.4). Positive values therefore indicated higher estimated modification rates in WT cells. Knockdown measurements were not used in the present comparisons.
The source table contained 62,222 positions with five-nucleotide sequences centred on adenosine. Sites matching the DRACH consensus (D = A/G/U, R = A/G and H = A/C/U) were classified as DRACH, while the remaining centred-adenosine positions were assigned to the non-DRACH group. The classification follows the established sequence preference of mammalian m6A (Linder et al., 2015), but motif membership was not considered independent evidence of modification status. Five-mers are shown with RNA letters (U) in the text and figures. The source identifier recorded for each position in the xPore table is an Ensembl gene identifier and is referred to below as the gene identifier.
2.2. Site Eligibility, Sequence-Context Adjustment and Matching
Given the influence of neighbouring nucleotides on nanopore measurements (Leger et al., 2021), we examined responses both before and after adjustment for local sequence context. For each replicate contrast, the median WT–KO response among all sites sharing the same five-mer was subtracted from the response at each position. These context medians were calculated before applying coverage-based site selection. Five-mers with fewer than ten finite responses in a replicate were not assigned centered estimates for that contrast. Because this procedure used all three contrasts, including the evaluation contrast, sensitivity analyses repeated the centering with medians estimated from the two training contrasts only and applied unchanged to the third contrast (Section 2.7).
The primary analysis required finite centered responses across all three contrasts, a minimum WT/KO sequencing coverage of at least 50 in each contrast, and an available baseline KO modification-rate estimate. Baseline KO rate was calculated as the mean of the KO estimates from the first two contrasts. Coverage for matching was defined as the minimum WT/KO depth across those same two contrasts and transformed using log (1 + coverage). The same coverage definition, ln(1 + minimum WT/KO coverage across contrasts 1 and 2), was used in all figures.
DRACH and non-DRACH sites were matched on coverage and baseline KO rate. Quartile boundaries calculated across all eligible sites defined 16 joint strata. Within each stratum, sites were ordered by their combined standardized absolute differences from the stratum medians of the two covariates. Equal numbers of DRACH and non-DRACH sites were then paired without replacement, with deterministic rules for resolving ties. Matching balance was assessed using standardized mean differences and distributional diagnostics (Stuart, 2010; Austin, 2009). The study design and matching procedure are summarized in Figure 1, with further balance diagnostics in Supplementary Fig. S1 and derived site-level information in Supplementary Data S1. Because this procedure paired sites that were close to the stratum medians rather than individually similar partners, it was complemented by nearest-neighbour matching (Section 2.7).
2.3. Site Ranking and Reproducibility Assessment
Site rankings were constructed from replicate contrasts 1 and 2 and evaluated against contrast 3. We compared three scores: the mean raw WT–KO response, the mean five-mer-centered response, and the minimum of the two centered responses. The last score favoured sites with consistently positive context-adjusted responses across the training contrasts.
For each scoring approach, the primary evaluation outcome was the centered response in contrast 3. To compare raw and centered scores on equal terms, each score was also evaluated against the contrast-3 response on the same scale (raw score against raw response and centered score against centered response). Reproducibility was quantified using Spearman's rank correlation (Spearman, 1904), overlap enrichment among the highest-ranked sites, and the mean centered response of selected sites relative to the corresponding cohort mean (the centered-response difference, labelled "lift" in figures). The selected set comprised the highest-ranking 10% of sites, with a minimum of ten sites. Overlap enrichment was calculated as the observed intersection divided by the intersection expected between uniformly selected sets of equal size; because its maximum depends on the selected fraction (tenfold for the top 10%), it is reported together with the observed and expected numbers of shared sites.
Sensitivity analyses repeated these comparisons using all eligible unmatched sites and a second matched cohort restricted to sites sharing the same recorded source identifier (gene identifier) and coverage quartile. The latter comparison assessed whether the findings persisted under tighter identifier-based matching; it was not treated as independent biological replication.
Although contrast 3 was excluded from the construction of ranking scores and matching covariates, its coverage contributed to site eligibility and its responses were used to calculate the corresponding five-mer medians. Moreover, this contrast had been examined during earlier analyses of the dataset. The assessment was therefore retrospective, rather than an independent prospective validation. Full numerical comparisons are provided in Supplementary Data S2. Descriptive decision criteria (absolute standardized mean difference ≤ 0.25 for both matching covariates, DRACH Spearman correlation ≥ 0.25 and a DRACH minus non-DRACH difference ≥ 0.20) are encoded in the analysis code; they were defined after contrast 3 had been inspected, and their outcomes are reported in Supplementary Data S3.
Uncertainty was estimated with a gene-level (cluster) bootstrap, because the matched cohort contained 2,586 sites on 933 genes (2.8 sites per gene): genes were resampled with replacement (1,000 resamples), all matched sites of the sampled genes were retained, and percentile 95% confidence intervals were calculated for each measure and for the DRACH minus non-DRACH differences. The motif difference was tested with a paired permutation test in which the DRACH and non-DRACH labels were exchanged at random within matched pairs (2,000 permutations). To assess dependence on the choice of evaluation contrast, each contrast served once as the evaluation set, with the other two used for ranking and for five-mer centering.
Because overlap enrichment depends on the selected fraction, correspondence at the top (CAT) was also calculated as the proportion of the top-k sites by training score that were among the top-k sites of contrast 3, for every list size k, and compared with the chance expectation k/n (Irizarry et al., 2005); 95% bands were obtained by gene-level bootstrap.
As a model-based alternative to the bootstrap, rank-based linear mixed models were fitted with the lme4 package (Bates et al., 2015). The normal-score-transformed contrast-3 response was modelled with the transformed training score, motif class and their interaction as fixed effects and a random intercept for gene; ranks were transformed within each motif class so that slopes were comparable to Spearman correlations. The motif effect, defined as the difference in slopes, was tested with a likelihood-ratio test, and models with gene-specific slopes or without a gene effect were fitted as sensitivity analyses.
2.4. Sequence-Context Heterogeneity and Aggregate Response Analyses
Reproducibility was also examined separately across the 256 possible five-mers centred on adenosine. Context-specific rank correlations, top-ranked overlap enrichment and centered response differences were calculated for five-mers containing at least 30 eligible sites. The minimum selection size of ten sites was retained, allowing the selected proportion to exceed 10% in smaller contexts. Contexts with insufficient observations remained in the summary tables, but their reproducibility estimates were reported as unavailable.
To examine the relationship between aggregate responses and site-level stability, we analysed raw WT–KO response distributions, the proportion of positive responses and the overlap of the highest-ranked sites across replicates. Raw-response rankings from the first two contrasts were compared with those from the third using rank-decile transitions. Directional agreement between training and third-contrast responses was also assessed across quartiles of absolute training-response magnitude. Observed agreement was compared with a reference calculated from the marginal frequencies of positive and negative responses within each quartile of training-response magnitude. Because this within-quartile reference approaches the observed agreement whenever nearly all responses in a quartile share the same sign, agreement was also compared with a reference based on cohort-wide sign frequencies and with a permutation reference in which contrast-3 responses were shuffled (1,000 permutations). Zero-valued responses were excluded from sign calculations. No zero-valued responses occurred in the matched cohorts.
To determine whether the predominance of positive responses reflected the METTL3 knockout or differences between samples, we also calculated null contrasts between replicates of the same condition (WT1 − WT2, WT1 − WT3, WT2 − WT3 and the corresponding KO comparisons), in which no METTL3-dependent difference is expected, and repeated the main analysis for all six one-to-one assignments of KO replicates to WT replicates. Medians were reported beside means for all response summaries.
2.5. Independent m6A Evidence, Site-Level Reproducibility and Proximity to Modified Sites
To distinguish the contribution of the DRACH motif from that of methylation itself, each position was labelled using two independent single-base maps of m6A in HEK293T cells: the m6ACE-seq calls reported in the xPore source table (Koh et al., 2019; Pratanwanich et al., 2021) and GLORI sites with their estimated methylation levels (Liu et al., 2023), which were matched to xPore positions by chromosome and genomic coordinate. The coordinate match was confirmed by the finding that 93% of m6ACE-seq-positive positions were also GLORI sites. Sites were classified jointly by motif class and m6A evidence, reproducibility was compared among the four resulting groups using all eligible sites, and GLORI-supported sites were additionally divided into tertiles of GLORI methylation level. Groups with fewer than 30 sites were not assigned estimates.
Because a Spearman correlation across all sites combines the separation of modified from unmodified positions with the ranking of responsive positions, correlations were also calculated within the upper half of training scores and within GLORI-supported sites. Site-level reproducibility was assessed with the irreproducible discovery rate (IDR; Li et al., 2011), estimated with the idr package from centered responses for each pair of contrasts; sites with IDR < 0.05 in all three pairs were considered reproducible. The main model was fitted to all eligible sites, with separate DRACH and non-DRACH fits as sensitivity analyses.
To test whether non-DRACH responses reflected signal from nearby modified nucleotides, which can fall within the same nanopore k-mer window (Leger et al., 2021), the distance from each eligible non-DRACH site to the nearest DRACH site of the same gene in the xPore table and to the nearest m6ACE-seq- or GLORI-supported site on the same chromosome was calculated. Sites were grouped as m6A-supported themselves (0 nt) or as lying 1–4 nt (within a five-mer window), 5–10 nt or more than 10 nt from such a site, and the matched comparisons were repeated after excluding pairs whose non-DRACH site lay within 10 nt of a DRACH or m6A-supported site.
All site properties were also assessed jointly on all eligible sites, without matching, using a rank-based linear mixed model in which the normal-score-transformed contrast-3 response was modelled as a function of the transformed training score and its interactions with DRACH status, GLORI support, their interaction, coverage and baseline KO rate (z-scores), with a random intercept for gene. Among the top 5%, 10% and 25% of sites by training score, whether a site remained in the corresponding top set of contrast 3 was modelled with a logistic mixed model including the same factors and the training rank.
2.6. Reliability, Regression to the Mean and Reproducibility-Optimized Ranking
To ask whether additional replicates would be expected to recover reproducible rankings, the reliability of a single WT–KO contrast (R1) was estimated as the mean Spearman correlation between the three contrasts and, independently, from the variance of WT–WT and KO–KO null differences. The Spearman–Brown formula, Rk = kR1/[1 + (k − 1)R1] (Spearman, 1910; Brown, 1910), was used to predict the correlation between averages of k contrasts and the number of replicates required for two independent experiments to agree at ρ = 0.5 or 0.8. Confidence intervals were obtained by gene-level bootstrap.
Regression to the mean among top-ranked sites, often termed the winner's curse (Palmer and Pe'er, 2017), was quantified as the share of the training effect retained in contrast 3. The expected share, Var(true effect)/Var(training score), was estimated from the covariance of the two training contrasts and, independently, from the null differences, and was compared with the observed share among the top 1–25% of sites.
As an alternative ranking statistic, we used the reproducibility-optimized test statistic (ROTS; Elo et al., 2008; Suomi et al., 2017), which selects from a family of modified t-statistics the one that maximizes the reproducibility of top-ranked lists across bootstrap samples. ROTS (version 2.2.0) was applied to the two training replicate pairs (paired design; 300 bootstrap samples) on raw and five-mer-centered modification rates, and its statistic was evaluated against contrast 3 in the same way as the other scores. ROTS reproducibility Z-scores and false discovery rates were also calculated within each site group using all three replicate pairs.
2.7. Matching, Information Leakage and Technical Controls
The stratified matching was complemented by 1:1 nearest-neighbour matching without replacement, in which each DRACH site was paired with the non-DRACH site closest in scaled coverage and baseline KO rate, within a caliper of 0.2 standard deviations. Balance was assessed by standardized mean differences, variance ratios and Kolmogorov–Smirnov statistics, and the matching was repeated 500 times with random ordering of DRACH sites (Stuart, 2010; Austin, 2009).
To remove all use of the evaluation contrast from site selection, a fully training-based analysis was also performed, in which eligibility required a coverage of at least 50 in contrasts 1 and 2 only, five-mer medians were estimated from the training contrasts, and pairs were formed by nearest-neighbour matching.
Further sensitivity analyses calculated five-mer medians from coverage-complete sites only or with coverage weights; evaluated top-set overlap at fractions from 1% to 50% using a normalized overlap, (observed − expected)/(maximum − expected); and estimated context-level correlations for every five-mer with at least five eligible sites by empirical-Bayes shrinkage of Fisher-transformed correlations towards the motif-class mean, with the between-context variance estimated by the DerSimonian–Laird method (DerSimonian and Laird, 1986).
Technical sequence-context effects were examined using a public modification-free, in vitro transcribed (IVT) human transcriptome sequenced with the same RNA002 chemistry (McCormick et al., 2024). Positions with IVT basecalling mismatches within their five-mer, and five-mers in the upper quartile of low-confidence IVT 9-mers, were excluded in sensitivity analyses. In addition, five-mer medians were recalculated from sites without m6ACE-seq or GLORI support and used for centering, so that sequence-context offsets could be removed without subtracting genuine differences in methylation between contexts (Zhang et al., 2021).
Differences in the proportion of DRACH and non-DRACH sites passing the coverage requirements were examined within genes containing both site classes using a Mantel–Haenszel test (Mantel and Haenszel, 1959).
2.8. Comparison with Functional m6A Screening
To ask whether reproducible responses identify functionally relevant m6A, we used the FOCAS screen, in which individual m6A sites were demethylated with CRISPR–dCas13b–FTO in four cancer cell lines (Zhang et al., 2026). Screening guide RNAs were assigned to Ensembl genes (release 110) by exact matching of their 30-nt target sequences, and genes with at least one fitness-altering guide (adjusted p < 0.05) were defined as functional m6A genes. Enrichment was tested among genes with eligible sites that were also screened (476 genes), using Fisher's exact test and logistic regression adjusted for the number of guides and eligible sites per gene. This analysis was exploratory, because the screen used different cell lines and a different perturbation.
All analyses were performed in R (version 4.5.0) with the packages openxlsx, idr, lme4, MASS and ROTS (Bioconductor). A single script regenerates all figures and tables from the public input files and reports 70 values given in the Results beside their recomputed values. Derived results are available in Supplementary Data S1–S3, and the analysis code is provided as Supplementary Code S1.
3. Results
3.1. Matched DRACH and non-DRACH Cohorts Provide Comparable Coverage and Baseline Modification Rates
The published xPore dataset contained 62,222 positions with five-nucleotide sequences centred on adenosine, comprising 6,998 DRACH and 55,224 non-DRACH sites. Applying the replicate-completeness and coverage requirements reduced this set to 13,813 eligible positions, including 1,293 DRACH and 12,520 non-DRACH sites. Coverage filtering retained 18.5% of DRACH and 22.7% of non-DRACH sites. This difference reflected the genes on which the sites were located rather than the motif itself: within the 2,713 genes containing both site classes, DRACH and non-DRACH sites were retained at similar rates (Mantel–Haenszel odds ratio 1.05, p = 0.54; Supplementary Fig. S2). Although non-DRACH sites accounted for most of the eligible positions, their larger number also meant that an unrestricted comparison would involve groups with substantially different site compositions and potentially different measurement characteristics. We therefore constructed a one-to-one comparison using sequencing coverage and baseline KO modification rate. All 1,293 eligible DRACH sites were retained and matched to an equal number of non-DRACH sites within joint covariate strata. The resulting groups showed small differences in the matching variables, with standardized mean differences of −0.031 for log-transformed coverage and 0.028 for baseline KO rate. This substantially reduced the imbalance associated with comparing the full eligible groups while retaining the complete eligible DRACH cohort (Figure 1).
The matching procedure was also examined beyond group-level averages. Joint covariate distributions, cumulative within-pair differences and the distribution of sites among recorded source identifiers are shown in Supplementary Fig. S1. These diagnostics document residual variation between individual pairs and the extent to which multiple sites originate from the same recorded identifier. Matching therefore provided a more comparable basis for assessing motif-associated reproducibility, although it did not establish equivalence in all biological or technical characteristics. The eligible-site characteristics and individual matching assignments are available in Supplementary Data S1.
Because the stratified procedure selected non-DRACH sites close to the stratum medians, matched non-DRACH covariate values were concentrated around a limited number of values, and their distributions differed in shape from those of DRACH sites (Kolmogorov–Smirnov D = 0.083 for coverage and 0.092 for baseline KO rate; variance ratio 0.76 for baseline KO rate). Nearest-neighbour matching with a caliper produced 1,292 pairs with nearly identical distributions (D ≤ 0.007; variance ratios 1.00), and this alternative cohort was used to check the main results (Section 3.8; Supplementary Fig. S3).
3.2. Site-Level Reproducibility Differs Substantially Between Matched Motif Groups
We next examined whether sites showing larger responses in the first two WT–KO contrasts retained similar responses in the third contrast. Following five-mer centering, the relationship between the mean response from contrasts 1 and 2 and the response in contrast 3 differed considerably between the matched motif groups (Figure 2). DRACH sites showed a Spearman correlation of 0.815 (95% gene-level bootstrap CI 0.786–0.841), whereas the corresponding correlation for non-DRACH sites was −0.021 (−0.080 to 0.035). Thus, the ordering of DRACH responses was largely retained across the contrasts, while the non-DRACH ranking showed little overall correspondence with the third measurement. The difference of 0.836 (95% CI 0.769–0.898) was well outside the range expected from random exchange of motif labels within matched pairs (permutation p < 0.001), and gene-level confidence intervals were at most 20% wider than site-level intervals, indicating that the clustering of sites within genes did not affect this conclusion (Supplementary Fig. S4).
The difference was also apparent when attention was restricted to the highest-ranked sites. For each group, the top-ranked set contained 129 positions. Enrichment of overlap with the highest-ranked sites in the third contrast was 7.85-fold for DRACH sites (101 of 129 sites, against 12.9 expected), compared with 1.17-fold for non-DRACH sites (15 of 129), relative to the expectation for equally sized random sets. The mean centered response of the selected sites in contrast 3 also exceeded the corresponding cohort mean by 0.383 for DRACH sites. For non-DRACH sites, this difference was slightly negative (−0.0065). These measures capture related but distinct properties of reproducibility. Spearman correlation describes agreement across the full ranking, whereas overlap enrichment concerns recovery of the highest-ranked positions. The centered-response difference evaluates whether sites selected using the first two contrasts retain an elevated response in the third. In the matched DRACH cohort, all three measures indicated persistence of the training-derived signal. In the non-DRACH cohort, neither the overall ranking nor selection of the highest-scoring sites provided comparable recovery of the third-contrast centered response. The results concern reproducibility within the published xPore measurements rather than independent confirmation of RNA modification status. Nevertheless, the contrast between the two matched groups was evident across several descriptive measures rather than being confined to a single correlation statistic.
The difference did not depend on which contrast was used for evaluation. When each contrast in turn was held out and the other two were used for ranking and centering, DRACH correlations were 0.75, 0.82 and 0.81 and non-DRACH correlations −0.08, 0.09 and −0.03 for contrasts 1, 2 and 3, respectively (Supplementary Fig. S4). Correspondence-at-the-top (CAT) curves showed that the contrast between motif groups was also independent of the 10% selection threshold (Supplementary Fig. S5). DRACH concordance exceeded the chance expectation at every list size, with 54% of the top 1%, 78% of the top 10% and 81% of the top 25% of training-ranked sites recovered in contrast 3, whereas non-DRACH concordance remained close to chance (12% at 10% and 28% at 25%, against chance values of 10% and 25%).
A rank-based mixed model with gene as a random effect gave the same result. The slope relating training and contrast-3 ranks was 0.85 for DRACH and −0.02 for non-DRACH sites, a difference of 0.87 (95% CI 0.81–0.93; likelihood-ratio p < 10−100). Genes accounted for approximately 4% of the variance in the outcome, and standard errors were unchanged by the gene effect or by the addition of gene-specific slopes (Supplementary Fig. S6).
3.3. Five-Mer Centering Modestly Improves DRACH-Site Ranking, Whereas a Consistency-Based Score Offers no Further Benefit
We compared three approaches to ranking sites: the mean raw response, the mean five-mer-centered response and the minimum of the two centered training responses. All were evaluated against the same centered third-contrast outcome. The comparison showed that accounting for local sequence context had a greater effect on DRACH-site reproducibility than imposing the more conservative consistency requirement (Figure 3). Within the primary matched DRACH cohort, Spearman correlation increased from 0.569 with the raw-response mean to 0.815 after five-mer centering. Top-ranked overlap enrichment increased from 6.37-fold to 7.85-fold, while the mean third-contrast centered-response difference rose from 0.339 to 0.383. However, these values evaluate the raw score against a centered outcome. When each score was evaluated on its own scale, the gain from centering was modest: the correlation of the raw score with the raw contrast-3 response was 0.743 (99 of 129 top-ranked sites recovered; 7.69-fold), compared with 0.815 (101 of 129; 7.85-fold) for centered scores and outcomes, a difference of 0.072 (95% CI 0.043–0.103; Supplementary Fig. S7). Centering therefore removed a sequence-context offset but accounted for only a small part of the reproducibility of DRACH rankings, most of which was already present in the raw responses.
The corresponding changes in non-DRACH sites were much smaller. Spearman correlation remained close to zero, changing from −0.028 with the raw-response mean to −0.021 after centering. Top-ranked overlap enrichment decreased from 1.32-fold to 1.17-fold, and the centered-response difference remained near zero. The improvement seen in DRACH sites therefore did not extend uniformly to the matched non-DRACH group. The consistency-based score did not provide a further improvement over the centered mean. In DRACH sites, its Spearman correlation was 0.767, compared with 0.815 for the centered mean; top-ranked overlap enrichment was 7.77-fold rather than 7.85-fold (100 versus 101 of 129 sites; difference 0.08, 95% CI −0.33 to 0.66), and the centered-response difference was 0.380 rather than 0.383. In non-DRACH sites, the consistency score yielded a Spearman correlation of −0.079 and an overlap enrichment of 1.01-fold. Requiring the two training responses to be individually favourable therefore did not produce more reproducible rankings than their simple centered mean.
We also assessed whether the contrast between motif groups persisted under alternative cohort definitions. In the sensitivity comparison requiring the same recorded source identifier and coverage stratum, 1,240 DRACH–non-DRACH pairs were available across 669 distinct identifiers. With centered-mean ranking, Spearman correlations were 0.810 for DRACH and 0.038 for non-DRACH sites. Top-ranked overlap enrichment remained higher in DRACH sites (7.82-fold versus 1.85-fold), as did the third-contrast centered-response difference (0.385 versus 0.016). The same general separation was therefore observed when matching was restricted to shared source identifiers, although the non-DRACH cohort retained some positive concordance under this restriction. This residual concordance largely disappeared when non-DRACH sites within 10 nt of a DRACH or m6A-supported site were excluded (ρ = 0.006; Section 3.6), indicating that it reflected the closer proximity of same-gene partners to modified positions. The complete comparison also included all eligible unmatched sites, allowing the effects of cohort selection and scoring strategy to be examined separately (Fig. 3; Supplementary Data S2). Across the matched analyses, the motif contrast was present with every scoring rule, five-mer centering produced a modest gain for DRACH sites, and the consistency-based rule added no further benefit.
The choice of centering reference had little influence. DRACH correlations were 0.793 with medians from coverage-complete sites, 0.793 with coverage-weighted medians and 0.807 with medians from the training contrasts only, while non-DRACH correlations remained between −0.034 and −0.019 (Supplementary Fig. S8). Part of the apparent centering gain, however, reflected removal of genuine methylation differences between sequence contexts. For DRACH five-mers, medians calculated from all sites exceeded those calculated from sites without m6A evidence by 0.057 on average, and by 0.35 and 0.32 for GGACU and AGACU, whereas the corresponding difference for non-DRACH five-mers was 0.0006. When centering used medians from sites without m6A evidence, the DRACH correlation was 0.745, close to the raw-response value, and the non-DRACH correlation was −0.024; GLORI-supported DRACH sites then retained a clearly positive centered response in contrast 3 (mean 0.33, compared with 0.09 after standard centering; Supplementary Fig. S9). Excluding sites with mismatches in a modification-free IVT transcriptome (41 pairs) or five-mers prone to IVT basecalling errors (250 pairs) did not change the motif contrast (DRACH 0.817 and 0.821; non-DRACH −0.021 and −0.035).
3.4. Reproducibility Varies Across Individual Five-Nucleotide Sequence Contexts
The difference between DRACH and non-DRACH groups prompted a closer examination of reproducibility within individual five-nucleotide contexts. There were 256 possible sequences centred on adenosine, including 18 matching the DRACH consensus and 238 belonging to the non-DRACH group. These contexts differed in the number of positions represented in the original dataset and in how many sites satisfied the replicate-coverage requirements (Fig. 4).
Context-level reproducibility estimates were restricted to five-mers containing at least 30 eligible sites. This distinction was important because sequence contexts were not equally represented: for sparsely observed five-mers, an apparently extreme correlation or overlap value could depend on relatively few positions. The context atlas therefore distinguishes the number of available sites from the availability of a reportable reproducibility estimate. Contexts falling below the minimum site count were retained in the underlying results, but were not assigned numerical reproducibility values. Nine of the 18 DRACH contexts and 115 of the 238 non-DRACH contexts met this requirement.
Among reportable contexts, rank concordance and the mean third-contrast response of selected sites varied across five-mers. The median context-level correlation was 0.68 for DRACH and −0.01 for non-DRACH five-mers. Among DRACH contexts, AGACU and GGACU were the most reproducible (ρ = 0.94 and 0.93, with 32% and 38% of sites reproducible by IDR), whereas AAACU was weakly reproducible (ρ = 0.29). The non-DRACH context GGACG behaved like DRACH contexts (ρ = 0.70; 112 sites), and 39% of its sites were supported by GLORI, consistent with methylation at sequences close to the consensus (Supplementary Fig. S10). The separation observed between the broader motif groups was therefore accompanied by variation at the finer sequence level. Figure 4 compares context-specific concordance with the centered-response difference, while also showing how sequencing-coverage retention relates to the number of sites represented by each sequence.
Interpretation of top-ranked overlap enrichment required a further qualification. Because each context needed at least ten selected sites, the selected fraction could exceed 10% when a five-mer contained fewer than 100 eligible positions. Consequently, enrichment values across contexts do not always correspond to an identical selection fraction. The relationship between selected fraction and overlap enrichment is shown alongside the other context-level measurements in Fig. 4. A size-independent normalized overlap, which equals 0 for chance and 1 for complete overlap, confirmed the separation at every selection fraction from 1% to 50% (0.55–0.77 for DRACH and −0.01 to 0.08 for non-DRACH sites; Supplementary Fig. S8). When context-level correlations were estimated for all five-mers with at least five eligible sites using empirical-Bayes shrinkage, estimates became available for 17 of 18 DRACH and 219 of 238 non-DRACH contexts, and the pooled correlations were 0.74 and 0.00, respectively. These analyses establish that the reproducibility contrast cannot be described solely by the overall DRACH/non-DRACH classification. The availability of measurements and the stability of site rankings also differ among specific five-mer sequences. Numerical results for all 256 contexts, including those without reportable reproducibility estimates, are provided in Supplementary Data S2.
3.5. Widespread Positive Responses Coexist with Substantial Turnover in Site Identities
The preceding analyses concerned the ability to recover individual sites from their response rankings. We finally asked whether this behaviour was consistent with the broader WT–KO response patterns. Raw modification-associated responses were predominantly positive in both matched motif groups across all three contrasts, indicating that higher WT than KO estimates were common even among sites with poor ranking reproducibility (Figure 5A).
For matched DRACH sites, mean raw responses were 0.226, 0.224 and 0.216 (medians 0.149, 0.126 and 0.114) in contrasts 1, 2 and 3, respectively. The proportions of sites with positive responses were 92.0%, 89.6% and 87.4%. The corresponding means for non-DRACH sites were 0.169, 0.078 and 0.063 (medians 0.171, 0.062 and 0.050), with positive-response proportions of 90.5%, 80.1% and 75.6%. Thus, a positive aggregate response remained common in both groups, although its magnitude and prevalence declined more noticeably across contrasts in non-DRACH sites. The presence of a widespread directional response did not, by itself, indicate that the same individual sites would be repeatedly ranked highest.
The positive non-DRACH response was, however, not specific to the WT–KO comparison. In null contrasts between replicates of the same condition, DRACH sites showed the expected balance of positive and negative differences (44.9–50.6% positive), whereas non-DRACH sites showed systematic offsets: 59.9–74.3% of WT–WT differences were positive, and only 20.7% and 22.7% of the KO1 − KO2 and KO1 − KO3 differences were positive (Supplementary Fig. S11). The first WT sample therefore gave higher, and the first KO sample lower, non-DRACH estimates than the other samples of the same condition (medians 0.376 versus 0.309–0.331 and 0.170 versus 0.241–0.251), which accounts for the larger mean non-DRACH response in contrast 1. These offsets did not reflect signal spill-over from neighbouring modified bases: non-DRACH sites more than 10 nt from any m6A-supported site were as often positive in contrast 3 as sites 1–4 nt from such a site (75% and 78%; Supplementary Fig. S12). Part of the widespread non-DRACH response therefore appears to reflect sample-level differences in xPore estimates rather than METTL3-dependent methylation.
To examine site identity directly, we compared the 129 highest-ranked sites from each contrast using raw WT–KO responses. Among DRACH sites, the pairwise intersections contained 97 sites for contrasts 1 and 2, 92 for contrasts 1 and 3, and 104 for contrasts 2 and 3. Eighty-seven sites appeared in all three top-ranked sets (Fig. 5B). In matched non-DRACH sites, the corresponding pairwise intersections contained 18, 9 and 48 sites, with only two sites shared across all three contrasts. For comparison, the expected intersection of three independently and uniformly selected sets of 129 sites from 1,293 positions is approximately 1.28 sites. The DRACH intersection greatly exceeded this descriptive reference, whereas the three-way non-DRACH intersection was close to it. The non-DRACH results were not uniformly consistent with random site selection. In particular, the intersection of 48 sites between contrasts 2 and 3 was greater than the random-set expectation of approximately 12.9 sites for a pair of sets of this size. Rather than indicating an absence of all reproducibility, these findings show that non-DRACH site recovery was uneven across replicate comparisons and substantially less consistent across all three. This pairwise agreement involved only contrasts 2 and 3: non-DRACH top-ranked sites were rarely shared between contrast 1 and either other contrast (Supplementary Fig. S5), and an IDR model fitted to non-DRACH sites alone identified 279 reproducible sites for contrasts 2 and 3 but none for either pair involving contrast 1. The shared component is therefore more consistent with a technical feature common to replicates 2 and 3 than with reproducible biology.
Rank-decile transitions provided a complementary view of this difference (Fig. 5C). When sites were ranked by their mean raw response in contrasts 1 and 2, 99 of the 129 highest-ranked DRACH sites remained in the highest decile of contrast 3. The corresponding number for non-DRACH sites was 19. These represent recovery rates of 76.7% and 14.7%, respectively. The Spearman correlation between the raw training mean and raw third-contrast response was 0.743 for DRACH sites and −0.025 for non-DRACH sites. These raw-response correlations differ by definition from the correlations reported in Fig. 2, where the evaluation outcome was five-mer-centered.
Finally, we examined whether agreement in the direction of WT–KO responses provided independent evidence of site-level stability. In DRACH sites, observed sign agreement increased from 68.4% in the lowest quartile of absolute training-response magnitude to 100% in the highest quartile. However, the corresponding expectations calculated from the marginal frequencies of positive and negative responses closely followed the observed values (Fig. 5D). Because these expectations were calculated within each quartile, they approach the observed value whenever almost all responses in a quartile share the same sign; in the highest DRACH quartile both were 100%. Against a reference based on cohort-wide sign frequencies, the observed agreement in the highest DRACH quartile exceeded expectation (100% versus 87.4%; permutation p = 0.001), whereas the lowest DRACH quartile (68.4% versus 75.6%) and the highest non-DRACH quartile (69.1% versus 75.3%) did not (Supplementary Fig. S4 for DRACH sites; non-DRACH values in Supplementary Data S3). In non-DRACH sites, observed agreement ranged from approximately 69% to 80% across quartiles, and the difference from the marginal reference did not exceed 1.8 percentage points.
Directional agreement therefore provided evidence of site-specific reproducibility only for the most strongly responding DRACH sites; elsewhere, it largely reflected the predominance of positive responses. The distinction was clearest in the non-DRACH cohort: most sites retained positive WT–KO differences, but relatively few maintained their positions among the highest-ranked responses across all three contrasts. The results show that the prevalence of a perturbation-associated response and the reproducibility of individual site identities can differ considerably within the same dataset.
3.6. Reproducibility Follows Independent Evidence of m6A Rather Than the Motif Label
Most DRACH sites are not methylated, and some m6A occurs outside the DRACH consensus. To separate the two, sites were labelled using independent single-base m6A maps. Of the 62,222 positions, 3,649 coincided with GLORI sites and 1,387 were m6ACE-seq-positive; among eligible positions, 587 DRACH and 67 non-DRACH sites were GLORI-supported. GLORI-supported DRACH sites showed the highest reproducibility (ρ = 0.882, 95% CI 0.855–0.903), followed by GLORI-supported non-DRACH sites (ρ = 0.726, 0.556–0.852) and DRACH sites without GLORI support (ρ = 0.588, 0.524–0.646), whereas non-DRACH sites without such support showed no reproducible ranking (ρ = −0.001, −0.019 to 0.020; Supplementary Fig. S13). Nearly all GLORI-supported sites were positive in contrast 3 (99.1% of DRACH and 98.5% of non-DRACH sites), compared with 77.6% and 75.4% of unsupported sites. Reproducibility was similar across tertiles of GLORI methylation level (ρ = 0.78, 0.77 and 0.83), and labels from m6ACE-seq gave the same pattern (ρ = 0.86, 0.76, 0.73 and 0.00; Supplementary Data S3).
The DRACH ranking was not explained only by the separation of modified from unmodified positions. Within the upper half of training scores, the DRACH correlation remained 0.79 (95% CI 0.75–0.82), compared with 0.00 (−0.08 to 0.09) for non-DRACH sites, and among GLORI-supported DRACH sites it was 0.88. At the level of individual sites, IDR identified 215 positions that were reproducible in all three contrast pairs, 199 of them DRACH and 16 non-DRACH sites. Reproducible sites comprised 21% of GLORI-supported DRACH sites, 15% of GLORI-supported non-DRACH sites, 10% of DRACH sites without GLORI support and 0.05% (6 of 12,453) of unsupported non-DRACH sites (Supplementary Fig. S10).
Proximity to modified positions did not explain the non-DRACH results. Only non-DRACH sites that were themselves m6A-supported ranked reproducibly (ρ = 0.70, 95% CI 0.53–0.82); sites 1–4 nt from a known m6A site showed at most a weak, non-significant concordance (ρ = 0.08, −0.06 to 0.26), and sites more than 10 nt away showed none (ρ = 0.00). Excluding pairs whose non-DRACH site lay within 10 nt of a DRACH or m6A-supported site left the main result unchanged (DRACH 0.811; non-DRACH −0.031) but reduced the small same-gene non-DRACH correlation from 0.038 to 0.006 (Supplementary Fig. S12).
When all eligible sites were analysed jointly, DRACH status and GLORI support each increased the reproducibility slope by a similar amount (0.62 and 0.65), but their effects were not additive (interaction −0.45), whereas coverage (−0.016) and baseline KO rate (−0.010) had no appreciable effect (Supplementary Fig. S14). The adjusted slopes were 0.80 (95% CI 0.76–0.85) for GLORI-supported DRACH sites, 0.64 (0.45–0.83) for GLORI-supported non-DRACH sites, 0.60 (0.54–0.66) for DRACH sites without GLORI support and −0.02 (−0.03 to 0.00) for unsupported non-DRACH sites. Among the top 10% of sites by training score, GLORI support increased the odds that a site remained in the top 10% of contrast 3 by 17.9-fold (95% CI 8.5–37.6), whereas DRACH status added no significant information once GLORI support was known (odds ratio 1.6, 0.7–3.3). Consistently, in the mixed model restricted to GLORI-supported sites, the difference between DRACH and non-DRACH slopes fell from 0.87 to 0.15 (95% CI 0.03–0.27; p = 0.014; Supplementary Fig. S6).
3.7. Low Reliability and Regression to the Mean Account for the Instability of Non-DRACH Rankings
The reliability of a single WT–KO contrast was 0.76 (95% CI 0.73–0.79) for DRACH sites and 0.001 (−0.03 to 0.03) for matched non-DRACH sites (Supplementary Fig. S15). Applied through the Spearman–Brown formula, these values predicted the observed correlations between the training average and contrast 3 closely (0.81 versus 0.815 for DRACH sites, 0.87 versus 0.88 for GLORI-supported DRACH sites and 0.69 versus 0.73 for GLORI-supported non-DRACH sites). For matched non-DRACH sites, the predicted number of replicates needed for two independent experiments to agree at ρ = 0.5 was approximately 1,600, with a lower confidence bound of 29, whereas GLORI-supported non-DRACH sites (R1 = 0.62) would reach this level with a single replicate. Reliability estimated from WT–WT and KO–KO null differences was slightly higher for non-DRACH sites (0.09) than the between-contrast estimate, indicating additional WT–KO variance that did not recur between contrasts.
Consistent with these reliabilities, top-ranked DRACH sites showed little regression to the mean. The top 10% of DRACH sites retained 97% (95% CI 94–101%) of their training effect in contrast 3, close to the 89% predicted from the training contrasts alone, and the calibration of shrunk training scores against contrast-3 responses followed the identity line (slope 1.06). Top-ranked non-DRACH sites retained none of their training effect (−5%, −19% to 8%), whereas GLORI-supported non-DRACH sites retained 91% (Supplementary Fig. S16).
A ranking statistic optimized for reproducibility did not alter these conclusions. ROTS selected statistics close to a simple difference (Spearman correlation with the mean difference 0.985 for raw and 0.88 for centered rates) and gave correlations with contrast 3 of 0.812 for DRACH and 0.021 for non-DRACH sites when applied to centered rates, compared with 0.815 and −0.021 for the centered mean (Supplementary Fig. S17). Within groups, ROTS reproducibility was high for DRACH sites (Z = 8.3; 46% of sites with a false discovery rate below 0.05) and close to random for non-DRACH sites (Z = 1.5; 0.2%); the small group of 67 GLORI-supported non-DRACH sites again behaved like methylated DRACH sites (Z = 11.2; 24%).
3.8. The Motif Contrast is Robust to Matching, Information Leakage, Replicate Pairing and Technical Controls
Nearest-neighbour matching gave the same DRACH correlation as the original procedure (median 0.815 across 500 matching draws) and a slightly higher, but still small, non-DRACH correlation (median 0.033; 95% range 0.023–0.045), so that the difference between motif groups changed from 0.836 to 0.782 (Supplementary Fig. S3). In the fully training-based analysis, which used contrast 3 only as the evaluation outcome, 1,303 pairs were formed and the correlations were 0.804 for DRACH and 0.026 for non-DRACH sites (Supplementary Fig. S7). The result was also independent of how KO replicates were assigned to WT replicates: across all six possible pairings, DRACH correlations ranged from 0.793 to 0.818 and non-DRACH correlations from −0.021 to 0.059, and WT and KO differences between replicates with the same label were not positively correlated (ρ = −0.34 to −0.03), giving no indication that replicate labels marked shared processing batches (Supplementary Fig. S11). Together with the IVT-based controls described in Section 3.3, these analyses indicate that the motif contrast was not produced by the matching procedure, information leakage from the evaluation contrast, the replicate pairing or sequence-specific technical artefacts.
3.9. Reproducible DRACH Responses Mark Functionally Relevant m6A Genes
Finally, we asked whether reproducible site identities point to biologically relevant m6A. Of 476 genes with eligible sites that were also screened by FOCAS, 130 were functional m6A genes (Supplementary Fig. S18). Genes carrying DRACH sites that were among the top 10% in all three contrasts were functional m6A genes twice as often as other screened genes (47.5% versus 24.3%; adjusted odds ratio 1.96, 95% CI 1.03–3.73, p = 0.04), whereas genes selected by non-DRACH sites that were top-ranked in only one contrast showed no enrichment (27.2% versus 27.3%; adjusted odds ratio 0.90, 0.50–1.61). Genes with IDR-reproducible or GLORI-supported sites showed weaker enrichment that was not significant after adjustment (adjusted odds ratios 1.47 and 1.58). Examples of reproducibly responding genes identified as functional m6A genes in at least three FOCAS cell lines included MBD3, SLC7A5, SEC61A1, YWHAH, RRAGA, EEF2 and POLR1D. Although exploratory and based on different cell lines and perturbations, these results suggest that reproducible site identities, rather than widespread responses, point to functionally relevant m6A.
4. Discussion
4.1. Widespread Responses and Reproducible Site Identities are Different Properties
A consistent shift across many RNA positions does not necessarily mean that the same positions will show the strongest responses when an experiment is repeated. This distinction emerged clearly from our reanalysis of the published xPore dataset (Pratanwanich et al., 2021). Positive WT–KO responses were common in both matched motif groups, yet their site-level reproducibility differed considerably. Null comparisons between replicates of the same condition further showed that part of the widespread non-DRACH response reflected sample-level differences rather than the loss of METTL3, so the breadth of a response is not by itself evidence of a biological effect. Most high-ranking DRACH sites were recovered across the three replicate contrasts, whereas only a small fraction of non-DRACH sites retained their highest-ranking positions. The non-DRACH group was not uniformly irreproducible, as some replicate pairs shared more top-ranked sites than expected under random selection, although this excess was confined to contrasts 2 and 3 and is more consistent with a technical feature shared by these replicates, but the identity of the strongest responses was far less consistent across all three contrasts.
The difference matters because a transcriptome-wide response and a list of candidate regulatory sites serve different purposes. An overall change in modification-associated measurements may provide evidence that a perturbation affects the RNA population, even when the contribution of particular sites remains uncertain. By contrast, assigning biological importance to a specific nucleotide requires confidence that its measured response is not peculiar to one replicate. Previous analyses of antibody-based m6A sequencing found considerable variation in the recovery of modification-enriched regions and limited agreement in differential methylation between studies, illustrating the broader difficulty of distinguishing reproducible changes from measurement variability (McIntyre et al., 2020). Similar concerns about the reproducibility of computationally derived genomic features have been discussed beyond RNA modification research (Baykal et al., 2024).
Importantly, reproducibility itself has several meanings. A modification may be detected repeatedly at the same position, its estimated abundance may remain stable between samples, or its response to a perturbation may retain a consistent rank among other sites. These outcomes should not be treated as equivalent. For example, independent nanopore measurements using an m6A-aware basecaller have shown high overlap of identified modification sites and strong agreement in their estimated modification levels between biological replicates, while comparisons between modification callers identified substantially smaller overlaps (Cruciani et al., 2025). Such results are not inconsistent with our observations, because reproducibility of modification occupancy differs from reproducibility of a WT–KO difference. A site may be reliably detected as modified without showing a reliably ranked response to perturbation.
Our directional-agreement analysis provides another explanation for why broad response patterns may appear stable despite changes in site identity. When most positions show differences in the same direction, repeated measurements can agree frequently on the sign of those differences even if the relative ordering of sites changes. In the present data, observed sign agreement closely followed the values expected from the marginal proportions of positive and negative responses within each quartile of response magnitude, and only the most strongly responding DRACH sites retained their direction more often than expected from cohort-wide sign frequencies. Directional agreement is therefore informative about the prevailing response, but it provides limited additional evidence that individual sites are responding reproducibly.
The reliability analyses offer a simple explanation for these differences. Rank agreement between independent measurements cannot exceed what the reliability of a single measurement allows, and the observed correlations were close to the values predicted from single-contrast reliability. For non-DRACH sites without independent m6A support, this reliability was close to zero, so their strongest single-contrast responses behaved as expected for selected noise and disappeared in the evaluation contrast, a pattern known as the winner's curse (Palmer and Pe'er, 2017). Because the number of replicates predicted to stabilize such rankings is far beyond typical experimental designs, the low reproducibility of these sites is better interpreted as low reliability than as insufficient replication. Reliability-based shrinkage of training effects, which predicted the retention of DRACH effects without using the evaluation contrast, could provide a practical check before sites are prioritized for follow-up.
4.2. The Contribution of Sequence Context to Reproducibility
The contrasting behaviour of DRACH and non-DRACH sites suggests that sequence context has an important bearing on how differential modification measurements should be interpreted. The DRACH consensus is strongly associated with mammalian m6A, although motif membership alone neither confirms nor excludes methylation at a particular position (Linder et al., 2015). Our analyses suggest that this provides the simplest explanation for the motif contrast: DRACH sites contain a larger proportion of METTL3-dependent methylation, and reproducibility tracked independent evidence of m6A rather than the motif label. GLORI-supported non-DRACH sites ranked reproducibly, the non-DRACH context GGACG behaved like DRACH contexts, and among GLORI-supported sites the difference between motif classes was small. Nanopore measurements introduce a further consideration because the recorded electrical signal reflects several neighbouring nucleotides, and modification-associated signal differences can extend beyond the modified base itself (Leger et al., 2021; Kovaka et al., 2025). Consequently, the response assigned to a position may contain both modification-related information and sequence-dependent measurement effects.
Recent experimental benchmarks reinforce the need to distinguish these contributions. Comparisons of RNA004 modification callers against chemical mapping methods and unmodified RNA controls have revealed substantial differences in false-positive predictions across sequence contexts (Zou et al., 2025). Evaluations of modification-aware basecalling models have also identified cross-reactivity between modification types and effects associated with neighbouring modified nucleotides (Diensthuber et al., 2026). Broader comparisons of nanopore analysis tools indicate that performance varies with the modification being examined, the experimental material and the computational method (Zhong et al., 2023; Maestri et al., 2024; Luo et al., 2026), while assessments involving synthetic and cellular RNA have documented disagreements between nanopore-derived calls and independent modification data (Ghohabi Esfahani et al., 2026). Although these studies used approaches that differ from xPore, they demonstrate why the behaviour of one caller cannot automatically be generalized to another.
Within our dataset, subtracting the median response associated with each five-mer modestly improved the reproducibility of DRACH-site rankings, whereas non-DRACH rankings remained poorly correlated with the third contrast. When raw and centered scores were compared on the same scale, however, the improvement was modest (ρ = 0.743 versus 0.815), and with a reference estimated from sites without m6A evidence it largely disappeared (ρ = 0.745). Much of the apparent gain therefore reflected the removal of genuine differences in methylation between sequence contexts, such as the higher methylation of GGACU and AGACU sites, rather than the correction of a technical bias; consistent with this, excluding sites and five-mers affected in a modification-free IVT transcriptome did not change the results. The improvement was not matched by a scoring rule that favoured the smaller of the two centered training responses, indicating that stricter consistency requirements did not necessarily produce more reliable site selection.
These observations should not be taken to mean that sequence-context centering is always desirable. A context-wide response may reflect genuine biological regulation, particularly when a methyltransferase perturbation affects many sites sharing similar sequence features. Removing that shared component could reduce a real biological signal alongside technical variation. Nor does the poor overall reproducibility of non-DRACH rankings establish that these sites are unmodified or biologically irrelevant. The present comparison concerns the consistency of xPore-derived measurements within the selected site populations, and their chemical interpretation remains uncertain without independent evidence. Our m6A-free reference analysis provides a direct example: standard centering reduced the contrast-3 response of GLORI-supported DRACH sites from 0.33 to 0.09. Centering references estimated from unmodified sites or from modification-free controls (Zhang et al., 2021; McCormick et al., 2024) therefore seem preferable when biological context effects are expected.
The variation among individual five-mers provides a related practical consideration. Some sequence contexts contain many adequately covered sites, whereas others provide too few observations for reliable context-level estimates. This creates unequal opportunities to identify and recover responsive positions across contexts, even before differences in modification biology are considered. A complete report of sequence-context effects should therefore distinguish reproducibility from the number of sites available for evaluation (Oberdoerffer and Gilbert, 2025). Recent efforts to compare and harmonize m6A measurements across experimental methods have similarly emphasized consistent processing, appropriate controls and reproducibility-based selection rather than simple aggregation of previously reported sites (Zhao et al., 2026).
4.3. Why Reliable Site Identification Matters for Biological Research
The consequences of unstable site rankings become particularly important when modification maps are used to investigate gene regulation. Individual m6A modifications can influence RNA metabolism through interactions with modification-binding proteins; for example, YTHDF2-mediated recognition of methylated transcripts has been linked to changes in mRNA stability (Wang et al., 2014). More recent site-directed functional screening has shown that different m6A positions within the same gene can exert distinct, sometimes opposing, effects on cellular fitness (Zhang et al., 2026). Such findings make the identity of the modified position biologically consequential, rather than merely a detail of how transcriptome-wide measurements are summarized. Similar questions arise in developmental biology, where maternally deposited or environmentally regulated RNA modifications have been proposed to influence early development, but the contribution of specific modified sites remains incompletely understood (Ahi, 2026).
Our comparison with the FOCAS screen provides direct, although exploratory, support for this view. Genes whose DRACH sites were among the top-ranked responses in all three contrasts were functional m6A genes twice as often as other screened genes, whereas genes selected from non-reproducible non-DRACH rankings were not enriched (Zhang et al., 2026). Although the screen used different cell lines and site-specific demethylation rather than METTL3 loss, this suggests that the reproducibility of a response, rather than its size in a single measurement, is informative about biological relevance.
Studies combining modification profiling with other molecular measurements also illustrate the value of reliable candidate selection (Molinie et al., 2016). Nanopore and short-read RNA sequencing, together with targeted methylation assays and functional experiments, have been used to investigate METTL3-associated changes in endocrine therapy-sensitive and resistant breast cancer cells (Petri et al., 2025). These approaches connect modification-associated observations with changes in transcript abundance and cellular behaviour, but their interpretation depends on the confidence with which relevant transcripts and modification sites are identified. This distinction is particularly important in signaling pathways with complex, context-dependent regulation, where changes in pathway activity may arise indirectly and cannot necessarily be attributed to modification of a particular RNA without transcript-specific evidence (Saqagandomabadi et al., 2027). A candidate selected because it has an unusually large response in one measurement may be less suitable for mechanistic follow-up than a site whose response is somewhat smaller but repeatedly observed. This issue is not confined to disease-related comparisons. Changes in nutrient availability, cellular stress and other environmental conditions can affect RNA-modification machinery through metabolic, signalling and regulatory processes operating over different timescales (Jalali and Ahi, 2026; Sammad et al., 2026). Such responses may involve both broad shifts in modification-associated measurements and more selective changes in particular transcripts. Establishing which sites participate in these responses requires separating the reproducibility of the overall pattern from the stability of the individual observations used to explain it.
The practical implication is that candidate-site selection should not rely solely on the magnitude of an estimated modification difference. Independent biological replication, agreement across measurements and evidence from assays based on different chemical or physical principles can strengthen the case for a particular site. In the present data, independent GLORI support identified the subset of non-DRACH sites with reproducible responses and was the strongest predictor that a top-ranked site would replicate. Recent work examining METTL3- and METTL14-dependent modifications across nanopore sequencing chemistries, with confirmation using GLORI and miCLIP, illustrates how complementary measurements can address uncertainties that remain when relying on one detection method (Kurtyan et al., 2026). The purpose of such validation is not simply to produce a shorter list of candidate sites, but to establish which measurements are sufficiently reliable to support subsequent biological experiments.
4.4. Limitations of the Present Analysis
Several aspects of the study limit the interpretation and generality of its findings. The analysis was based on processed measurements from one published experimental system, and the response estimates remain specific to the xPore approach used to generate them. The data were generated with the RNA002 chemistry, which has since been replaced by RNA004, and current modification calling increasingly relies on basecaller models rather than signal-comparison approaches (Diensthuber et al., 2026). xPore modification rates should also be read as model-based estimates rather than stoichiometry; for example, 16% of eligible sites had KO rates above 0.5. In addition, the METTL3-knockout line may retain residual methylation through alternatively spliced METTL3 isoforms (Poh et al., 2022), and WT and KO replicates were paired by their labels without information on shared sequencing runs. Differences between DRACH and non-DRACH sites may reflect genuine modification biology, sequence-dependent signal behaviour, transcript composition, coverage-related uncertainty or interactions among these factors. Our GLORI-based and joint-model analyses suggest that methylation status is the main of these factors, but they cannot exclude contributions from the others. Matching reduced differences in sequencing coverage and baseline KO modification rate, but could not control for every potential source of variation. Furthermore, multiple sites could originate from the same recorded source identifier, making it inappropriate to assume that all site-level observations represent independent biological measurements. We addressed this dependence with gene-level bootstrap intervals and mixed models, which gave the same conclusions, but other forms of dependence, such as shared sequencing batches, could not be modelled.
The use of the third replicate contrast also requires qualification. Although its response values were excluded from construction of the training rankings, coverage completeness was assessed across all three contrasts, and five-mer centering used response information from each contrast separately. A fully training-based analysis, in which contrast 3 was used only as the evaluation outcome, gave the same results. More importantly, the third contrast had been examined during earlier analyses of this dataset. The reported reproducibility therefore describes persistence within a retrospectively evaluated dataset rather than predictive performance established in a previously untouched experiment (Kriegeskorte et al., 2009). The random-set overlap expectations and within-quartile sign references are descriptive; we therefore complemented them with gene-level bootstrap intervals, paired permutation tests and mixed models, although these procedures cannot account for dependence arising from shared sequencing batches.
A further limitation is that independent chemical evidence was available only from separate GLORI and m6ACE-seq experiments in HEK293T cells, not from the samples analysed here, and that many positions lacked such evidence. We cannot establish how many of the observed xPore responses correspond to genuine changes in m6A, nor can we determine whether individual unstable rankings arise primarily from technical measurement errors or biological heterogeneity. The findings should consequently be interpreted as evidence about the reproducibility of modification-associated signals and derived site rankings, not as a comparison of experimentally verified methylated and unmethylated positions.
4.5. Towards More Reliable Differential RNA Modification Analysis
A useful next step would be a prospective study designed specifically to distinguish measurement reproducibility from biological variability in RNA modification responses. Such an investigation could examine several cell types subjected to defined perturbations of modification machinery, including METTL3 depletion and rescue, while collecting independent biological samples across laboratories and sequencing runs (Schwartz et al., 2014). Parallel experiments using newer nanopore chemistries, well-characterized synthetic RNA controls and independent quantitative modification assays would help establish how much of the variation in site ranking arises from the sequencing technology, modification-calling algorithms or underlying biology. A more immediate replication is also feasible with public data: paired RNA002 and RNA004 datasets from HeLa cells with METTL3 or METTL14 depletion and a public HeLa GLORI dataset (Kurtyan et al., 2026) would allow the same analysis to be repeated with a different cell line, chemistry and modification-calling approach, including m6Anet and basecaller-based calling (Hendra et al., 2022).
The experimental design should include both modified and unmodified control sequences spanning a wide range of five-mer contexts, together with defined mixtures representing different modification fractions (Chan et al., 2024). Independent measurements using approaches such as GLORI would help distinguish changes in modification-associated nanopore signals from changes in chemical methylation levels (Liu et al., 2023). Modification-responsive RNA aptamers have also been proposed as potential tools for detecting or monitoring specific RNA modification states, although their quantitative accuracy and suitability for independent site-level validation would require further testing (Khorshid and Ahi, 2026). Antibody-free mapping approaches such as DART-seq may provide complementary evidence of site location, although they do not directly quantify methylation fractions (Meyer, 2019). For selected candidates, targeted RNA demethylation or related site-directed perturbation methods could then test whether a reproducibly identified position has a measurable regulatory function (Li et al., 2020; Zhang et al., 2026). Testing these relationships across multiple cellular conditions would also help determine whether sites with stable baseline modification measurements necessarily have stable responses to perturbation. Reversible physiological transitions, e.g., dormancy, could offer informative systems for testing whether broad RNA modification responses correspond to reproducible changes at individual positions (Ahi, 2026).
An important feature of such a study would be to specify the training data, candidate-site selection criteria and independent evaluation samples before assessing reproducibility. This would prevent information from the evaluation data from influencing site selection and would provide a clearer estimate of how well results transfer to new experiments. Shared datasets and evaluation procedures have already proved useful for comparing RNA modification-detection algorithms, as demonstrated by the RNA Modification and Processing challenge (Spangenberg et al., 2025). Combining predictions across detection algorithms has also improved the identification of differential RNA modification signals in a controlled rRNA application (Delgado-Tejedor et al., 2024). A comparable effort centred on differential responses, rather than modification detection alone, could assess the recovery of candidate sites across laboratories, sequencing chemistries and biological conditions.
Better analytical tools will also be needed to make use of these more informative experimental designs. Current modification-detection methods primarily aim to identify modified positions or estimate modification levels, whereas researchers studying perturbations also need to know whether an observed difference is likely to recur. Methods such as CHEUI can already compare modification estimates between conditions, but whether the resulting site rankings remain stable across independent experiments is a separate question (Acera Mateos et al., 2024). A suitable analysis could model modification-rate uncertainty, sequence-dependent measurement behaviour, transcript abundance and variability among independent samples, then estimate the stability of each candidate site's response. Our application of the irreproducible discovery rate (Li et al., 2011), reliability estimates and reproducibility-optimized ranking (Elo et al., 2008) illustrates that such measures can already be computed from existing replicate designs, although they would benefit from adaptation to the dependencies among sites within transcripts. Such tools could provide researchers with more than a list ordered by estimated effect size. Reporting the uncertainty of each differential response, the probability that a site remains highly ranked in an independent sample and the sensitivity of that ranking to sequence-context adjustment would make it easier to distinguish robust candidates from those supported mainly by one measurement. This would be particularly useful when only a small number of sites can be taken forward for experimental validation.
5. Conclusion
Transcriptome-wide RNA modification measurements are increasingly used both to understand how cells respond to perturbations and to identify individual sites for further biological investigation. Our findings show that these two purposes require different levels of evidence. Although positive modification-associated responses were widespread, the identities of the most responsive sites were far more consistent across replicate contrasts in DRACH than in matched non-DRACH sequences. This difference followed independent evidence of methylation rather than the motif itself, part of the widespread non-DRACH response reflected differences between replicate samples, and the near-zero reliability of unsupported non-DRACH responses indicates that additional replicates alone would not make them reproducible. These results suggest that a strong overall response can coexist with considerable uncertainty about which individual nucleotides are changing most reliably. While further studies using independent samples and complementary measurement methods are needed to establish how broadly this pattern applies, the implications extend beyond the dataset examined here. When RNA modification profiles are used to identify regulatory targets or explain cellular responses, the reliability of individual site measurements matters alongside the overall extent of modification-associated changes. In practice, candidate sites should be selected on the basis of reproducibility across independent contrasts and independent evidence of modification, rather than on the size of a response in a single comparison.
Supplementary Materials
The following supporting information can be downloaded at the website of this paper posted on Preprints.org.
Author Contributions
EPA, MK, SJ: Conceptualization and methodology. SJ, EPA, AT: formal analysis and data curation. SJ, MK, EPA, VS, AT: visualization, and writing original draft. All authors contributed to the interpretation of the findings, critically reviewed the manuscript, and approved the final version for submission.
Funding
This research received no specific grant from any funding agency in the public, commercial or not-for-profit sectors.
Competing interests
The authors declare that they have no competing financial or non-financial interests relevant to this work.
Ethics approval
This study involved secondary analysis of publicly available, processed RNA-sequencing data from previously published cell-line experiments. No new experiments involving human participants, human biological materials or animals were performed.
Consent to participate
Not applicable.
Consent for publication
Not applicable.
Data availability
The original xPore measurements were published by Pratanwanich et al. (2021) and are available in Supplementary Data 3 of that article (https://doi.org/10.1038/s41587-021-00949-w). The underlying sequencing data are deposited in the European Nucleotide Archive under accession PRJEB40872. This study used the publicly available processed modification-rate and coverage estimates; no new sequencing data were generated. Derived eligible-site information, matched-site assignments, covariate measurements, and numerical results supporting the analyses are provided in Supplementary Data S1–S3. The original published datasets have not been redistributed. This study additionally used GLORI m6A sites in HEK293T cells (Liu et al., 2023; Supplementary Data 1 of that article), the modification-free IVT transcriptome (McCormick et al., 2024) available from GitHub (RouhanifardLab/PanHumanIVT, release v1.0.0), and the FOCAS screening results (Zhang et al., 2026) available from the Gene Expression Omnibus under accession GSE302263.
References
- Acera Mateos, P.; Sethi, A. J.; Ravindran, A.; et al. Prediction of m6A and m5C at single-molecule resolution reveals a transcriptome-wide co-occurrence of RNA modifications. Nat. Commun. 2024, 15, 3899. [Google Scholar] [CrossRef] [PubMed]
- Ahi, E.P. Bridging maternal effects and epitranscriptomics: A novel perspective in developmental biology. Dev. Dyn. 2026, 255, 628–645. [Google Scholar] [CrossRef] [PubMed]
- Ahi, E.P. Epitranscriptomics as a Candidate Universal Modulator of Dormancy Transitions. Ecol. Evol. 2026, 16, e73007. [Google Scholar] [CrossRef] [PubMed]
- Ahi, E. P.; Singh, P. Emerging Orchestrator of Ecological Adaptation: m6A Regulation of Post-Transcriptional Mechanisms. Mol. Ecol. 2025, 34, e17545. [Google Scholar] [CrossRef] [PubMed]
- Austin, P. C. Balance diagnostics for comparing the distribution of baseline covariates between treatment groups in propensity-score matched samples. Stat. Med. 2009, 28, 3083–3107. [Google Scholar] [CrossRef] [PubMed]
- Barnett, A. G.; van der Pols, J. C.; Dobson, A. J. Regression to the mean: what it is and how to deal with it. Int. J. Epidemiol. 2005, 34, 215–220. [Google Scholar] [CrossRef] [PubMed]
- Bates, D.; Mächler, M.; Bolker, B.; Walker, S. Fitting linear mixed-effects models using lme4. J. Stat. Softw. 2015, 67, 1–48. [Google Scholar] [CrossRef]
- Baykal, P. I.; Łabaj, P. P.; Markowetz, F.; et al. Genomic reproducibility in the bioinformatics era. Genome Biol. 2024, 25, 213. [Google Scholar] [CrossRef] [PubMed]
- Brown, W. Some experimental results in the correlation of mental abilities. Br. J. Psychol. 1910, 3, 296–322. [Google Scholar] [CrossRef]
- Chan, A.; Naarmann-de Vries, I. S.; Scheitl, C. P. M.; Höbartner, C.; Dieterich, C. Detecting m6A at single-molecular resolution via direct RNA sequencing and realistic training data. Nat. Commun. 2024, 15, 3323. [Google Scholar] [CrossRef] [PubMed]
- Cruciani, S.; Delgado-Tejedor, A.; Pryszcz, L. P.; Medina, R.; Llovera, L.; Novoa, E. M. De novo basecalling of RNA modifications at single molecule and nucleotide resolution. Genome Biol. 2025, 26, 38. [Google Scholar] [CrossRef] [PubMed]
- Delaunay, S.; Helm, M.; Frye, M. RNA modifications in physiology and disease: towards clinical applications. Nat. Rev. Genet. 2024, 25, 104–122. [Google Scholar] [CrossRef] [PubMed]
- Delgado-Tejedor, A.; Medina, R.; Begik, O.; et al. Native RNA nanopore sequencing reveals antibiotic-induced loss of rRNA modifications in the A- and P-sites. Nat. Commun. 2024, 15, 10054. [Google Scholar] [CrossRef] [PubMed]
- DerSimonian, R.; Laird, N. Meta-analysis in clinical trials. Control. Clin. Trials 1986, 7, 177–188. [Google Scholar] [CrossRef] [PubMed]
- Diensthuber, G.; Milenkovic, I.; Llovera, L.; Milovanovic, A.; Pelizzari, F.; Novoa, E. M. Systematic benchmarking of dorado basecalling models for RNA modification detection with highly multiplexed nanopore sequencing. Nucleic Acids Res. 2026, 54, gkag349. [Google Scholar] [CrossRef] [PubMed]
- Dominissini, D.; Moshitch-Moshkovitz, S.; Schwartz, S.; et al. Topology of the human and mouse m6A RNA methylomes revealed by m6A-seq. Nature 2012, 485, 201–206. [Google Scholar] [CrossRef] [PubMed]
- Elo, L. L.; Filén, S.; Lahesmaa, R.; Aittokallio, T. Reproducibility-optimized test statistic for ranking genes in microarray studies. IEEE/ACM Trans. Comput. Biol. Bioinform. 2008, 5, 423–431. [Google Scholar] [CrossRef] [PubMed]
- Garcia-Campos, M. A.; Edelheit, S.; Toth, U.; et al. Deciphering the “m6A Code” via Antibody-Independent Quantitative Profiling. Cell 2019, 178, 731–747.e16. [Google Scholar] [CrossRef] [PubMed]
- Ghohabi Esfahani, N.; Stein, A. J.; Akeson, S.; et al. Assessment of nanopore RNA modification calling in human cell lines and synthetic systems. Genome Biol. 2026, 27, 190. [Google Scholar] [CrossRef] [PubMed]
- Hendra, C.; Pratanwanich, P. N.; Wan, Y. K.; et al. Detection of m6A from direct RNA sequencing using a multiple instance learning framework. Nat. Methods 2022, 19, 1590–1598. [Google Scholar] [CrossRef] [PubMed]
- Hu, L.; Liu, S.; Peng, Y.; et al. m6A RNA modifications are measured at single-base resolution across the mammalian transcriptome. Nat. Biotechnol. 2022, 40, 1210–1219. [Google Scholar] [CrossRef] [PubMed]
- Irizarry, R. A.; Warren, D.; Spencer, F.; et al. Multiple-laboratory comparison of microarray platforms. Nat. Methods 2005, 2, 345–350. [Google Scholar] [CrossRef] [PubMed]
- Jalali, S.; Ahi, E. P. How Epitranscriptomic Machinery Senses Environmental Cues. Adv. Biol. 2026, 10, e70154. [Google Scholar] [CrossRef] [PubMed]
- Khorshid, M.; Ahi, E. P. RNA Aptamers and Epitranscriptomics: Charting Unexplored Territories in RNA Biology. Mol. Diagn. Ther. 2026, 30, 383–402. [Google Scholar] [CrossRef] [PubMed]
- Koh, C. W. Q.; Goh, Y. T.; Goh, W. S. S. Atlas of quantitative single-base-resolution N6-methyl-adenine methylomes. Nat. Commun. 2019, 10, 5636. [Google Scholar] [CrossRef] [PubMed]
- Kovaka, S.; Hook, P. W.; Jenike, K. M.; et al. Uncalled4 improves nanopore DNA and RNA modification detection via fast and accurate signal alignment. Nat. Methods 2025, 22, 681–691. [Google Scholar] [CrossRef] [PubMed]
- Kriegeskorte, N.; Simmons, W. K.; Bellgowan, P. S. F.; Baker, C. I. Circular analysis in systems neuroscience: the dangers of double dipping. Nat. Neurosci. 2009, 12, 535–540. [Google Scholar] [CrossRef] [PubMed]
- Kurtyan, E.; Stein, A. J.; Abdalla, K. J.; Yuan, Z.; Jain, M.; Ibrahim, F. Characterization of METTL3/14-mediated m6A modification in human transcriptome using Nanopore direct RNA sequencing. PLoS Genet. 2026, 22, e1012278. [Google Scholar] [CrossRef] [PubMed]
- Leger, A.; Amaral, P. P.; Pandolfini, L.; et al. RNA modifications detection by comparative Nanopore direct RNA sequencing. Nat. Commun. 2021, 12, 7198. [Google Scholar] [CrossRef] [PubMed]
- Li, J.; Chen, Z.; Chen, F.; et al. Targeted mRNA demethylation using an engineered dCas13b-ALKBH5 fusion protein. Nucleic Acids Res. 2020, 48, 5684–5694. [Google Scholar] [CrossRef] [PubMed]
- Li, Q.; Brown, J. B.; Huang, H.; Bickel, P. J. Measuring reproducibility of high-throughput experiments. Ann. Appl. Stat. 2011, 5, 1752–1779. [Google Scholar] [CrossRef]
- Linder, B.; Grozhik, A. V.; Olarerin-George, A. O.; Meydan, C.; Mason, C. E.; Jaffrey, S. R. Single-nucleotide-resolution mapping of m6A and m6Am throughout the transcriptome. Nat. Methods 2015, 12, 767–772. [Google Scholar] [CrossRef] [PubMed]
- Liu, C.; Sun, H.; Yi, Y.; et al. Absolute quantification of single-base m6A methylation in the mammalian transcriptome using GLORI. Nat. Biotechnol. 2023, 41, 355–366. [Google Scholar] [CrossRef] [PubMed]
- Luo, T.; Xu, M.; Wang, M.; Chen, F.; Shi, J. Systematic evaluation of computational tools for multitype RNA modification detection using nanopore direct RNA sequencing. Nat. Methods 2026, 23, 438–450. [Google Scholar] [CrossRef] [PubMed]
- Maestri, S.; Furlan, M.; Mulroney, L.; et al. Benchmarking of computational methods for m6A profiling with Nanopore direct RNA sequencing. Brief. Bioinform. 2024, 25, bbae001. [Google Scholar] [CrossRef] [PubMed]
- Mantel, N.; Haenszel, W. Statistical aspects of the analysis of data from retrospective studies of disease. J. Natl. Cancer Inst. 1959, 22, 719–748. [Google Scholar] [CrossRef] [PubMed]
- McCormick, C. A.; Akeson, S.; Tavakoli, S.; Bloch, D.; Klink, I. N.; Jain, M.; Rouhanifard, S. H. Multicellular, IVT-derived, unmodified human transcriptome for nanopore-direct RNA analysis. GigaByte 2024, 2024, gigabyte129. [Google Scholar] [CrossRef] [PubMed]
- McIntyre, A. B. R.; Gokhale, N. S.; Cerchietti, L.; Jaffrey, S. R.; Horner, S. M.; Mason, C. E. Limits in the detection of m6A changes using MeRIP/m6A-seq. Sci. Rep. 2020, 10, 6590. [Google Scholar] [CrossRef] [PubMed]
- Meyer, K. D.; Saletore, Y.; Zumbo, P.; Elemento, O.; Mason, C. E.; Jaffrey, S. R. Comprehensive analysis of mRNA methylation reveals enrichment in 3′ UTRs and near stop codons. Cell 2012, 149, 1635–1646. [Google Scholar] [CrossRef] [PubMed]
- Meyer, K. D. DART-seq: an antibody-free method for global m6A detection. Nat. Methods 2019, 16, 1275–1280. [Google Scholar] [CrossRef] [PubMed]
- Molinie, B.; Wang, J.; Lim, K. S.; et al. m6A-LAIC-seq reveals the census and complexity of the m6A epitranscriptome. Nat. Methods 2016, 13, 692–698. [Google Scholar] [CrossRef] [PubMed]
- Oberdoerffer, S.; Gilbert, W. V. All the sites we cannot see: Sources and mitigation of false negatives in RNA modification studies. Nat. Rev. Mol. Cell Biol. 2025, 26, 237–248. [Google Scholar] [CrossRef] [PubMed]
- Palmer, C.; Pe'er, I. Statistical correction of the Winner's Curse explains replication variability in quantitative trait genome-wide association studies. PLoS Genet. 2017, 13, e1006916. [Google Scholar] [CrossRef] [PubMed]
- Petri, B. J.; Piell, K. M.; Avila-Valdes, B. L.; et al. Integrated Nanopore and short-read RNA sequencing identifies dysregulation of METTL3-m6A modifications in endocrine therapy-sensitive and resistant breast cancer cells. Funct. Integr. Genom. 2025, 25, 149. [Google Scholar] [CrossRef] [PubMed]
- Poh, H. X.; Mirza, A. H.; Pickering, B. F.; Jaffrey, S. R. Alternative splicing of METTL3 explains apparently METTL3-independent m6A modifications in mRNA. PLoS Biol. 2022, 20, e3001683. [Google Scholar] [CrossRef] [PubMed]
- Pratanwanich, P. N.; Yao, F.; Chen, Y.; et al. Identification of differential RNA modifications from nanopore direct RNA sequencing with xPore. Nat. Biotechnol. 2021, 39, 1394–1402. [Google Scholar] [CrossRef] [PubMed]
- Sammad, A.; Qin, J.-F.; Meng, D.; Khan, S.; Zhu, X.; Yin, K. Epitranscriptomic regulation of diabetic EndMT in HAECs: METTL3-dependent m6A modification promotes endothelial dysfunction. Funct. Integr. Genom. 2026, 26, 134. [Google Scholar] [CrossRef] [PubMed]
- Saqagandomabadi, V.; Sarrafzadeh Zargar, S.; Pooladi, M.; Ahi, E. P. Epitranscriptomic regulation of Notch signaling. Cell. Signal. 2027, 149, 112914. [Google Scholar] [CrossRef] [PubMed]
- Schwartz, S.; Mumbach, M. R.; Jovanovic, M.; et al. Perturbation of m6A writers reveals two distinct classes of mRNA methylation at internal and 5′ sites. Cell Rep. 2014, 8, 284–296. [Google Scholar] [CrossRef] [PubMed]
- Spangenberg, J.; Mündnich, S.; Busch, A.; et al. The RMaP challenge of predicting RNA modifications by nanopore sequencing. Commun. Chem. 2025, 8, 115. [Google Scholar] [CrossRef] [PubMed]
- Spearman, C. The proof and measurement of association between two things. Am. J. Psychol. 1904, 15, 72–101. [Google Scholar] [CrossRef] [PubMed]
- Spearman, C. Correlation calculated from faulty data. Br. J. Psychol. 1910, 3, 271–295. [Google Scholar] [CrossRef]
- Stuart, E. A. Matching methods for causal inference: A review and a look forward. Stat. Sci. 2010, 25, 1–21. [Google Scholar] [CrossRef] [PubMed]
- Suomi, T.; Seyednasrollah, F.; Jaakkola, M. K.; Faux, T.; Elo, L. L. ROTS: An R package for reproducibility-optimized statistical testing. PLoS Comput. Biol. 2017, 13, e1005562. [Google Scholar] [CrossRef] [PubMed]
- Wang, X.; Lu, Z.; Gomez, A.; et al. N6-methyladenosine-dependent regulation of messenger RNA stability. Nature 2014, 505, 117–120. [Google Scholar] [CrossRef] [PubMed]
- Wawrzyniak, N.; Eyras, E.; Wong, J. J.-L. A critical appraisal of base-resolution m6A profiling techniques. Trends Biochem. Sci. 2026, 51, 955–973. [Google Scholar] [CrossRef] [PubMed]
- Zhang, X.; Zhang, Y.; Liu, X.; et al. FOCAS: Transcriptome-wide screening of individual m6A sites functionally dissects epitranscriptomic control of gene expression in cancer. Cell 2026, 189, 922–938.e23. [Google Scholar] [CrossRef] [PubMed]
- Zhang, Z.; Chen, T.; Chen, H.-X.; et al. Systematic calibration of epitranscriptomic maps using a synthetic modification-free RNA library. Nat. Methods 2021, 18, 1213–1222. [Google Scholar] [CrossRef] [PubMed]
- Zhao, X.; Ye, H.; He, D.; Liu, H.; Li, T.; Rigden, D. J.; Wei, Z. m6AConquer: a consistently quantified and orthogonally validated database for the N6-methyladenosine (m6A) epitranscriptome. Nucleic Acids Res. 2026, 54, D204–D218. [Google Scholar] [CrossRef] [PubMed]
- Zhong, Z.-D.; Xie, Y.-Y.; Chen, H.-X.; et al. Systematic comparison of tools used for m6A mapping from nanopore direct RNA sequencing. Nat. Commun. 2023, 14, 1906. [Google Scholar] [CrossRef] [PubMed]
- Zou, Y.; Ahsan, M. U.; Chan, J.; et al. A comparative evaluation of computational models for RNA modification detection using nanopore sequencing with RNA004 chemistry. Brief. Bioinform. 2025, 26, bbaf404. [Google Scholar] [CrossRef] [PubMed]
Figure 1.
Study design and site selection for motif-stratified reproducibility analysis. (A) Distribution of DRACH and non-DRACH sites across the initial dataset, coverage-based filtering, and final matched cohorts (1,293 sites per group). (B) Distributions of sequencing coverage and baseline knockout (KO) modification rates before and after matching (coverage shown as ln(1 + minimum WT/KO coverage across contrasts 1 and 2); KO modification rates are xPore model estimates, and values well above zero do not imply residual m6A stoichiometry). Standardized mean differences (SMDs) indicate improved covariate balance. Distribution shapes are compared in Supplementary Fig. S3. (C) Overview of the reproducibility assessment. Wild-type (WT)–KO modification-rate differences were centered within five-mer sequence contexts. Contrasts 1 and 2 were used to rank sites, while contrast 3 provided a retrospective evaluation of ranking concordance, top-10% overlap enrichment and the centered-response difference (lift).
Figure 1.
Study design and site selection for motif-stratified reproducibility analysis. (A) Distribution of DRACH and non-DRACH sites across the initial dataset, coverage-based filtering, and final matched cohorts (1,293 sites per group). (B) Distributions of sequencing coverage and baseline knockout (KO) modification rates before and after matching (coverage shown as ln(1 + minimum WT/KO coverage across contrasts 1 and 2); KO modification rates are xPore model estimates, and values well above zero do not imply residual m6A stoichiometry). Standardized mean differences (SMDs) indicate improved covariate balance. Distribution shapes are compared in Supplementary Fig. S3. (C) Overview of the reproducibility assessment. Wild-type (WT)–KO modification-rate differences were centered within five-mer sequence contexts. Contrasts 1 and 2 were used to rank sites, while contrast 3 provided a retrospective evaluation of ranking concordance, top-10% overlap enrichment and the centered-response difference (lift).
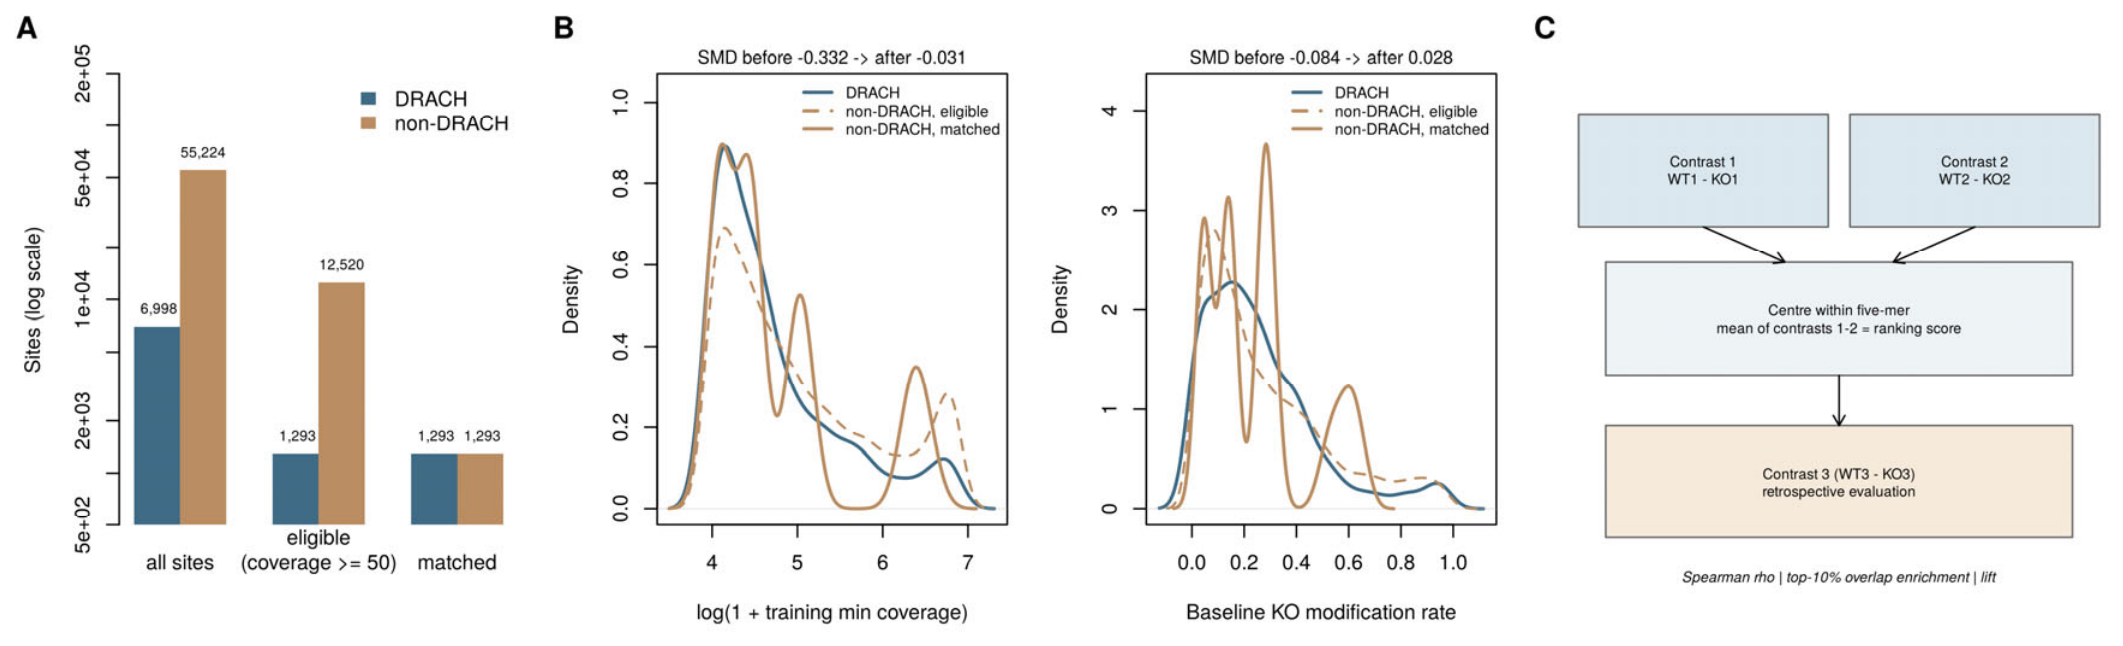
Figure 2.
Sequence-context differences in the reproducibility of site-level RNA modification responses. (A, B) Concordance between centered wild-type (WT)–knockout (KO) modification-rate responses averaged across contrasts 1–2 and responses in contrast 3 for 1,293 matched DRACH (A) and non-DRACH (B) sites. Darker points indicate the top-ranked 10% of sites, and green curves show local trends. DRACH sites exhibit substantially stronger rank concordance (Spearman ρ = 0.815) than non-DRACH sites (ρ = −0.021). (C) Robustness of this difference across coverage- and baseline-matched, same-identifier-matched, and all eligible sites, summarized by rank correlation, top-10% overlap enrichment and centered-response difference (lift). All eligible DRACH sites were matched, so the all-eligible and matched DRACH rows are identical. Darker shading indicates higher values within each metric. (D) Distributions of centered responses in contrast 3 for top-ranked sites and remaining sites. Thick lines indicate interquartile ranges, thin lines the 10th–90th percentiles, circles medians, and diamonds means. Contrast 3 provides a retrospective reproducibility assessment; confidence intervals and tests are given in Supplementary Fig. S4.
Figure 2.
Sequence-context differences in the reproducibility of site-level RNA modification responses. (A, B) Concordance between centered wild-type (WT)–knockout (KO) modification-rate responses averaged across contrasts 1–2 and responses in contrast 3 for 1,293 matched DRACH (A) and non-DRACH (B) sites. Darker points indicate the top-ranked 10% of sites, and green curves show local trends. DRACH sites exhibit substantially stronger rank concordance (Spearman ρ = 0.815) than non-DRACH sites (ρ = −0.021). (C) Robustness of this difference across coverage- and baseline-matched, same-identifier-matched, and all eligible sites, summarized by rank correlation, top-10% overlap enrichment and centered-response difference (lift). All eligible DRACH sites were matched, so the all-eligible and matched DRACH rows are identical. Darker shading indicates higher values within each metric. (D) Distributions of centered responses in contrast 3 for top-ranked sites and remaining sites. Thick lines indicate interquartile ranges, thin lines the 10th–90th percentiles, circles medians, and diamonds means. Contrast 3 provides a retrospective reproducibility assessment; confidence intervals and tests are given in Supplementary Fig. S4.
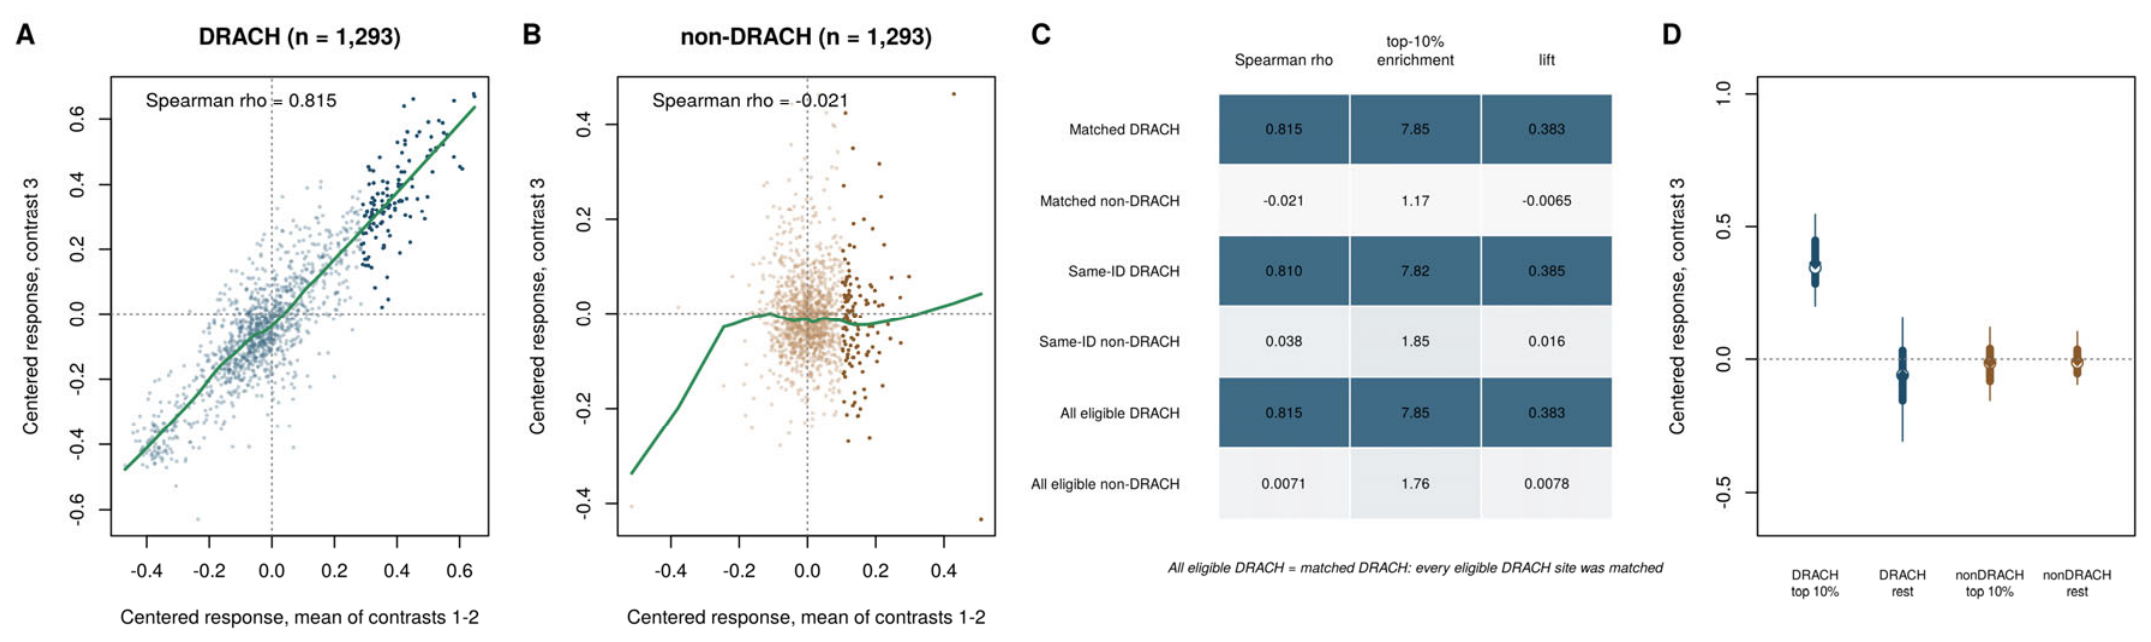
Figure 3.
Sequence-context centering selectively improves the reproducibility of RNA modification site rankings. (A) Comparison of raw-mean, five-mer-centered-mean, and consistency-minimum ranking strategies in matched DRACH and non-DRACH cohorts (1,293 sites each). Connected trajectories show Spearman rank concordance, top-10% overlap enrichment and centered-response difference (lift). (B, C) Changes in these metrics following five-mer centering relative to raw scoring (B), and consistency-minimum scoring relative to the centered mean (C), across matched, same-identifier sensitivity, and all eligible site cohorts. Horizontal displacement indicates the direction and magnitude of improvement or reduction; corresponding metrics share identical scales in both panels. (D) Baseline rank concordance (raw score evaluated against the centered contrast-3 response) plotted against the gain following centering across cohorts. Numbers next to the points refer to the key, which gives the correlation of each cohort before and after centering, while dotted diagonals represent equal post-centering correlations. Against the centered outcome, five-mer centering improves DRACH rankings (on matching scales the gain is modest; Supplementary Fig. S7) but does not restore non-DRACH concordance, and consistency-minimum scoring provides no consistent additional benefit. Rankings were derived from contrasts 1–2 (R1–R2) and assessed retrospectively using contrast 3 (R3), rather than an independent external validation dataset.
Figure 3.
Sequence-context centering selectively improves the reproducibility of RNA modification site rankings. (A) Comparison of raw-mean, five-mer-centered-mean, and consistency-minimum ranking strategies in matched DRACH and non-DRACH cohorts (1,293 sites each). Connected trajectories show Spearman rank concordance, top-10% overlap enrichment and centered-response difference (lift). (B, C) Changes in these metrics following five-mer centering relative to raw scoring (B), and consistency-minimum scoring relative to the centered mean (C), across matched, same-identifier sensitivity, and all eligible site cohorts. Horizontal displacement indicates the direction and magnitude of improvement or reduction; corresponding metrics share identical scales in both panels. (D) Baseline rank concordance (raw score evaluated against the centered contrast-3 response) plotted against the gain following centering across cohorts. Numbers next to the points refer to the key, which gives the correlation of each cohort before and after centering, while dotted diagonals represent equal post-centering correlations. Against the centered outcome, five-mer centering improves DRACH rankings (on matching scales the gain is modest; Supplementary Fig. S7) but does not restore non-DRACH concordance, and consistency-minimum scoring provides no consistent additional benefit. Rankings were derived from contrasts 1–2 (R1–R2) and assessed retrospectively using contrast 3 (R3), rather than an independent external validation dataset.
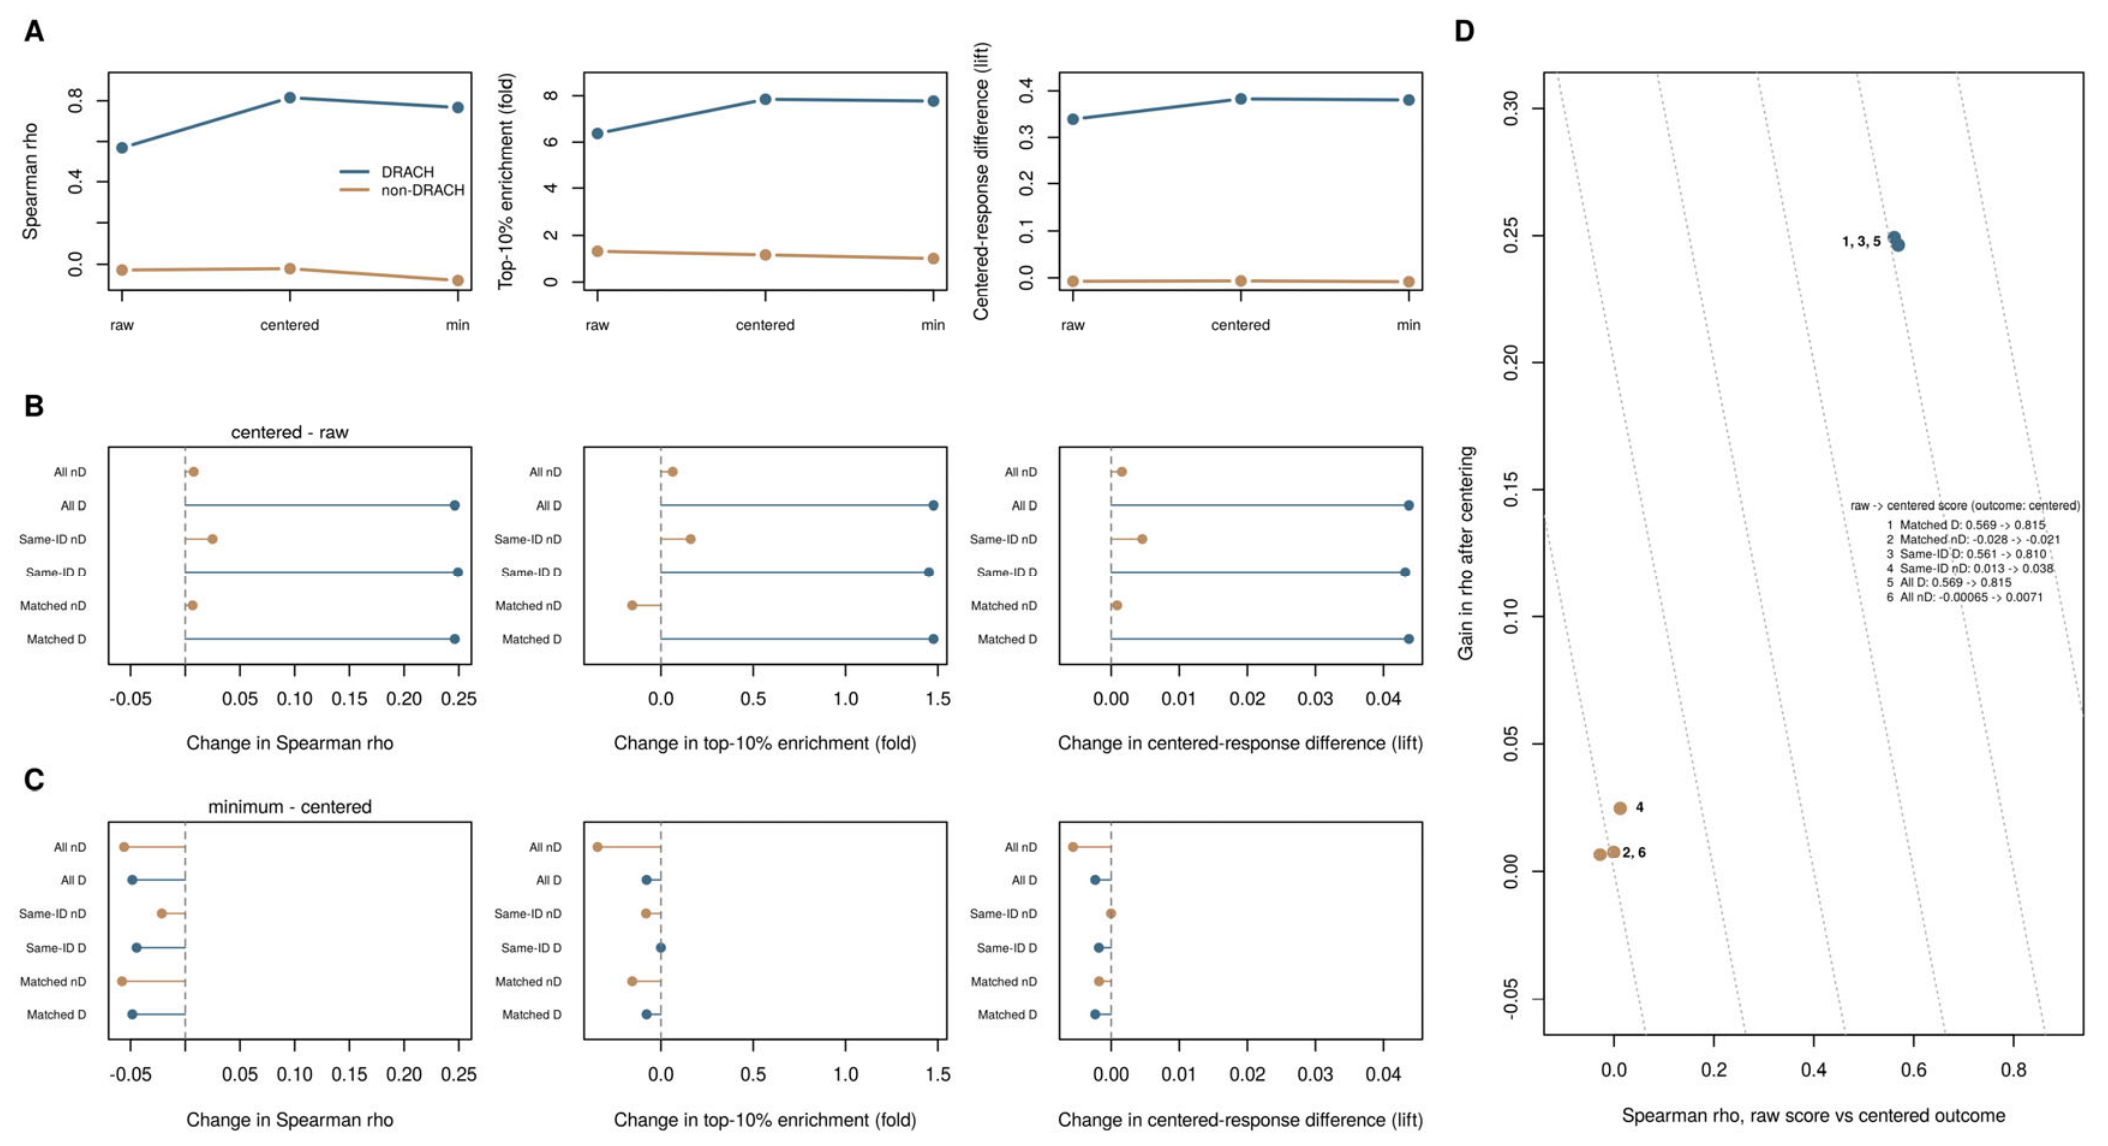
Figure 4.
Five-mer sequence contexts differ in data support and site-level reproducibility of RNA modification responses. (A) Reproducibility atlas of all 256 centered-adenosine five-mers, arranged by their 5′ and 3′ flanking dinucleotides. Tile colors indicate within-context Spearman rank concordance of wild-type (WT)–knockout (KO) modification-rate responses; grey cells denote contexts without reportable estimates (fewer than 30 eligible sites; 9 of 18 DRACH and 115 of 238 non-DRACH contexts were reportable), and blue outlines identify the 18 canonical DRACH contexts. Five-mers are labelled with RNA letters (U). (B) Relationship between five-mer abundance and the proportion of sites meeting complete-coverage requirements. Filled and open markers distinguish reportable and non-reportable contexts. (C) Association between within-context rank concordance and contrast-3 centered-response difference (lift) among reportable contexts. Dashed lines indicate zero concordance and zero lift. (D) Top-ranked site-overlap enrichment as a function of the actual within-context ranking fraction. Horizontal and vertical reference lines indicate chance-level enrichment (1×) and a 10% ranking fraction, respectively. In panels B–D, colors distinguish DRACH and non-DRACH contexts, and point size represents the number of coverage-complete sites. Context-level rankings were evaluated retrospectively using R3 after ranking with R1–R2.
Figure 4.
Five-mer sequence contexts differ in data support and site-level reproducibility of RNA modification responses. (A) Reproducibility atlas of all 256 centered-adenosine five-mers, arranged by their 5′ and 3′ flanking dinucleotides. Tile colors indicate within-context Spearman rank concordance of wild-type (WT)–knockout (KO) modification-rate responses; grey cells denote contexts without reportable estimates (fewer than 30 eligible sites; 9 of 18 DRACH and 115 of 238 non-DRACH contexts were reportable), and blue outlines identify the 18 canonical DRACH contexts. Five-mers are labelled with RNA letters (U). (B) Relationship between five-mer abundance and the proportion of sites meeting complete-coverage requirements. Filled and open markers distinguish reportable and non-reportable contexts. (C) Association between within-context rank concordance and contrast-3 centered-response difference (lift) among reportable contexts. Dashed lines indicate zero concordance and zero lift. (D) Top-ranked site-overlap enrichment as a function of the actual within-context ranking fraction. Horizontal and vertical reference lines indicate chance-level enrichment (1×) and a 10% ranking fraction, respectively. In panels B–D, colors distinguish DRACH and non-DRACH contexts, and point size represents the number of coverage-complete sites. Context-level rankings were evaluated retrospectively using R3 after ranking with R1–R2.
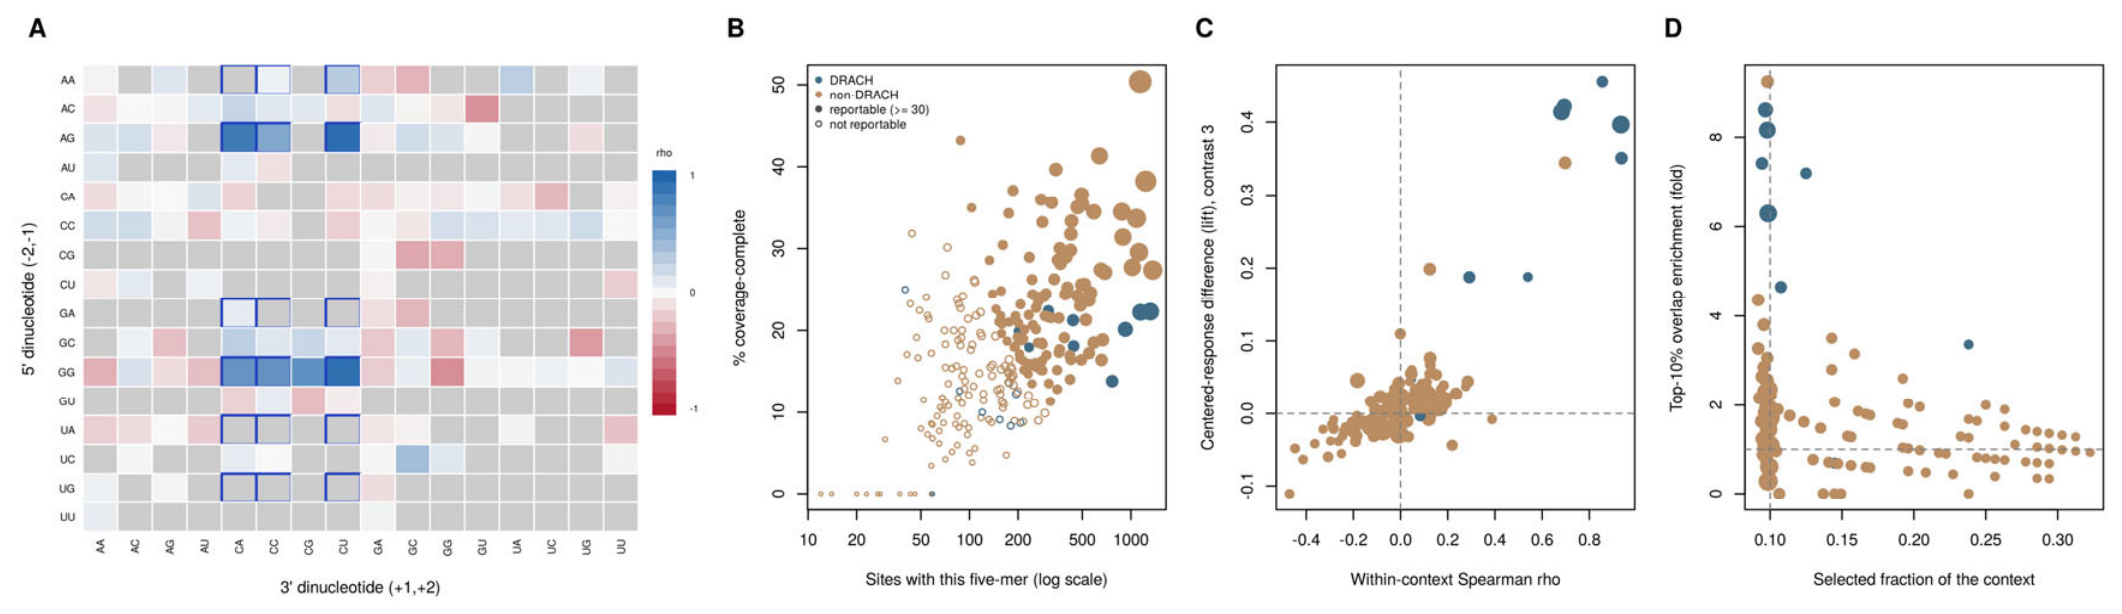
Figure 5.
Widespread RNA modification responses coexist with poor reproducibility of individual site identities. (A) Distributions of raw wild-type (WT)–knockout (KO) modification-rate differences across three replicate contrasts (R1–R3) in coverage- and baseline-matched DRACH and non-DRACH cohorts (1,293 sites each). Violin distributions, boxplots, and sampled site-level observations illustrate response heterogeneity; diamonds indicate 10%-trimmed means, and percentages indicate sites with positive WT–KO responses. (B) Mirrored UpSet-style analysis of contrast-specific top-ranked sites (129 per motif class and contrast). Bars show the numbers of sites belonging exclusively to each of the seven possible R1–R3 membership patterns, identified by the dot matrix. DRACH bars point upwards and non-DRACH bars downwards. The three-way intersection contains 87 DRACH sites but only two non-DRACH sites, despite widespread positive responses in both groups. (C) Rank-transition matrices comparing raw WT–KO response rankings averaged across R1–R2 with rankings in R3. Each cell represents the percentage of sites within a training decile assigned to the corresponding evaluation decile; decile 1 denotes the strongest responses. Outlined cells identify top-decile retention, comprising 99 of 129 DRACH sites versus 19 of 129 non-DRACH sites. (D) Observed agreement in response direction between R1–R2 and R3 across quartiles of training response magnitude, compared with expectations derived from marginal positive- and negative-response frequencies within each quartile (cohort-wide and permutation references are shown in Supplementary Fig. S4). The right-hand plot shows observed minus expected agreement in percentage points. Together, these analyses distinguish widespread perturbation-associated responses from reproducible identification of the most responsive sites. Contrast 3 provides retrospective evaluation rather than independent external validation; modification-associated signals were not chemically validated in the same samples. Null contrasts between replicates of the same condition are shown in Supplementary Fig. S11.
Figure 5.
Widespread RNA modification responses coexist with poor reproducibility of individual site identities. (A) Distributions of raw wild-type (WT)–knockout (KO) modification-rate differences across three replicate contrasts (R1–R3) in coverage- and baseline-matched DRACH and non-DRACH cohorts (1,293 sites each). Violin distributions, boxplots, and sampled site-level observations illustrate response heterogeneity; diamonds indicate 10%-trimmed means, and percentages indicate sites with positive WT–KO responses. (B) Mirrored UpSet-style analysis of contrast-specific top-ranked sites (129 per motif class and contrast). Bars show the numbers of sites belonging exclusively to each of the seven possible R1–R3 membership patterns, identified by the dot matrix. DRACH bars point upwards and non-DRACH bars downwards. The three-way intersection contains 87 DRACH sites but only two non-DRACH sites, despite widespread positive responses in both groups. (C) Rank-transition matrices comparing raw WT–KO response rankings averaged across R1–R2 with rankings in R3. Each cell represents the percentage of sites within a training decile assigned to the corresponding evaluation decile; decile 1 denotes the strongest responses. Outlined cells identify top-decile retention, comprising 99 of 129 DRACH sites versus 19 of 129 non-DRACH sites. (D) Observed agreement in response direction between R1–R2 and R3 across quartiles of training response magnitude, compared with expectations derived from marginal positive- and negative-response frequencies within each quartile (cohort-wide and permutation references are shown in Supplementary Fig. S4). The right-hand plot shows observed minus expected agreement in percentage points. Together, these analyses distinguish widespread perturbation-associated responses from reproducible identification of the most responsive sites. Contrast 3 provides retrospective evaluation rather than independent external validation; modification-associated signals were not chemically validated in the same samples. Null contrasts between replicates of the same condition are shown in Supplementary Fig. S11.
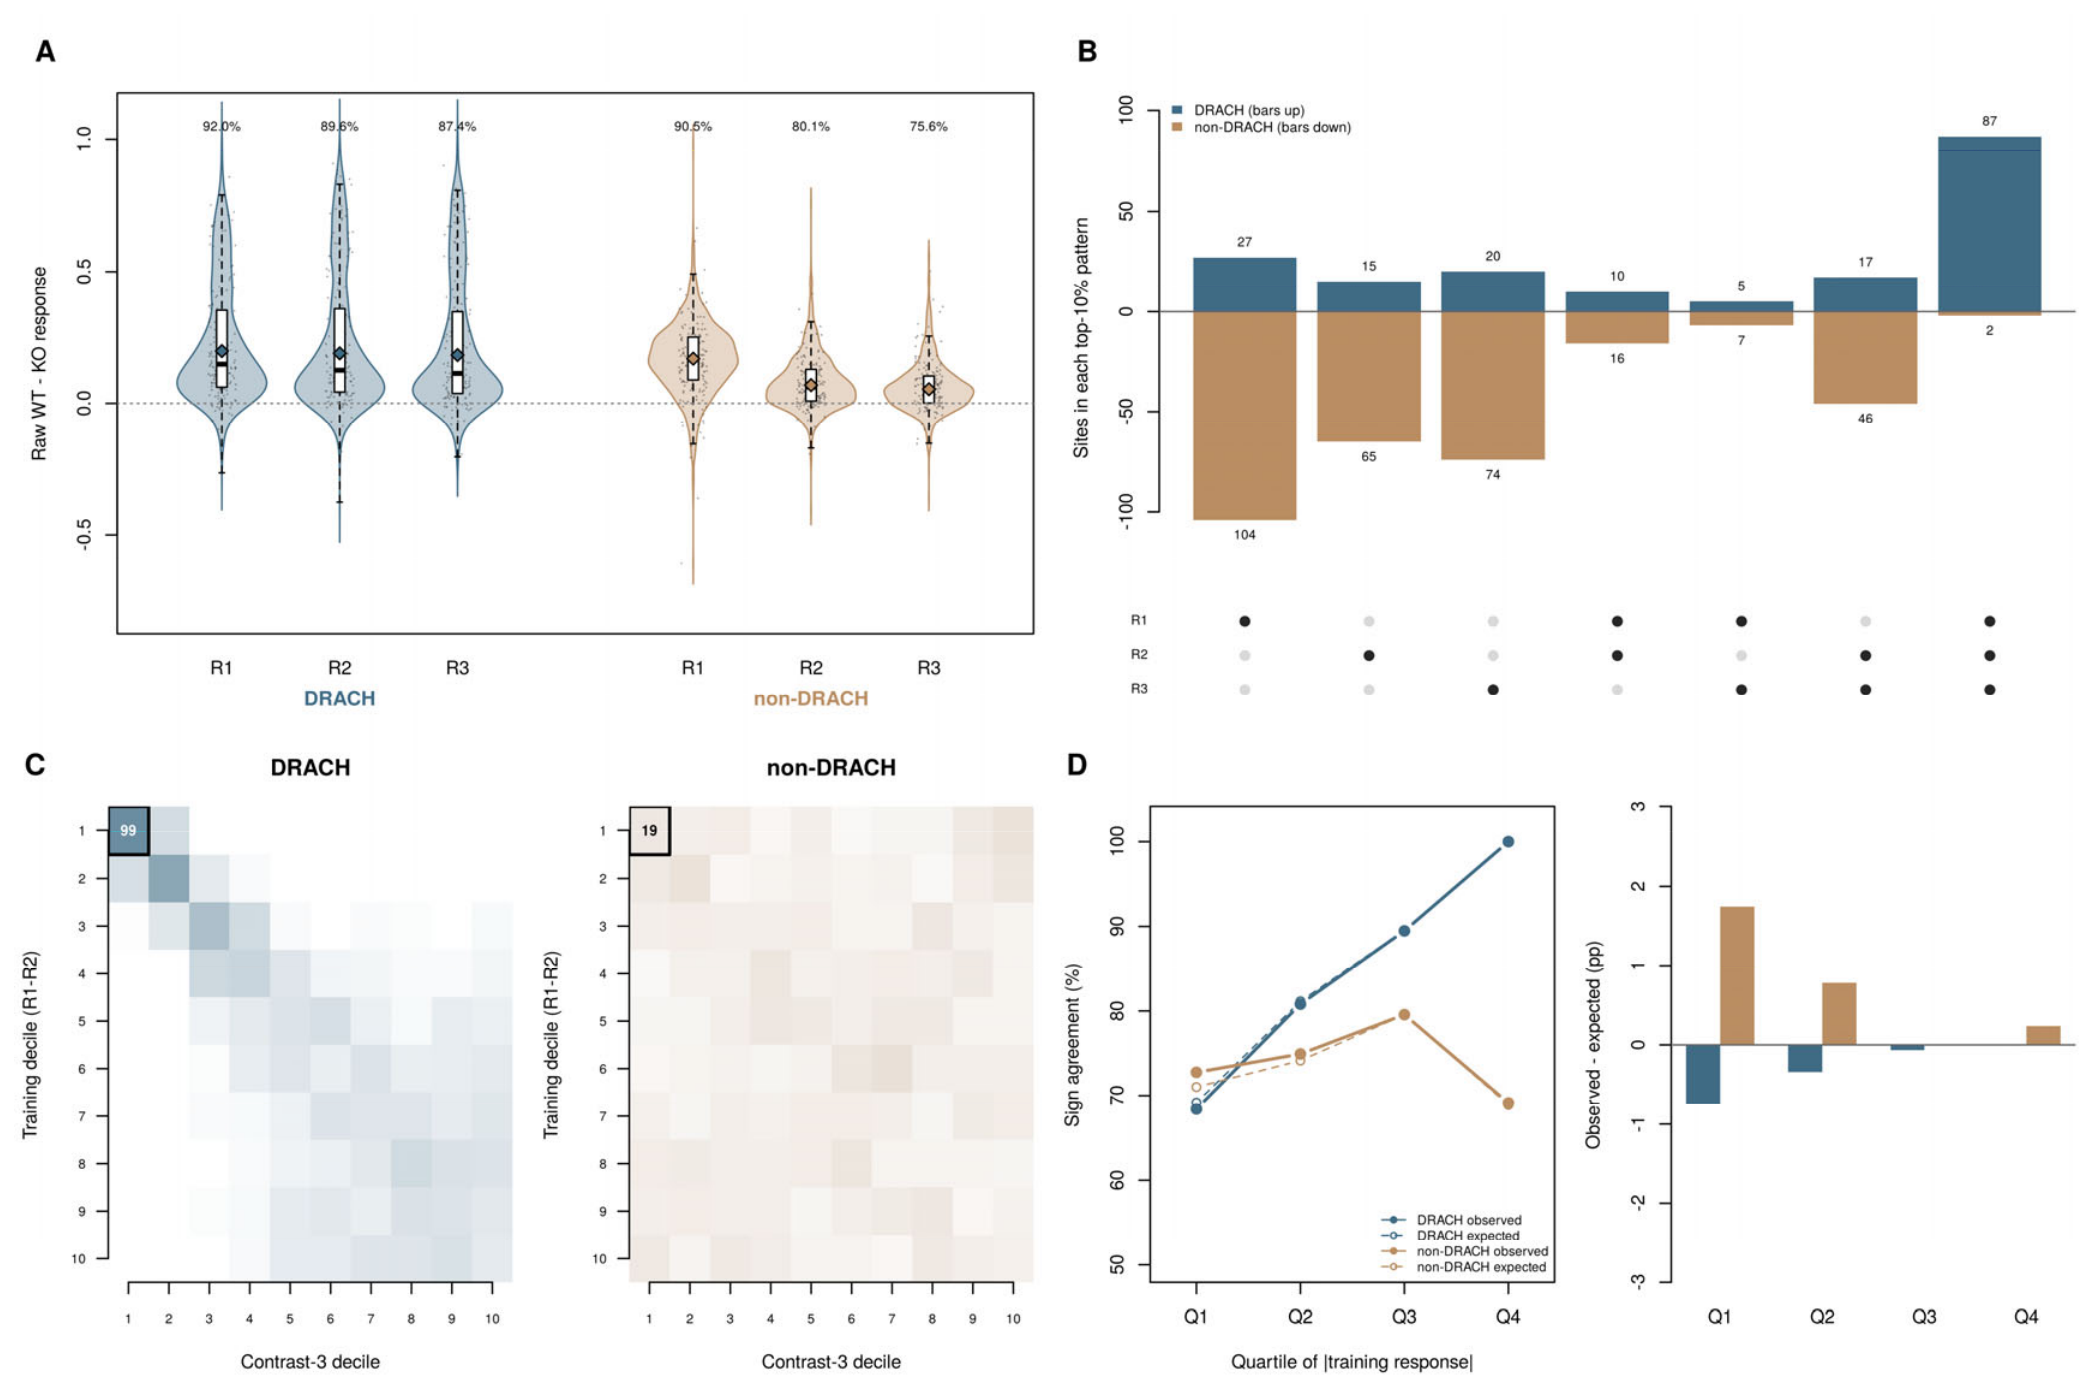
Disclaimer/Publisher’s Note: The statements, opinions and data contained in all publications are solely those of the individual author(s) and contributor(s) and not of MDPI and/or the editor(s). MDPI and/or the editor(s) disclaim responsibility for any injury to people or property resulting from any ideas, methods, instructions or products referred to in the content. |
© 2026 by the authors. Licensee MDPI, Basel, Switzerland. This article is an open access article distributed under the terms and conditions of the Creative Commons Attribution (CC BY) license (http://creativecommons.org/licenses/by/4.0/).
Copyright: This open access article is published under a Creative Commons CC BY 4.0 license, which permit the free download, distribution, and reuse, provided that the author and preprint are cited in any reuse.