

Submitted:
13 November 2026
Posted:
16 November 2026
You are already at the latest version
Abstract
Rock slope stability in open-pit quarries depends on both rock mass quality and the orientation of discontinuities relative to the slope face. This study assesses three andesite slope sectors at the Buluri Quarry, Palu, Indonesia, by combining rock mass classification with limit-equilibrium analyses at the overall-slope and block scales. Field data comprised scanline surveys, UAV photogrammetry, Schmidt hammer tests, and laboratory uniaxial compressive strength tests. The RMR values of Slopes 1, 2, and 3 were 72, 60, and 42; the lowest SMR values were 20, 35, and 16; and the Q-slope values were 0.174, 0.090, and 0.033, corresponding to critical slope angles of 50°, 44°, and 35°. All three existing slopes (55–59°) are steeper than these angles. Overall-slope factors of safety computed with the Barton–Bandis criterion were 1.70, 1.58, and 1.23; however, shallow zones near the slope face had factors of safety as low as 0.28–0.50, and the minimum block-scale factors of safety were 0.80, 0.76, and 0.56. Thus, a satisfactory overall factor of safety does not exclude structurally controlled block failure. Re-profiling the slopes to 50°, 44°, and 36° yielded factors of safety above 1 throughout the modeled sections. Combining empirical classification with limit-equilibrium analysis at more than one scale provides a more complete basis for quarry slope management.
Keywords:
andesite
; rock slope stability
; rock mass classification
; RMR
; SMR
; Q-slope
; limit equilibrium
; UAV photogrammetry
1. Introduction
Andesite has long been quarried in Palu City by both local communities and large companies [1]. It is used as a foundation material for buildings and roads [1,2] and as concrete aggregate [2]. Most quarrying in Palu applies the open-pit method. Unstable mine slopes can cause loss of life and damage to property, and steeper slope angles increase the likelihood of failure; adequate slope design is therefore essential in mining operations [3]. Slope failures also pose significant operational and safety problems in open-pit mines, which underlines the importance of effective slope stability monitoring [4].
Field observations at the Buluri Quarry show that the slopes are steep (Figure 1), intensely jointed, and weathered, and traces of rockfall were found at several locations. Rockfall can endanger operations within and around a quarry [5,6], and the variability of rockfall paths depends on slope surface irregularities and on the shape and mass of the falling blocks [7]. Weathering is also relevant because repeated wetting–drying cycles can progressively reduce the durability of weak and weathered rocks, which should be considered in long-term slope maintenance [8]. A previous study at the same site used scanline mapping and UAV photogrammetry for kinematic analysis and identified potential wedge, planar, and toppling failures [9]. Kinematic feasibility alone, however, does not quantify the quality of the rock mass or the factor of safety of a slope or block.
Rock mass classification systems convert field observations into quantitative indices that support design in mining and civil engineering [10,11,12], and several systems have been developed and evaluated specifically for rock slopes [13,14]. The Rock Mass Rating (RMR) describes the general quality of a rock mass [15,16,17]; the Slope Mass Rating (SMR) adjusts RMR for the orientation of discontinuities relative to the slope face and for the excavation method [17,18,19]; and Q-slope relates rock mass parameters to a critical slope angle [20,21]. These indices are useful for screening and design guidance, but they are not equivalent to a factor of safety. A study of open-pit andesite mines in Indonesia showed that rock mass characterization is an important basis for determining safe slope geometry [22].
Moreover, the stability of a slope as a whole differs from that of individual blocks bounded by discontinuities: a slope may have an overall factor of safety above unity while local blocks remain prone to sliding. This study therefore assesses three slope sectors at the Buluri Quarry by combining RMR, SMR, and Q-slope with limit-equilibrium analyses at the overall-slope and block scales. The objectives are to (1) characterize the mechanical and structural conditions of the slopes; (2) compare the RMR, SMR, and Q-slope results; (3) evaluate the difference between overall-slope and block-scale stability; and (4) examine re-profiling as a mitigation option. A kinematic analysis of the slope as a whole was published previously [9]; in this study, the kinematic analysis is applied to each slope sector and combined with empirical classification and limit-equilibrium analysis.
2. Study Area and Geological Setting
Administratively, the study site (Figure 2) is located in Buluri Village, Ulujadi District, Palu City, Central Sulawesi Province, and geographically lies at 119°48′44.3″ E and 0°50′30″ S. The study area is dominated by an intrusive rock unit composed of diorite, andesite, and granite–granodiorite.
Based on the Reconnaissance Geological Map of the Palu Quadrangle, Sulawesi, at a scale of 1:250,000 [23], the area comprises the Tinombo Formation (Tt), the Celebes Molasse (QTms), and Alluvium and Coastal Deposits (Qap). The Tinombo Formation consists of sandy tuff, shale, sandstone, conglomerate, volcanic rocks, limestone, and chert, with phyllite, slate, and quartzite around intrusive bodies. The Celebes Molasse unconformably overlies the Tinombo Formation and consists of weakly lithified conglomerate, sandstone, mudstone, coral limestone, and marl. The Alluvium and Coastal Deposits consist of unconsolidated gravel, sand, mud, and coral limestone of Holocene age [23].
Regionally, Palu lies in a tectonically active zone associated with the Palu-Koro Fault, an active left-lateral strike-slip fault approximately 240 km long with a slip rate of about 25–30 mm/year [24]. The 2017 Indonesian Earthquake Source and Hazard Map reports a slip rate of 20–40 mm/year for this fault based on GPS data [25], and the 2018 Palu earthquake (Mw 7.5) produced significant surface deformation and triggered a tsunami [26]. Seismic shaking is therefore a relevant potential trigger of rock slope instability in this region.
3. Materials and Methods
3.1. Field Investigation and Slope Sectors
The studied quarry face is approximately 150 m long and 50–80 m high, with dip directions between N40°E and N60°E (Figure 3). Part of the face has been exposed since 2010 and shows weathering grades from I (fresh) to IV (highly weathered) according to the ISRM classification [27] (Figure 4). The face was divided into three sectors, Slope 1, Slope 2, and Slope 3, based on weathering grade, geometry, and structural orientation (Figure 5, Table 1). The average slope angle of each sector was derived from several cross-sections of the three-dimensional slope model.
Discontinuities were measured by scanline surveys, recording orientation, persistence, spacing, roughness, aperture, infilling, and the presence of water. UAV photogrammetry complemented the scanlines in parts of the slope that were difficult to access: overlapping images (at least 60% overlap) were acquired with a DJI Mini 2 quadcopter with a 12-megapixel camera and processed into a three-dimensional slope model, from which structural orientations were extracted with the Compass plugin of CloudCompare [9]. UAV photogrammetry has been shown to complement conventional discontinuity measurements on rock slopes [28]. The discontinuity sets and potential failure geometries of each sector were then determined by kinematic analysis in Rocscience Dips, following the procedure of the previous study [9].
Intact rock strength was measured in situ with a Schmidt hammer and in the laboratory by uniaxial compressive strength (UCS) tests on 5 cm × 5 cm × 5 cm cubic specimens for each weathering grade. Physical properties, including unit weight, were determined following the ISRM suggested methods [27].
3.2. Rock Mass Rating (RMR)
RMR was determined from five parameters, namely UCS, Rock Quality Designation (RQD), discontinuity spacing, discontinuity condition, and groundwater condition [15,16,17], as shown in Equation (1):
where JA1 to JA5 are the ratings of the five parameters. The orientation adjustment was not added to the basic RMR value; it was considered through SMR. The RMR value was also used to estimate the cohesion, internal friction angle, bearing pressure, and safe slope angle of the rock mass [11,15,16].
3.3. Slope Mass Rating (SMR)
SMR was obtained from the basic RMR value by adding adjustment factors that depend on the relationship between the discontinuity orientation and the slope, and a factor that depends on the excavation method [18,19], as shown in Equation (2):
where F1 depends on the parallelism between the dip direction of the slope and that of the joint plane or the line of intersection of two joints, F2 depends on the dip of the joint plane or intersection line, F3 depends on the difference between the joint dip and the slope dip, and F4 is the adjustment for the excavation method. F1, F2, and F3 were calculated with the continuous functions proposed by Tomás et al. [29]. F4 = 0 was used because the slopes were formed by mechanical excavation. The potential failure geometries used in the SMR calculation were taken from the sector-level kinematic analysis (Section 4.2).
3.4. Q-slope
Q-slope is an empirical method for rock slope engineering developed by Bar and Barton [20,21] from the Q-system [30] and has been tested on various rock slope case studies [31]. The Q-slope value is calculated with Equation (3):
where Jn is the joint set number, Jr the joint roughness number, Ja the joint alteration number, O the orientation factor applied to the Jr/Ja ratio, Jwice the environmental and geological condition factor, and SRFslope the strength reduction factor. The steepest slope angle that is expected to remain stable without reinforcement, referred to here as the critical angle β, is obtained from Equation (4) [21]:
3.5. Limit-Equilibrium Analysis
Limit-equilibrium analyses were conducted at two scales: the overall slope, using Rocscience Slide, and individual structurally controlled blocks in the zones where the overall-slope model indicated factors of safety below 1, using Rocscience RocPlane for planar failure and Swedge for wedge failure. The shear strength of the discontinuities was described by the Barton–Bandis criterion [32,33], as shown in Equation (5):
where τ is the shear strength, σn the normal stress, φr the residual friction angle, JRC the joint roughness coefficient, and JCS the joint wall compressive strength. JRC was estimated by comparison with the standard roughness profiles [32], JCS was taken as the compressive strength of each weathering grade, and φr = 30° was used for all materials. The predictions of this criterion are sensitive to the selected JCS where weathering or alteration is present [34], and the adopted friction angle is close to the average basic friction angle of about 31° reported for unweathered, clean rock joints [35]. No water table was included in the models (ru = 0), so the results represent dry conditions; a rising groundwater table can significantly reduce the factor of safety of jointed rock slopes, particularly those with steeply dipping joints [36].
The overall-slope models consisted of material zones corresponding to the weathering grades: Grades I and III for Slope 1, Grades I–IV for Slope 2, and Grades III and IV for Slope 3. The block-scale analyses used JRC values of 5, 4, and 3 and the unit weight and JCS of Grades I, II, and III for Slopes 1, 2, and 3, respectively, with φr = 30°.
4. Results
4.1. Rock Properties
The Schmidt hammer and laboratory UCS results are presented in Table 2. Strength decreases from Grade I to Grade IV, with laboratory UCS values of 139.5, 99.34, and 79.97 MPa for Grades I, II, and III, respectively. The Schmidt hammer-derived strength (X) and laboratory UCS (Y) of Grades I–III follow the linear relationship given in Equation (6):
No laboratory UCS was available for Grade IV; a JCS value of 60.0 MPa was adopted for this grade in the limit-equilibrium models.
4.2. Kinematic Failure Geometries
For the slope as a whole, the previous study reported potential wedge sliding of 26.26%, planar sliding of 10.19%, and flexural toppling of 2.43% [9]. The sector-level kinematic analysis identified four dominant structures on Slope 1 (J1–J3 and F1), eight on Slope 2 (J1–J6, F1, and F2), and six on Slope 3 (J1–J6). These structures produce three potential failures on Slope 1, four on Slope 2, and two on Slope 3 (Section 4.4). The proportions of planar and wedge failure were 27.3% and 40.8% for Slope 1, 5.26% and 22.53% for Slope 2, and 13.3% and 21.33% for Slope 3.
4.3. Rock Mass Rating (RMR)
The RMR ratings of Slope 1, Slope 2, and Slope 3 (Figure 5) are presented in Table 3. Slope 1 has an RMR value of 72 (Class II, good), Slope 2 has an RMR value of 60 (Class III, fair), and Slope 3 has an RMR value of 42 (Class III, fair). The decrease from Slope 1 to Slope 3 is consistent with the lower UCS, lower RQD, closer discontinuity spacing, and less favorable discontinuity condition of Slope 3. Based on these values, Slope 1 has an estimated cohesion of 0.3–0.4 MPa, an internal friction angle of 35–45°, a bearing pressure of 280–440 t/m2, and a safe slope angle of 65°, whereas Slopes 2 and 3 have an estimated cohesion of 0.2–0.3 MPa, an internal friction angle of 25–35°, a bearing pressure of 135–280 t/m2, and a safe slope angle of 55° (Table 3).
4.4. Slope Mass Rating (SMR)
The SMR values were calculated with Equation (2), and the results for the potential failures of Slope 1, Slope 2, and Slope 3 are presented in Table 4. Because SMR depends on the failure mechanism, each slope has more than one SMR value and class. Slope 1 has SMR values of 20–60 (Class V to III, completely unstable to partially stable), Slope 2 has values of 35–54 (Class IV to III, unstable to partially stable), and Slope 3 has values of 16–17 (Class V, completely unstable). The least favorable cases are the J1 × J3 wedge on Slope 1 (SMR = 20), the J1 × J2 wedge on Slope 2 (SMR = 35), and the J1 × J2 wedge on Slope 3 (SMR = 16), which correspond to failure probabilities of 0.9, 0.6, and 0.9, respectively, according to Romana’s classification [18,19].
4.5. Q-slope
The Q-slope parameters and results are presented in Table 5. The Q-slope values are 0.174 for Slope 1, 0.090 for Slope 2, and 0.033 for Slope 3, and the corresponding critical angles calculated with Equation (4) are 50°, 44°, and 35°. All three existing slopes (57°, 55°, and 59°) are steeper than their critical angles (Table 5) and are therefore prone to failure. Based on the Q-slope assessment, the probability of failure is estimated at approximately 30% for Slope 1, approximately 50% for Slope 2, and more than 50% for Slope 3.
4.6. Limit-Equilibrium Results
The material parameters used in the overall-slope models are listed in Table 6.
The overall-slope factors of safety are 1.695 for Slope 1, 1.578 for Slope 2, and 1.234 for Slope 3 (Figure 6). However, each model contains shallow zones near the slope face with factors of safety below 1, at elevations of 40–77 m on Slope 1, 19–72 m on Slope 2, and 5–50 m on Slope 3, with minimum values of 0.502, 0.283, and 0.290, respectively (Figure 7). The block-scale analyses in these zones gave factors of safety of 0.80–0.92 for Slope 1, 0.76–3.12 for Slope 2, and 0.56–4.45 for Slope 3 (Table 7). The minimum block-scale factor of safety is below 1 in all three slopes and corresponds to a planar failure along J1 on Slopes 1 and 2 and along J2 on Slope 3.
4.7. Re-Profiling Scenarios
Based on the SMR results, the possible treatments include retaining walls, drainage, shotcrete, rock bolts, and re-excavation of the slope [18,19]. Re-excavation (re-profiling) was selected considering operational priorities and cost in the quarry. The slopes were remodeled at 50°, 44°, and 36° for Slopes 1, 2, and 3, respectively, close to the Q-slope critical angles (Table 5). All re-profiled models yielded factors of safety above 1 throughout the modeled sections (Figure 8); the lowest factor-of-safety range was 1.0–1.5 for Slopes 1 and 2 and 1.5–2.0 for Slope 3.
5. Discussion
5.1. Rock Mass Quality and Structural Control
The decrease in RMR from 72 on Slope 1 to 42 on Slope 3 reflects spatial variation in rock mass quality across a single quarry face. Slope 3 consists of moderately to highly weathered material and has the lowest RQD, the closest discontinuity spacing, and smooth, open discontinuities. Geomechanical parameters can vary considerably within a single rock mass [37], and increasing water content and seepage pressure are known to reduce the strength and stiffness of altered rock [38]; the reported strengths should therefore be interpreted in relation to the weathering grade of the tested material.
RMR alone, however, does not describe slope stability. Slope 1 has the highest RMR value (Class II), yet its J1 × J3 wedge has an SMR of 20 (Class V). This confirms that the orientation of discontinuities relative to the slope face can make a slope with good rock mass quality locally unstable, and that the full range of SMR values and the associated failure geometries should be reported rather than a single value.
5.2. Safe Slope Angles from RMR and Q-slope
The safe slope angles estimated from RMR (65° for Slope 1 and 55° for Slopes 2 and 3) are steeper than the Q-slope critical angles (50°, 44°, and 35°). The RMR-based angles depend only on rock mass quality, whereas Q-slope also accounts for discontinuity orientation, environmental conditions, and strength reduction. The limit-equilibrium results support the more conservative Q-slope angles: the existing slopes, which are steeper than these angles, contain zones with factors of safety below 1, whereas the re-profiled slopes, close to these angles, have factors of safety above 1 throughout. For the quarry slopes studied here, the RMR-based safe angles therefore should not be used for design without considering discontinuity orientation.
5.3. Overall-Slope versus Block-Scale Stability
The overall-slope factors of safety (1.695, 1.578, and 1.234) are above 1, whereas the minimum block-scale factors of safety (0.80, 0.76, and 0.56) are below 1. These results are not contradictory, because the two analyses address different failure mechanisms: the overall-slope model evaluates deep failure surfaces through the rock mass, whereas the block-scale models evaluate sliding along specific discontinuities near the face. A satisfactory overall factor of safety therefore does not exclude structurally controlled local failure.
The SMR values and block-scale factors of safety do not rank the failure cases identically. On Slope 3, the J2 planar case (SMR = 17) has a factor of safety of 0.56, whereas the J1 × J2 wedge (SMR = 16) has a factor of safety of 4.45. SMR is an empirical index of orientation and rock mass quality, whereas the block-scale factor of safety also depends on block geometry and on the shear strength parameters JRC, JCS, and φr. The two approaches are therefore complementary: SMR identifies structurally adverse cases, and the limit-equilibrium analysis evaluates whether these cases are unstable under the adopted parameters.
5.4. Implications for Quarry Slope Management
The re-profiling angles of 50°, 44°, and 36° provide a basis for flatter slope geometries at the Buluri Quarry. A final design should also consider bench height and width, catch berm capacity, access and haul roads, drainage, groundwater changes, and seismic loading. Local blocks may require scaling, exclusion zones, or support, because rockfall from the slope face can endanger operations within and beyond the quarry [5,6]. Drainage is particularly important because a rise in the groundwater table can reduce the factor of safety of jointed rock slopes [36]. Where slopes remain in operation, displacement monitoring can provide early warning; acceleration-based measures have been proposed to identify the onset of progressive failure in open-pit slopes [39].
5.5. Limitations
This study has several limitations. First, the discontinuity data were obtained with the same scanline and UAV photogrammetry approach as the previous whole-slope study [9], so the sector-level kinematic results share the limitations of that approach. Second, the RQD values adopted in the RMR and Q-slope assessments differ (Table 3 and Table 5). Third, the limit-equilibrium analyses assumed dry conditions and did not consider seismic loading, and no sensitivity analysis of JRC, JCS, and φr was performed. Fourth, the Schmidt hammer–UCS relationship is based on three weathering grades, and no laboratory UCS was available for Grade IV. Finally, the re-profiling scenarios are model results that have not been validated by field performance.
6. Conclusions
An integrated assessment of three andesite slope sectors at the Buluri Quarry was carried out using RMR, SMR, Q-slope, sector-level kinematic analysis, and limit-equilibrium analyses at the overall-slope and block scales. The RMR values were 72 (Class II), 60 (Class III), and 42 (Class III) for Slopes 1, 2, and 3, respectively. The lowest SMR values were 20, 35, and 16, showing that structurally adverse failure cases can occur even where the rock mass quality is good. The Q-slope values were 0.174, 0.090, and 0.033, with critical angles of 50°, 44°, and 35°, all of which are flatter than the existing slopes.
The overall-slope factors of safety were 1.70, 1.58, and 1.23, whereas the minimum block-scale factors of safety were 0.80, 0.76, and 0.56. Overall-slope and block-scale analyses therefore provide different but complementary assessments, and a factor of safety above 1 for the overall slope does not exclude local block failure. Re-profiling to 50°, 44°, and 36° yielded factors of safety above 1 throughout the modeled sections. These angles should be treated as model-based recommendations that require design verification. Overall, combining empirical rock mass classification with limit-equilibrium analysis at more than one scale provides a more complete basis for assessing jointed quarry slopes.
Author Contributions
Conceptualization, S.R. and F.H.P.; methodology, S.R. and F.H.P.; formal analysis, S.R. and F.H.P.; investigation, S.R. and F.H.P.; writing—original draft preparation, A.R.; writing—review and editing, F.R.; visualization, S.R. and F.H.P.; supervision, S.R. All authors have read and agreed to the published version of the manuscript.
Funding
This research received no external funding.
Data Availability Statement
The data presented in this study are available on request from the corresponding author.
Acknowledgments
This article is based on the master’s thesis of F.H.P. at the Master’s Program in Civil Engineering, Tadulako University (2024). The authors have reviewed and edited the output and take full responsibility for the content of this publication.
Conflicts of Interest
The authors declare no conflicts of interest.
References
- Renaldi, R.; Botjing, M.U. Studi Geologi dan Uji Sifat Fisik Batuan Andesit pada Daerah Buluri Kota Palu. Bomba: Jurnal Pembangunan Daerah 2023, 1, 35–42.
- Sukandarrumidi. Bahan Galian Industri; Gadjah Mada University Press: Yogyakarta, Indonesia, 2016.
- Kolapo, P.; Oniyide, G.O.; Said, K.O.; Lawal, A.I.; Onifade, M.; Munemo, P. An Overview of Slope Failure in Mining Operations. Mining 2022, 2, 350–384. [CrossRef]
- Le Roux, R.; Sepehri, M.; Khaksar, S.; Murray, I. Slope Stability Monitoring Methods and Technologies for Open-Pit Mining: A Systematic Review. Mining 2025, 5, 32. [CrossRef]
- Macciotta, R.; Altamirano, F.; Gibbins, L.; Espezua, M.; Fernández, R.; Maguiña, J. Rock Fall Hazard Analysis for In-Pit Operations Potentially Impacting External Sensitive Areas. Mining 2021, 1, 135–154. [CrossRef]
- Silveira, L.R.C.; Lana, M.S.; Alameda-Hernández, P.; dos Santos, T.B. A New Methodology for Rockfall Hazard Assessment in Rocky Slopes. Mining 2022, 2, 791–808. [CrossRef]
- Arsenith, L.; Goertzen, G.; Hudyma, N. Tortuosity—A Novel Approach to Quantifying Variability of Rockfall Paths. Geotechnics 2025, 5, 36. [CrossRef]
- Kaspar, M.; Latal, C.; Pittino, G.; Reinprecht, V. Degradation and Decay of Rocks: Linking Wetting–Drying and Slake Durability Tests for Climate-Sensitive Maintenance. Geotechnics 2025, 5, 84. [CrossRef]
- Pradana, F.H.; Ramadhani, S.; Rahayu, A. Rock Slope Stability Assessment Using Kinematic Analysis on Mining Area at Palu, Central Sulawesi, Indonesia. International Journal of Research in Engineering and Science 2024, 12, 66–70.
- Khatik, V.M.; Nandi, A.K. A Generic Method for Rock Mass Classification. Journal of Rock Mechanics and Geotechnical Engineering 2018, 10, 102–116. [CrossRef]
- Rai, M.A.; Kramadibrata, S.; Wattimena, R.K. Mekanika Batuan; ITB Press: Bandung, Indonesia, 2019; ISBN 978-623-7165-84-2.
- González de Vallejo, L.I.; Ferrer, M. Geological Engineering; CRC Press, Taylor & Francis Group: London, UK, 2011. [CrossRef]
- Jaiswal, A.; Verma, A.K.; Singh, T.N. A Novel Proposed Classification System for Rock Slope Stability Assessment. Scientific Reports 2024, 14, 10992. [CrossRef]
- Jaiswal, A.; Verma, A.K.; Singh, T.N. A Critical Review of Rock Mass Classification Systems for Assessing the Stability Condition of Rock Slopes. Environmental Earth Sciences 2024, 83, 245. [CrossRef]
- Bieniawski, Z.T. Engineering Classification of Jointed Rock Masses. Transactions of the South African Institution of Civil Engineers 1973, 15, 335–344.
- Bieniawski, Z.T. Engineering Rock Mass Classifications: A Complete Manual for Engineers and Geologists in Mining, Civil, and Petroleum Engineering; John Wiley & Sons: New York, NY, USA, 1989.
- Abbas, S.M.; Konietzky, H. Rock Mass Classification Systems. In Introduction to Geomechanics; Konietzky, H., Ed.; Institute of Geotechnics, TU Bergakademie Freiberg: Freiberg, Germany, 2014.
- Romana, M. New Adjustment Ratings for Application of Bieniawski Classification to Slopes. In Proceedings of the International Symposium on the Role of Rock Mechanics in Excavations for Mining and Civil Works; International Society for Rock Mechanics: Zacatecas, Mexico, 1985; pp. 49–53.
- Romana, M.; Serón, J.B.; Montalar, E. SMR Geomechanics Classification: Application, Experience and Validation. In Proceedings of the 10th ISRM International Congress on Rock Mechanics, Sandton, South Africa, 2003.
- Bar, N.; Barton, N. Introducing the Q-slope Method and Its Intended Use within Civil and Mining Engineering Projects. In Proceedings of the ISRM Regional Symposium EUROCK 2015, Salzburg, Austria, 2015; pp. 157–162.
- Bar, N.; Barton, N. The Q-slope Method for Rock Slope Engineering. Rock Mechanics and Rock Engineering 2017, 50, 3307–3322. [CrossRef]
- Nata, R.A.; Ren, G.; Ge, Y.; Zhang, C.; Zhang, L.; Kang, P.; Syahmer, V. Designing Stable Rock Slopes in Open-Pit Mines: A Case Study of Andesite Mining at Anugerah Berkah Sejahtera. Sustainability 2025, 17, 5711. [CrossRef]
- Sukamto, R. Peta Geologi Tinjau Lembar Palu, Sulawesi, Skala 1:250.000; Pusat Penelitian dan Pengembangan Geologi: Bandung, Indonesia, 1973.
- Kaharuddin, M.S.; Hutagalung, R.; Nurhamdan. Perkembangan Tektonik dan Implikasinya terhadap Potensi Gempa dan Tsunami di Kawasan Pulau Sulawesi. In Proceedings of the 36th HAGI and 40th IAGI Annual Convention and Exhibition, Makassar, Indonesia, 26–29 September 2011; pp. 1–10.
- Pusat Studi Gempa Nasional (PuSGeN). Peta Sumber dan Bahaya Gempa Indonesia Tahun 2017; Pusat Penelitian dan Pengembangan Perumahan dan Permukiman, Kementerian Pekerjaan Umum dan Perumahan Rakyat: Bandung, Indonesia, 2017.
- Simons, W.; Broerse, T.; Shen, L.; Kleptsova, O.; Nijholt, N.; Hooper, A.; Pietrzak, J.; Morishita, Y.; Naeije, M.; Lhermitte, S.; et al. A Tsunami Generated by a Strike-Slip Event: Constraints from GPS and SAR Data on the 2018 Palu Earthquake. Journal of Geophysical Research: Solid Earth 2022, 127, e2022JB024191. [CrossRef]
- Brown, E.T., Ed. Rock Characterization, Testing and Monitoring: ISRM Suggested Methods; Pergamon Press: Oxford, UK, 1981.
- Rodríguez-Servín, M.G.; Arreygue-Rocha, J.E.; Rodríguez-Rangel, H.; Lobato-Báez, M.; Díaz-Barriga, J.M.; Morales-Rosales, L.A. Comparative Analysis of Rock Mass Characterization Techniques to Recommend Geomechanical Prevention Mechanisms Using UAV Photogrammetry. Applied Sciences 2025, 15, 11388. [CrossRef]
- Tomás, R.; Delgado, J.; Serón, J.B. Modification of Slope Mass Rating (SMR) by Continuous Functions. International Journal of Rock Mechanics and Mining Sciences 2007, 44, 1062–1069. [CrossRef]
- Barton, N.; Lien, R.; Lunde, J. Engineering Classification of Rock Masses for the Design of Tunnel Support. Rock Mechanics 1974, 6, 189–236. [CrossRef]
- Borja Bernal, C.; Laín, R.; Jordá Bordehore, L.; Cano, M.; Riquelme, A.; Tomás, R. Stability Assessment of Rock Slopes Using the Q-Slope Classification System: A Reliability Analysis Employing Case Studies in Ecuador. Applied Sciences 2023, 13, 7399. [CrossRef]
- Barton, N.; Choubey, V. The Shear Strength of Rock Joints in Theory and Practice. Rock Mechanics 1977, 10, 1–54. [CrossRef]
- Bandis, S.C.; Lumsden, A.C.; Barton, N.R. Fundamentals of Rock Joint Deformation. International Journal of Rock Mechanics and Mining Sciences & Geomechanics Abstracts 1983, 20, 249–268. [CrossRef]
- Mahdavirad, M.; Seifaddini, M.; Saeidi, A.; Noël, J.-F.; Salimi, M.; Payan, M. Shear Strength Criteria for Clean Rock Joints: Representation and Comparison of Different Failure Criteria. Geotechnics 2026, 6, 113. [CrossRef]
- Zoorabadi, M.; Muralha, J. Shear Strength of Rock Discontinuities with Emphasis on the Basic Friction Angle Based on a Compiled Database. Geotechnics 2025, 5, 48. [CrossRef]
- Beyabanaki, S.A.R. Impact of Groundwater Table Fluctuation on Stability of Jointed Rock Slopes and Landslides. Geotechnics 2022, 2, 335–347. [CrossRef]
- Mandaglio, M.C. Geomechanical Characterization of the Rock Mass along a Deep Vertical Borehole. Geotechnics 2024, 4, 209–228. [CrossRef]
- Xu, J.; Duan, J.; Wang, Q.; Zhang, F.; Lv, Y.; Fu, W. Strength Deterioration of Strongly Altered Granite under Varying Water Content and Seepage Pressure: Experimental Insights for Reservoir Slope Stability. Geotechnics 2026, 6, 76. [CrossRef]
- Beingessner, T.; Elmo, D. Slope Damage and the Onset of Acceleration: A Framework for Progressive Failure Monitoring. Geotechnics 2026, 6, 63. [CrossRef]
Figure 1.
Quarry rock slope at the Buluri Quarry.
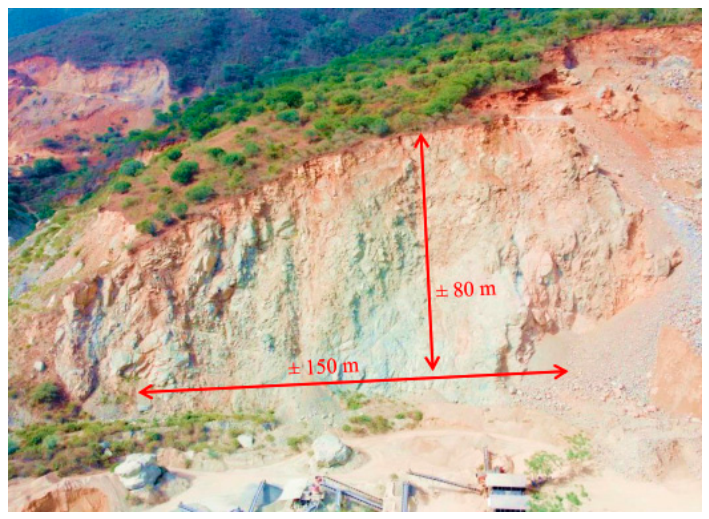
Figure 2.
Location map of the study area.
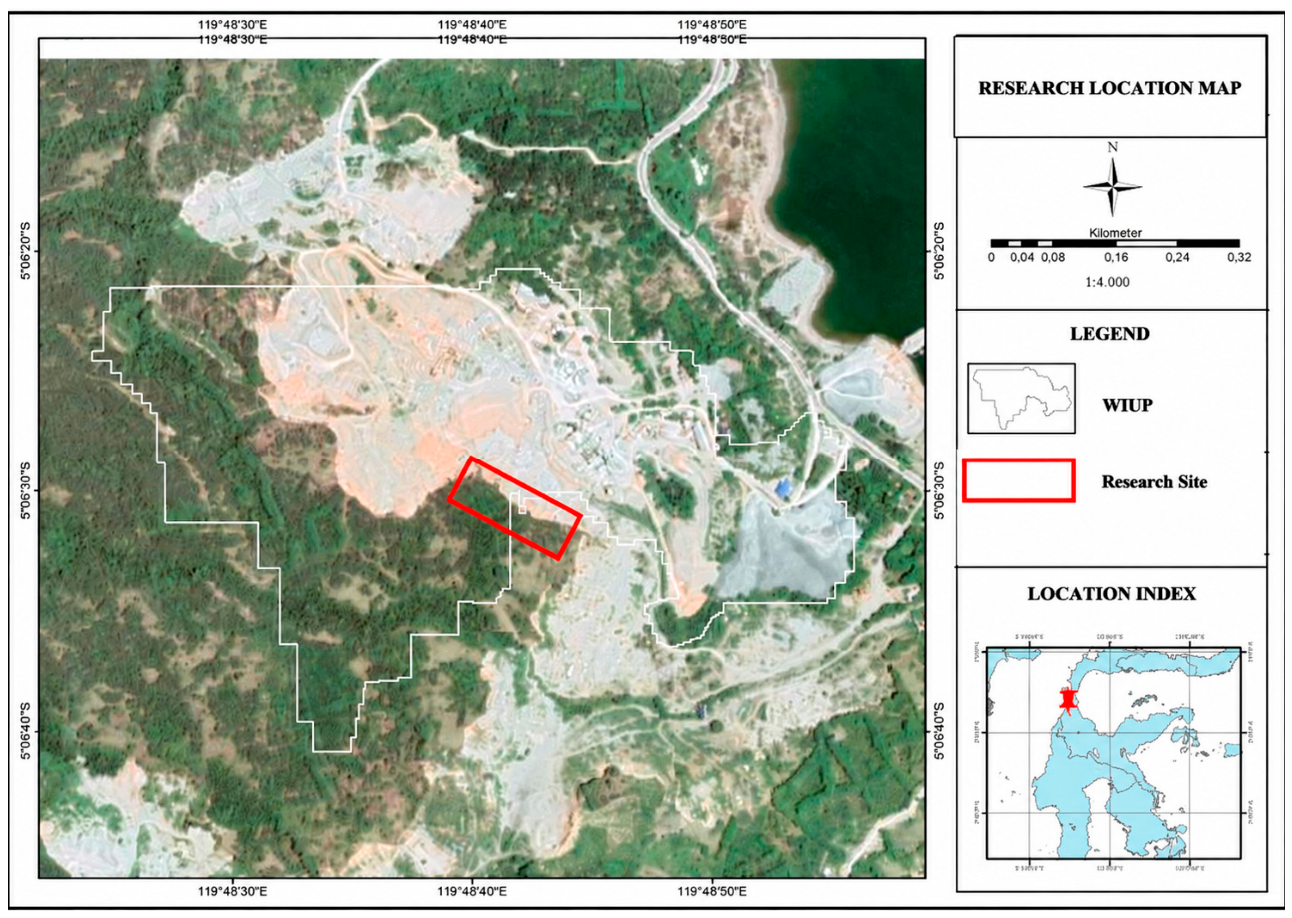
Figure 3.
Three-dimensional slope model from UAV photogrammetry: textured model with the main structures marked by red lines (top) and elevation model (bottom).
Figure 3.
Three-dimensional slope model from UAV photogrammetry: textured model with the main structures marked by red lines (top) and elevation model (bottom).
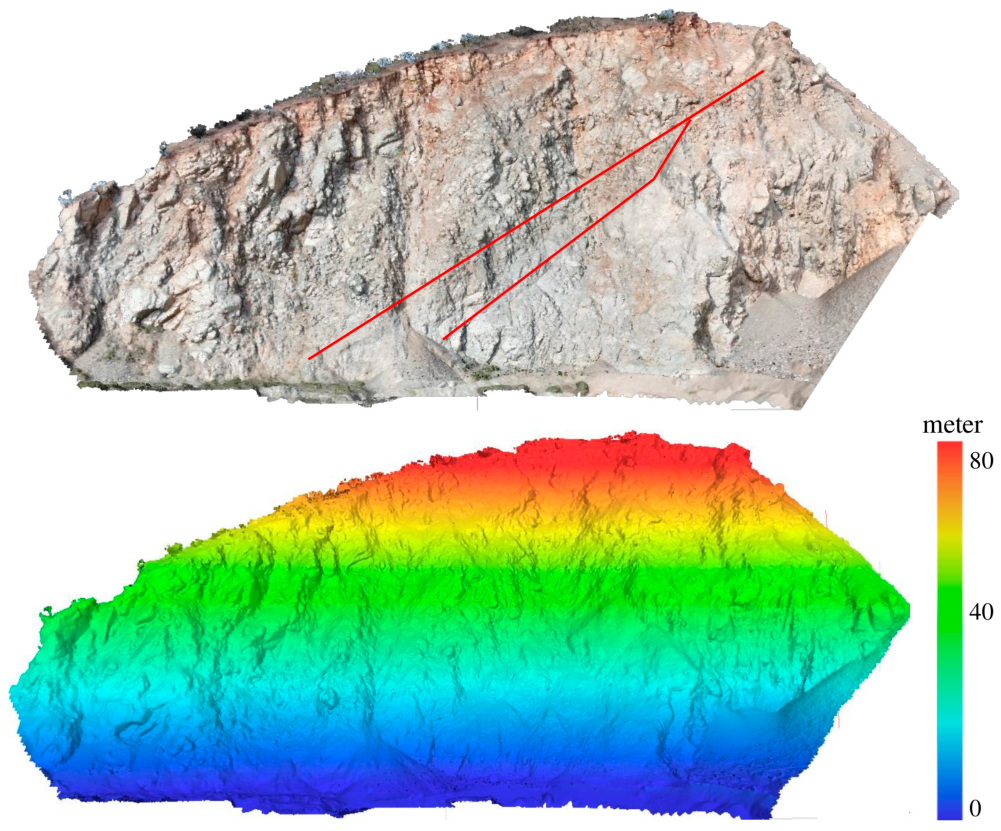
Figure 4.
Weathering grades (I–IV) on the quarry face.
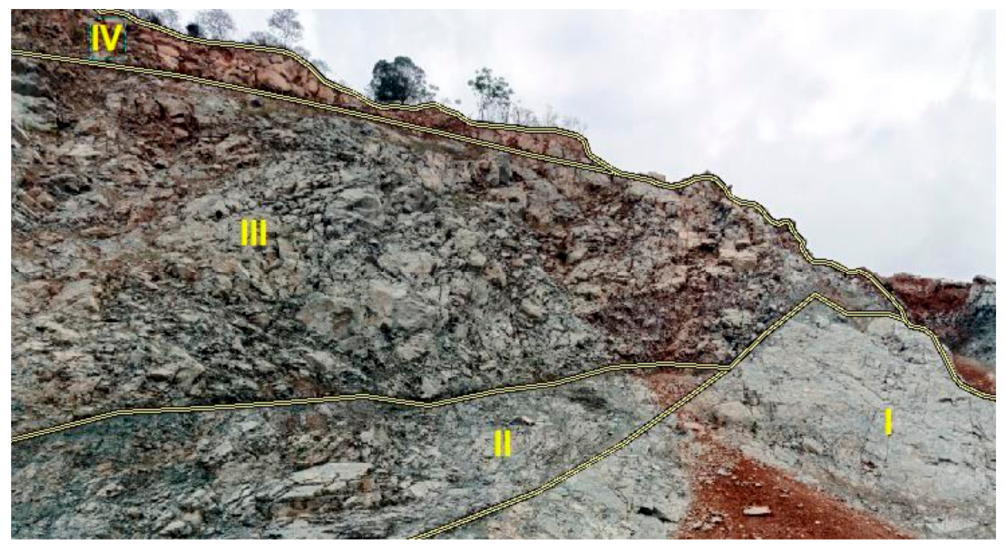
Figure 5.
Slope sectors: Slope 1, Slope 2, and Slope 3.
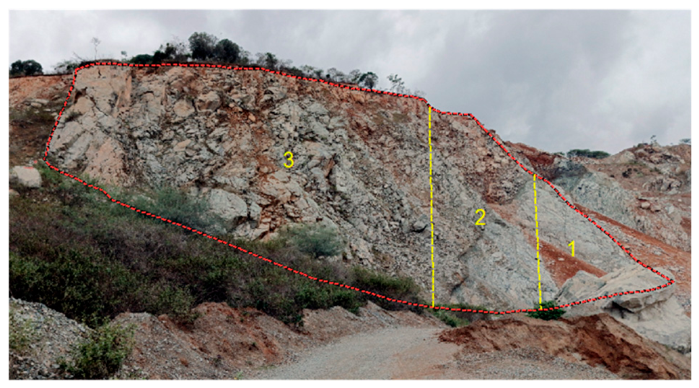
Figure 6.
Factors of safety of the overall-slope models: (a) Slope 1, (b) Slope 2, and (c) Slope 3.
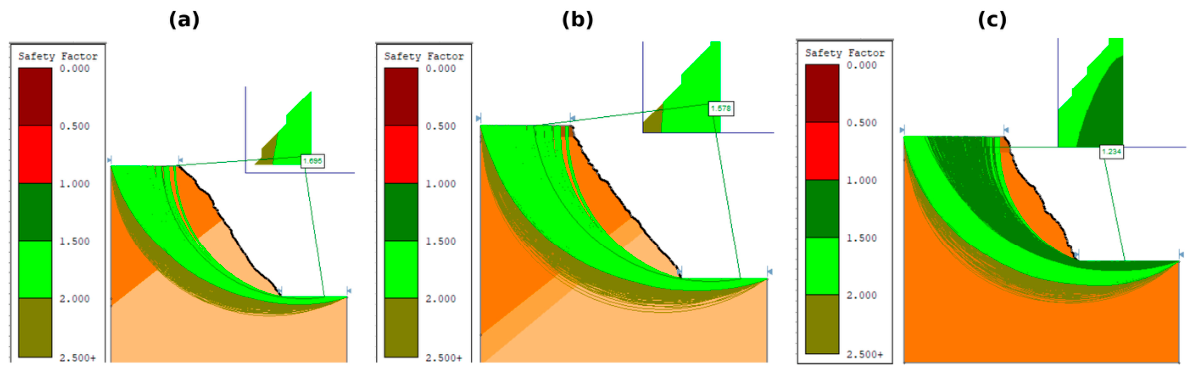
Figure 7.
Zones with factors of safety below 1 near the slope face: (a) Slope 1, (b) Slope 2, and (c) Slope 3.
Figure 7.
Zones with factors of safety below 1 near the slope face: (a) Slope 1, (b) Slope 2, and (c) Slope 3.
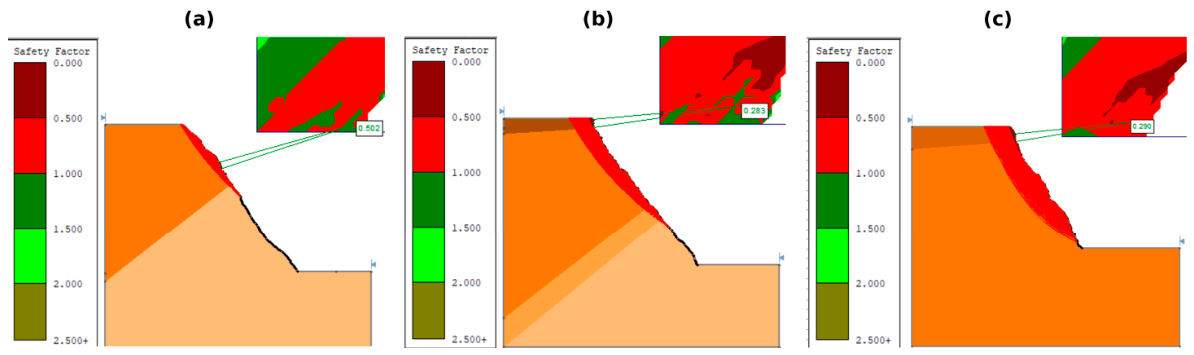
Figure 8.
Re-profiled slope models and their factors of safety: (a) Slope 1 at 50°, (b) Slope 2 at 44°, and (c) Slope 3 at 36°.
Figure 8.
Re-profiled slope models and their factors of safety: (a) Slope 1 at 50°, (b) Slope 2 at 44°, and (c) Slope 3 at 36°.
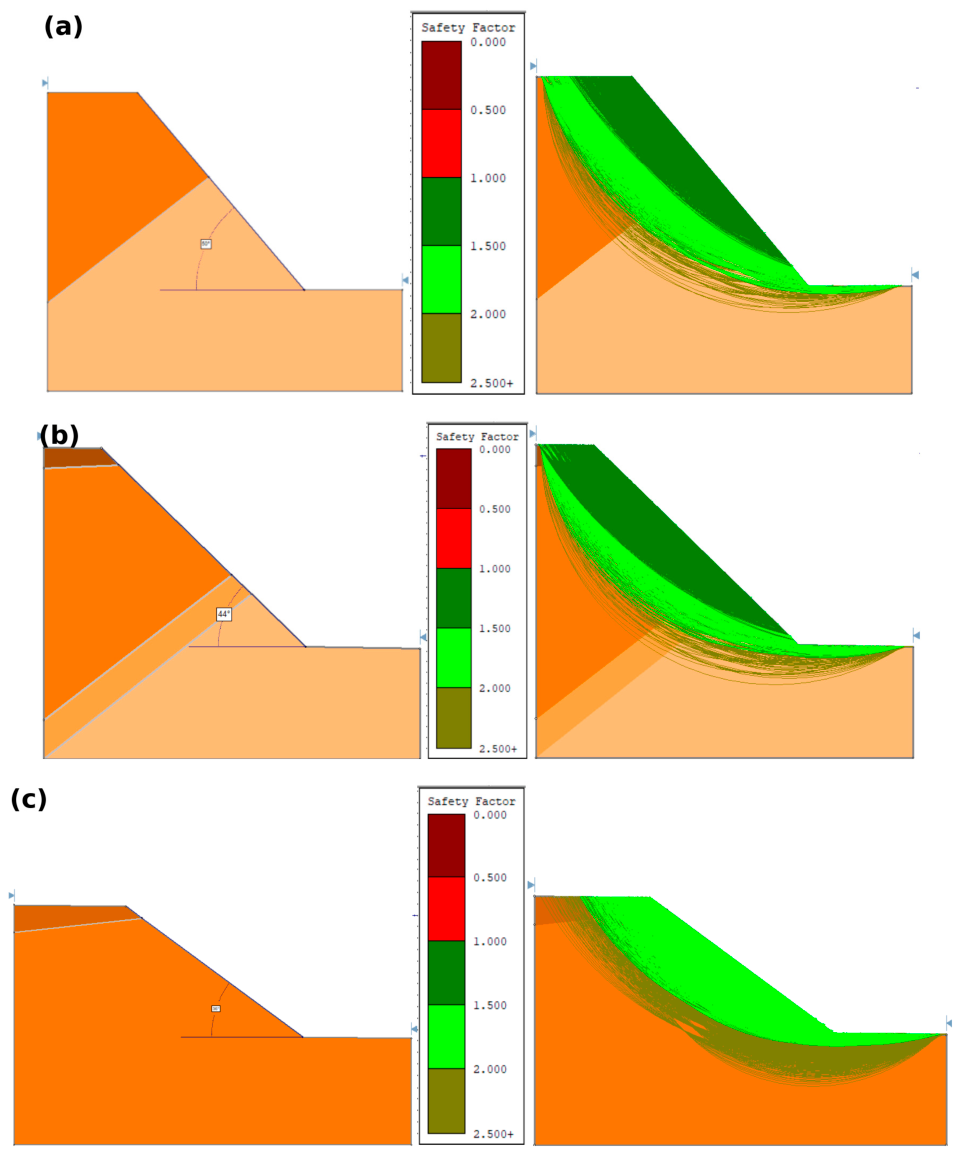

Table 1.
Geometry and weathering grades of the slope sectors.
| Slope | Length (m) | Height (m) | Dip/Dip Direction | Weathering Grades |
| Slope 1 | 60 | 70–80 | 57°/056° | I, III |
| Slope 2 | 45 | 60–70 | 55°/046° | I–IV |
| Slope 3 | 45 | 50–60 | 59°/040° | III, IV |
Table 2.
Results of Schmidt hammer and uniaxial compressive strength tests.
| Weathering Grade | Schmidt Rebound | Schmidt-Derived Strength (MPa) | Laboratory UCS (MPa) | Density (g/cm3) |
| I | 45.5 | 140 | 139.5 | 2.74 |
| II | 38.1 | 98 | 99.34 | 2.76 |
| III | 30.6 | 72 | 79.97 | 2.71 |
| IV | 20 | 42 | – | – |
Table 3.
Rock Mass Rating (RMR).
| Name | Rock Strength (JA1) | RQD % (JA2) | Spacing (JA3) | Discontinuity Condition (JA4) | Water (JA5) | RMR Value | Class | Cohesion (MPa) | Friction Angle (°) | Bearing Pressure (t/m2) | Safe Slope Angle (°) |
| Slope 1 | 139.5 MPa | 93.84% | 25 cm | Slightly rough surfaces, separation 1–5 mm, continuous | Dry | 72 | good | 0.3–0.4 | 35–45 | 280–440 | 65 |
| Rating | 12 | 20 | 10 | 15 | 15 | 72 | II | ||||
| Slope 2 | 99.34 MPa | 86.98% | 16 cm | Slightly rough surfaces, separation 1–5 mm, continuous | Damp | 60 | fair | 0.2–0.3 | 25–35 | 135–280 | 55 |
| Rating | 7 | 17 | 8 | 15 | 13 | 60 | III | ||||
| Slope 3 | 79.97 MPa | 73.56% | 10 cm | Smooth surfaces, separation > 5 mm, continuous | Damp | 42 | fair | 0.2–0.3 | 25–35 | 135–280 | 55 |
| Rating | 7 | 13 | 8 | 5 | 9 | 42 | III |
Table 4.
Slope Mass Rating (SMR).
| Name | Dip/DD | Failure Type | Failure (Dip/DD) | F1 |αj − αs| | F2 |βj| | F3 βj − βs | F4 | SMR | Class | Quality | Stability | Failure Probability |
| Slope 1 | 57°/056° | Wedge | 49°/098° | 42 | 49 | −8 | Mechanical Excavation | 60 | III | normal | partially stable | 0.4 |
| Value | 0.23 | 0.94 | −57.62 | 0 | 60 | III | ||||||
| Planar | 54°/068° | 12 | 54 | −3 | Mechanical Excavation | 31 | IV | bad | unstable | 0.6 | ||
| Value | 0.80 | 0.96 | −53.86 | 0 | 31 | IV | ||||||
| Wedge | 52°/053° | 3 | 52 | −5 | Mechanical Excavation | 20 | V | very bad | completely unstable | 0.9 | ||
| Value | 0.97 | 0.95 | −56.23 | 0 | 20 | V | ||||||
| Slope 2 | 55°/046° | Wedge | 28°/099° | 53 | 28 | −27 | Mechanical Excavation | 54 | III | normal | partially stable | 0.4 |
| Value | 0.19 | 0.49 | −59.29 | 0 | 54 | III | ||||||
| Wedge | 51°/080° | 34 | 51 | −4 | Mechanical Excavation | 45 | III | normal | partially stable | 0.4 | ||
| Value | 0.28 | 0.95 | −55.32 | 0 | 45 | III | ||||||
| Planar | 51°/072° | 26 | 51 | −4 | Mechanical Excavation | 40 | IV | bad | unstable | 0.6 | ||
| Value | 0.39 | 0.95 | −55.32 | 0 | 40 | IV | ||||||
| Wedge | 40°/024° | 22 | 40 | −15 | Mechanical Excavation | 35 | IV | bad | unstable | 0.6 | ||
| Value | 0.48 | 0.88 | −58.73 | 0 | 35 | IV | ||||||
| Slope 3 | 59°/040° | Planar | 57°/061° | 21 | 57 | −2 | Mechanical Excavation | 17 | V | very bad | completely unstable | 0.9 |
| Value | 0.51 | 0.96 | −51.14 | 0 | 17 | V | ||||||
| Wedge | 49°/018° | 22 | 49 | −10 | Mechanical Excavation | 16 | V | very bad | completely unstable | 0.9 | ||
| Value | 0.48 | 0.94 | −58.10 | 0 | 16 | V |
Table 5.
Q-slope.
| Name | RQD % | Jn | Jr | Ja | O | Jwice | SRFa | SRFb | SRFc | Q-slope | Critical Angle (°) |
| Slope 1 | 93 | 12 | 1.5 | 1 | 0.5 | 0.3 | 10 | - | - | 0.174 | 50 |
| Slope 2 | 80 | 15 | 1.5 | 2 | 0.75 | 0.3 | 10 | - | - | 0.09 | 44 |
| Slope 3 | 66 | 15 | 1.5 | 3 | 0.75 | 0.3 | 15 | - | - | 0.033 | 35 |
Table 6.
Material parameters used in the overall-slope limit-equilibrium models.
| Weathering Grade | Unit Weight (kN/m3) | JRC | JCS (MPa) | φr (°) |
| I | 27.4 | 10 | 139.50 | 30 |
| II | 27.6 | 8 | 99.34 | 30 |
| III | 27.1 | 6 | 79.97 | 30 |
| IV | 26.5 | 4 | 60.01 | 30 |
Table 7.
Summary of SMR and limit-equilibrium results.
| Slope | Failure Type | Set | Orientation | SMR (Class) | Block-Scale FoS | Overall FoS | Minimum Local FoS (Elevation) |
| Slope 1 | Wedge | J1 × J2 | 49°/098° | 60 (III) | 0.91 | 1.695 | 0.502 (40–77 m) |
| Planar | J1 | 54°/068° | 31 (IV) | 0.80 | |||
| Wedge | J1 × J3 | 52°/053° | 20 (V) | 0.92 | |||
| Slope 2 | Wedge | J5 × F1 | 28°/099° | 54 (III) | 3.12 | 1.578 | 0.283 (19–72 m) |
| Wedge | J1 × J6 | 51°/080° | 45 (III) | 0.96 | |||
| Planar | J1 | 51°/072° | 40 (IV) | 0.76 | |||
| Wedge | J1 × J2 | 40°/024° | 35 (IV) | 1.20 | |||
| Slope 3 | Planar | J2 | 57°/061° | 17 (V) | 0.56 | 1.234 | 0.290 (5–50 m) |
| Wedge | J1 × J2 | 49°/018° | 16 (V) | 4.45 |
Disclaimer/Publisher’s Note: The statements, opinions and data contained in all publications are solely those of the individual author(s) and contributor(s) and not of MDPI and/or the editor(s). MDPI and/or the editor(s) disclaim responsibility for any injury to people or property resulting from any ideas, methods, instructions or products referred to in the content. |
© 2026 by the authors. Licensee MDPI, Basel, Switzerland. This article is an open access article distributed under the terms and conditions of the Creative Commons Attribution (CC BY) license (http://creativecommons.org/licenses/by/4.0/).
Copyright: This open access article is published under a Creative Commons CC BY 4.0 license, which permit the free download, distribution, and reuse, provided that the author and preprint are cited in any reuse.