

Submitted:
12 November 2026
Posted:
16 November 2026
You are already at the latest version
Abstract
Cervical cancer progresses from persistent high-risk human papillomavirus (HPV) infection through low-grade (LSIL) and high-grade (HSIL) squamous intraepithelial lesions to invasive squamous cell carcinoma (SCC), yet current triage tools—cytology, HPV genotyping, and colposcopy—cannot reliably distinguish lesions that need surgical intervention from those that regress. Cervicovaginal fluid (CVF) directly contacts the cervical transformation zone and is an attractive, non-invasively collected substrate for biomarker discovery. Comprehensive label-free proteomic profiling (HPLC-DDA-PASEF-MS/MS) of CVF was performed in 93 women spanning the full histological spectrum of HPV-associated cervical disease: HPV-negative controls (NILM, n = 18), HPV-positive inflammatory disease of the cervix (IDC, n = 17), LSIL (n = 20), HSIL (n = 20), and SCC (n = 18). Of 1,476 proteins detected (1,219 quantified), 106 CVF proteins met strict criteria (≥3 unique peptides) and differed significantly in at least one pairwise comparison (IDC, LSIL, HSIL, SCC vs. NILM). The CVF proteome underwent progressive remodeling with disease severity, with the number of differentially expressed proteins (DEPs, |FC| > 2, p < 0.05) rising from 13 in IDC and 6 in LSIL to 43 in HSIL and 100 in SCC relative to NILM. The most robust discrimination between disease requiring intervention (HSIL and SCC) and conditions suited to surveillance (NILM, IDC, and LSIL) was driven not by epithelial proteins but by a coordinated plasma protein signature—CPN2, ORM2, AGT, KNG1, F2, ITIH1, GC, APOA1, SERPINA1, and C4A—all among the top 5% most abundant plasma proteins, reflecting epithelial barrier disruption, acute-phase response, and hemostatic activation. Pathway analysis converged on platelet activation and degranulation, complement and coagulation cascades, neutrophil degranulation, IGF transport and uptake, and keratinization across comparisons. TRIM29 (R = −0.63) and AHNAK2 (R = −0.61) showed the strongest negative correlations with lesion grade, whereas IGHM (R = 0.55), AGT (R = 0.53), and ITIH1 (R = 0.53) increased with grade. A subset of proteins, including ACTN4, PSMA3, ACP1, EIF5AL1, IGFBP2, KNG1, EIF5A, and ORM2, overlapped between inflammatory and neoplastic processes, indicating that HPV-driven inflammation alone can partially mimic a neoplastic CVF signature. These data position CVF proteomics as a promising non-invasive approach for triaging HPV-associated cervical pathology and suggest that a multi-protein panel centered on the APOA1/ORM2/KNG1/SERPINA1 axis, combined with grade-associated epithelial proteins such as TRIM29 and AHNAK2, warrants validation in independent, well-characterized cohorts.
Keywords:
cervicovaginal fluid
; cervical cancer
; HPV
; proteomics
; label-free quantification
; mass spectrometry
; HSIL
; squamous cell carcinoma
; biomarkers
; epithelial barrier
1. Introduction
Cervical cancer remains one of the most common malignancies among women worldwide, with approximately 604,000 new cases and 280,000 deaths estimated in 2024 [1,2]. The vast majority of cases are attributable to persistent infection with high-risk human papillomavirus (HPV) types, and progression from infection to invasive carcinoma typically spans 15–20 years [2]. Despite the availability of prophylactic HPV vaccines and organized screening programs, cervical cancer continues to pose a substantial public health burden, particularly in low- and middle-income countries where vaccination coverage and screening infrastructure remain inadequate [2,3]. The clinical management of HPV-associated cervical pathology therefore continues to rely heavily on cytology, HPV genotyping, colposcopy, and histological confirmation via biopsy [4].
Cervical neoplasia progresses along a continuum from transient HPV infection through LSIL and HSIL to invasive SCC. The key clinical challenge is distinguishing lesions likely to regress—most LSIL and reactive inflammatory changes—from those warranting surgery, namely HSIL and SCC. Current triage tools, including HPV16/18 genotyping and p16/Ki-67 dual staining, improve stratification but do not fully resolve this ambiguity [5,6,7,8,9,10]. Cytology has high specificity (86–100%) but suffers from inter-observer variability and sensitivity of only ~30–87% [5], with cyto-histological discordance in roughly one-quarter of cases [6]. The conventional pathway—cytology with histological confirmation—is invasive, labor-intensive, and time-delayed, and may miss altered areas [7]. Colposcopy is operator-dependent and offers no molecular insight [8]. HPV DNA testing has ~90% sensitivity for HSIL and SCC but low specificity due to transient infections, yielding false positives and unnecessary clinical interventions [9,10]. Consequently, there is a persistent need for complementary, non-invasive biomarkers that reflect the molecular alterations occurring in the cervical microenvironment as neoplasia progresses.
Cervicovaginal fluid (CVF) has emerged as an attractive substrate for such biomarker discovery. CVF is a complex biological fluid comprising cervical mucus, vaginal wall transudate, exfoliated cells, secretions from the endometrium and oviducts, and metabolic by-products of the vaginal microflora [11]. It contains approximately 92–95% water and 5–8% ions, soluble macromolecules, and proteins, including DNA, RNA, metabolites, and substantial quantities of glycoproteins, proteoglycans, and lipids [12]. CVF composition is influenced not only by pathological conditions such as bacterial, fungal, or viral infections and cancer but also by the menstrual cycle, hormonal imbalance, menopause, fertility status, sexual intercourse, pregnancy, and smoking [12]. CVF is a proximal fluid that directly contacts the cervical transformation zone, where carcinogenesis initiates, and thus carries the highest concentration of cervical cancer-related biomarkers [13]. Unlike serum, urine, or cytological specimens—which are not specific to the transformation area and may reflect other physiological conditions—the protein composition of CVF provides insight into the biochemical pathways involved in pathological alterations of the cervicovaginal microenvironment [12]. CVF can be collected non-invasively during routine gynecological examination, and self-sampling devices have been developed for HPV testing [14], enabling repeated sampling and population-level screening.
Proteomic analyses of CVF have already identified candidate markers in cervical neoplasia [15], as well as in other gynecological conditions such as endometriosis and endometrial cancer [16]. More than a thousand distinct proteins have been identified in CVF, some associated with vaginal dysbiosis, amniotic inflammation, preterm labor, preeclampsia, ovarian and endometrial cancer, HIV infection, HPV infection, and cervical cancer [12]. Among the most consistently reported candidate biomarkers are alpha-actinin-4 (ACTN4), vitronectin (VTN), annexin A1 (ANXA1), annexin A2 (ANXA2), adenylyl cyclase-associated protein 1 (CAP1), mucin-5B (MUC5B), and pyruvate kinase M2 (PKM2) [15,17,18]. Gutierrez et al. identified candidate biomarkers for CIN2+ from dried self-sampled CVF using LC-MS/MS and proposed a seven-protein multivariate model with 90% sensitivity and 55% specificity [19]. A meta-analysis of CVF proteomic studies has highlighted enrichment of immune response, glycolytic processes, regulation of cell death, actin filament organization, platelet and neutrophil degranulation, and complement and coagulation cascades, with fibrinogen, complement, actin-related, and glycolysis clusters emerging as recurrent network modules [20]. Nevertheless, only ACTN4 and ANXA2 have been reproduced as significant across more than one study, underscoring the need for validation in larger, well-characterized cohorts [15].
To date, however, proteomic studies of CVF in cervical neoplasia have been limited in scope. Most have compared two opposites—SCC and negative for intraepithelial lesion or malignancy (NILM)—without resolving the full spectrum of HPV-associated pathology from inflammation through low-grade and high-grade lesions to invasive cancer [15]. Furthermore, few have combined rigorous label-free quantification (LFQ) with pathway-level analysis to elucidate the biological processes driving proteome remodeling during cervical carcinogenesis. High-resolution mass spectrometry platforms such as timsTOF Pro with data-dependent acquisition offer improved depth and reproducibility, enabling identification of low-abundance proteins that may serve as early indicators of malignant transformation [12].
In this study, we performed comprehensive proteomic profiling of CVF from 93 women representing the full histological spectrum of HPV-associated cervical disease: HPV-negative controls (NILM), HPV-positive inflammatory disease of the cervix (IDC), LSIL, HSIL, and SCC. Using LFQ and pathway enrichment analysis, we aimed to (i) characterize the proteomic changes accompanying progression from benign inflammation to low-grade and high-grade neoplasia and invasive cancer; (ii) evaluate the utility of CVF proteins as candidate biomarkers for differentiating clinically actionable disease (HSIL and SCC) from conditions requiring only surveillance (NILM, IDC, and LSIL). We hypothesized that the CVF proteome would reflect the escalating disruption of epithelial barrier function, immune activation, and hemostatic dysregulation that characterize progressive cervical neoplasia, and that specific proteins within this fluid could serve as non-invasive indicators of disease severity.
2. Materials and Methods
2.1. Study Design
CVF specimens were obtained from 93 women aged 19–49 years (mean 33.7 ± 7.8 years) between days 4 and 11 of the menstrual cycle. Participants represented a spectrum of HPV-associated cervical pathology: low-grade squamous intraepithelial lesions (LSIL, n = 20), high-grade squamous intraepithelial lesions (HSIL, n = 20), squamous cell cervical cancer (SCC, n = 18), inflammatory disease of the cervix (IDC, n = 17), and HPV-negative controls (NILM, n = 18). All women were recruited from the outpatient scientific department of the V.I. Kulakov National Medical Research Center for Obstetrics, Gynecology, and Perinatology (Moscow, Russia) between January and September 2025.
Inclusion required reproductive age (20–49 years), regular menstrual cycles, a histologically confirmed diagnosis of NILM, LSIL (CIN I), HSIL (CIN II/III), or SCC with concurrent high-risk HPV, and willingness to comply with the study protocol. Exclusion criteria were pregnancy, lactation, hormone therapy, acute inflammation, decompensated renal, hepatic, or pulmonary disease, or psychoneurological disorders.
The clinical workup comprised collection of clinical and anamnestic data, assessment of gynecological status, HPV genotyping, cytological evaluation using the Bethesda System 19, and extended colposcopy. Broad-spectrum genotyping covering 21 HPV types was carried out with a real-time PCR assay (DNK-Technologia, Moscow, Russia). Extended colposcopy was performed with a Leisegang colposcope (Leisegang, Berlin, Germany) according to the 2017 IFCPC terminology (Rio de Janeiro, 2017) [21]. On the basis of genotyping and colposcopic findings, patients were referred for biopsy.
Cervical biopsy specimens were classified as mild dysplasia (CIN1), moderate dysplasia (CIN2), severe dysplasia (CIN3), or cervical cancer. Histological grading followed the Lower Anogenital Squamous Terminology (LAST) system (2012), where CIN1 corresponds to LSIL, and CIN2/CIN3 correspond to HSIL [22]. Based on biopsy results, five groups were formed: NILM (n=18), IDC (n=17), LSIL (n=20), HSIL (n=20) and SCC (n=18).
2.2. Sample Collection
Sampling was performed during the follicular phase (days 1–11) of the menstrual cycle. CVF was collected by aspirating the vagina and cervix with 5 mL of 0.9% sodium chloride. All specimens were obtained at the start of colposcopy, before any other diagnostic procedure (Pap test, biopsy, etc.), to minimize blood contamination. Samples were centrifuged at 2000 g for 10 min at 4 °C to pellet cellular debris, and supernatants were kept at −80 °C. Written informed consent was obtained from every participant. The study was approved by the Ethics Committee of the V.I. Kulakov National Medical Research Center for Obstetrics, Gynecology, and Perinatology (Protocol No. 1, 30 January 2025). All procedures complied with the Declaration of Helsinki and Good Clinical Practice (GCP) guidelines.
2.3. Preparation for Proteomic Analysis
After rapid, single thawing of CVF, protein concentration was measured by the Bradford method. Proteins were precipitated with ice-cold acetone. After centrifugation at 16,000g, the pellets were dissolved in 6 M urea. Sulfhydryl groups were reduced with 10 mM dithiothreitol (30 min at 37 °C), and alkylation was achieved with 25 mM iodoacetamide (in the dark for 30 min at 25 °C). Samples were diluted to a urea concentration of 0.5 M. Proteins were digested with trypsin (1:50 enzyme-to-protein ratio, 18 h at 37 °C with shaking at 350 rpm), acidified with 0.1% (vol/vol) formic acid, according to a previously developed protocol [18]. The resulting peptides were purified by solid-phase extraction, lyophilized, and reconstituted in 0.1% formic acid for mass spectrometry.
2.4. Liquid Chromatography–Tandem Mass Spectrometry (LC–MS/MS)
Tryptic peptide fractions were examined in three technical replicates on a Dionex Ultimate 3000 nanoLC system (Thermo Fisher Scientific, Waltham, MA, USA) interfaced with a timsTOF Pro mass spectrometer (Bruker Daltonics, Billerica, MA, USA) [23]. Separation was achieved on a fixed-spray C18 capillary column (25 cm length, 75 μm inner diameter, 1.6 μm particle size; Ion Optics, Melbourne, VIC, Australia) at 400 nL/min. A 40 min linear gradient from 2% to 37% solvent B (0.1% formic acid in acetonitrile) was used, followed by a 12 min wash with 90% solvent B and a 15 min re-equilibration with 2% solvent B. Mobile phases were solvent A (0.1% formic acid in HPLC-grade water) and solvent B (0.1% formic acid in acetonitrile). Spectra were acquired in DDA-PASEF mode with electrospray ionization (capillary voltage 1500 V, dry gas flow 3.0 L/min, source temperature 180 °C). MS and MS/MS spectra were recorded over an m/z range of 100–1700 and an ion mobility range of 0.6–1.6 1/K0 (V·s/cm²). Collision energy rose linearly from 20 eV at 1/K0 = 0.6 V·s/cm² to 59 eV at 1/K0 = 1.6 V·s/cm², with a rise time of 100 ms.
2.5. Protein Identification
LC-MS/MS data were analyzed with PEAKS Studio version 11 (BSI, Mississauga, ON, Canada). Mass tolerance was set to 20 ppm for tryptic peptides and 0.05 Da for fragments. Searches were run against the UniProtKB Homo sapiens database with trypsin as the enzyme. Carbamidomethylation of cysteine was specified as a fixed modification and methionine oxidation as a variable modification. The false discovery rate (FDR) was 0.1% for peptide-spectrum matches (PSMs) and 1% for protein groups. A protein was considered identified when at least two unique peptides were detected. Label-free quantification (LFQ) was performed using PEAKS Q workflow with build in total ion current (TIC) normalization, and automatic retention time alignment between LC-MS runs.
2.6. Statistical Analysis
Clinical parameters across the five groups (NILM, IDC, LSIL, HSIL, SCC) were compared using the Kruskal–Wallis test for continuous variables and Pearson's chi-square test for categorical variables. When the initial p-value was below 0.05, post hoc comparisons were carried out with Dunn's test and pairwise chi-square tests applying Bonferroni correction.
Protein profile analysis was based on proteins identified by at least two unique peptides with FDR < 0.01 and detection in at least half of the CVF samples. For the full protein profile, gene expression analysis was conducted against the Reactome database using the Reactome FI utility [24] in Cytoscape 3.10 [25]; protein connectivity was assessed with the Pearson coefficient, and functional groups were defined by the Markov Cluster Algorithm [26] with an inflation coefficient of 5.
Quantitative analysis applied more strict criteria: at least three unique peptides (FDR < 0.01) per protein and detection in at least half of the samples. Quantification used the intensity-based absolute quantification (iBAQ) approach.
For four comparison pairs of the control group (NILM) with lesion groups (IDC, LSIL, HSIL, SCC), and for the comparison of high-grade neoplastic lesions/cancer (HSIL+SCC) against low-grade/inflammation/normal (LSIL+IDC+NILM), protein levels were compared using the Mann–Whitney test, median ratio calculation (median protein level in the more severe lesion relative to the milder lesion or NILM within the pair), and adjusted p-values obtained with the Benjamini–Hochberg correction. Proteins were classified as differentially expressed (DEPs) when the median ratio was greater than 2 or less than 0.5 and the non-adjusted p-value was < 0.05. Using the calculated median ratios, gene set enrichment analysis [27] was performed against the Reactome database [28]. Proteins showing a statistically significant association with the grade of neoplastic lesion (NILM→LSIL→HSIL→SCC) were identified by Spearman's test.
For proteins classified as DEPs, protein–protein interaction analysis was performed via the STRING resource [29], followed by network visualization in Cytoscape 3.10 [25] and identification of the top 20% of hub proteins among all DEPs. Hub proteins were defined as the intersection of the 20% most important nodes according to Maximal Clique Centrality and Degree methods from Cytohubba plagin [30]. Over-representation analysis (ORA) was also carried out against the Reactome database using the hypergeometric test. For pathways found statistically significant by GSEA and ORA, gene–concept networks were constructed to show links between the DEPs included in the pathways and the pathways themselves. In addition, for pathways identified by ORA, enrichment maps were built to capture pathway similarity based on the degree of overlap of DEP sets, assessed with the Jaccard measure. Clusters were defined by k-means, with k set as the square root of the number of pathways. Statistical and bioinformatic processing was performed with R 4.5.3 [31] scripts using the packages VennDiagram 1.8.2 [32], ClusterProfiler 4.18.4 [33], ReactomePA 1.54.0 [34], dunn.test 1.3.7 [35], jgsbook 1.0.8 [35], and reshape2 1.4.8 [36], visualization additionally used ggplot2 4.0.2 [37], enrichplot 1.32.0 [38], forcats 1.0.1 [39], and ggrepel 0.9.8 [40].
3. Results
3.1. Clinical Parameters
The study groups did not differ significantly in day of the menstrual cycle at CVF collection (p = 0.16), number of pregnancies (p = 0.29), vaccination status (p = 0.41), history of STIs (p = 0.24), or smoking (p = 0.47). However, patients with SCC were significantly older (41 [38.25; 43] years) than those in the HSIL (34 [28.5; 38.25], p = 0.004), LSIL (32 [26.25; 36.25], p = 0.002), IDC (31 [25; 36], p = 0.002), and NILM (26 [26; 37.5], p < 0.001) groups. Age at sexual debut differed between the NILM and SCC groups (20 [18; 21.75] vs. 18 [17; 19] years, p = 0.04), and the number of sexual partners was lower in NILM (1 [1; 2]) than in IDC (3 [2; 5], p = 0.01), HSIL (3 [2; 4], p = 0.001), and SCC (4 [2; 5], p < 0.001) (Figure S1). HPV16 was more frequent in HSIL (75%) and SCC (89%) (p < 0.001), whereas HPV53 was more frequent in LSIL (35%) (p < 0.001) (Table S1).
3.2. Protein Profiling
Across all samples, 1,476 proteins were detected in all groups and 1,219 were quantified (FDR < 0.01, at least two unique peptides per protein), spanning a dynamic range of 4.3 orders of magnitude (ALB highest; GAR1 lowest) (Figure S2, Table S2). NILM samples contained the fewest proteins (940 ± 149), followed by IDC (974 ± 120), LSIL (1,015 ± 123), and HSIL (1,045 ± 234). SCC samples showed the highest variability (1,027 ± 292) and the largest number of unique proteins (118). Among the 1,219 quantified proteins, 87 formed seven functional clusters: translation and RNA-related processes, lipid metabolism, complement activation, coagulation/fibrinolysis, keratinization, and circadian rhythms (Figure 1).
3.3. Differential Expression in Inflammation and Low-Grade Lesions (IDC and LSIL vs. NILM)
Applying strict LFQ criteria (three unique peptides per protein), 106 CVF proteins with statistically significant differences (p < 0.05) in at least one pairwise comparison (IDC, LSIL, HSIL, SCC vs. NILM) were reliably label-free quantified. In CVF from patients with chronic inflammation associated with HPV (IDC), 13 proteins were DEPs relative to the NILM group (8 up-regulated, 5 down-regulated) (Figure S(a), Table S3). Hub proteins included keratin, type II cytoskeletal 1 (KRT1, FC = 0.26, p = 0.046), kininogen-1 (KNG1, FC = 2.03, p = 0.02), and eukaryotic translation initiation factor 6 (EIF6, FC = 2.31, p = 0.04) (Figure S3(b)). ORA revealed two significant Reactome pathways (FDR < 0.05), with KNG1 involved in Response to elevated platelet cytosolic Ca²⁺. GSEA highlighted Keratinization and Formation of the cornified envelope (FDR < 0.05), driven by KRT1 and keratin, type II cytoskeletal 2 epidermal (KRT2, FC = 0.42, p = 0.02), as well as Metabolism of proteins and Post-translational protein modification, driven by eukaryotic translation initiation factor 5A-1 (FC = 3.88, p = 0.03), eukaryotic translation initiation factor 5A-2 (EIF5A2, FC = 1.68, p = 0.01), complement C4A (C4A, FC = 1.89, p = 0.002), complement C4B (C4B, FC = 1.65, p = 0.04), and KNG1. Three proteins, including Insulin-like growth factor-binding protein 2 (IGFBP2, FC = 2.47, p = 0.02), over-represented Insulin-like Growth Factor (IGF) transport and uptake by Insulin-like Growth Factor Binding Proteins (IGFBPs) (Figure S3(c,d)).
In the LSIL vs. NILM comparison, DEPs included six proteins (3 up, 3 down) (Figure S4a, Table S4): Serum amyloid A-4 protein (SAA4, FC = 3.14, p = 0.03), Interleukin-1 receptor antagonist protein (IL1RN, FC = 2.02, p=0.02), Phosphatidylethanolamine-binding protein 1 (PEPB1, FC = 2.25, p = 0.003), Actin-related protein 2 (ACRT2, FC = 0.23, p = 0.02), Kallikrein-8 (KLK8, FC = 0.42, p = 0.02) and KRT2 (FC = 0.42, p = 0.02)). Formation of the cornified envelope (FDR < 0.05) was the only over-represented ORA gene–concept network, and it included KLK8 and KRT2 (Figure S4(b)).
3.4. Differential Expression in High-Grade and Cancer Lesions (HSIL/SCC vs. NILM) and Neoplasm Markers
Proteome changes in CVF became more pronounced as the severity of cervical neoplasia increased. The marked proteome alteration in HSIL and SCC was partly attributable to the appearance of numerous plasma proteins, consistent with blood plasma contamination of CVF in severe neoplasia and the associated impairment of the epithelial barrier.
In HSIL vs. NILM, fourty-three proteins were selected as DEPs (25 up, 18 down) (Figure S5(a)), Table S5). Hub proteins included SAA4 (FC = 3.12, p = 0.01), Complement C3 (C3, FC = 3.32, p = 0.008), Alpha-1-antitrypsin (SERPINA1, FC = 3.09, p = 0.004), KNG1 (FC = 2.83, p = 0.002), Alpha-1-acid glycoprotein 2 (ORM2, FC = 2.79, p = 0.003), Apolipoprotein A-I (APOA1, FC = 4.56, p = 0.001), Haptoglobin-related protein (HPR, FC = 2.23, p = 0.004), and Hemopexin (HPX, FC = 2.68, p = 0.02) (Figure S5(b), Table S4). Ten ORA pathways (FDR < 0.05) involved Response to elevated platelet cytosolic Ca2+ (Alpha-actinin-4 (ACTN4), Protein FAM49B (CYRIB), APOA1, SERPINA1, KNG1, ORM2), Platelet degranulation (ACTN4, CYRIB, APOA1, SERPINA1, KNG1, ORM2), Platelet activation, signaling and aggregation (ACTN4, CYRIB, APOA1, SERPINA1, KNG1, ORM2, Mitogen-activated protein kinase 1 (MAPK1)), Post−translational protein phosphorylation (APOA1, SERPINA1, C3, KNG1), Regulation of Insulin−like Growth Factor (IGF) transport and uptake by Insulin−like Growth Factor Binding Proteins (IGFBPs) (Insulin-like growth factor-binding protein 2 (IGFBP2) , APOA1, SERPINA1, C3, KNG1), Neutrophil degranulation (Granulins (GRN), Phosphoglycerate mutase 1 (PGAM1), KRT1, Actin-related protein 2 (ACTR2), ATP-dependent 6-phosphofructokinase, liver type (PFKL), SERPINA1, C3, ORM2, MAPK1), Scavenging of heme from plasma (HPX, HPR, APOA1), and Binding and Uptake of Ligands by Scavenger Receptors (APOA1, HPR, HPX) (Figure S5(c)). These ORA pathways clustered in three groups: keratinization, formation of the cornified envelope, platelet/neutrophil activation/degranulation (Figure S5(d)).
In cancer transformation, the number of DEPs increases to 100 proteins (55 up-regulated, 45 down-regulated) (Figure S6(a), Table S6). Nineteen hub proteins were identified: Alpha-1B-glycoprotein (A1BG, FC =2.82, p < 0.001), Protein AMBP (AMBP, FC = 2.96, p = 0.001), KNG1 (FC = 7.98, p < 0.001), Haptoglobin (HP, FC = 4.98, p < 0.001), Vitamin D-binding protein (GC, FC = 4.11, p < 0.001), Fibronectin (FN1, FC = 3.79, p < 0.001), Histidine-rich glycoprotein (HRG, FC = 4.13, p < 0.001), ORM2 (FC = 9.38, p <0.001), Complement factor B (CFB, FC = 4.73, p < 0.001), Alpha-2-macroglobulin (A2M, FC = 5.16, p <0.001), Fibrinogen gamma chain (FGG, FC = 2.80, p < 0.001), Alpha-1-acid glycoprotein 1 (ORM1, FC = 2.87, p < 0.001), APOA1 (FC = 20.02, p < 0.001), HPR (FC =5.97, p < 0.001), HPX (FC = 5.90, p < 0.001), C4A (FC = 3.85, p < 0.001), SERPINA1 (FC = 7.45, p < 0.001) (Figure S6(b,c)). Forty-six ORA pathways (FDR < 0.05) clustered into six groups, including neutrophil degranulation/cell recruitment; platelet degranulation/complement cascade/IGF transport and uptake; scavenger receptors/developmental cell lineages; keratinization; RAS/RAF/MAP2K/MAPK/BRAF activation; and oncogenic MAPK/RAF1 signaling (Figure S6(c–e)).
3.5. Differentiation of High-Grade Lesions and Malignancy-Associated Correlations
A key clinical challenge is distinguishing healthy tissue (NILM), chronic inflammation (IDC) and low-grade lesions (LSIL), which require follow-up monitoring, from high-grade lesions (HSIL) and cancer (SCC), which require surgical intervention. When NILM+IDC+LSIL were compared with HSIL+SCC, sixty-five proteins were chosen as DEPs (Figure 2(a), Table S6). Twelve hub proteins were identified: Prothrombin (F2, FC = 2.14, p < 0.001), FGG (FC= 2.56, p < 0.001), ORM2 (FC = 2.71, p < 0.001), HP (FC = 2.34, p < 0.001), HRG (FC= 2.21, p < 0.001), C4A (FC = 2.11, p < 0.001), APOA1 (FC = 4.25, p < 0.001), A2M (FC = 2.24, p = 0.001), KNG1 (FC = 2.48, p < 0.001), SERPINA1 (FC = 2.70, p < 0.001), HPX (FC = 2.74, p < 0.001), C3 (FC = 2.57, p < 0.001) (Figure 2(b), Figure S7(a)). Forty-five ORA pathways (FDR < 0.05) clustered into scavenger receptors/plasma lipoprotein remodeling; platelet degranulation/complement cascade/IGF transport and uptake; developmental cell lineages/keratinization; RAS/RAF/BRAF signaling; neutrophil degranulation, and platelet activation/post-translational protein phosphorylation (Figure 2(c,d), Figure S7(b)).
A total of 102 CVF proteins correlated with SIL grade (p < 0.01). Twenty-four showed direct (R > 0.5, p < 0.001) and 8 reverse (R < −0.5, p < 0.001) association: Tripartite motif-containing protein 29 (TRIM29, R = -0.63, p < 0.001), Protein AHNAK2 (AHNAK2, R = -0.61, p < 0.001) had the strongest negative correlations (Figure 3(a,b), Table 1, Table S8). Principal component analysis (PCA) based on malignancy marker proteins (|R| > 0.5, p < 0.05) showed that samples predominantly separated into two regions: NILM and milder cervical epithelial lesions (LSIL) versus more severe lesions (HSIL) and cancer (SCC) (Figure 3(c)). Network analysis identified 5 hub proteins with |R| > 0.5: GC, KNG1, F2, SERPINA1, and APOA1 (Figure S8). Malignancy marker CVF proteins were enriched in Platelet activation, signaling and aggregation, Neutrophil degranulation, Regulation of Insulin−like Growth Factor (IGF) transport and uptake by Insulin−like Growth Factor Binding Proteins (IGFBPs), Platelet degranulation, Response to elevated platelet cytosolic Ca2+, Post−translational protein phosphorylation, Regulation of Complement cascade, Complement cascade, Gamma carboxylation, hypusinylation, hydroxylation, and arylsulfatase activation (Figure 3(d)).
Keratin, type II cytoskeletal 2 epidermal (KRT2) was the only DEP common to all NILM comparisons (Figure 4, Table S9). Unique markers were identified only for SCC (47 proteins) (Table S8, Figure 4). Thirteen proteins were common markers of HSIL and SCC with high malignancy association (|R| > 0.5, p < 0.001): Immunoglobulin heavy constant mu (IGHM), Angiotensinogen (AGT), Granulins (GRN), Inter-alpha-trypsin inhibitor heavy chain H1 (ITIH1), PGAM1, APOA1, TRIM29, Aminopeptidase B (RNPEP), Eukaryotic translation initiation factor 5A-2 (EIF5A2), SERPINA1, Thioredoxin domain-containing protein 17 (TXNDC17), Peroxiredoxin-5, mitochondrial (PRDX5), MAPK1 (Figure 4, Table 1). In addition, eight proteins, although linked to malignant lesion development, are also markers of chronic inflammation (IDC): ACTN4 (FC = 2.14 для IDC), PSMA3 (FC = 3.88), Low molecular weight phosphotyrosine protein phosphatase (ACP1, FC = 0.49), Eukaryotic translation initiation factor 5A-1-like (EIF5AL1, FC = 2.41), IGFBP2 (FC = 2.47), KNG1 (FC = 2.03), EIF5A (FC=2.41), ORM2 (FC = 2.12) (Table S3).
4. Discussion
In this study, we performed comprehensive label-free proteomic profiling of CVF from 93 women spanning the full histological spectrum of HPV-associated cervical disease, from HPV-negative controls through inflammation, LSIL, and HSIL to invasive SCC. Three principal findings emerged. First, the CVF proteome underwent progressive remodeling with increasing disease severity: the number of differentially expressed proteins rose from 13 in IDC and 6 in LSIL to 43 in HSIL and 100 in SCC, relative to NILM. Second, the most robust discrimination between disease requiring intervention (HSIL and SCC) and conditions requiring surveillance (NILM, IDC, and LSIL) was driven not by epithelial proteins but by a coordinated plasma protein signature—CPN2, ORM2, AGT, KNG1, F2, ITIH1, GC, APOA1, SERPINA1, and C4A—all among the top 5% most abundant plasma proteins by concentration [41], reflecting epithelial barrier disruption, acute-phase response, and hemostatic activation [2,12]. Third, a subset of proteins, including ACTN4, PSMA3, ACP1, EIF5AL1, IGFBP2, KNG1, EIF5A, and ORM2, overlapped between inflammatory and neoplastic processes, underscoring the need to distinguish inflammation-driven from malignancy-specific alterations when developing CVF-based biomarkers [42]. Together, these data position CVF proteomics as a promising, non-invasive approach for triaging HPV-associated cervical pathology, while also highlighting important caveats regarding specificity and the influence of blood plasma contamination in severe lesions [12,43].
Comparison with the existing CVF biomarker literature highlights both consistencies and discrepancies. ACTN4 findings are consistent with prior work [17,18]. In the current study, ACTN4 increased significantly (p < 0.05) in SCC and HSIL relative to controls (FC = 2.5 and 3.3, respectively) and correlated directly with lesion grade (R = 0.52, p < 0.001). This agrees with Van Raemdonck et al. [17], who identified ACTN4 in CVF from women with precancerous lesions (HPLC-MALDI-TOF discovery, ELISA validation), and with our earlier study [18], in which ELISA showed significant ACTN4 increases in HSIL and cervical cancer versus controls; by label-free LC-MS/MS, however, significance was reached only for cancer [18]. KNG1 and ORM2 also changed significantly in study [6] in comparisons with both HSIL and SCC by LC-MS/MS.
The direction of AGT, APOA1, and SERPINA1 changes depends on the biological material studied. AGT and APOA1 increased significantly in HSIL and SCC versus controls and were positively associated with lesion grade. In contrast, Song Qing, 2017 [44] reported reduced (p < 0.05) AGT in cervical tissue in SCC, and APOA1 was reduced (p < 0.05) in cervical adenocarcinoma mucus [45]. SERPINA1 likewise increased in CVF in HSIL and SCC here and in our pilot study [6], but decreases in cervical adenocarcinoma mucus [45]. Notably, studies [44] and [45] used different biological material and included very small numbers of samples (n = 4 and n = 3, respectively).
The opposite direction of changes reported by Gutierrez et al. [19] is best explained by methodological differences. Here, ITIH1, AGT, APOA1, SERPINA1, and PRDX5 increased and TRIM29 decreased significantly in HSIL and SCC versus NILM; in Gutierrez et al. [19], the direction was the opposite. They identified candidate CIN2+ biomarkers from dried self-sampled CVF by LC-MS/MS and proposed a seven-protein model (90% sensitivity, 55% specificity) [19]. Their proteins—including cornified envelope and desmosomal components—differ substantially from the plasma signature reported here. This is likely because dried self-sampled CVF captures mainly epithelial and mucosal proteins, whereas lavage-based collection with centrifugation enriches soluble proteins, including transudated plasma components [10,19]. This divergence underscores the need to standardize collection and processing before CVF biomarkers can be compared across studies or translated into clinical assays [10,20]. Van Ostade et al. noted that CVF composition is influenced by the menstrual cycle, hormonal status, sexual intercourse, pregnancy, and smoking, and that attention to these variables is essential for reproducible discovery [12]. Our groups did not differ significantly in cycle day at collection, vaccination status, STI history, or smoking; however, residual confounding cannot be excluded [12].
In our earlier pilot study, we demonstrated that label-free CVF proteome profiling reflected the stage of cervical neoplastic transformation, with a model discriminating HSIL/cancer from NILM/LSIL achieving 77% sensitivity and 94% specificity (AUC 0.87) [18]. That study [18] used the same preanalytical protocol and similar HPLC-MS/MS analysis. Of the SCC DEPs identified here, 23 were significantly elevated and 11 reduced (p < 0.01) in study [18]; of the HSIL DEPs, six were elevated and one reduced (p < 0.01) in that study. No shared proteins were found for LSIL versus NILM (Table 2). Van Ostade et al. reviewed the CVF biomarker literature and concluded that proteins, particularly ACTN4, are the most suited for development of a simple assay for cervical precancer, while noting that accuracy could be improved by combining several proteins or integrating microbiome or metabolome data [12]. Our data support the combination approach: no single protein achieved both high sensitivity and specificity across the full disease spectrum, whereas a multi-protein panel—particularly one centered on the APOA1/ORM2/KNG1/SERPINA1 axis—may offer improved discrimination of HSIL and SCC from milder pathology [10,20].
The prominence of acute-phase and hemostatic proteins in our HSIL and SCC comparisons warrants careful interpretation. ORM2 and HPR have previously been identified as potential plasma biomarkers for the progression of cervical precancerous lesions to carcinoma, with differential expression in LSIL and HSIL relative to controls [42]. KNG1, the precursor of kinins involved in inflammation, vascular permeability, and tumor cell proliferation, has been implicated in cervical cancer pathology, with kinin receptor expression correlating with proliferative potential and inflammatory state in invasive carcinoma [46]. These findings align with our observation that KNG1 was elevated not only in HSIL (FC = 2.8) and SCC (FC = 8.0) but also, albeit modestly, in IDC (FC = 2.0), suggesting that KNG1 reflects a continuum of inflammatory and neoplastic processes rather than a malignancy-specific signal [9]. This interpretation is reinforced by the fact that eight proteins linked to malignant lesion development in our study were also markers of chronic inflammation (IDC); four of them (ACTN4, PSMA3, KNG1, and ORM2) have been proposed elsewhere as potential markers of cervical neoplasia [17,18,19]. The practical implication is that a CVF-based triage test must either exclude such inflammation-overlapping proteins or interpret their levels within a broader panel that captures malignancy-specific alterations [10,12].
Among the proteins showing the strongest association with SIL grade, TRIM29 (R = −0.63) and AHNAK2 (R = −0.61) exhibited the most pronounced negative correlations, meaning their CVF levels decreased with increasing disease severity. TRIM29 is a tripartite motif-containing protein involved in epithelial differentiation and innate immunity, and its downregulation in HSIL and SCC may reflect loss of differentiated epithelial cell populations as neoplastic cells expand [47]. AHNAK2, a large scaffolding protein implicated in cell migration and cytoskeletal organization, showed a similar pattern [48]. In contrast, IGHM (R = 0.55), AGT (R = 0.53), and ITIH1 (R = 0.53) increased with grade, consistent with the plasma transudation signature described above (present study) [2,12]. PCA based on malignancy-associated proteins (|R| > 0.5) demonstrated a clear separation of NILM and LSIL from HSIL and SCC along PC1, which accounted for 68% of the variance (present study). This separation is clinically meaningful because it corresponds to the threshold at which surgical intervention becomes indicated, and it suggests that a relatively small set of grade-correlated proteins may capture the biological transition from productive infection to transforming neoplasia [10,12].
Pathway-level analysis provided additional biological context. In HSIL and SCC comparisons, ORA and GSEA converged on platelet activation and degranulation, complement and coagulation cascades, neutrophil degranulation, IGF transport and uptake, and keratinization [13,20]. The recurrence of platelet and coagulation pathways across comparisons—from IDC (response to elevated platelet cytosolic Ca²⁺) through HSIL (platelet degranulation, common pathway of fibrin clot formation) to SCC (intrinsic pathway of fibrin clot formation)—suggests that hemostatic dysregulation is an early and sustained feature of cervical neoplasia [13,49]. This is consistent with the known association between cancer coagulopathy and tumor angiogenesis [49], and with the observation that the fibrinogen cluster (FGA, FGB, FGG) emerged as a recurrent network module in a meta-analysis of CVF proteomic studies [20]. The enrichment of IGF transport and uptake pathways, driven by IGFBP2 in IDC and by APOA1, SERPINA1, C3, and KNG1 in HSIL and SCC, is also notable given the role of IGF signaling in cervical carcinogenesis [50]. However, because these pathways were enriched across multiple disease categories—including inflammation—pathway-level changes should be attributed to malignancy specifically with caution [20].
The escalating complexity of the CVF proteome with neoplastic progression is consistent with the concept that carcinogenesis involves cumulative disruption of the cervical epithelial barrier, allowing plasma proteins to transude into the cervicovaginal space [2,12]. This interpretation is supported by the dominance of plasma-derived proteins among hub proteins in HSIL and SCC comparisons—APOA1 (FC = 20.2 in SCC vs. NILM), ORM2 (FC = 9.4), KNG1 (FC = 8.0), SERPINA1 (FC = 7.4), and HPX (FC = 5.9) (present study). However, IGHM, EIF5A2, EIF5AL1, EIF5A, and IGHA1 are not blood proteins, while SCEL and TRIM29 are only marginally represented in blood. Similar observations have been reported in prior CVF proteomic studies [9,10,18].
Several methodological considerations merit discussion. Collecting CVF at the start of colposcopy, before any other diagnostic procedure, minimized blood contamination; nevertheless, the marked proteome alteration in HSIL and SCC was partly attributable to the appearance of numerous plasma proteins, consistent with blood plasma contamination of CVF in severe neoplasia and the associated impairment of the epithelial barrier [2,12]. In addition, the main erythrocyte protein, hemoglobin (HBA and HBB), was detected in almost all samples and is not specific to the neoplastic process. This suggests that it is the disruption of the epithelial barrier with the entry of plasma proteins into the CVF that reflects the severity of HPV-associated transformation of the cervical epithelium, rather than the fragility and bleeding of the cervical epithelium and the associated possible bleeding during sample collection [12]. The inclusion of IDC as a separate group—rather than combining all non-neoplastic samples—was a strength of the study design, as it allowed identification of proteins that are elevated in inflammation but not specifically in neoplasia [10].
Several limitations should be acknowledged. The cross-sectional design precludes assessment of whether the identified proteins predict progression over time, as the groups represent distinct histological states rather than a longitudinal trajectory. Longitudinal validation in a screening cohort with defined endpoints—ideally including CIN2+ lesions that regress or progress—is required to establish predictive value. The modest group sizes (17–20 women) constrained statistical power and precluded stratified analyses by HPV type or age, and residual confounding by unmeasured factors (hormonal contraceptive use, vaginal microbiota, sexual activity, recent intercourse) cannot be excluded; the SCC group was also significantly older than all other groups, and age-related changes in CVF composition may have contributed to some differences. In addition, the strict quantification criteria (at least three unique peptides) limited analysis to 106 proteins, excluding lower-abundance candidates, and the use of a single analytical platform (timsTOF Pro) and search engine (PEAKS Studio) means the findings have not been cross-validated technically. Most importantly, the absence of an independent validation cohort is a significant limitation: the candidate markers reported here—particularly APOA1, ORM2, KNG1, and SERPINA1—require confirmation by targeted approaches (ELISA, multiple reaction monitoring) in a separate, well-characterized cohort before clinical utility can be claimed, and the overlap between inflammation and neoplasia signatures for several hub proteins further underscores this need.
The clinical implications of our findings should be considered in the context of current triage paradigms. The low positive predictive value of HPV DNA testing for CIN2+—below 10% despite a negative predictive value exceeding 99.5%—means that most HPV-positive women referred for colposcopy do not have clinically significant disease [9,10]. A CVF-based triage test that could reliably distinguish HSIL and SCC from LSIL and inflammation would therefore substantially reduce unnecessary colposcopies and biopsies [9,10,20]. Our data suggest that a panel combining blood plasma-derived proteins (APOA1, ORM2, KNG1, SERPINA1) with grade-associated epithelial or structural proteins (TRIM29, AHNAK2) might achieve this discrimination. However, the specificity of such a panel in the presence of inflammation remains a critical unresolved question: the overlap between IDC and HSIL signatures for several hub proteins indicates that inflammation alone can produce a CVF proteome that partially mimics neoplasia [10,20]. Future studies should include larger cohorts to define the specificity of candidate panels [2,10,20].
5. Conclusions
In this comprehensive label-free proteomic study of CVF from 93 women spanning the full histological spectrum of HPV-associated cervical disease, we show that the CVF proteome undergoes progressive remodeling with increasing disease severity, with the number of differentially expressed proteins rising from 13 in IDC and 6 in LSIL to 43 in HSIL and 100 in SCC relative to NILM. The most robust discrimination between disease requiring intervention (HSIL and SCC) and conditions requiring surveillance (NILM, IDC, and LSIL) was driven not by epithelial proteins but by a coordinated plasma protein signature—CPN2, ORM2, AGT, KNG1, F2, ITIH1, GC, APOA1, SERPINA1, and C4A—reflecting epithelial barrier disruption, acute-phase response, and hemostatic activation. At the same time, grade-correlated epithelial and structural proteins, most notably TRIM29 and AHNAK2, decreased with increasing severity, and a PCA based on grade-correlated proteins clearly separated NILM/LSIL from HSIL/SCC. The overlap of several hub proteins (ACTN4, PSMA3, ACP1, EIF5AL1, IGFBP2, KNG1, EIF5A, and ORM2) between inflammatory and neoplastic processes indicates that inflammation alone can partially mimic a neoplastic CVF signature, and that a CVF-based triage test should therefore combine plasma-derived and malignancy-specific proteins rather than rely on either class alone. Taken together, these findings support the development of a multi-protein CVF panel—particularly one centered on the APOA1/ORM2/KNG1/SERPINA1 axis together with TRIM29 and AHNAK2—as a non-invasive tool for triaging HPV-associated cervical pathology. However, the cross-sectional design, modest group sizes, single analytical platform, and absence of an independent validation cohort mean that the candidate markers reported here require confirmation by targeted approaches in larger, well-characterized, longitudinal cohorts before clinical utility can be claimed.
Supplementary Materials
The following supporting information can be downloaded at the website of this paper posted on Preprints.org.
Author Contributions
Conceptualization, N.S., E.N., N.N., G.B., G.S., and A.K.; methodology, N.S., A.K., A.T., E.N., and A.B.; software, A.T., A.B., E.K., and A.K.; formal analysis, A.B., E.K., N.N., G.B., E.D., and A.T.; investigation, N.S., A.B., E.K., A.T., and A.K.; resources, E.N., N.S., E.N., G.B., V.P., and G.S.; data curation, N.N., E.K., A.B., A.K., G.B., E.D., and A.T.; writing—original draft preparation, N.S., A.B., A.T., E.K., and A.K.; writing—review and editing, E.N., V.P., N.N., G.B., E.D., and G.S.; visualization, N.S., A.T., E.K., A.B., and A.K.; supervision, E.N., V.P., G.B., E.D., and G.S.; project administration, N.S., N.N., E.N., V.P., A.K., and G.S.; funding acquisition, V.P, E.N., and G.S. All authors have read and agreed to the published version of the manuscript.
Funding
This research was funded by the state assignment of the Ministry of Healthcare of the Russian Federation (Registration No. 12503063216-9 “Development of a test system for early and minimally invasive diagnostics of HPV- associated precancerous and oncological diseases of the anogenital area in women of different ages using liquid biopsy”).
Institutional Review Board Statement
The study was approved by the Ethical Committee of the National Medical Research Center for Obstetrics, Gynecology and Perinatology, named after Academician V.I. Kulakov (Moscow, Russia, protocol code 1 of 30 January 2025).
Informed Consent Statement
Informed consent was obtained from all subjects involved in the study.
Data Availability Statement
The data presented in this study are available on request from the corresponding author.
Acknowledgments
The authors are grateful to the laboratory for the collection and storage of biological material (Biobank) for providing plasma samples. The authors acknowledge the support of Laboratory of Mass Spectrometry at Skolkovo Institute of Science and Technology for proteomic analysis of samples.
Conflicts of Interest
The authors declare no conflicts of interest.
Abbreviations
The following abbreviations are used in this manuscript:
| HPV | Human papillomavirus |
| NILM | Negative for intraepithelial lesion or malignancy |
| IDC | Inflammatory disease of the cervix |
| LSIL | Low-grade squamous intraepithelial lesion |
| HSIL | High-grade intraepithelial lesion |
| SCC | Invasive squamous cell carcinoma (SCC) |
| CIN | Cervical intraepithelial neoplasia |
| SIL | Squamous intraepithelial lesion |
| LC-MS/MS | Liquid chromatography-tandem mass spectroscopy |
| CV | Coefficient of variation |
| FC | Fold change |
| FDR | False discovery rate |
| iBAQ | Intensity-based absolute quantification |
| LFQ | Label-free quantitation |
| ORA | Over-representation analysis |
| GSEA | Gene set enrichment analysis |
| CVF | Cervicovaginal fluid |
References
- World Health Organization. WHO Guideline for Screening and Treatment of Cervical Pre-Cancer Lesions for Cervical Cancer Prevention: Use of Human Papillomavirus (HPV) DNA Genotyping; World Health Organization: Geneva, 2026; ISBN 978-92-4-012174-4. [Google Scholar]
- Jensen, J.N.E.; Becker, G.L.; Jackson, J.B.; Rysavy, M.B. Human Papillomavirus and Associated Cancers: A Review. Viruses 2024, 16, 680. [Google Scholar] [CrossRef]
- Bray, F.; Laversanne, M.; Sung, H.; Ferlay, J.; Siegel, R.L.; Soerjomataram, I.; Jemal, A. Global cancer statistics 2022: GLOBOCAN estimates of incidence and mortality worldwide for 36 cancers in 185 countries. CA. Cancer J. Clin. 2024, 74, 229–263. [Google Scholar] [CrossRef]
- Kyrgiou, M.; Arbyn, M.; Bergeron, C.; Bosch, F.X.; Dillner, J.; Jit, M.; Kim, J.; Poljak, M.; Nieminen, P.; Sasieni, P.; et al. Cervical screening: ESGO-EFC position paper of the European Society of Gynaecologic Oncology (ESGO) and the European Federation of Colposcopy (EFC). Br. J. Cancer 2020, 123, 510–517. [Google Scholar] [CrossRef]
- Nanda, K.; Mccrory, D.C.; Myers, E.R.; Bastian, L. a; Hasselblad, V.; Hickey, J.D.; Matchar, D.B. Accuracy of the Papanicolaou Test in Screening for and Follow-up of Cervical Cytologic Abnormalities: A Systematic Review. Ann. Intern. Med. 2000, 132, 810–9. [Google Scholar] [CrossRef]
- Gupta, R.; Hariprasad, R.; Dhanasekaran, K.; Sodhani, P.; Mehrotra, R.; Kumar, N.; Gupta, S. Reappraisal of cytology-histology correlation in cervical cytology based on the recent American Society of Cytopathology guidelines (2017) at a cancer research centre. Cytopathology 2020, 31, 53–58. [Google Scholar] [CrossRef]
- Kaur, G.; Shivani; Zutshi, V.; Yadav, A.K. Role of Multiple Cervical Biopsies on Colposcopy for the Detection of Premalignant and Malignant Lesions of the Cervix. J. Colposc. Low. Genit. Tract. Pathol. 2025, 2, 97–103. [Google Scholar] [CrossRef]
- Hariprasad, R.; Mittal, S.; Basu, P. Role of colposcopy in the management of women with abnormal cytology. Cytojournal 2022, 19, 1–8. [Google Scholar] [CrossRef]
- Pileggi, C.; Flotta, D.; Bianco, A.; Nobile, C.G.A.; Pavia, M. Is HPV DNA testing specificity comparable to that of cytological testing in primary cervical cancer screening? Results of a meta-analysis of randomized controlled trials. Int. J. Cancer 2014, 135, 166–177. [Google Scholar] [CrossRef]
- Güzel, C.; van Sten-van’t Hoff, J.; de Kok, I.M.C.M.; Govorukhina, N.I.; Boychenko, A.; Luider, T.M.; Bischoff, R. Molecular markers for cervical cancer screening. Expert Rev. Proteom. 2021, 18, 675–691. [Google Scholar] [CrossRef]
- Huggins, G.R.; Preti, G. Vaginal odors and secretions. Clin. Obstet. Gynecol. 1981, 24, 355–377. [Google Scholar] [CrossRef]
- Van Ostade, X.; Dom, M.; Tjalma, W.; Van Raemdonck, G. Candidate biomarkers in the cervical vaginal fluid for the (self-)diagnosis of cervical precancer. Arch. Gynecol. Obstet. 2018, 297, 295–311. [Google Scholar] [CrossRef]
- Zegels, G.; Van Raemdonck, G.A.A.; Tjalma, W.A.A.; Van Ostade, X.W.M. Use of cervicovaginal fluid for the identification of biomarkers for pathologies of the female genital tract. Proteome Sci. 2010, 8, 63. [Google Scholar] [CrossRef]
- Arbyn, M.; Verdoodt, F.; Snijders, P.J.F.; Verhoef, V.M.J.; Suonio, E.; Dillner, L.; Minozzi, S.; Bellisario, C.; Banzi, R.; Zhao, F.H.; et al. Accuracy of human papillomavirus testing on self-collected versus clinician-collected samples: A meta-analysis. Lancet Oncol. 2014, 15, 172–183. [Google Scholar] [CrossRef]
- Köse, B.; Takmaz, Ö.; Güngör, M.; Erkanlı, S.; Koçak, A.; Serdar, M.A.; Baykal, A.T. Identifying Biomarkers for Cervical Neoplasia: A Label-free Proteomic Analysis of Cervicovaginal Fluid. Eur. Arch. Med. Res. 2024, 40, 36–43. [Google Scholar] [CrossRef]
- Paterson, E.S.J.; Scheck, S.; Kleffmann, T.; Gill, R.; Bedford, N.; McDowell, S.; Girling, J.E.; Henry, C.E. Proteomic Analysis of Cervicovaginal Fluid for Diagnostic Endometriosis Biomarker Discovery. Proteom.-Clin. Appl. 2026, 20, e70044. [Google Scholar] [CrossRef]
- Van Raemdonck, G.A.A.; Tjalma, W.A.A.; Coen, E.P.; Depuydt, C.E.; Van Ostade, X.W.M. Identification of protein biomarkers for cervical cancer using human cervicovaginal fluid. PLoS ONE 2014, 9, 1–9. [Google Scholar] [CrossRef]
- Starodubtseva, N.L.; Brzhozovskiy, A.G.; Bugrova, A.E.; Kononikhin, A.S.; Indeykina, M.I.; Gusakov, K.I.; Chagovets, V. V.; Nazarova, N.M.; Frankevich, V.E.; Sukhikh, G.T.; et al. Label-free cervicovaginal fluid proteome profiling reflects the cervix neoplastic transformation. J. Mass Spectrom. 2019, 54, 693–703. [Google Scholar] [CrossRef]
- Lara Gutiérrez, A.; Lindberg, J.H.; Shevchenko, G.; Gustavsson, I.; Bergquist, J.; Gyllensten, U.; Enroth, S. Identification of candidate protein biomarkers for cin2+ lesions from self-sampled, dried cervico–vaginal fluid using lc-ms/ms. Cancers 2021, 13. [Google Scholar] [CrossRef]
- Mukherjee, A.; Pednekar, C.B.; Kolke, S.S.; Kattimani, M.; Duraisamy, S.; Burli, A.R.; Gupta, S.; Srivastava, S. Insights on Proteomics-Driven Body Fluid-Based Biomarkers of Cervical Cancer. Proteomes 2022, 10, 13. [Google Scholar] [CrossRef]
- Petry, K.U.; Nieminen, P.J.; Leeson, S.C.; Bergeron, C.O.M.A.; Redman, C.W.E. 2017 update of the European Federation for Colposcopy (EFC) performance standards for the practice of colposcopy. Eur. J. Obstet. Gynecol. Reprod. Biol. 2018, 224, 137–141. [Google Scholar] [CrossRef]
- Massad, L.S.; Einstein, M.H.; Huh, W.K.; Katki, H.A.; Kinney, W.K.; Schiffman, M.; Solomon, D.; Wentzensen, N.; Lawson, H.W. 2012 updated consensus guidelines for the management of abnormal cervical cancer screening tests and cancer precursors. J. Low. Genit. Tract. Dis. 2013, 17, S1–S27. [Google Scholar] [CrossRef]
- Yurin, A.M.; Starodubtseva, N.L.; Bugrova, A.E.; Kononikhin, A.S.; Silachev, D.N.; Frankevich, V.E.; Tokareva, A.O.; Indeykina, M.I.; Evtushenko, E.A.; Yakovlev, A.A.; et al. Proteome of CD9+ Plasma Small Extracellular Vesicles Differentiates Stages of HPV-Associated Cervical Neoplasia from Normal Epithelium to Invasive Cancer. Life 2026, 16, 1181. [Google Scholar] [CrossRef]
- Wu, G.; Dawson, E.; Duong, A.; Haw, R.; Stein, L. ReactomeFIViz: a Cytoscape app for pathway and network-based data analysis. F1000Research 2014, 3, 146. [Google Scholar] [CrossRef]
- Shannon, P.; Markiel, A.; Ozier, O.; Baliga, N.S.; Wang, J.T.; Ramage, D.; Amin, N.; Schwikowski, B.; Ideker, T. Cytoscape: a software environment for integrated models of biomolecular interaction networks. Genome Res. 2003, 13, 2498–2504. [Google Scholar] [CrossRef]
- Van Dongen, S. Graph Clustering Via a Discrete Uncoupling Process. SIAM J. Matrix Anal. Appl. 2008, 30, 121–141. [Google Scholar] [CrossRef]
- Subramanian, A.; Tamayo, P.; Mootha, V.K.; Mukherjee, S.; Ebert, B.L.; Gillette, M.A.; Paulovich, A.; Pomeroy, S.L.; Golub, T.R.; Lander, E.S.; et al. Gene set enrichment analysis: a knowledge-based approach for interpreting genome-wide expression profiles. Proc. Natl. Acad. Sci. U. S. A. 2005, 102, 15545–15550. [Google Scholar] [CrossRef]
- Ragueneau, E.; Gong, C.; Sinquin, P.; Sevilla, C.; Beavers, D.; Grentner, A.; Griss, J.; Hogue, G.F.J.; Li, N.T.; Matthews, L.; et al. The Reactome Knowledgebase 2026. Nucleic Acids Res. 2026, 54, D673–D681. [Google Scholar] [CrossRef]
- Szklarczyk, D.; Kirsch, R.; Koutrouli, M.; Nastou, K.; Mehryary, F.; Hachilif, R.; Gable, A.L.; Fang, T.; Doncheva, N.T.; Pyysalo, S.; et al. The STRING database in 2023: protein-protein association networks and functional enrichment analyses for any sequenced genome of interest. Nucleic Acids Res. 2023, 51, D638–D646. [Google Scholar] [CrossRef]
- Chin, C.H.; Chen, S.H.; Wu, H.H.; Ho, C.W.; Ko, M.T.; Lin, C.Y. cytoHubba: Identifying hub objects and sub-networks from complex interactome. BMC Syst. Biol. 2014, 8, S11. [Google Scholar] [CrossRef]
- CoreTeam, R. R: A Language and Environment for Statistical Computing. Available online: https://www.r-project.org.
- Chen, H.; Boutros, P.C. VennDiagram: a package for the generation of highly-customizable Venn and Euler diagrams in R. BMC Bioinform. 2011, 12, 35. [Google Scholar] [CrossRef]
- Xu, S.; Hu, E.; Cai, Y.; Xie, Z.; Luo, X.; Zhan, L.; Tang, W.; Wang, Q.; Liu, B.; Wang, R.; et al. Using clusterProfiler to characterize multiomics data. Nat. Protoc. 2024, 19, 3292–3320. [Google Scholar] [CrossRef]
- Yu, G.; He, Q.-Y. ReactomePA: an R/Bioconductor package for reactome pathway analysis and visualization. Mol. Biosyst. 12, 477–9. [CrossRef]
- Dinno, A. dunn. test: Dunn’s Test of Multiple Comparisons Using Rank Sums 2024. [CrossRef]
- Wickham, H. Reshaping data with the reshape package. J. Stat. Softw. 2007, 21, 1–20. [Google Scholar] [CrossRef]
- Wickham, H. Elegant Graphics for Data Analysis: ggplot2; 2008; ISBN 978-0-387-78170-9. [Google Scholar]
- Yu, G.; Gao, C.-H. enrichplot: Visualization of Functional Enrichment Result. 2026. [Google Scholar]
- Wickham, H. forcats: Tools for Working with Categorical Variables (Factors) 2023. [CrossRef]
- Slowikowski, K. ggrepel: Automatically Position Non-Overlapping Text Labels with “ggplot2”. Available online: https://github.com/slowkow/ggrepel.
- Protein detected in human plasma by mass spectrometry. Available online: https://www.proteinatlas.org/humanproteome/blood/proteins+detected+in+ms.
- Qiu, F.; Chen, F.; Liu, D.; Xu, J.; He, J.; Xiao, J.; Cao, L.; Huang, X. [LC-MS/MS-based screening of new protein biomarkers for cervical precancerous lesions and cervical cancer]. Nan Fang Yi Ke Da Xue Xue Bao 2019, 39, 13–22. [Google Scholar] [CrossRef]
- Cafforio, P.; Palmirotta, R.; Lovero, D.; Cicinelli, E.; Cormio, G.; Silvestris, E.; Porta, C.; D’Oronzo, S. Liquid biopsy in cervical cancer: Hopes and pitfalls. Cancers 2021, 13, 3968. [Google Scholar] [CrossRef]
- Qing, S.; Tulake, W.; Ru, M.; Li, X.; Yuemaier, R.; Lidifu, D.; Rouzibilali, A.; Hasimu, A.; Yang, Y.; Rouziahong, R.; et al. Proteomic identification of potential biomarkers for cervical squamous cell carcinoma and human papillomavirus infection. Tumor Biol. 2017, 39, 1–18. [Google Scholar] [CrossRef]
- Ma, Z.; Chen, J.; Luan, T.; Chu, C.; Wu, W.; Zhu, Y.; Gu, Y. Proteomic analysis of human cervical adenocarcinoma mucus to identify potential protein biomarkers. PeerJ 2020, 8, 1–17. [Google Scholar] [CrossRef]
- Olejek, A.; Mazurek, U.; Michalski, B.; Kuśmierz, D.; Orchel, J.; Witek, A.; Wilczok, T. Profiles of expression of genes coding kininogen and kinin receptors as a marker of tissue pathology in cervical cancer coexisting with HPV infection. Wiad. Lek. 2000, 53, 247–254. [Google Scholar]
- Wang, Y.; Jerome, N.A.; Kelleher, A.J.; Henderson, M.L.; Day, M.L.; Coulombe, P.A.; Palmbos, P.L. TRIM29 promotes bladder cancer invasion by regulating the intermediate filament network and focal adhesion. Oncogene 2025, 44, 4047–4057. [Google Scholar] [CrossRef]
- Liu, G.; Guo, Z.; Zhang, Q.; Liu, Z.; Zhu, D. Ahnak2 promotes migration, invasion, and epithelial-mesenchymal transition in lung adenocarcinoma cells via the tgf-β/smad3 pathway. Onco. Targets. Ther. 2020, 13, 12893–12903. [Google Scholar] [CrossRef]
- Wojtukiewicz, M.Z.; Sierko, E.; Klement, P.; Rak, J. The hemostatic system and angiogenesis in malignancy. Neoplasia 2001, 3, 371–384. [Google Scholar] [CrossRef]
- Kaur, G.; Balasubramaniam, S.D.; Lee, Y.J. IGFBP-2 in cervical cancer development. Exp. Mol. Pathol. 2020, 113, 104362. [Google Scholar] [CrossRef]
Figure 1.
Overview of the CVF proteome across five histological groups (n=93): NILM (n=18), IDC (n=17), LSIL (n=20), HSIL (n=20) and SCC (n=18). (a) Number of proteins detected per sample, grouped by histology (NILM, IDC, LSIL, HSIL, SCC); bars show group means with error bars, and individual samples are plotted as dots. (b) UpSet plot showing the distribution and overlap of all detected proteins (n=2,112) across the five histology groups; set size indicates the total number of proteins per group, and the matrix below indicates which groups share each intersection. (c) Network of gene expression analysis based on the LFQ protein profile, revealing seven functional clusters: lipid metabolism; coagulation and fibrinolysis; translation; complement activation; RNA-associated processes; keratinization; and circadian rhythm. Nodes represent proteins and edges represent Pearson-based connectivity; node color indicates cluster membership.
Figure 1.
Overview of the CVF proteome across five histological groups (n=93): NILM (n=18), IDC (n=17), LSIL (n=20), HSIL (n=20) and SCC (n=18). (a) Number of proteins detected per sample, grouped by histology (NILM, IDC, LSIL, HSIL, SCC); bars show group means with error bars, and individual samples are plotted as dots. (b) UpSet plot showing the distribution and overlap of all detected proteins (n=2,112) across the five histology groups; set size indicates the total number of proteins per group, and the matrix below indicates which groups share each intersection. (c) Network of gene expression analysis based on the LFQ protein profile, revealing seven functional clusters: lipid metabolism; coagulation and fibrinolysis; translation; complement activation; RNA-associated processes; keratinization; and circadian rhythm. Nodes represent proteins and edges represent Pearson-based connectivity; node color indicates cluster membership.
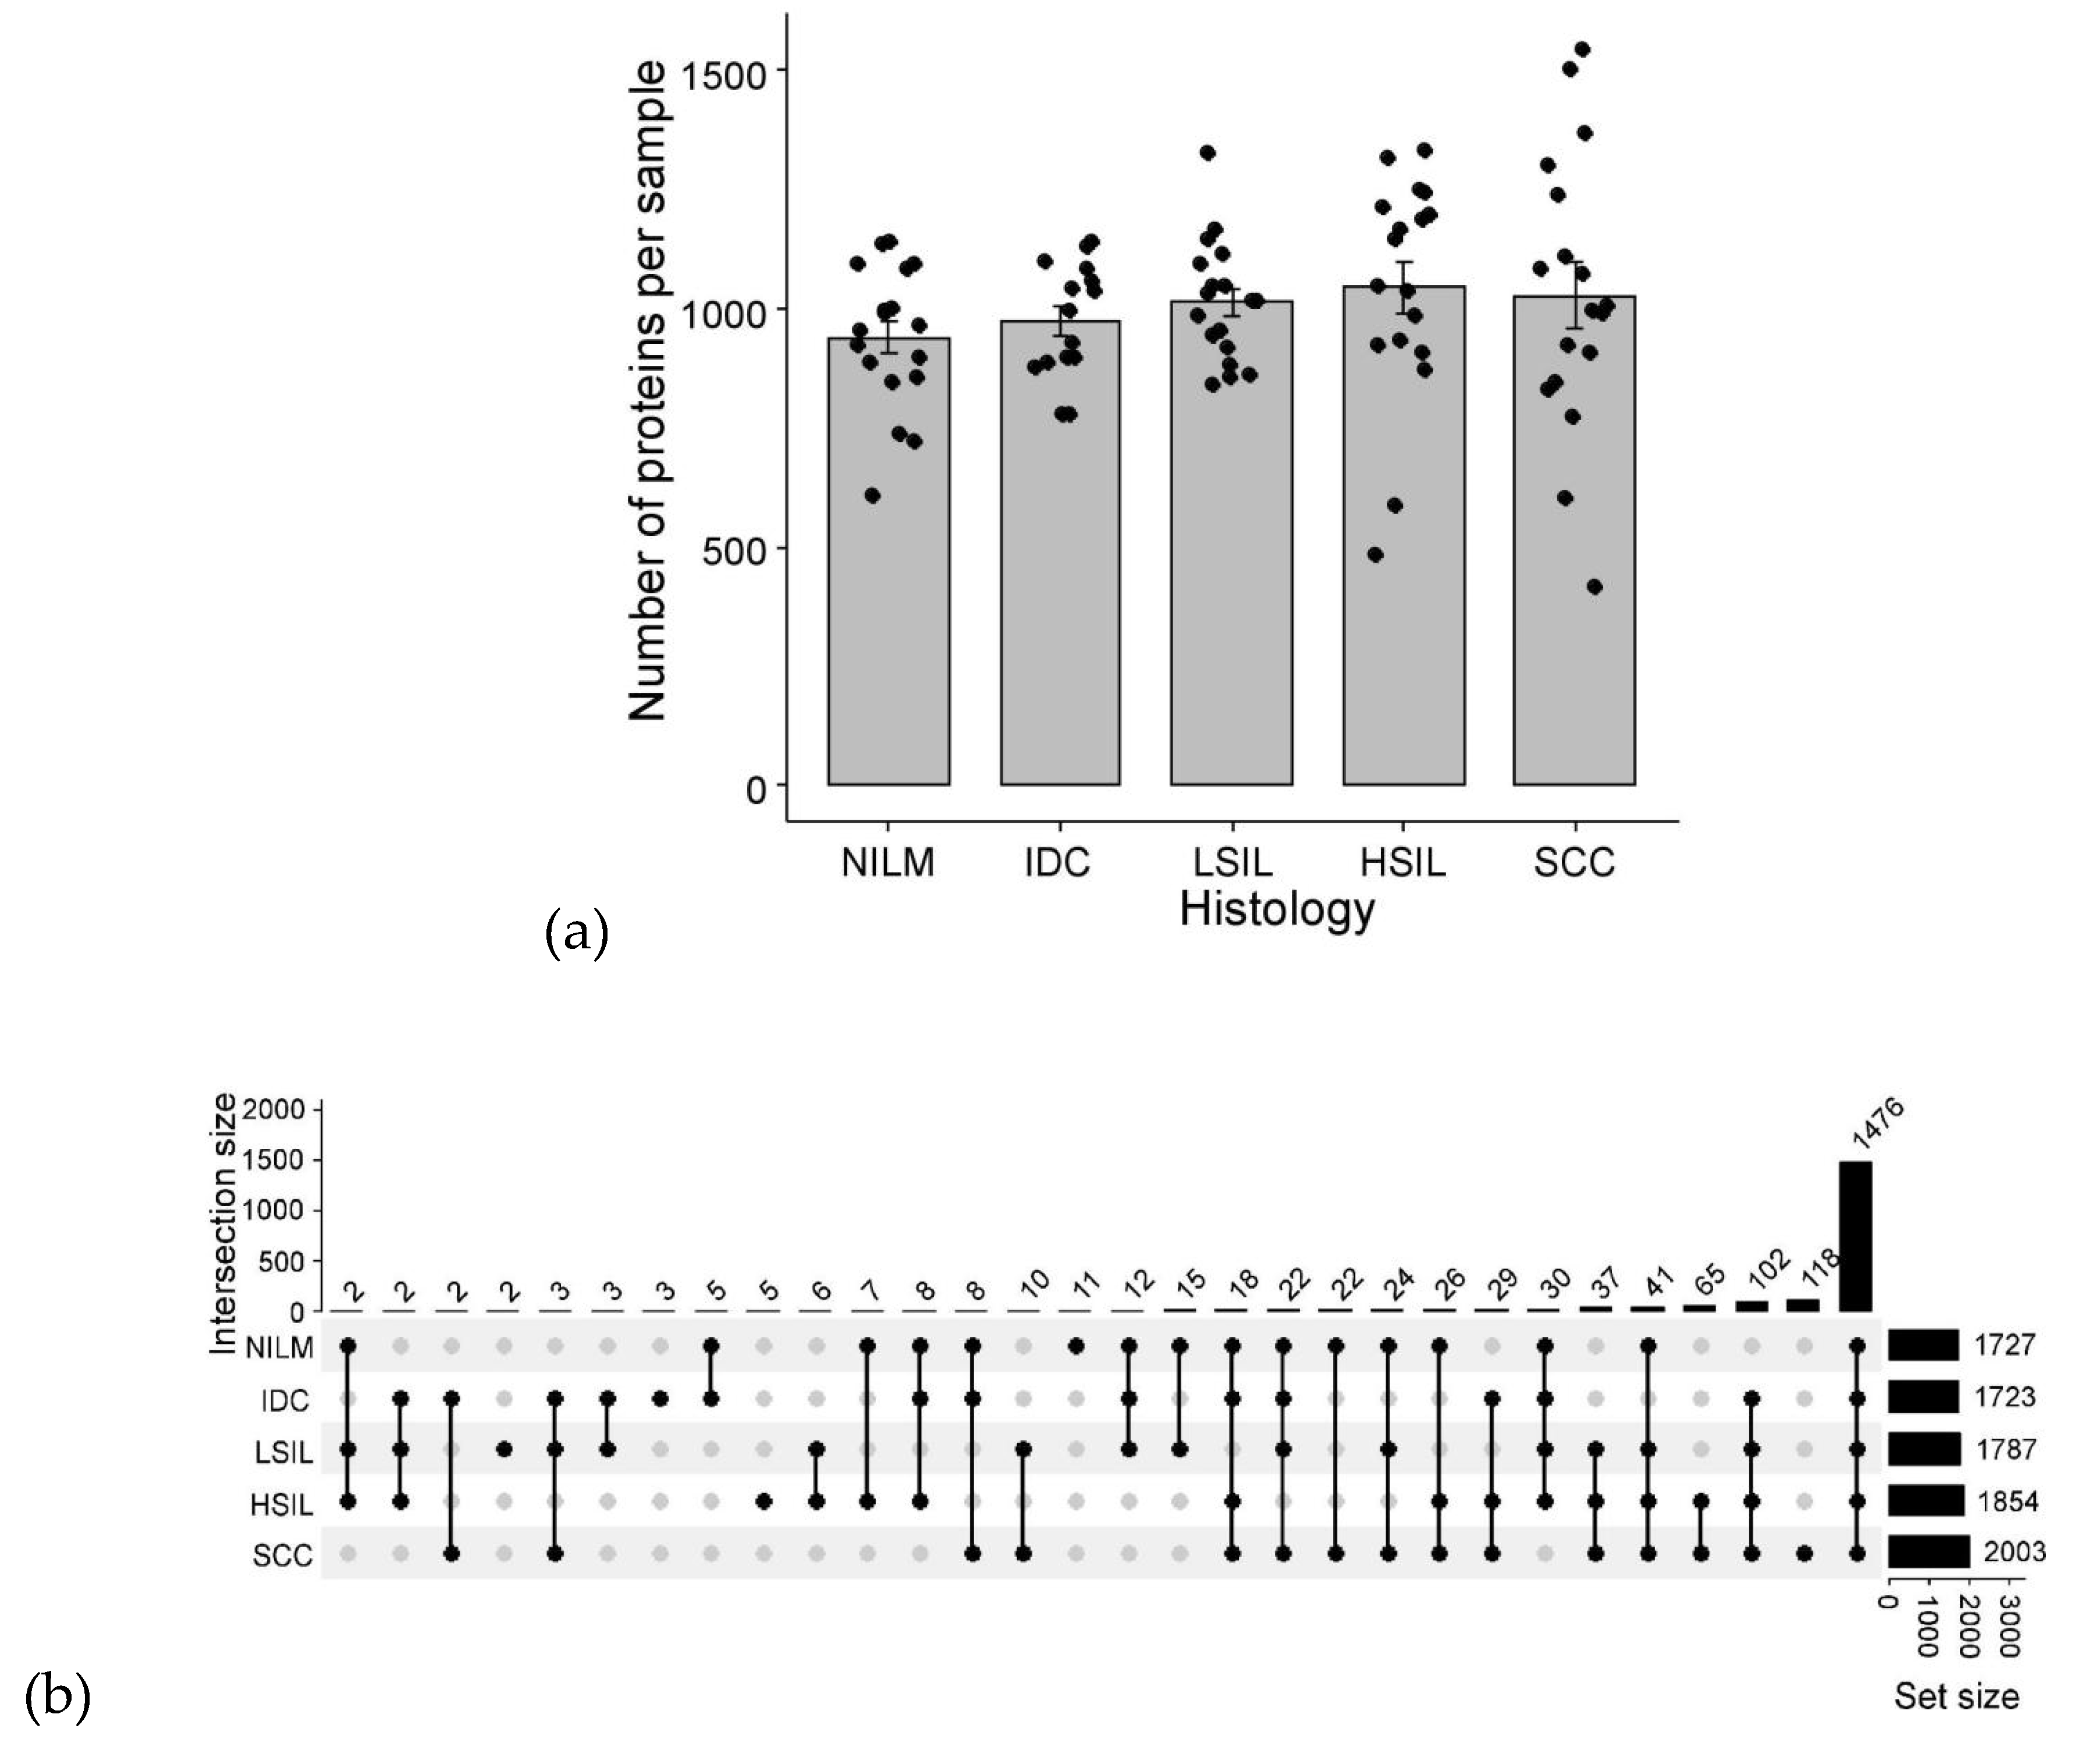
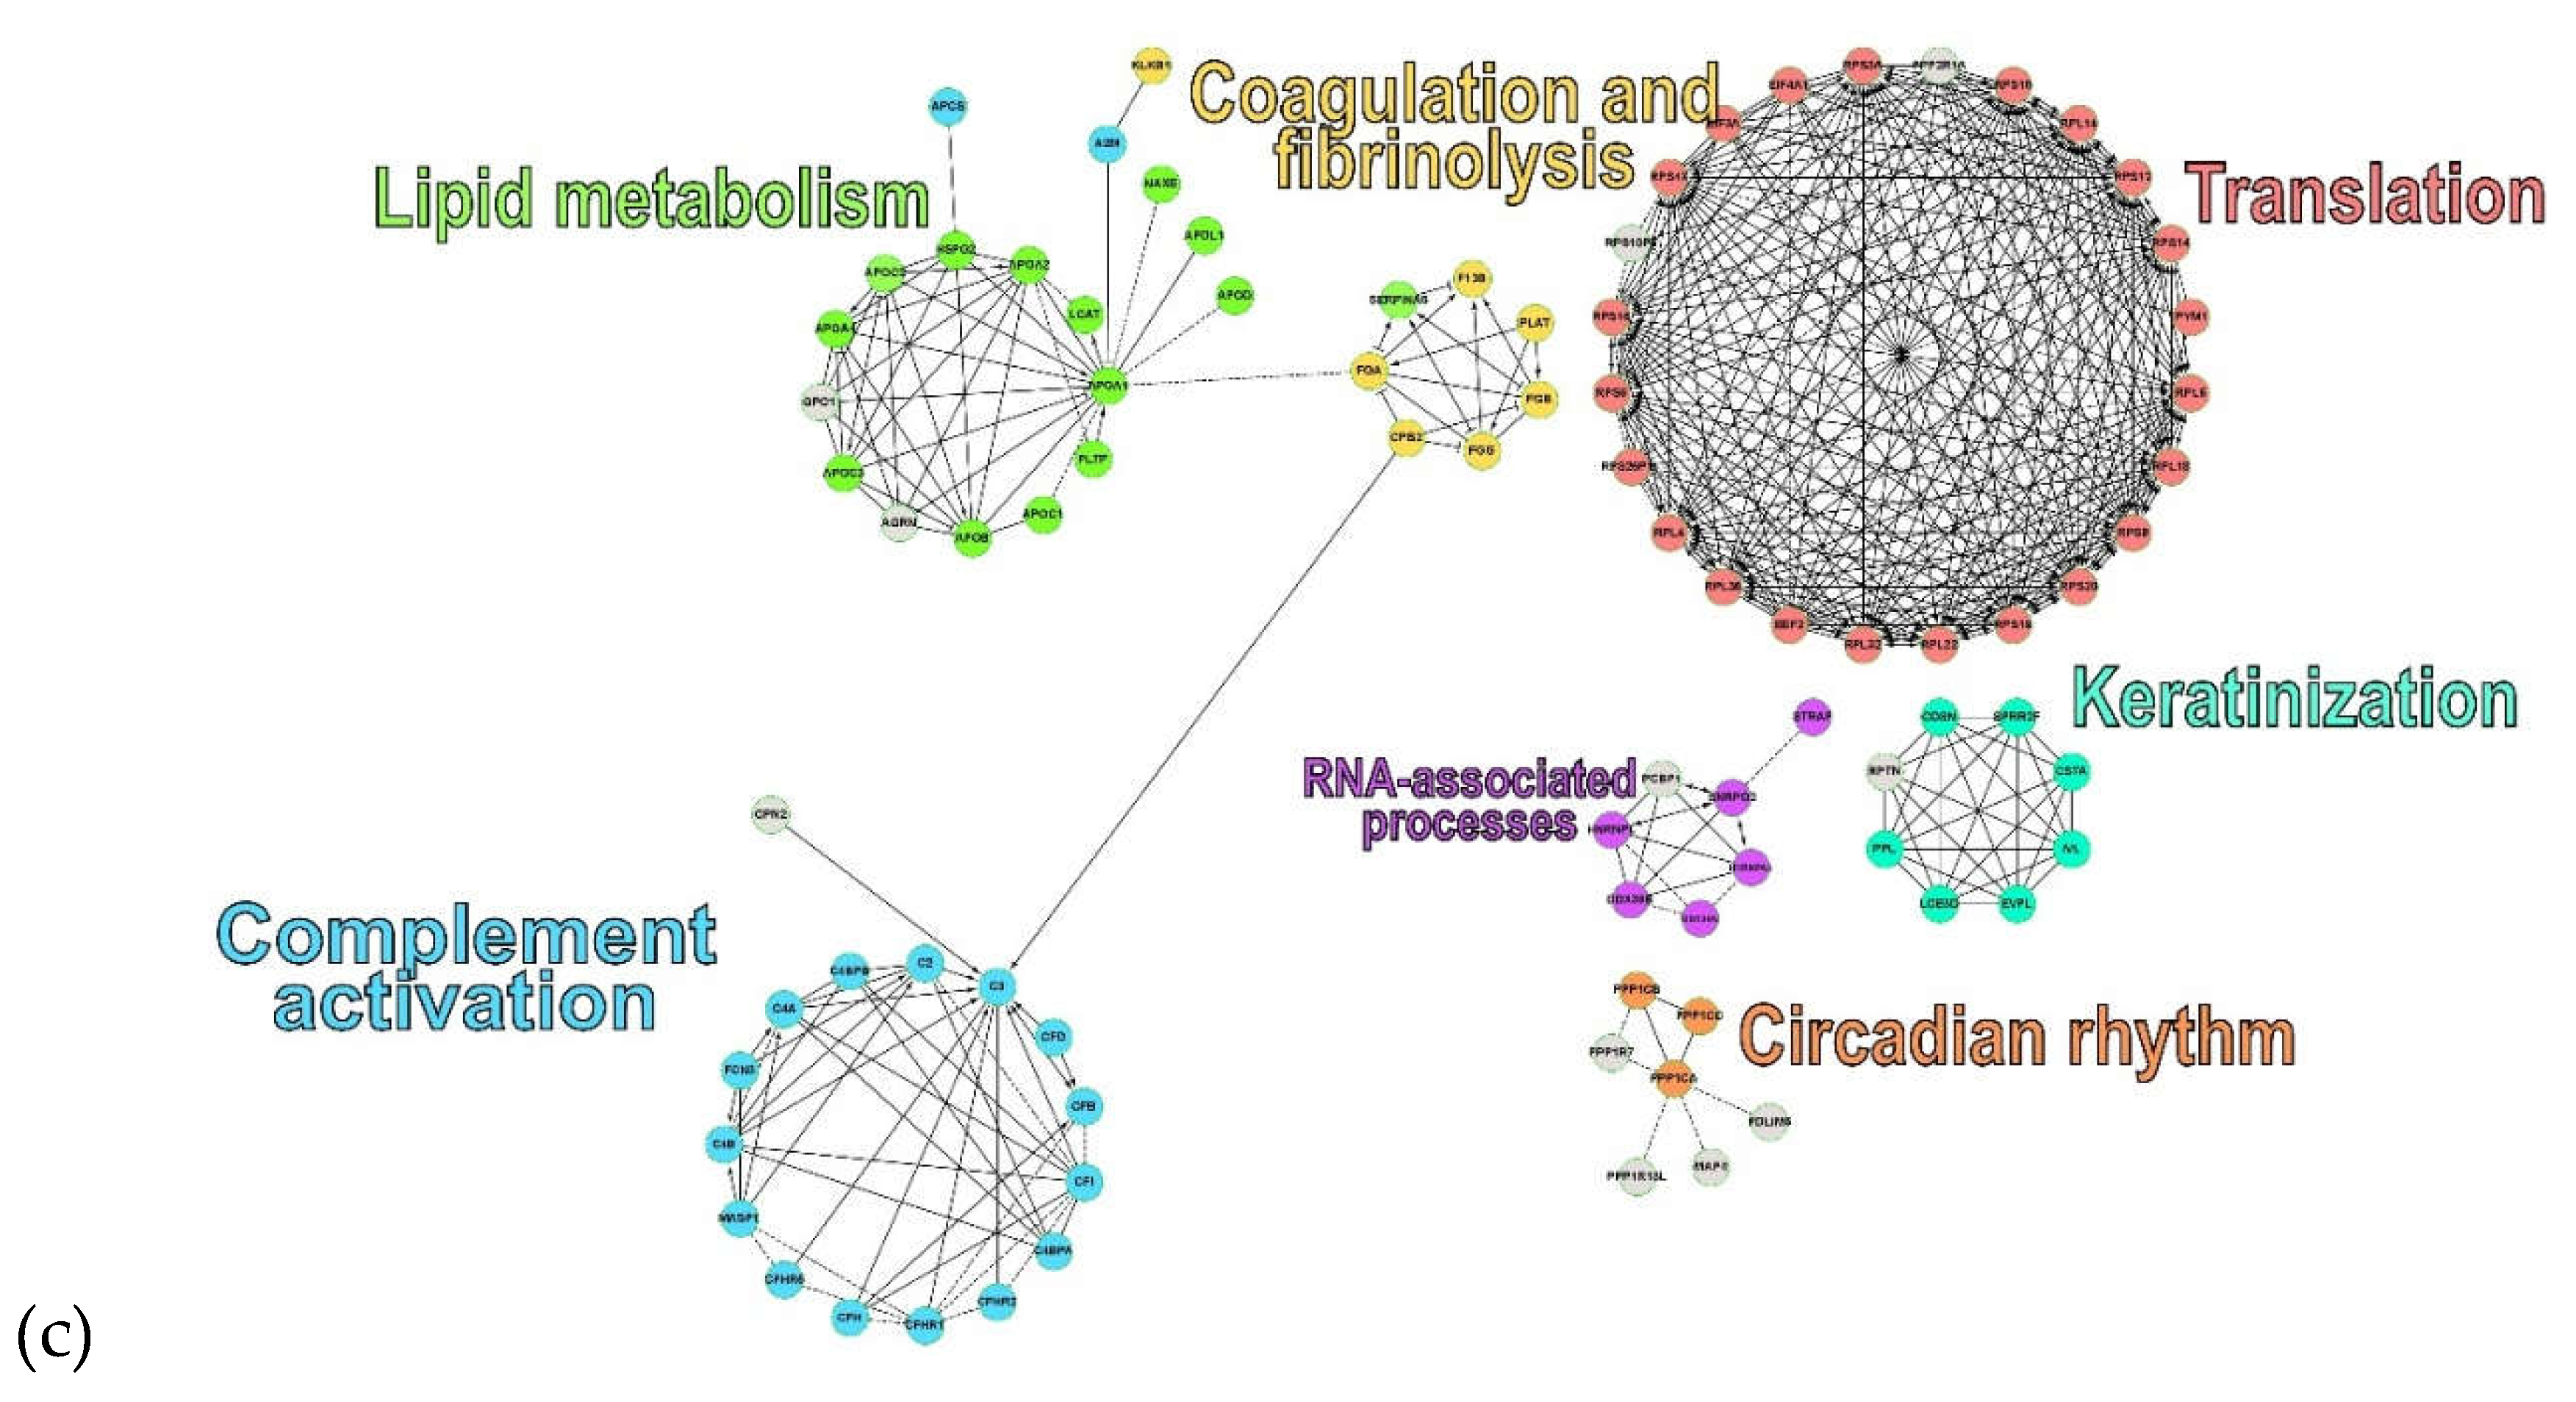
Figure 2.
Differential expression and pathway analysis in high-grade lesions and cancer (HSIL+SCC) vs. healthy tissue, chronic inflammation and low-grade lesions (NILM+IDC+LSIL). (a) Volcano plot of CVF protein expression changes; the x-axis shows log₂ fold change and the y-axis shows −log₁₀(p); differentially expressed proteins are highlighted. (b) Hub-protein interaction network built using the Degree method; node color encodes hub rank, from red (highest rank) to yellow (lowest rank). (c) GSEA gene–concept network linking enriched Reactome pathways to their constituent DEPs; asterisks denote protein significance (*p < 0.05, **p < 0.01, ***p < 0.001), and differentially expressed proteins are labeled in bold. Node pathways size reflects protein count and node protein color reflects fold change of median protein levels. (d) ORA enrichment map showing six pathway clusters: scavenger receptors/plasma lipoprotein remodeling (red); platelet degranulation/complement cascade/IGF transport and uptake (orange); developmental cell lineages/keratinization (green); RAS/RAF/BRAF signaling (light blue); neutrophil degranulation (dark blue); and platelet activation/post-translational protein phosphorylation (purple). Numbered pathways: 1 - Platelet activation, signaling and aggregation, 2- Post-translational protein phosphorylation, 3 - Platelet Aggregation (Plug Formation), 4 - Common Pathway of Fibrin Clot Formation, 5 - Regulation of Insulin−like Growth Factor (IGF) transport and uptake by Insulin−like Growth Factor Binding Proteins (IGFBPs), 6 - Intrinsic Pathway of Fibrin Clot Formation. Node size reflects protein count and color reflects FDR.
Figure 2.
Differential expression and pathway analysis in high-grade lesions and cancer (HSIL+SCC) vs. healthy tissue, chronic inflammation and low-grade lesions (NILM+IDC+LSIL). (a) Volcano plot of CVF protein expression changes; the x-axis shows log₂ fold change and the y-axis shows −log₁₀(p); differentially expressed proteins are highlighted. (b) Hub-protein interaction network built using the Degree method; node color encodes hub rank, from red (highest rank) to yellow (lowest rank). (c) GSEA gene–concept network linking enriched Reactome pathways to their constituent DEPs; asterisks denote protein significance (*p < 0.05, **p < 0.01, ***p < 0.001), and differentially expressed proteins are labeled in bold. Node pathways size reflects protein count and node protein color reflects fold change of median protein levels. (d) ORA enrichment map showing six pathway clusters: scavenger receptors/plasma lipoprotein remodeling (red); platelet degranulation/complement cascade/IGF transport and uptake (orange); developmental cell lineages/keratinization (green); RAS/RAF/BRAF signaling (light blue); neutrophil degranulation (dark blue); and platelet activation/post-translational protein phosphorylation (purple). Numbered pathways: 1 - Platelet activation, signaling and aggregation, 2- Post-translational protein phosphorylation, 3 - Platelet Aggregation (Plug Formation), 4 - Common Pathway of Fibrin Clot Formation, 5 - Regulation of Insulin−like Growth Factor (IGF) transport and uptake by Insulin−like Growth Factor Binding Proteins (IGFBPs), 6 - Intrinsic Pathway of Fibrin Clot Formation. Node size reflects protein count and color reflects FDR.
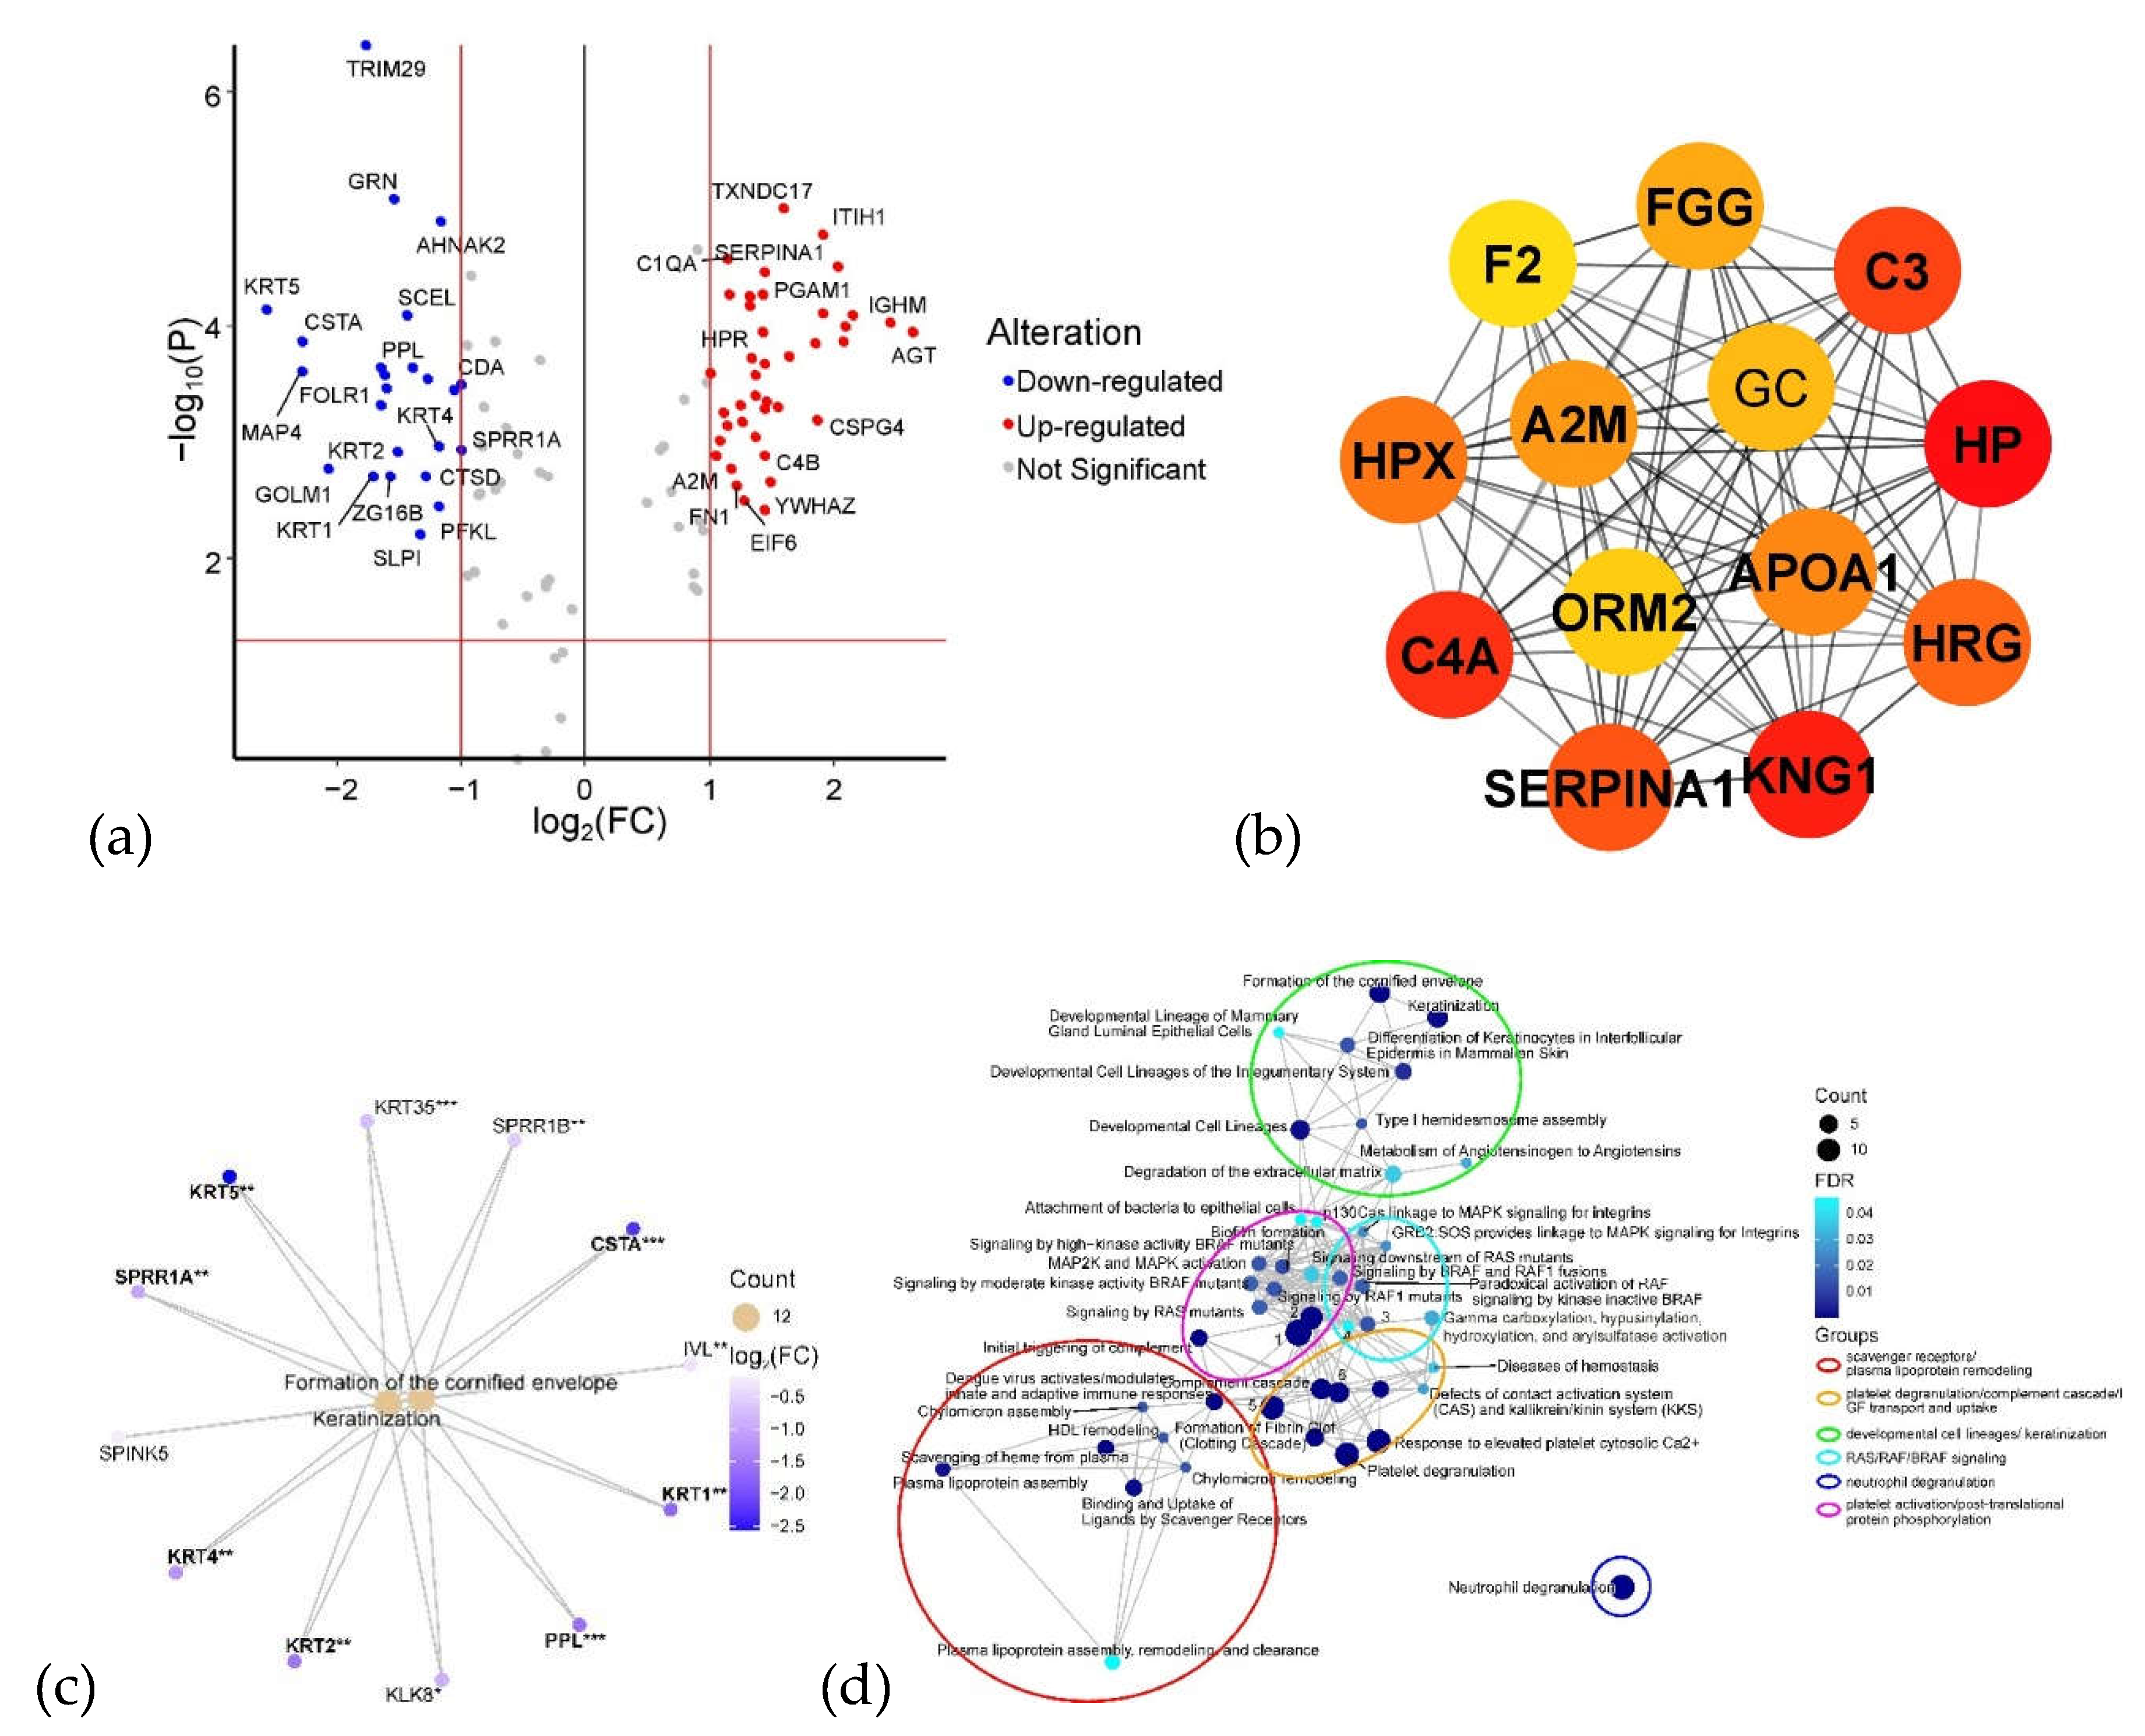
Figure 3.
CVF proteins associated with SIL grade. (a) Volcano plot of protein–SIL correlations (|R| > 0.5, p < 0.05); the x-axis shows the correlation coefficient R and the y-axis shows −log₁₀(p). (b) Box plots of iBAQ levels for potential CVF protein markers with |R| > 0.6 (p < 0.05)—AHNAK2 and TRIM29—across histology groups (NILM, green; LSIL, yellow; HSIL, orange; SCC, red). (c) Principal component analysis (PCA) based on proteins with |R| > 0.5, showing sample separation in PC1 (68% of variance) and PC2 (6% of variance) space, with points colored by histology. (d) Reactome pathway enrichment dotplot for proteins with |R| > 0.5; dot size reflects gene count and color reflects statistical significance.
Figure 3.
CVF proteins associated with SIL grade. (a) Volcano plot of protein–SIL correlations (|R| > 0.5, p < 0.05); the x-axis shows the correlation coefficient R and the y-axis shows −log₁₀(p). (b) Box plots of iBAQ levels for potential CVF protein markers with |R| > 0.6 (p < 0.05)—AHNAK2 and TRIM29—across histology groups (NILM, green; LSIL, yellow; HSIL, orange; SCC, red). (c) Principal component analysis (PCA) based on proteins with |R| > 0.5, showing sample separation in PC1 (68% of variance) and PC2 (6% of variance) space, with points colored by histology. (d) Reactome pathway enrichment dotplot for proteins with |R| > 0.5; dot size reflects gene count and color reflects statistical significance.
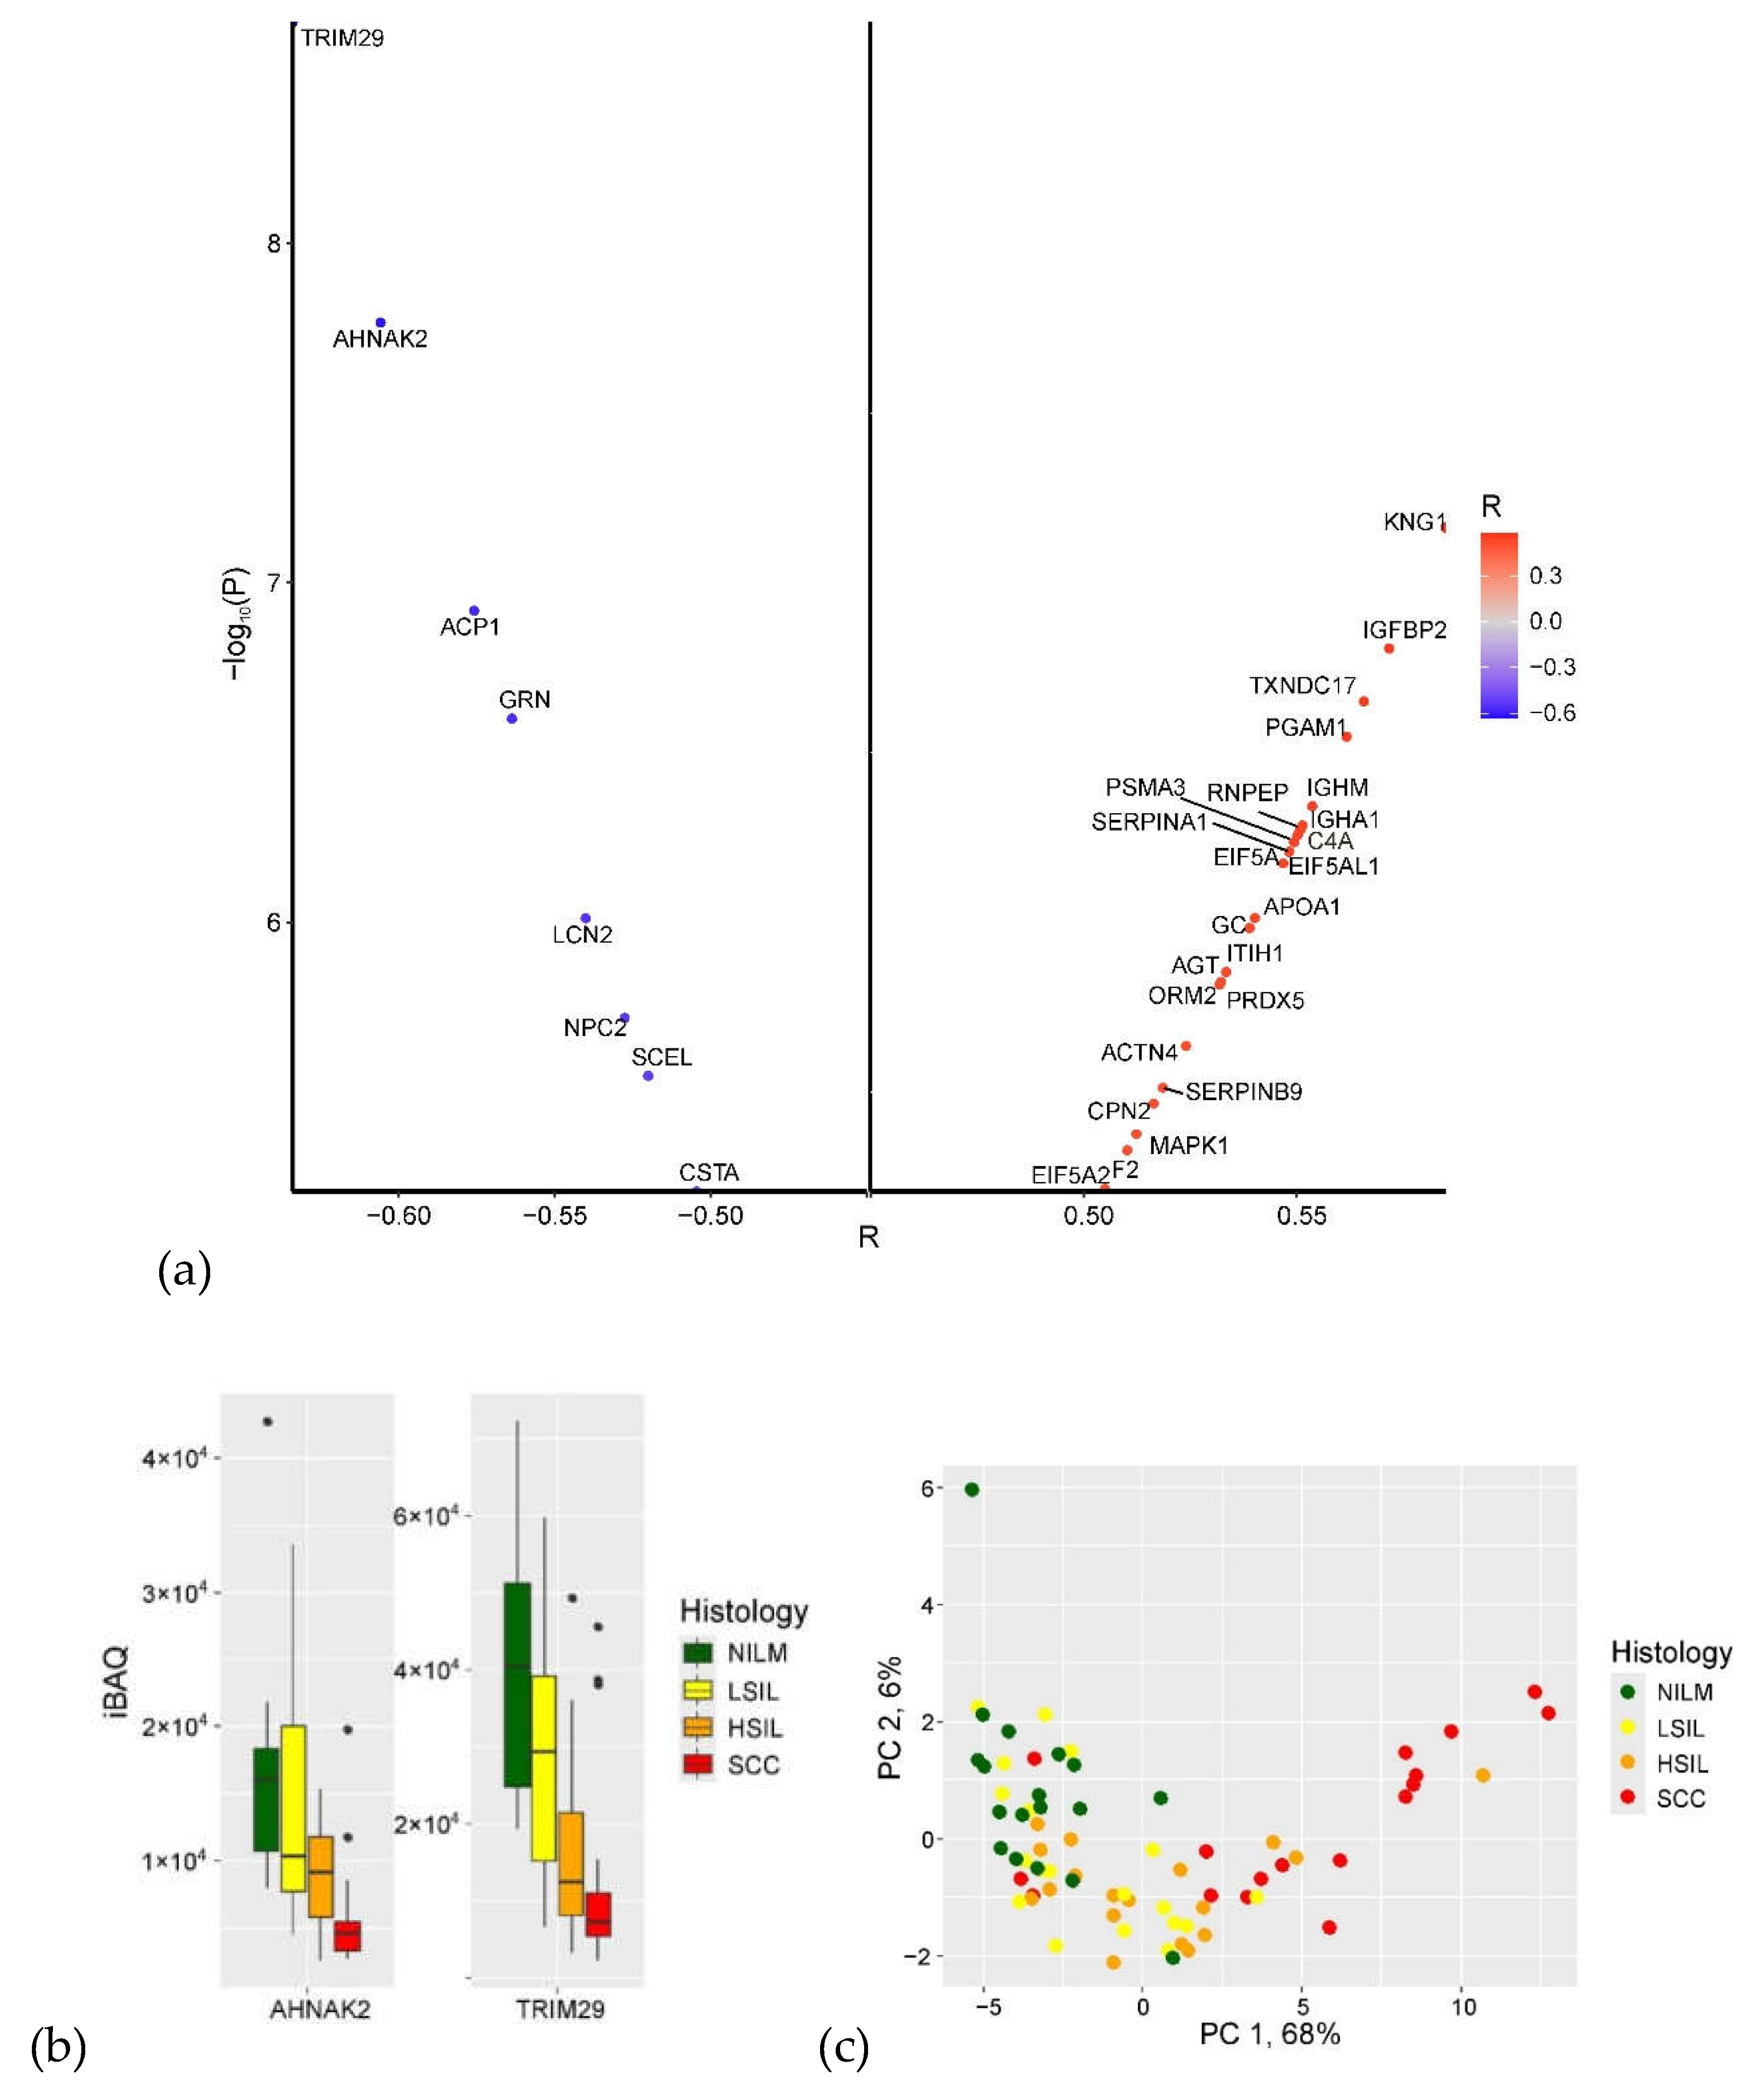
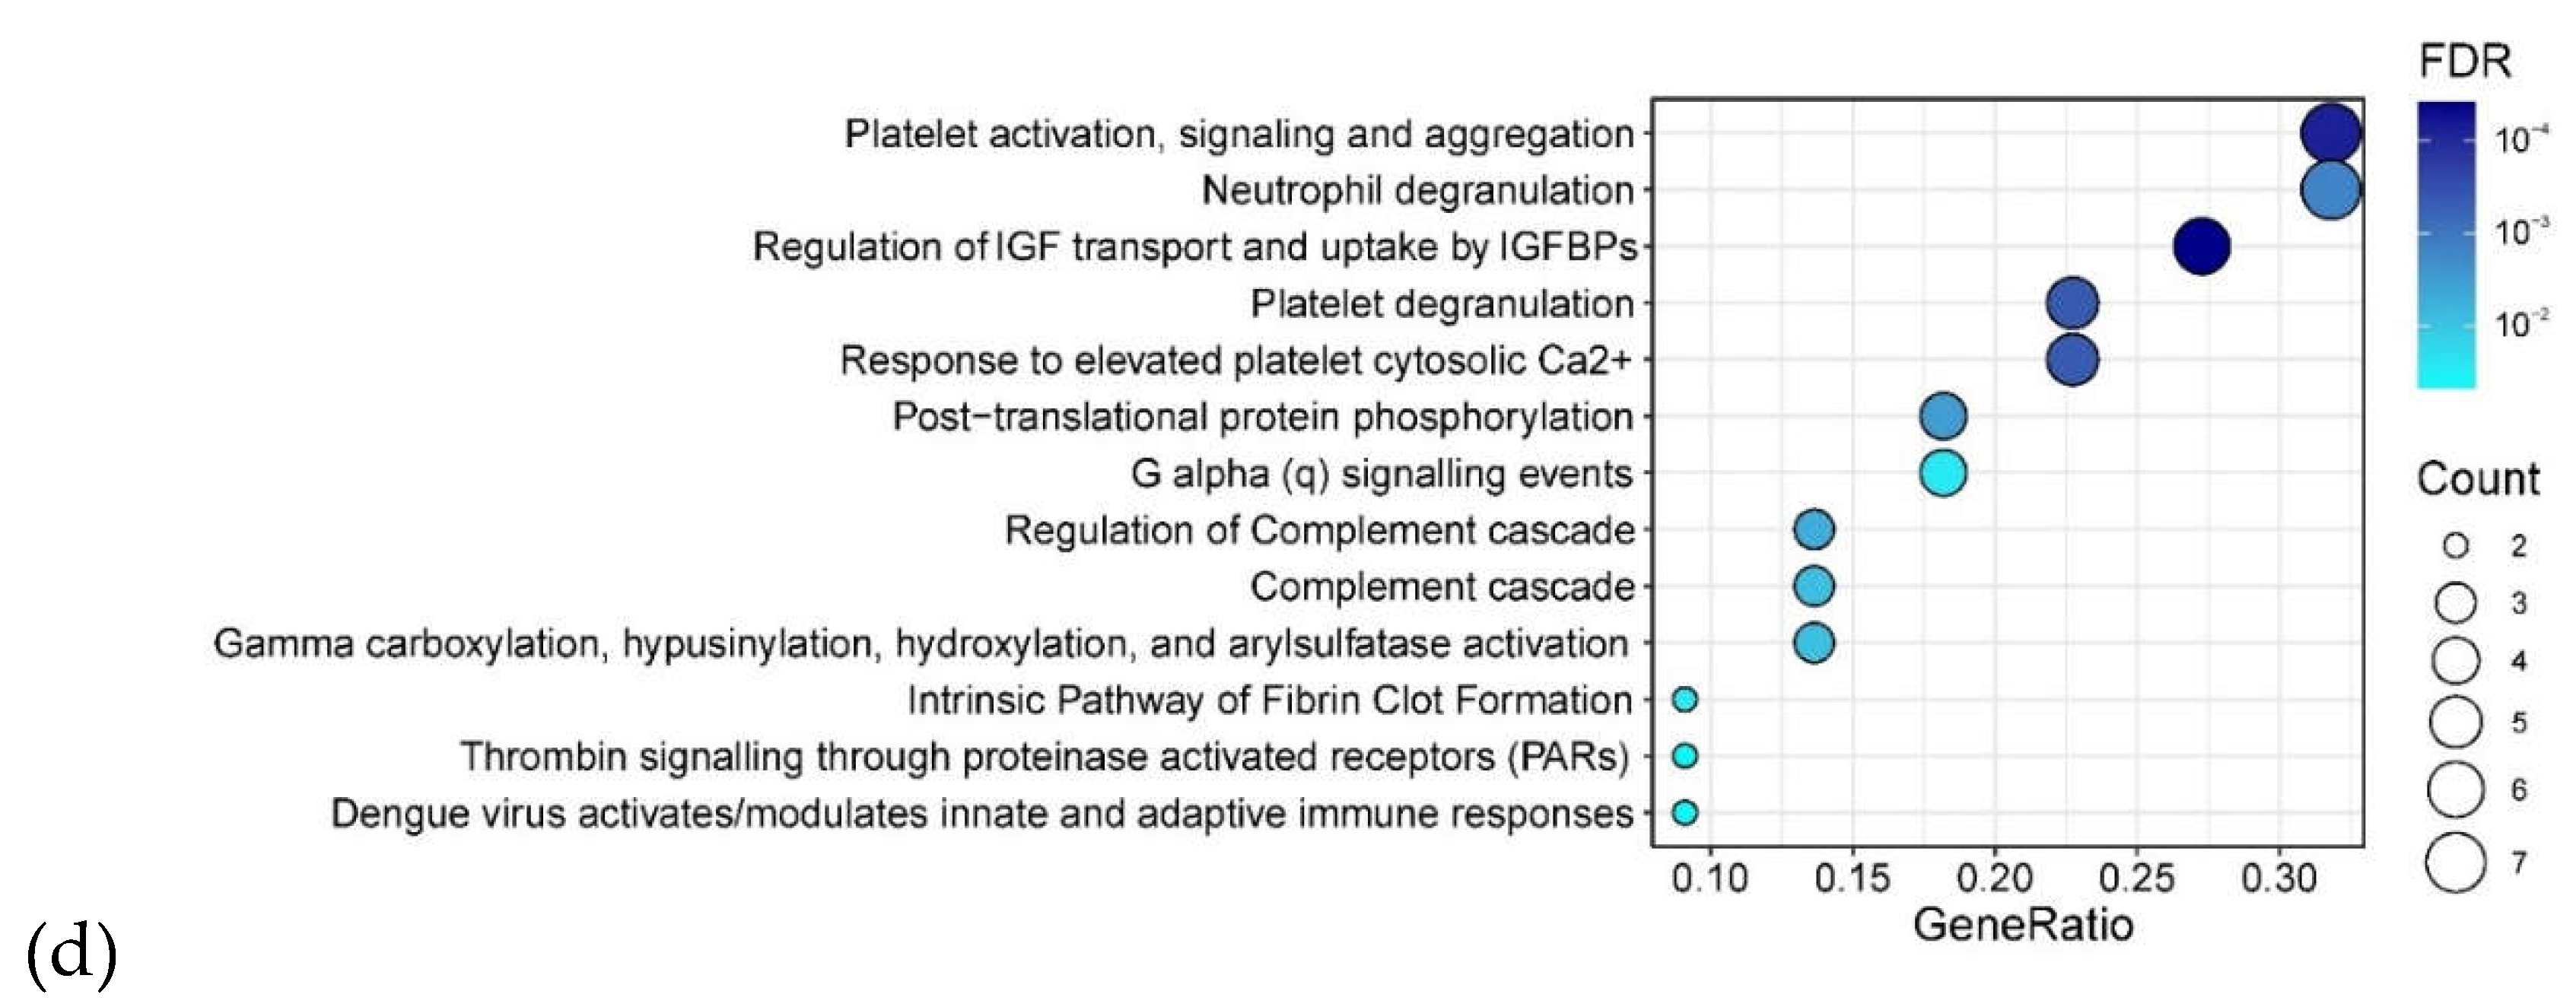
Figure 4.
Overlap of CVF DEPs across NILM comparisons and candidate SIL grade markers (R > 0.5, p < 0.001). The UpSet-style plot shows intersections of DEPs identified in comparisons of each lesion group (IDC, LSIL, HSIL, SCC) against NILM, together with SIL grade markers. KRT2 was the only protein shared across all comparisons, whereas SCC had the largest set of unique markers (47 proteins). Set size indicates the number of proteins per comparison; the matrix below indicates which comparisons contribute to each intersection.
Figure 4.
Overlap of CVF DEPs across NILM comparisons and candidate SIL grade markers (R > 0.5, p < 0.001). The UpSet-style plot shows intersections of DEPs identified in comparisons of each lesion group (IDC, LSIL, HSIL, SCC) against NILM, together with SIL grade markers. KRT2 was the only protein shared across all comparisons, whereas SCC had the largest set of unique markers (47 proteins). Set size indicates the number of proteins per comparison; the matrix below indicates which comparisons contribute to each intersection.
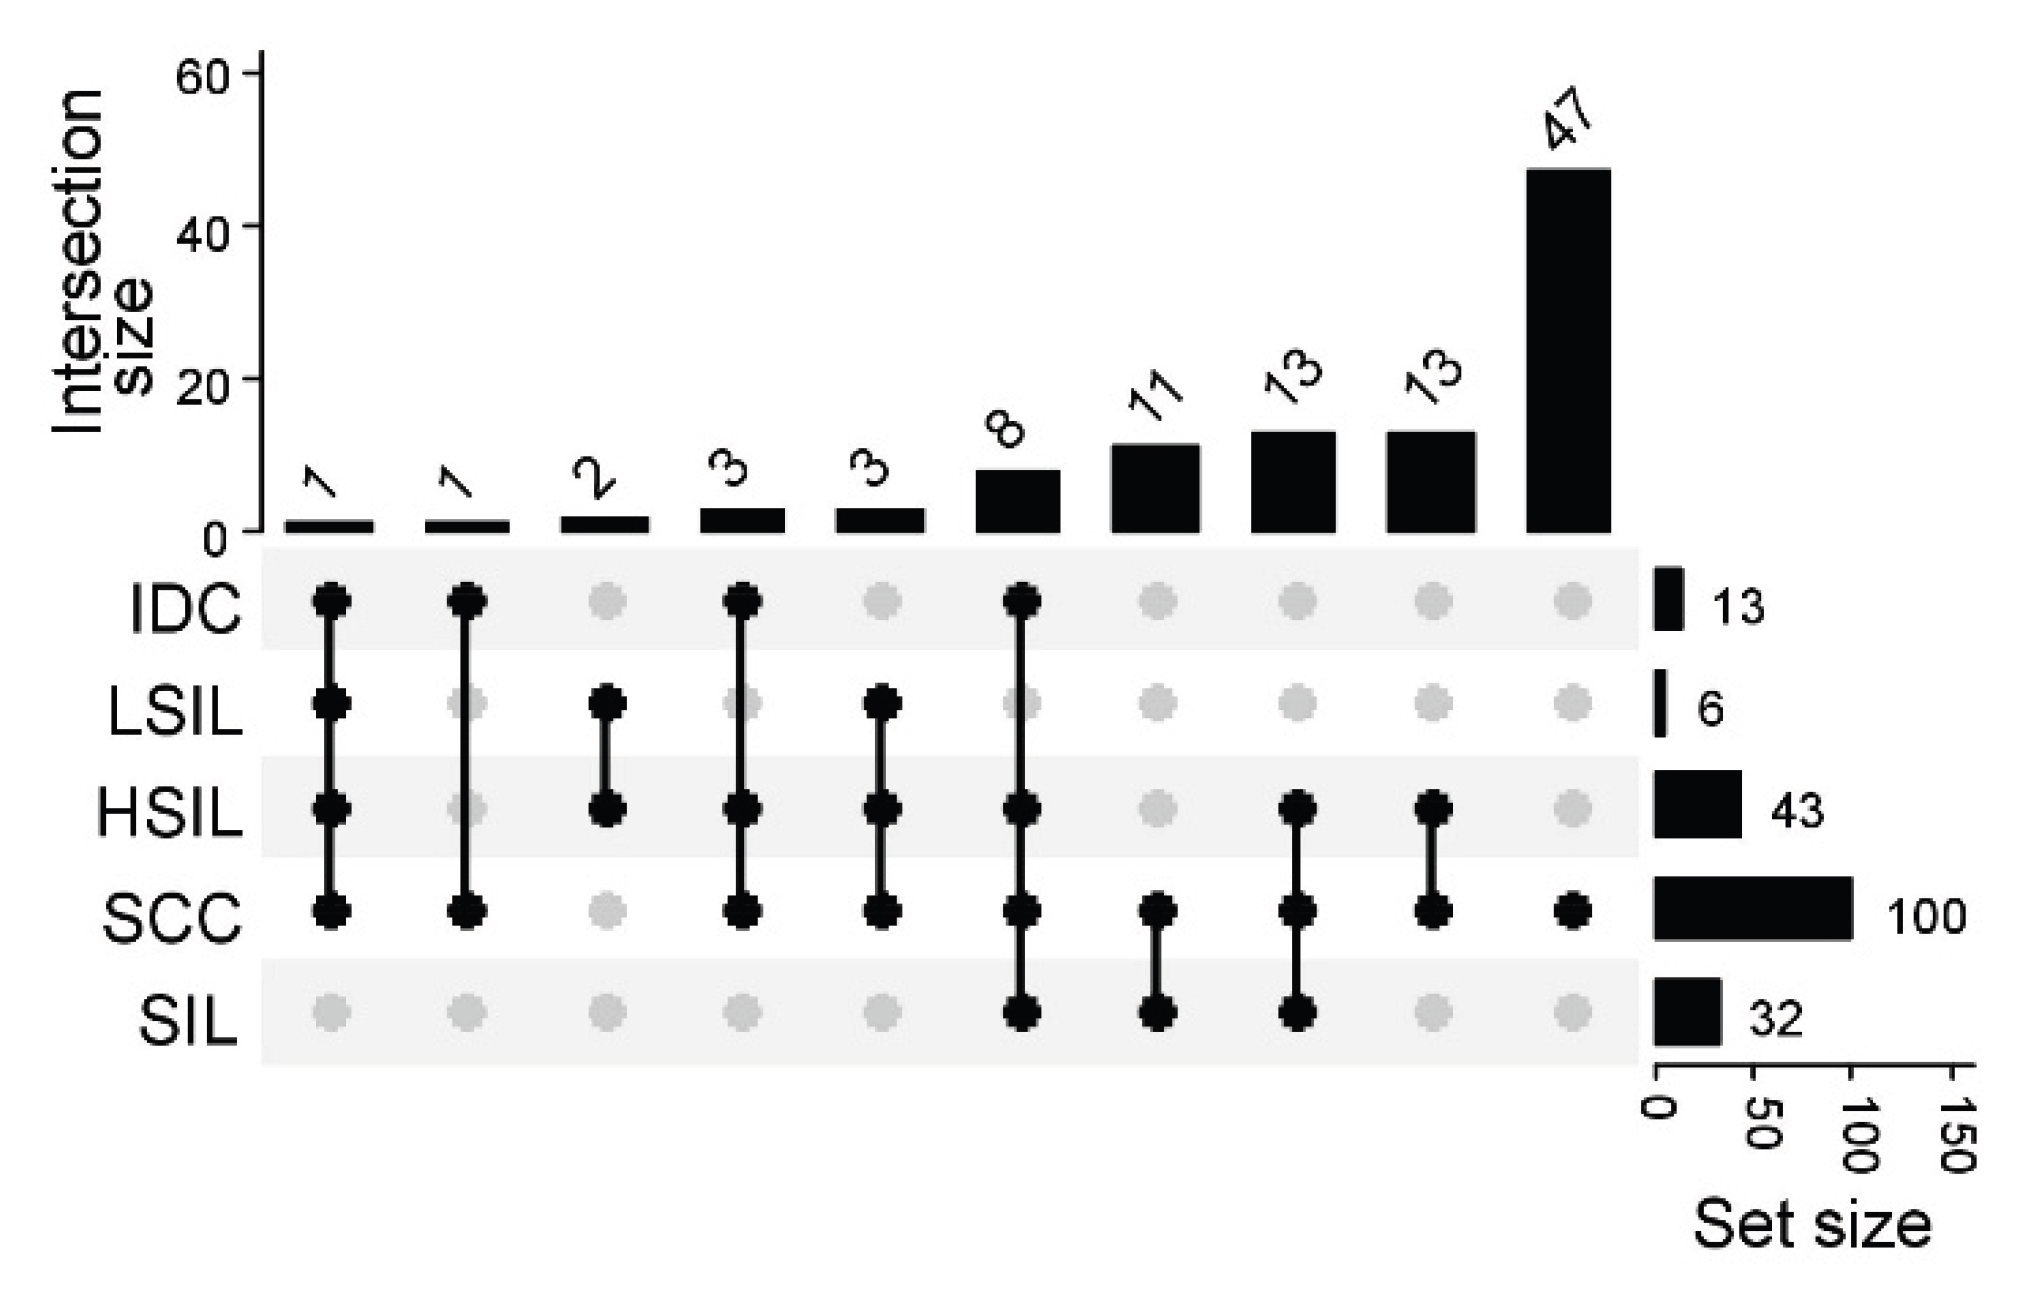

Table 1.
Proteins with |R| > 0.5 (p < 0.001) correlated with SIL grade: names and gene IDs, correlation coefficient R, significance coefficient, and fold changes of median protein levels in LSIL, HSIL, and SCC relative to NILM. Fold-change values with statistical significance (p < 0.05) are shown in bold.
Table 1.
Proteins with |R| > 0.5 (p < 0.001) correlated with SIL grade: names and gene IDs, correlation coefficient R, significance coefficient, and fold changes of median protein levels in LSIL, HSIL, and SCC relative to NILM. Fold-change values with statistical significance (p < 0.05) are shown in bold.
| Names | Gene ID | R | P | NILM vs LSIL | NILM vs HSIL | NILM vs SCC |
| Immunoglobulin heavy constant mu | IGHM | 0.55 | <0.001 | 2.11 | 4.48 | 14.08 |
| Angiotensinogen | AGT | 0.53 | <0.001 | 1.46 | 4.32 | 17.03 |
| Granulins | GRN | -0.56 | <0.001 | 0.75 | 0.37 | 0.23 |
| Inter-alpha-trypsin inhibitor heavy chain H1 | ITIH1 | 0.53 | <0.001 | 3.73 | 5.63 | 12.9 |
| Phosphoglycerate mutase 1 | PGAM1 | 0.56 | <0.001 | 1.2 | 2.64 | 8.35 |
| Apolipoprotein A-I | APOA1 | 0.54 | <0.001 | 1.85 | 4.46 | 20.2 |
| Tripartite motif-containing protein 29 | TRIM29 | -0.63 | <0.001 | 0.73 | 0.31 | 0.18 |
| Aminopeptidase B | RNPEP | 0.55 | <0.001 | 1.49 | 3.56 | 8.18 |
| Eukaryotic translation initiation factor 5A-2 | EIF5A2 | 0.51 | <0.001 | 1.42 | 3.62 | 5.62 |
| Alpha-1-antitrypsin | SERPINA1 | 0.55 | <0.001 | 1.76 | 3.09 | 7.45 |
| Thioredoxin domain-containing protein 17 | TXNDC17 | 0.57 | <0.001 | 1.88 | 3.43 | 5.81 |
| Peroxiredoxin-5, mitochondrial | PRDX5 | 0.53 | <0.001 | 2.27 | 2.72 | 7.33 |
| Mitogen-activated protein kinase 1 | MAPK1 | 0.51 | <0.001 | 1.5 | 2.5 | 5.61 |
| Alpha-actinin-4 | ACTN4 | 0.52 | <0.001 | 1.7 | 2.47 | 3.28 |
| Proteasome subunit alpha type-3 | PSMA3 | 0.55 | <0.001 | 1.77 | 4.83 | 9.7 |
| Low molecular weight phosphotyrosine protein phosphatase | ACP1 | -0.58 | <0.001 | 0.76 | 0.39 | 0.36 |
| Eukaryotic translation initiation factor 5A-1-like | EIF5AL1 | 0.55 | <0.001 | 1.51 | 3.62 | 5.42 |
| Insulin-like growth factor-binding protein 2 | IGFBP2 | 0.57 | <0.001 | 1.23 | 2.35 | 6.15 |
| Kininogen-1 | KNG1 | 0.58 | <0.001 | 1.59 | 2.83 | 7.98 |
| Eukaryotic translation initiation factor 5A-1 | EIF5A | 0.55 | <0.001 | 1.51 | 3.62 | 5.42 |
| Alpha-1-acid glycoprotein 2 | ORM2 | 0.53 | <0.001 | 1.46 | 2.79 | 9.38 |
| Protein AHNAK2 | AHNAK2 | -0.61 | <0.001 | 0.64 | 0.57 | 0.28 |
| Carboxypeptidase N subunit 2 | CPN2 | 0.52 | <0.001 | 2.12 | 1.79 | 6.4 |
| Sciellin | SCEL | -0.52 | <0.001 | 0.79 | 0.54 | 0.21 |
| Immunoglobulin heavy constant alpha 1 | IGHA1 | 0.55 | <0.001 | 1.11 | 1.31 | 2.71 |
| Complement C4-A | C4A | 0.55 | <0.001 | 1.61 | 1.98 | 3.85 |
| Neutrophil gelatinase-associated lipocalin | LCN2 | -0.54 | <0.001 | 0.59 | 0.66 | 0.34 |
| Vitamin D-binding protein | GC | 0.54 | <0.001 | 1.42 | 1.85 | 4.11 |
| Prothrombin | F2 | 0.51 | <0.001 | 1.3 | 1.82 | 5.81 |
| Serpin B9 | SERPINB9 | 0.52 | <0.001 | 1.33 | 1.61 | 3.92 |
| NPC intracellular cholesterol transporter 2 | NPC2 | -0.53 | <0.001 | 0.75 | 0.67 | 0.35 |
| Cystatin-A | CSTA | -0.50 | <0.001 | 0.95 | 0.57 | 0.1 |
Table 2.
CVF proteins selected as DEPs in the present study that showed statistically significant differences in the study by Starodubtseva et al., 2019 [18].
Table 2.
CVF proteins selected as DEPs in the present study that showed statistically significant differences in the study by Starodubtseva et al., 2019 [18].
| Comparison with NILM | Up-regulated, common | Down-regulated, common | Opposite direction |
| Cancer | ACTN4, HRG, IGHM, HPX, CFB, A2M, YWHAZ, APOA1, ORM1, FN1, GC, SERPINA1, A1BG, C4B, HP, C3, TKT, KNG1, SERPING1, IGHG3, ORM2, FGG, C4BPA | SLPI, IVL, ANXA2, CRNN, CDA, CRISP3, SPRR1A, LCN2, SPRR1B, PPL, CSTA | - |
| HSIL | IGHM, HPX, SERPINA1, C3, KNG1, ORM2 | PPL | - |
| LSIL | - | - | - |
Disclaimer/Publisher’s Note: The statements, opinions and data contained in all publications are solely those of the individual author(s) and contributor(s) and not of MDPI and/or the editor(s). MDPI and/or the editor(s) disclaim responsibility for any injury to people or property resulting from any ideas, methods, instructions or products referred to in the content. |
© 2026 by the authors. Licensee MDPI, Basel, Switzerland. This article is an open access article distributed under the terms and conditions of the Creative Commons Attribution (CC BY) license (http://creativecommons.org/licenses/by/4.0/).
Copyright: This open access article is published under a Creative Commons CC BY 4.0 license, which permit the free download, distribution, and reuse, provided that the author and preprint are cited in any reuse.