

Submitted:
06 November 2026
Posted:
16 November 2026
You are already at the latest version
Abstract
Bulk transcriptomic studies in colon cancer have primarily focused on molecular subtyping and prognostic gene signatures. While these approaches have refined tumor classification, they provide limited insight into the higher-order organization of oncogenic programs that shape tumor behavior. This study performs systems-level analysis to define the hierarchical architecture of transcriptional networks in colon cancer and identify functional axes that characterize tumor biology and may have clinical significance. Transcriptomics data were downloaded from TCGA-COAD for 458 colon cancer patients. We performed differential RNA-sequencing (DESeq2) analysis, followed by weighted gene co-expression network analysis (WGCNA). We integrated network topology, functional clustering and module organization to identify higher-order transcriptional axes. Transcriptomics data were integrated with clinical parameters. Tumor tissue showed proliferation-associated modules and enhanced immune network connectivity. Co-expression analysis identified four major functional axes defining its systems-level architecture: proliferative oncogenic signaling, metabolism, stromal organization and invasion, and immune responses. The proliferative and stromal axes were aassociated with advanced disease, whereas immune-related modules correlated with favorable clinical outcomes. The association was weak, but showed consistent directional pattern. Colon tumorigenesis appears to involve a coordinated transition between distinct network states characterized by the emergence of coordinated functional programs rather than isolated pathway activation. Systems-level immune and oncogenic polarization axes may provide a framework to understand clinical heterogeneity and to design biologically grounded network approaches.
Keywords:
colon
; cancer
; network
; systems
; hierarchy
1. Introduction
Colorectal cancer (CRC), which ranks the third in incidence and the second in mortality among cancers, continues to be a public health problem [1]. Consequently, efforts have been made to improve strategies for diagnosing and treating this form of cancer [2,3,4]. At the same time, a lot of research work has been conducted to understand the mechanisms of the disease, by studying tumors at the transcriptomic, epigenomic, proteomic, or metabolomic levels [5]; based on these advances, improvements and personalization of therapies were made.
Transcriptomics studies have highlighted genes with under- and overexpression, while contributing to the classification of CRC into molecular subtypes [6]. These studies have contributed both to the establishment of CMS (consensus molecular subtypes) and to the understanding of transcriptional differences between stages [7], morphological types [8], or forms with early or late onset [9]. Transcriptomic studies at the single-cell level have brought clarifications by highlighting cell types, as well as the relationships between them [10], and spatial transcriptomics has brought elements regarding the relative positioning of these cell types, important in understanding tumor biology.
Most transcriptomics studies have focused on differential expression or subtype stratification, whereas the hierarchical architecture of coordinated gene programs -and their integration with major oncogenic pathways- remain incompletely characterized. Understanding how transcriptional modules assemble into functional networks may provide a more integrative view of tumor biology, moving beyond isolated pathways toward larger transcriptional assemblies.
In the present study, we used a systems biology approach, WGCNA (weighted gene co-expression network analysis), to characterize the organization of gene co-expression modules into broader functional networks and to examine their associations with major oncogenic signaling pathways and with clinical characteristics. By identifying higher-order functional axes within this network architecture, we propose a systems-level framework for understanding the organizational principles in colon cancer and their possible relevance for the development of targeted therapeutic approaches.
2. Materials and Methods
The data used in this study were downloaded from The Cancer Genome Atlas (TCGA), representing a retrospective observational cohort of 458 patients with colon cancer (CC). RNA-seq gene expression data were obtained from The Cancer Genome Atlas Colon Adenocarcinoma (TCGA-COAD) project through the Genomic Data Commons (GDC) Data Portal (accessed in 02.07.2025). The TCGA-COAD expression dataset comprised 522 RNA-seq profiles, including 481 primary tumor and 41 normal tissue profiles. Among the tumor profiles, 458 unique patients were identified based on TCGA patient barcodes. All 41 normal tissue profiles were matched to tumor samples from the same patients.
Thirteen patients were represented by multiple tumor profiles, accounting for 36 profiles in total.
The inclusion criteria were a histopathological diagnosis of colon cancer and available mRNA-seq transcriptomic data.
Exclusion criteria concerned patients who had undergone previous oncological treatments (chemo-or radiotherapy), which could alter the transcriptomic profile of the analyzed samples. To avoid heterogeneity from differences in transcriptomic profile between colon and rectum, we included only patients with colon tumors.
Transcriptomic (RNA-seq) and clinical data were downloaded via the GDC Data Commons portal using the R package TCGAbiolinks [11]. Differential gene expression analysis between tumor tissues and adjacent normal tissues was performed with DESeq2 [12] with a design formula of ~ sample_type, while apeglm was applied for shrinkage of estimated log2 fold changes. Independent filtering based on mean normalized counts was applied, and p-values were adjusted for multiple testing using the Benjamini–Hochberg method. Genes with an adjusted p-value below 0.05 were considered differentially expressed. Variance-stabilized expression data were generated using DESeq2. Data manipulation was performed using dplyr, and graphical representations were generated using ggplot2 and pheatmap R packages.
Gene Co-Expression Networks (WGCNA) Analysis. For the construction of tumor tissue-specific gene co-expression networks, the Weighted Gene Co-expression Network Analysis (WGCNA) system biology technique was used [13]. The analyses were performed in the R language, using the WGCNA, dynamicTreeCut and dplyr packages. This method allows the identification of groups of genes with similar expression change patterns (modules).
Preprocessing of expression data. The gene expression matrix was filtered to remove genes with excessive missing values or low variability, as recommended by WGCNA protocols. The data was then normalized and transformed, resulting in the final expression matrix used for network analysis. Functional enrichment analyses of differentially-expressed genes were performed using Gene Ontology (GO) [14], KEGG pathway annotations [15], and the Hallmark gene sets from MSigDB [16].
Building the scale-free network. We calculated the Pearson correlation coefficient between all gene pairs to generate a similarity matrix. This was later transformed into an adjacency matrix by applying a power function (soft-thresholding). The optimal value of the power (soft-thresholding power) was selected so that the resulting network approximately complies with the scale-free topology property, characteristic of real biological networks. The adjacency matrix was converted to the Topological Overlap Matrix (TOM), which describes the topological similarity between gene-including indirect connections. Based on the distance derived from the TOM, the genes were grouped by hierarchical agglomeration, and the co-expression modules were defined using the DynamicTreeCut algorithm, which detects of clusters of variable sizes.
Eigengene modules and correlation with clinical variables. For each identified module, the Eigengene Module (ME) was calculated, representing the first major component of the gene expression in the module. Pearson's correlations between MEs and clinical traits were represented in the form of module-trait correlation maps, which allowed the identification of modules with biological and clinical relevance.
Identification of hub genes and export to Cytoscape. Hub genes were identified based on their node degree, defined as the number of connections of each gene within the displayed network. Genes were ranked according to their degree, and the 15-20 most highly connected genes were selected as hub genes within each module, depending on the module size.
The related co-expression networks were exported to Cytoscape for further topological visualization and analysis.
The graphical representation and analysis of the networks were performed in the R (RCy3 package) [17] and Cytoscape v. 3.10.3 [18] programs. The functional analysis of the modules was done using the ClueGO plug-in [19].
Higher-order groups of co-expression modules (meta-modules) were identified through network analysis in Cytoscape. The module-level network was organized using the Group Attributes Layout, based on the multilevel cluster attribute. Groups of modules displaying closely associated network patterns were subsequently interpreted as meta-modules.
Clinical variables were encoded as numeric traits (vital status, tumor laterality, and AJCC pathological stage) to enable correlation analyses. Gene-trait associations were calculated as Pearson correlations between gene expression values and each clinical variable, generating gene significance scores. These values were exported as node attributes and used in Cytoscape to visualize the relationship between individual genes and clinical parameters by color mapping within the network.
The visualization of heatmaps and correlations was made using the corrplot, ComplexHeatmap, and ggplot2 packages.
Statistical analysis. Differential mRNA expression and WGCNA analyses were performed using the R program, v. 4.3.2. In the case of data with normal or normalized distribution, the Pearson correlation coefficient was used, and in the case of those with non-normal distribution we used the Spearman coefficient. The calculation of the topological parameters of the nodes, the detection of the subnets, as well as the enrichment analysis at the level of the identified subnets was performed using the Cytoscape program, v. 3.10.3 (NetworkAnalyzer, MCode, and ClueGO pluggings)
Declaration of Generative AI Use. ChatGPT 4 (OpenAI) was used to assist in generating and refining R scripts for DESeq2 and WGCNA analyses and in drafting the corresponding methodological descriptions. The analytical objectives, gene selection criteria, and key methodological decisions were established by the authors. The scripts were executed, and the resulting outputs were examined and validated by the authors.
3. Results
Table 1 presents the demographic structure and clinicopathological characteristics of the patient group.
Differential gene expression analysis in tumor versus normal tissue (DESeq2) was performed, considering the overexpression threshold above the FoldChange of 2 or Log2(Fold Change)=1, and FDR (False Discovery Rate) below 0.05 (Table S1). The expression of 60664 genes, including microRNAs and long non-coding RNAs, was analyzed, of which 11184 were overexpressed and 4143 underexpressed (Tables S2 and S3, respectively). The results are presented in Table S1, as well as in Figure 1, for the first 50 differentially expressed genes.
Pathway analysis of differentially expressed genes was performed, using the Gene Ontology-Biological process and KEGG pathway classification. The results are presented in Figure 1 (b)-(e). The top 20 pathways are represented in each of the gene groups.
Overexpressed genes in tumors are located in a few pathways, ordered by the FDR (False Discovery Rate). In terms of GO-BP, genes are present at the level of nuclear division and organelles, antimicrobial humoral response, skin development, cell cycle, cell adhesion, chromosomal segregation, and DNA replication. In terms of KEGG pathways, overexpressed genes were enriched in pathways related to keratinization, cell cycle, inflammatory pathways, DNA replication, WNT pathway, cytoskeleton in myocytes, and p53 pathway.
Downregulated genes in tumor versus normal tissue have been represented in GO-BP pathways such as muscle contraction, membrane biology, immunoglobulin or leukocyte-mediated immunity, cellular calcium metabolism. The KEGG pathways were similar: calcium or hormonal signaling, circadian rhythm, adhesion molecules, cytoskeleton, bile or pancreatic secretion, lipolysis, response to drugs through cytochrome P450, and inflammatory pathways.
Next, we examined correlations among differentially expressed genes in tumor tissue to identify patterns of coordinated gene expression. Genes with a common coexpression pattern are considered to be part of the same biological functions. The study focused on the analysis of tumor tissue, but to highlight more clearly the changes in tumor tissue, a comparative analysis of normal tissue was also performed. We used the WGCNA (Weighted Gene Correlation Network Analysis) approach for both tumor and normal tissue. The top 5000 differentially expressed genes were used in the WGCNA analysis (Tables S4 and Table S5). Softpower 10 was chosen in the case of the normal tissue, respectively 8 in the case of the tumor tissue (Figure 2). The results are shown in Figure 3.
Gene coexpression networks are shown in Figure 3, for both normal and tumor tissue.
Pathway analysis of the identified modules was carried out in terms of GO-BP and KEGG pathways. The results are shown in Figure S1. The detailed characteristics of each WGCNA module are shown in Table 2 for normal and tumor tissue, for GO functions only
In normal tissue (Table 2 and Figure 2 A), the existence of 20 modules was recorded. Four of these modules were related to cellular metabolism, including the response to ions and noxious substances (the brown, magenta, yellow and gray modules), 5 modules were connected with different cellular functions, such as membrane biology, secretion, cell adhesion, migration or regulation of the cytoskeleton (turquoise, blue, cyan, green and green-yellow modules), one module with a role in the cell cycle (the black module) and two modules with a role in neuron biology (midnightblue and light yellow). There were also 7 modules with an immune role, of which 3 modules of innate defense (salmon, red, and purple), and 4 with a role in adaptive immunity (tan, light cyan, light green, and pink)
In tumor tissue (Table 2 and Figure 2 B), there were 16 modules, four of which were related to different proliferative functions such as purine and pyrimidine metabolism, chromatin condensation, DNA repair or cell cycle (purple, green-yellow, pink and salmon modules, respectively); there was a module with a metabolic role (turquoise), 3 modules connected with cell adhesion, migration, regulation of the extracellular matrix (tan, blue and brown modules), a module with a role in differentiation (gray module), as well as a number of 6 immune modules, 3 with a role in innate defense (midnight blue, yellow and magenta) and 3 related to adaptive immunity (red, black and cyan).
To study the interaction between modules and their organization at a higher hierarchical level, the eigengene of each module was calculated, and the correlations between the eigengenes for the two types of tissue were analyzed. The graphs reproduce the correlations presented in the WGCNA networks (Figure 2 A, B), but keep only the significant correlations, with the Pearson coefficient above 0.65. The results are summarized in Figure 4.
In normal tissue, significant connectivity can be observed between modules with a role in cellular functions and between them and those with a metabolic role. The immune modules have limited connections between the adaptive modules and separately between the innate modules. The turquoise and blue modules occupy central positions in the network.
In tumor tissue, a connection of proliferation-associated modules with the turquoise module, of modules associated with migration and adhesion, also through the turquoise module, as well as significant connectivity between immune modules, both adaptive and innate, is observed.
Overall, the tumor tissue exhibits a more densely interconnected network of module eigengenes (MEs) compared with normal tissue, suggesting greater coordination among distinct biological processes (Figure 4B), whereas, in normal tissue, the ME network appears considerably more fragmented (Figure 4A), suggesting a greater degree of functional independence among cellular processes in normal colonic tissue.
A multilevel structure can be observed in Figure 2, where different modules aggregate to form super-clusters (meta-modules). The existence of the following super-clusters has been observed in these networks, which is summarized in the module eigengenes correlation from Figure 4 C and D.
In normal tissue (Figure 2 A): two super-clusters with a role in membrane biology, secretion, cytoskeleton and motility, cell adhesion, both of which are associated with an immune module (turquoise-blue-salmon, respectively turquoise-blue-red); a super-cluster with a role in metabolism, epithelial adhesion, membrane biology (brown-green-magenta-cyan); two independent clusters with a role in metabolism (yellow, gray), and two immune, innate and adaptive superclusters (pink and purple modules, and light cyan, gray60, light green, respectively). Correlations were observed between these meta-modules, with metabolic and immune clusters showing coordinated associations with the membrane- and cytoskeleton-related assemblies.
In the tumor tissue (Figure 2 B), clustering of proliferation-associated modules was observed, in groups of two (salmon-purple and pink - green-yellow, respectively); they correlate with the turquoise module (metabolic), with a role of hub. Modules related to motility, adhesion, and extracellular matrix (brown, green, tan, and blue modules) were associated in a supercluster. The immune modules form a single super-cluster, except for the black one, adaptive, separate, but with strong connections with the other immune modules. This immune meta-module is correlated with the elements of the adhesion and migration meta-module.
Next, gene-level correlations with the main clinical parameters (stage, vital status, laterality), as well as with the determined gene expression data, were analyzed. This representation illustrates how clinically relevant transcriptional signals are distributed across genes within the module. The results are presented in Figure 5.
There were a number of 5 overexpressed modules (purple, salmon, green-yellow, pink-proliferation-related, and turquoise-metabolic-) and 10 under-expressed-immune and stroma-invasion-related- (Figure 5 A), compared to normal tissue. The over-expressed modules are related to proliferation and tumor metabolism. Immune clusters are downregulated in tumor tissue.
It can be seen (Fig.5 B) that the stromal supercluster modules (blue-brown-tan-green), turquoise, as well as proliferation clusters (greenyellow-pink and salmon-purple) correlate positively with the stage, while the immune cluster modules negatively correlate with this parameter. In the meantime, the Spearman correlation coefficients, between 0.16 and -0.16, show correlations of weak intensity.
Regarding the correlation with vital status (Fig.5 C), there are positive correlations with the status of deceased at the level of the stromal- brown-green-tan-blue cluster, as well as the turquoise module. The purple-salmon immune and proliferative modules have negative correlations with this parameter, while the greenyellow-pink group has no significant correlations with vital status. The correlation ratios between -0.08 and 0.08 also show weak correlations.
The correlation with the laterality of the tumor is stronger, with Spearman coefficients between -0.7 and 0.31 (Figure 5 D), the blue, tan, green, green, yellow, pink modules, as well as five of the immune modules being associated with the right location, while the brown, turquoise, black (immune) modules, as well as the purple-salmon group, are associated with the left location.
The correlation with the elements of evolution and negative prognosis of the tumor is weak, but concordant; the modules with positive correlation with the stage generally correlate with the negative vital prognosis (Figure 5 B, C), most of them also being overexpressed in tumor tissue (Figure 5 A).
A different pattern of activation and correlations of gene networks was observed in tumors compared to normal. In the following step, we sought an explanation of this fact. We asked whether the analyzed modules are connected to different signaling pathways with importance in the onset and maintenance of the tumor process, which would likely imply their regulation by these pathways and might therefore provide an explanation for their organization and expression. To clarify this, a correlation analysis between modules and the main pathway genes was performed. Given that each module contains tens to hundreds of genes (Table 2), for the construction of the correlation network, only the hub genes of each module were selected, 10-15 per module, depending on the module size.
Only a fraction of the signaling pathway genes are present in the co-expression (WGCNA) network (Figure 2). Although other important genes are differentially expressed in tumors, they are not part of this network. Therefore, to establish correlations between them and the network modules in tumor tissue, an analysis of simple correlations (Pearson) between their tissue level determined by DESeq2 analysis (Table S1) and the tissue levels of the main hub genes of the WGCNA modules was performed. The resulting network, +with expression data, is shown in Figure 6.
Hub genes within WGCNA modules have significant correlations with pathway genes. Moreover, correlations are not random, but follow a systematic disposition according to certain patterns:
-the elements of the TGFβ, Hippo (LATS1, LATS2) or Hedgehog (Hh) pathways, as well as genes associated with invasiveness (MMP2, MMP9, CXCR4, CXCL12, SNAI1, TWIST) correlate positively with the stromal super-cluster (adhesion, motility, fibrosis), and, some of them, negatively with the turquoise module (metabolic).
-genes in the proliferative pathways - RAS-ERK, PIK3CA or WNT pathway, behave antagonistically with the turquoise module; most of them positively correlate with the pink module (associated with proliferation); in the meantime, some genes of the pathway (MAPK3, AKT1) have the opposite action.
-many other correlations can be seen, such as between intestinal-specific transcription factors CDX1 and the turquoise module, CDX2 and magenta module, or between JAK-STAT genes and immune modules.
-as for the crosstalk of pathways as it is recorded in the analysis, negative correlations between pathways predominate, except for some positive correlations, such as KRAS-PIK3CA and KRAS-JAK2.
The expression data (Figure 6B) show that genes of the WNT pathways, and the cell cycle are constantly up-regulated, in concordance with the expression of the modules that they are connected with. Genes of the RAS, PIK3CA, TGFβ and Hh pathways are also mostly up-regulated, while Hippo pathway genes are down-regulated. The expression of TGFβ and Hh pathways contrasts with the expression of the stromal-invasion meta-module, which they seem to regulate, which is mostly down-regulated.
Finally, a model is proposed, that summarizes the results of the study (Fig 7).
It can be seen (Figure 7 A) that there is a modular organization in tumors, with the four functional axes, comprising a meta-module and the corresponding signaling pathways, which likely regulate it. There tends to be a separation between these functional axes. In the meantime module composition, as well as correlations between them , change from cell biology-associated functions to proliferative and invasion-associated organization. This may suggest a role of the respective pathways in the network reconfiguration.
Discussion.
With the expansion of transcriptomic profiling, gene-expression analysis has been widely applied in colorectal cancer for diagnostic stratification, prognostic modeling, and molecular classification [20,21,22]. Beyond differential expression and subtype definition, several studies have explored molecular networks in relation to mutational landscapes and oncogenic pathway activation [23], while others have investigated the structure and clinical relevance of transcriptional networks [24,25].
Weighted gene co-expression network analysis (WGCNA) extends these approaches by analyzing coordinated gene-expression patterns and organizing them into biologically meaningful modules. By focusing on higher-order transcriptional assemblies rather than individual genes, WGCNA enables the identification of systems-level programs potentially linked to tumor behavior and clinical outcome [26].
In this context, we approached colon cancer as a reconfigured transcriptional network state. By integrating co-expression modules with oncogenic signaling and clinical parameters, we aimed to move beyond gene-centric interpretation and propose a systems-level perspective on tumor organization and progression.
The results of differential expression analysis showed an overexpression of genes located in proliferative and inflammatory pathways, along with a downregulation of genes involved in normal cellular biology processes, in tumor tissue compared to normal tissue.
The WGCNA analysis carried out further showed an increase in the number of proliferation-associated modules from 1 in healthy tissue to 4 in tumor tissue, a decrease in the number of metabolic modules and in various cellular processes; in the meantime, the fragmented network that links modules in normal tissue (Figure 4A) is replaced by a much more interconnected network, with a clearer modularization in the tumor tissue (Figure 4B). There is also a much stronger correlation between immune modules, both innate and adaptive, in tumor tissue than in normal tissue (Figure 3 and Figure 4, Table 2). This last observation is consistent with a previous study in which we showed this type of change in tumors [27] and is most likely related to the activation of the immune response in tumors. The fact that there are strong correlations between the elements of the immune response in CC, but that these modules are relatively separate from other module types, would indicate a type of infiltrated but cold tumors [28].
The modules exhibited a higher level of organization (meta-modules), both in normal and tumor tissue. In normal tissue (Figure 2A), two super-clusters related to membrane biology, secretion, cytoskeleton, and motility were observed; some immune modules have an intricate disposition in these clusters. Overall, meta-modules in normal tissue seem to be involved in normal cell biology processes, and there is only one module related to proliferation.
In tumors, there are two super-clusters involved in proliferation, connected through a metabolic module. There is also a super-cluster stroma- and invasion-related, and an immune super-cluster with tighter connections than in the normal tissue. Overall, gene clusters look reorganized around tumor proliferation and invasion (Figure 2B).
An explanation for this state was sought at the level of the oncogenic signaling pathways by analyzing their correlation with the highlighted WGCNA modules. The results showed four functional axes or programs in tumor tissue- the proliferation axis, which entails pathways like RAS-ERK, WNT, or PIK3CA, and subsequent proliferative modules, which oppose the metabolic axis, a stroma-invasion axis, subsequent to developmental pathways such as Hedgehog, Hippo, Notch, and TGFβ, and finally, an immune axis, connected to the JAK-STAT signaling (Figure 6A). This division in functional axes could have an importance in understanding the neoplastic development, as well as some therapeutic failures.
In the meantime, the study of the expression data shows that in tumor tissue, proliferative modules (pink, salmon, green-yellow, purple) are consistently up-regulated, while the stroma-invasion cluster is down-regulated (Figure 5 A). By contrast, pathway genes are inconsistently up-regulated, the only two pathways with overall increased expression being the WNT pathway and cell cycle (DESeq2 file-Table S1). This may signify that the tumoral process may depend only partially on the pathway activation, and the source for proliferation may be somewhere else, e.g. the downstream region of the cell cycle. The most overexpressed pathways are also the most mutated [23].
The correlation of the different modules with stage and outcome was analyzed (Figure 5 A-D). The association was weak, but consistent; the stromal-invasive cluster had reduced expression, it was associated with advanced stages and worse prognosis, proliferation clusters were up-regulated and associated with advanced stages but with better prognosis (salmon-purple) or with no association (pink-greenyellow); metabolic (turquoise) cluster was mainly up-regulated and associated with worse prognosis and late stages; finally, all immune clusters were correlated with early stages, better outcome and had reduced expression in tumor tissue (Figure 5 A-C).
While bulk transcriptomics has successfully classified colorectal cancer into molecular subtypes, less attention has been given to the coordinated network architecture underlying oncogenic signaling programs. By applying weighted gene co-expression network analysis, our study moves beyond subtype assignment and identifies four major functional axes that integrate proliferative signaling, metabolic reprogramming, developmental/stromal activation, and immune organization. This network-centered model provides a systems-level view of tumor biology, linking oncogenic pathways with clinical parameters such as stage, survival, and tumor sidedness.
Compared with molecular classification studies, including the Consensus Molecular Subtypes (CMS) [6], which have significantly refined understanding of colorectal cancer heterogeneity by stratifying tumors into transcriptionally distinct categories, our study focused on the internal organization of the transcriptomic landscape, independent of predefined subtype boundaries. Notably, the functional axes described here partially resonate with previously defined CMS phenotypes, particularly regarding immune, proliferative, or stromal programs. However, by shifting the focus from subtype allocation to network organization, our study provides a complementary systems-level perspective on colon cancer heterogeneity. From this perspective, CMS would reflect phenotypic endpoints of deeper network configurations.
The identification of coordinated oncogenic and stromal-immune axes suggests that colon cancer progression involves not only individual pathways but also their integration into larger, interconnected functional systems. Therapeutic strategies targeting single nodes may therefore be insufficient, whereas axis-based stratification could enable rational combination therapies, such as proliferative pathway inhibition combined with metabolic targeting, or stromal pathway blockade combined with immune activation.
A limitation of the study is the modest magnitude of clinical correlations. However, the consistent directionality across axes supports the biological validity of the network model. The exploratory nature of the clinical correlations and their modest effect sizes highlight the need for validation in independent cohorts and in more clinically homogeneous populations. In addition, the global network architecture itself requires confirmation through analyses of larger datasets, where potential variations in network organization or in the predominance of specific functional axes across patient subgroups could be further characterized.
Another limitation relates to the use of bulk transcriptomic data, which, while enabling large-scale gene expression analysis, does not allow precise attribution of transcriptional signals to specific cell populations. Consequently, the biological interpretation of certain modules remains inferential. In our study, the green-blue-tan-brown supercluster was interpreted as a stromal-tumor interaction program rather than a purely stromal compartment. Its strong associations with extracellular matrix remodeling, adhesion, contractility, and mesenchymal differentiation suggest a fibroblast-rich microenvironment. However, its robust positive correlations with oncogenic developmental pathways (Hedgehog, Hippo, TGF-β, Notch), cell cycle-related modules and prognostic parameters indicate active engagement of tumor cells in this program. The concurrent correlations with immune modules further support the interpretation of this supercluster as a dynamic invasive niche, integrating cancer-associated fibroblasts, immune components, and tumor cells. While this interpretation is biologically plausible, its precise cellular composition cannot be resolved without single-cell or spatial transcriptomic approaches.
In conclusion, this exploratory analysis identifies coherent groups of co-expressed transcripts related to proliferation, metabolism, extracellular-matrix organization and immunity in TCGA colon cancer. Their higher-order associations offer hypotheses about tissue-level transcriptional coordination, but the distinction between true within-cell regulatory changes and differences in cellular composition remains unresolved. Reanalysis using unbiased gene filtering, formal tumor–normal network comparison and independent validation will be needed to establish the robustness and clinical relevance of this framework.
By integrating module organization with oncogenic pathways and clinical parameters, this study provides a framework for interpreting tumor biology from a network perspective, potentially facilitating the identification of biologically coherent targets and therapeutic strategies aimed at coordinated transcriptional programs rather than individual genes.
Supplementary Materials
Table S1: Complete DESeq2 differential expression analysis results; Table S2: Upregulated genes in colon tumor tissue compared with normal tissue; Table S3: Downregulated genes in colon tumor tissue compared with normal tissue; Table S4: Genes in each WGCNA module-normal tissue; Table S5: Genes in each WGCNA module-tumor tissue; Figure S1: Functional analysis of WGCNA modules.
Author Contributions
Conceptualization, Investigation, O.F.; Methodology, I B-N and O.F.; Supervision, V.C.; Validation, I B-N.; Visualization, O.F.; Writing- original draft, O.F.; Writing- review and editing, V.C. and I B-N.; All authors have read and agreed to the published version of the manuscript.
Funding
This research received no external funding.
Institutional Review Board Statement
The study was conducted in accordance with the Declaration of Helsinki.As the data were obtained from publicly accessible databases and werefully deidentified data, in accordance with the U.S. Department of Health and Human Services regulatory definition of human subjects research (45 CFR § 46.102(e)(1)), the research was exempted from ethics committee review.
Informed Consent Statement
An informed consent statement was exempted for this study, as the datawere obtained from publicly accessible databases and were fullydeidentified, in accordance with the U.S. Department of Health and Human Services regulatory definition of human subjects research (45 CFR § 46.102(e)(1)).
Data Availability Statement
The data that support the conclusion of this study will be made available from the authors on reasonable request.
Acknowledgments
During the preparation of this manuscript, the authors used ChatGPT 4 (OpenAI) to assist in developing R scripts for the DESeq2 and WGCNA analyses and in drafting the corresponding methodological descriptions. The research objectives, analytical decisions, validation of the analyses, interpretation of the results, and scientific conclusions remained the responsibility of the authors. All AI-assisted content was critically reviewed by the authors, who take full responsibility for the content of this publication. The authors would like to thank mr. Stefan Popa for his valuable assistance in the preparation and graphical presentation of the figures.
Conflicts of Interest
The authors declare that there is no conflict of interest.
References
- Sung, H.; Ferlay, J.; Siegel, R.L.; Laversanne, M.; Soerjomataram, I.; Jemal, A.; Bray, F. Global cancer statistics 2020: GLOBOCAN estimates of incidence and mortality worldwide for 36 cancers in 185 countries. CA Cancer J. Clin. 2021, 71(3), 209–249. [Google Scholar] [CrossRef] [PubMed]
- Yamaguchi, M.; Okamura, S.; Yamaji, T.; Iwasaki, M.; Tsugane, S.; Shetty, V.; Koizumi, T. Plasma cytokine levels and the presence of colorectal cancer. PLoS ONE 2019, 14(3), e0213602. [Google Scholar] [CrossRef] [PubMed]
- Behrouzian Fard, G.; Amirfakhrian, R.; Hosseini Bafghi, M.; Gholamin, M. Non-invasive colorectal cancer screening methods: focusing on diagnostic genetic and epigenetic markers. Cancer Cell Int. 2025, 26(1), 3. [Google Scholar] [CrossRef] [PubMed]
- Xie, Y.H.; Chen, Y.X.; Fang, J.Y. Comprehensive review of targeted therapy for colorectal cancer. Sig Transduct. Target Ther. 2020, 5, 22. [Google Scholar] [CrossRef] [PubMed]
- West, N.R.; McCuaig, S.; Franchini, F.; Powrie, F. Emerging cytokine networks in colorectal cancer. Nat. Rev. Immunol. 2015, 15(10), 615–29. [Google Scholar] [CrossRef] [PubMed]
- Kantha, A.; Das, D.; Pai, E.; Kumar, T.; Pandey, M. Consensus Molecular Subtypes (CMS) Classification: a progress towards Subtype-Driven treatments in colorectal cancer. World J. Surg. Oncol. 2025, 24(1), 1. [Google Scholar] [CrossRef] [PubMed]
- Kamal, Y.; Schmit, S.L.; Hoehn, H.J.; Amos, C.I.; Frost, H.R. Transcriptomic Differences between Primary Colorectal Adenocarcinomas and Distant Metastases Reveal Metastatic Colorectal Cancer Subtypes. Cancer Res. 2019, 79(16), 4227–4241. [Google Scholar] [CrossRef] [PubMed]
- Budinská, E.; Hrivňáková, M.; Ivkovic, T.C.; Madrzyk, M.; Nenutil, R.; Bencsiková, B.; Al Tukmachi, D.; Ručková, M.; Zdražilová Dubská, L.; Slabý, O.; Feit, J.; Dragomir, M.P.; Borilova Linhartova, P.; Tejpar, S.; Popovici, V. Molecular portraits of colorectal cancer morphological regions. Elife 2023, 12, RP86655. [Google Scholar] [CrossRef]
- Madhagi, H. Integrative transcriptomics analysis of early-onset and late-onset colorectal cancer. IMU 2023, 43, 101408. [Google Scholar] [CrossRef]
- Peng, T.; Zhan, Q. Single-cell integration analysis reveals molecular signatures of the tumor microenvironment in early-onset colorectal cancer. npj Precis. Onc 2025, 9, 360. [Google Scholar] [CrossRef] [PubMed]
- Colaprico, A.; Silva, T.C.; Olsen, C.; et al. TCGAbiolinks: an R/Bioconductor package for integrative analysis of TCGA data. Nucleic Acids Res. 2016, 44(8), e71. [Google Scholar] [CrossRef] [PubMed]
- Love, M.I.; Huber, W.; Anders, S. Moderated estimation of fold change and dispersion for RNA-seq data with DESeq2. Genome Biol. 2014, 15(12), 550. [Google Scholar]
- Langfelder, P.; Horvath, S. WGCNA: an R package for weighted correlation network analysis. BMC Bioinform. 2008, 559. [Google Scholar] [CrossRef] [PubMed]
- Ashburner, et al. Gene ontology: tool for the unification of biology. Nat. Genet. 2000, 25(1), 25–9. [Google Scholar] [CrossRef] [PubMed]
- Kanehisa, M.; Furumichi, M.; Sato, Y.; Matsuura, Y.; Ishiguro-Watanabe, M. KEGG: biological systems database as a model of the real world. Nucleic Acids Res. 2025, 53, D672–D677. [Google Scholar] [CrossRef] [PubMed]
- Liberzon, A.; Birger, C.; Thorvaldsdóttir, H.; Ghandi, M.; Mesirov, J.P.; Tamayo, P. The Molecular Signatures Database (MSigDB) hallmark gene set collection. Cell Syst. 2015, 1(6), 417–425. [Google Scholar] [CrossRef] [PubMed]
- R Core Team. _R: A Language and Environment for. 2025. [Google Scholar] [CrossRef]
- Statistical Computing_. R Foundation for Statistical Computing Vienna, Austria. Available online: https://www.R-project.org/.
- Shannon, P.; Markiel, A.; Ozier, O.; Baliga, N.S.; Wang, J.T.; Ramage, D.; Amin, N.; Schwikowski, B.; Ideker, T. Cytoscape: a software environment for integrated models of biomolecular interaction networks. Genome Res. 2003, 13(11), 2498–504. [Google Scholar] [CrossRef] [PubMed]
- Bader, G.D.; Hogue, C.W.V. An automated method for finding molecular complexes in large protein interaction networks. BMC Bioinform. 2003, 4, 2. [Google Scholar] [CrossRef] [PubMed]
- Bindea, G.; Mlecnik, B.; Hackl, H.; Charoentong, P.; Tosolini, M.; Kirilovsky, A.; Fridman, W.H.; Pagès, F.; Trajanoski, Z.; Galon, J. ClueGO: a Cytoscape plug-in to decipher functionally grouped gene ontology and pathway annotation networks. Bioinformatics 2009, 25(8), 1091–3. [Google Scholar] [CrossRef] [PubMed]
- Wen, Q.; Han, S.; Cui, Y. Research progress of colorectal cancer in genomic and transcriptomic at multi-level. Front Genet. 2025, 16, 1533817. [Google Scholar] [CrossRef] [PubMed]
- Cai, L.; Guo, X.; Zhang, Y.; et al. Integrated analysis of single-cell and bulk RNA-sequencing to predict prognosis and therapeutic response for colorectal cancer. Sci. Rep. 2025, 15, 7986. [Google Scholar] [CrossRef] [PubMed]
- Joanito, I.; Wirapati, P.; Zhao, N.; Nawaz, Z.; Yeo, G.; Lee, F.; Eng, C.L.P.; Macalinao, D.C.; Kahraman, M.; Srinivasan, H.; Lakshmanan, V.; Verbandt, S.; et al. Single-cell and bulk transcriptome sequencing identifies two epithelial tumor cell states and refines the consensus molecular classification of colorectal cancer. Nat. Genet 2022, 54(7), 963–975. [Google Scholar] [CrossRef] [PubMed]
- Nunes, L.; Li, F.; Wu, M.; et al. Prognostic genome and transcriptome signatures in colorectal cancers. Nature 2024, 633, 137–146. [Google Scholar] [CrossRef] [PubMed]
- Mahajan, M.; Sarkar, A.; Mondal, S. Integrative network analysis of transcriptomics data reveals potential prognostic biomarkers for colorectal cancer. Cancer Med. 2024, 13(11), e7391. [Google Scholar] [CrossRef] [PubMed]
- Jeon, S.A.; Ha, Y.J.; Kim, J.H.; Kim, J.H.; Kim, S.K.; Kim, Y.S.; Kim, S.Y.; Kim, J.C. Genomic and transcriptomic analysis of Korean colorectal cancer patients. Genes Genom. 2022, 44(8), 967–979. [Google Scholar] [CrossRef] [PubMed]
- Farc, O.; Berindan-Neagoe, I.; Zaharie, F.; Budisan, L.; Zănoagă, O.; Cristea, V. Characterization of the immune response through cytokine profiling and correlational analysis in colorectal malignant tumors. Roum. Arch. Microbiol. Immunol. 2021, 80(4), 332–41. [Google Scholar] [CrossRef]
- Wu, B.; Zhang, B.; Li, B.; et al. Cold and hot tumors: from molecular mechanisms to targeted therapy. Sig Transduct. Target Ther. 2024, 9, 274. [Google Scholar] [CrossRef] [PubMed]
Figure 1.
(a) Heatmap of top 50 differentially expressed genes; (b-g) Pathway analysis of the top 50 differentially expressed genes. Regulation-Up-up-regulated in tumor compared to normal tissue; Down-down-regulated in tumor versus normal tissue; (b) KEGG analysis of the up-regulated genes; (c) KEGG analysis of the down-regulated genes; (d) GO-BP analysis of the up-regulated genes; (e) GO-BP analysis of the down-regulated genes. p-adjust-p-adjusted or FDR (False Discovery Rate) for each pathway.
Figure 1.
(a) Heatmap of top 50 differentially expressed genes; (b-g) Pathway analysis of the top 50 differentially expressed genes. Regulation-Up-up-regulated in tumor compared to normal tissue; Down-down-regulated in tumor versus normal tissue; (b) KEGG analysis of the up-regulated genes; (c) KEGG analysis of the down-regulated genes; (d) GO-BP analysis of the up-regulated genes; (e) GO-BP analysis of the down-regulated genes. p-adjust-p-adjusted or FDR (False Discovery Rate) for each pathway.
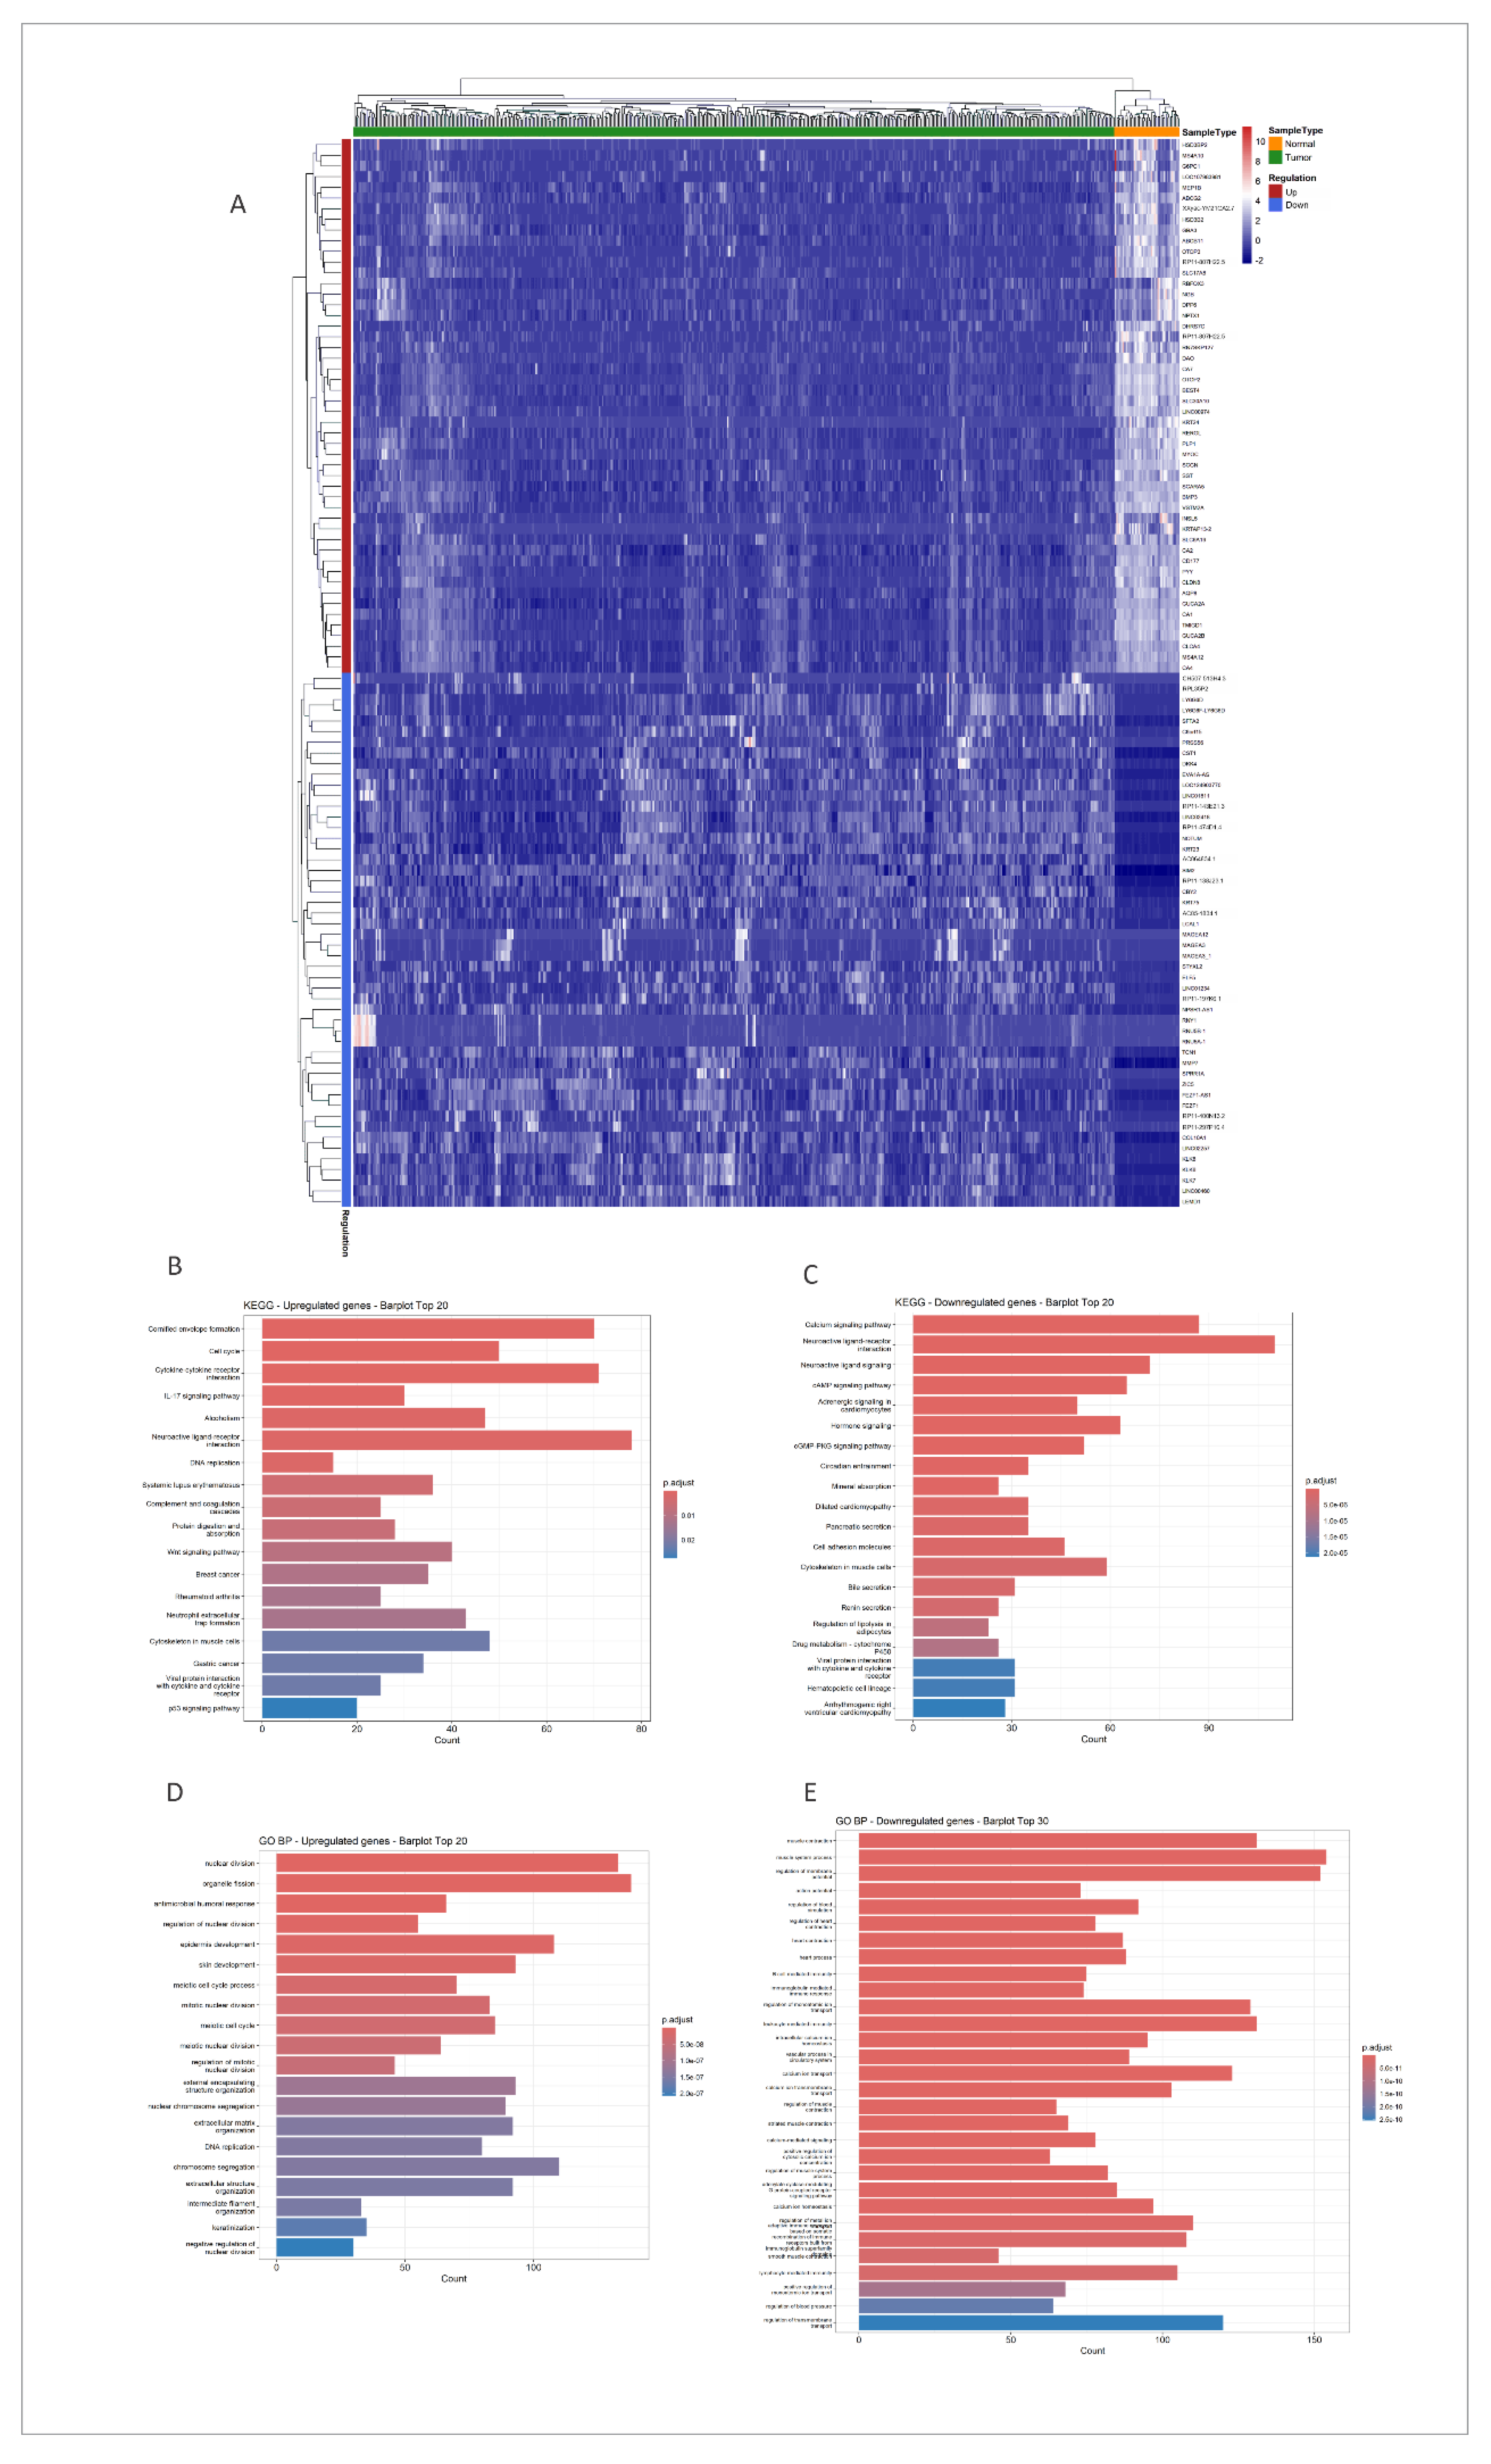
Figure 2.
Softpower selection and cluster dendrogram for normal and tumor tissue. (a) Softpower selection for normal tissue; (b) Softpower selection in tumor tissue; (c) Cluster dendrogram for normal tissue; (b) Cluster dendrogram for tumor tissue. Colors in dendrograms- module colors.
Figure 2.
Softpower selection and cluster dendrogram for normal and tumor tissue. (a) Softpower selection for normal tissue; (b) Softpower selection in tumor tissue; (c) Cluster dendrogram for normal tissue; (b) Cluster dendrogram for tumor tissue. Colors in dendrograms- module colors.
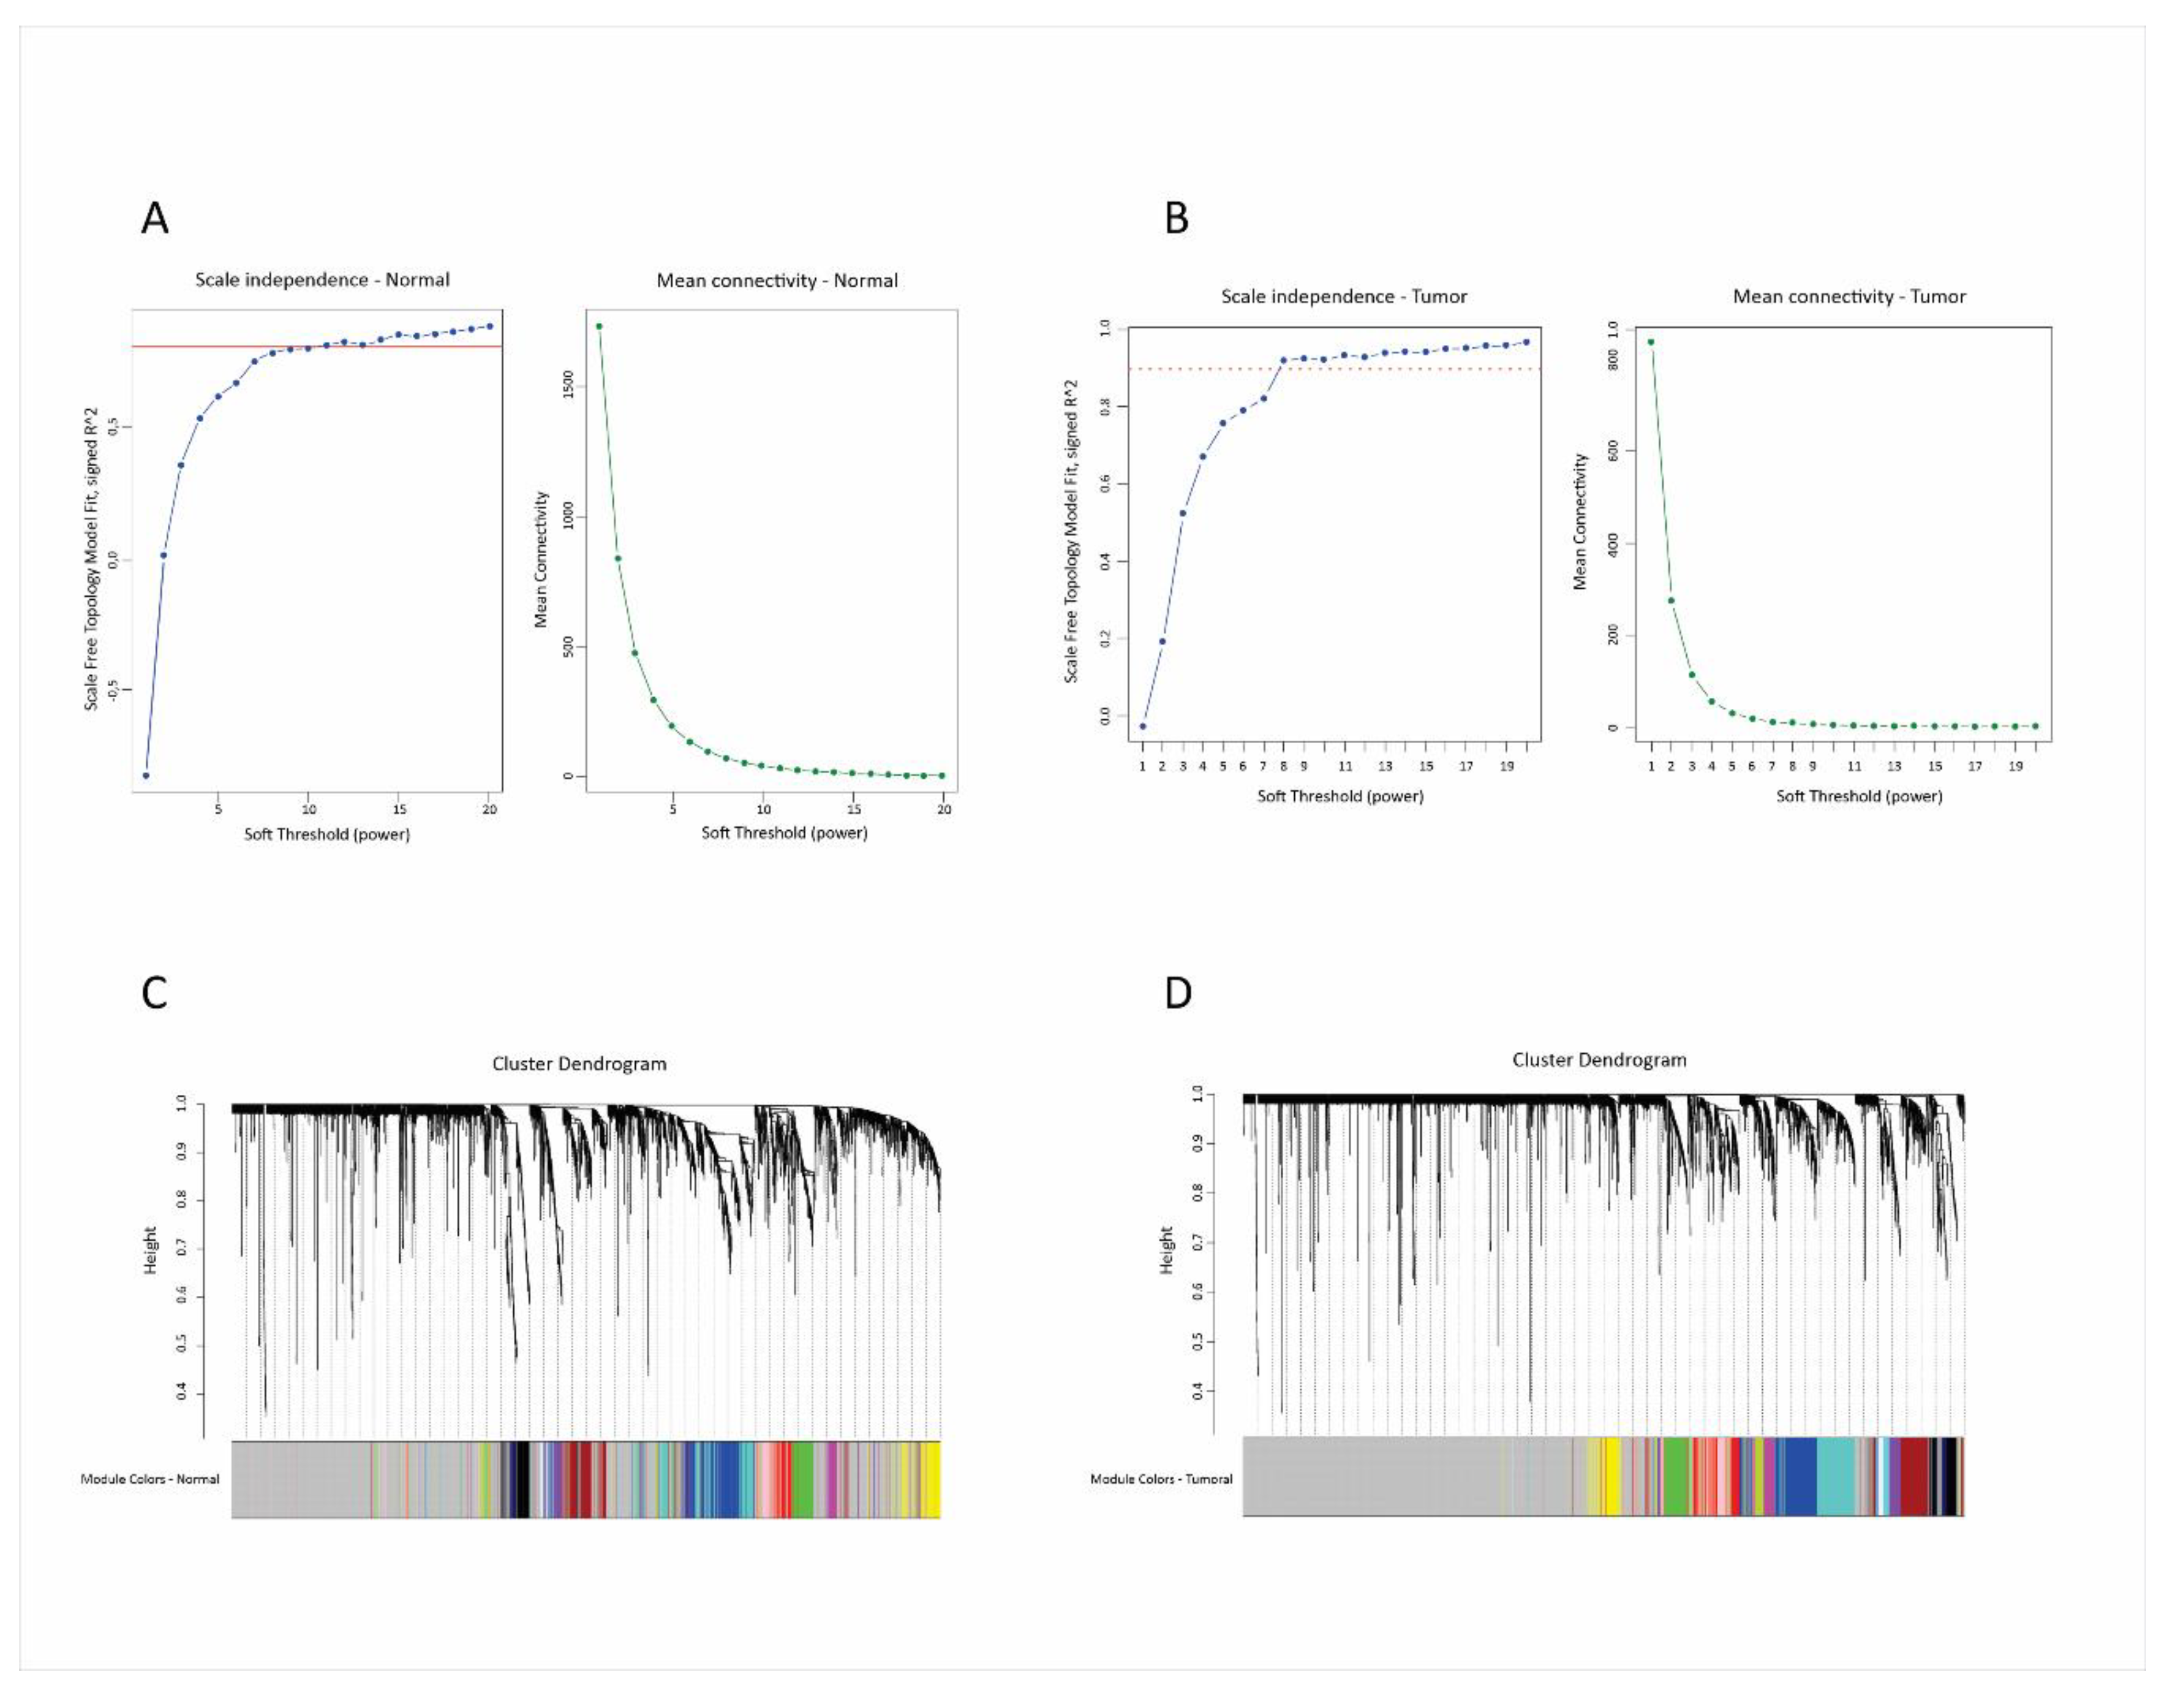
Figure 3.
Co-expression networks in normal (a) and tumor (b) tissues. Network nodes-genes; network edges-correlations. Diamonds- genes; lines- correlations; colors- module colors in normal (a) and tumor (b) tissue.
Figure 3.
Co-expression networks in normal (a) and tumor (b) tissues. Network nodes-genes; network edges-correlations. Diamonds- genes; lines- correlations; colors- module colors in normal (a) and tumor (b) tissue.
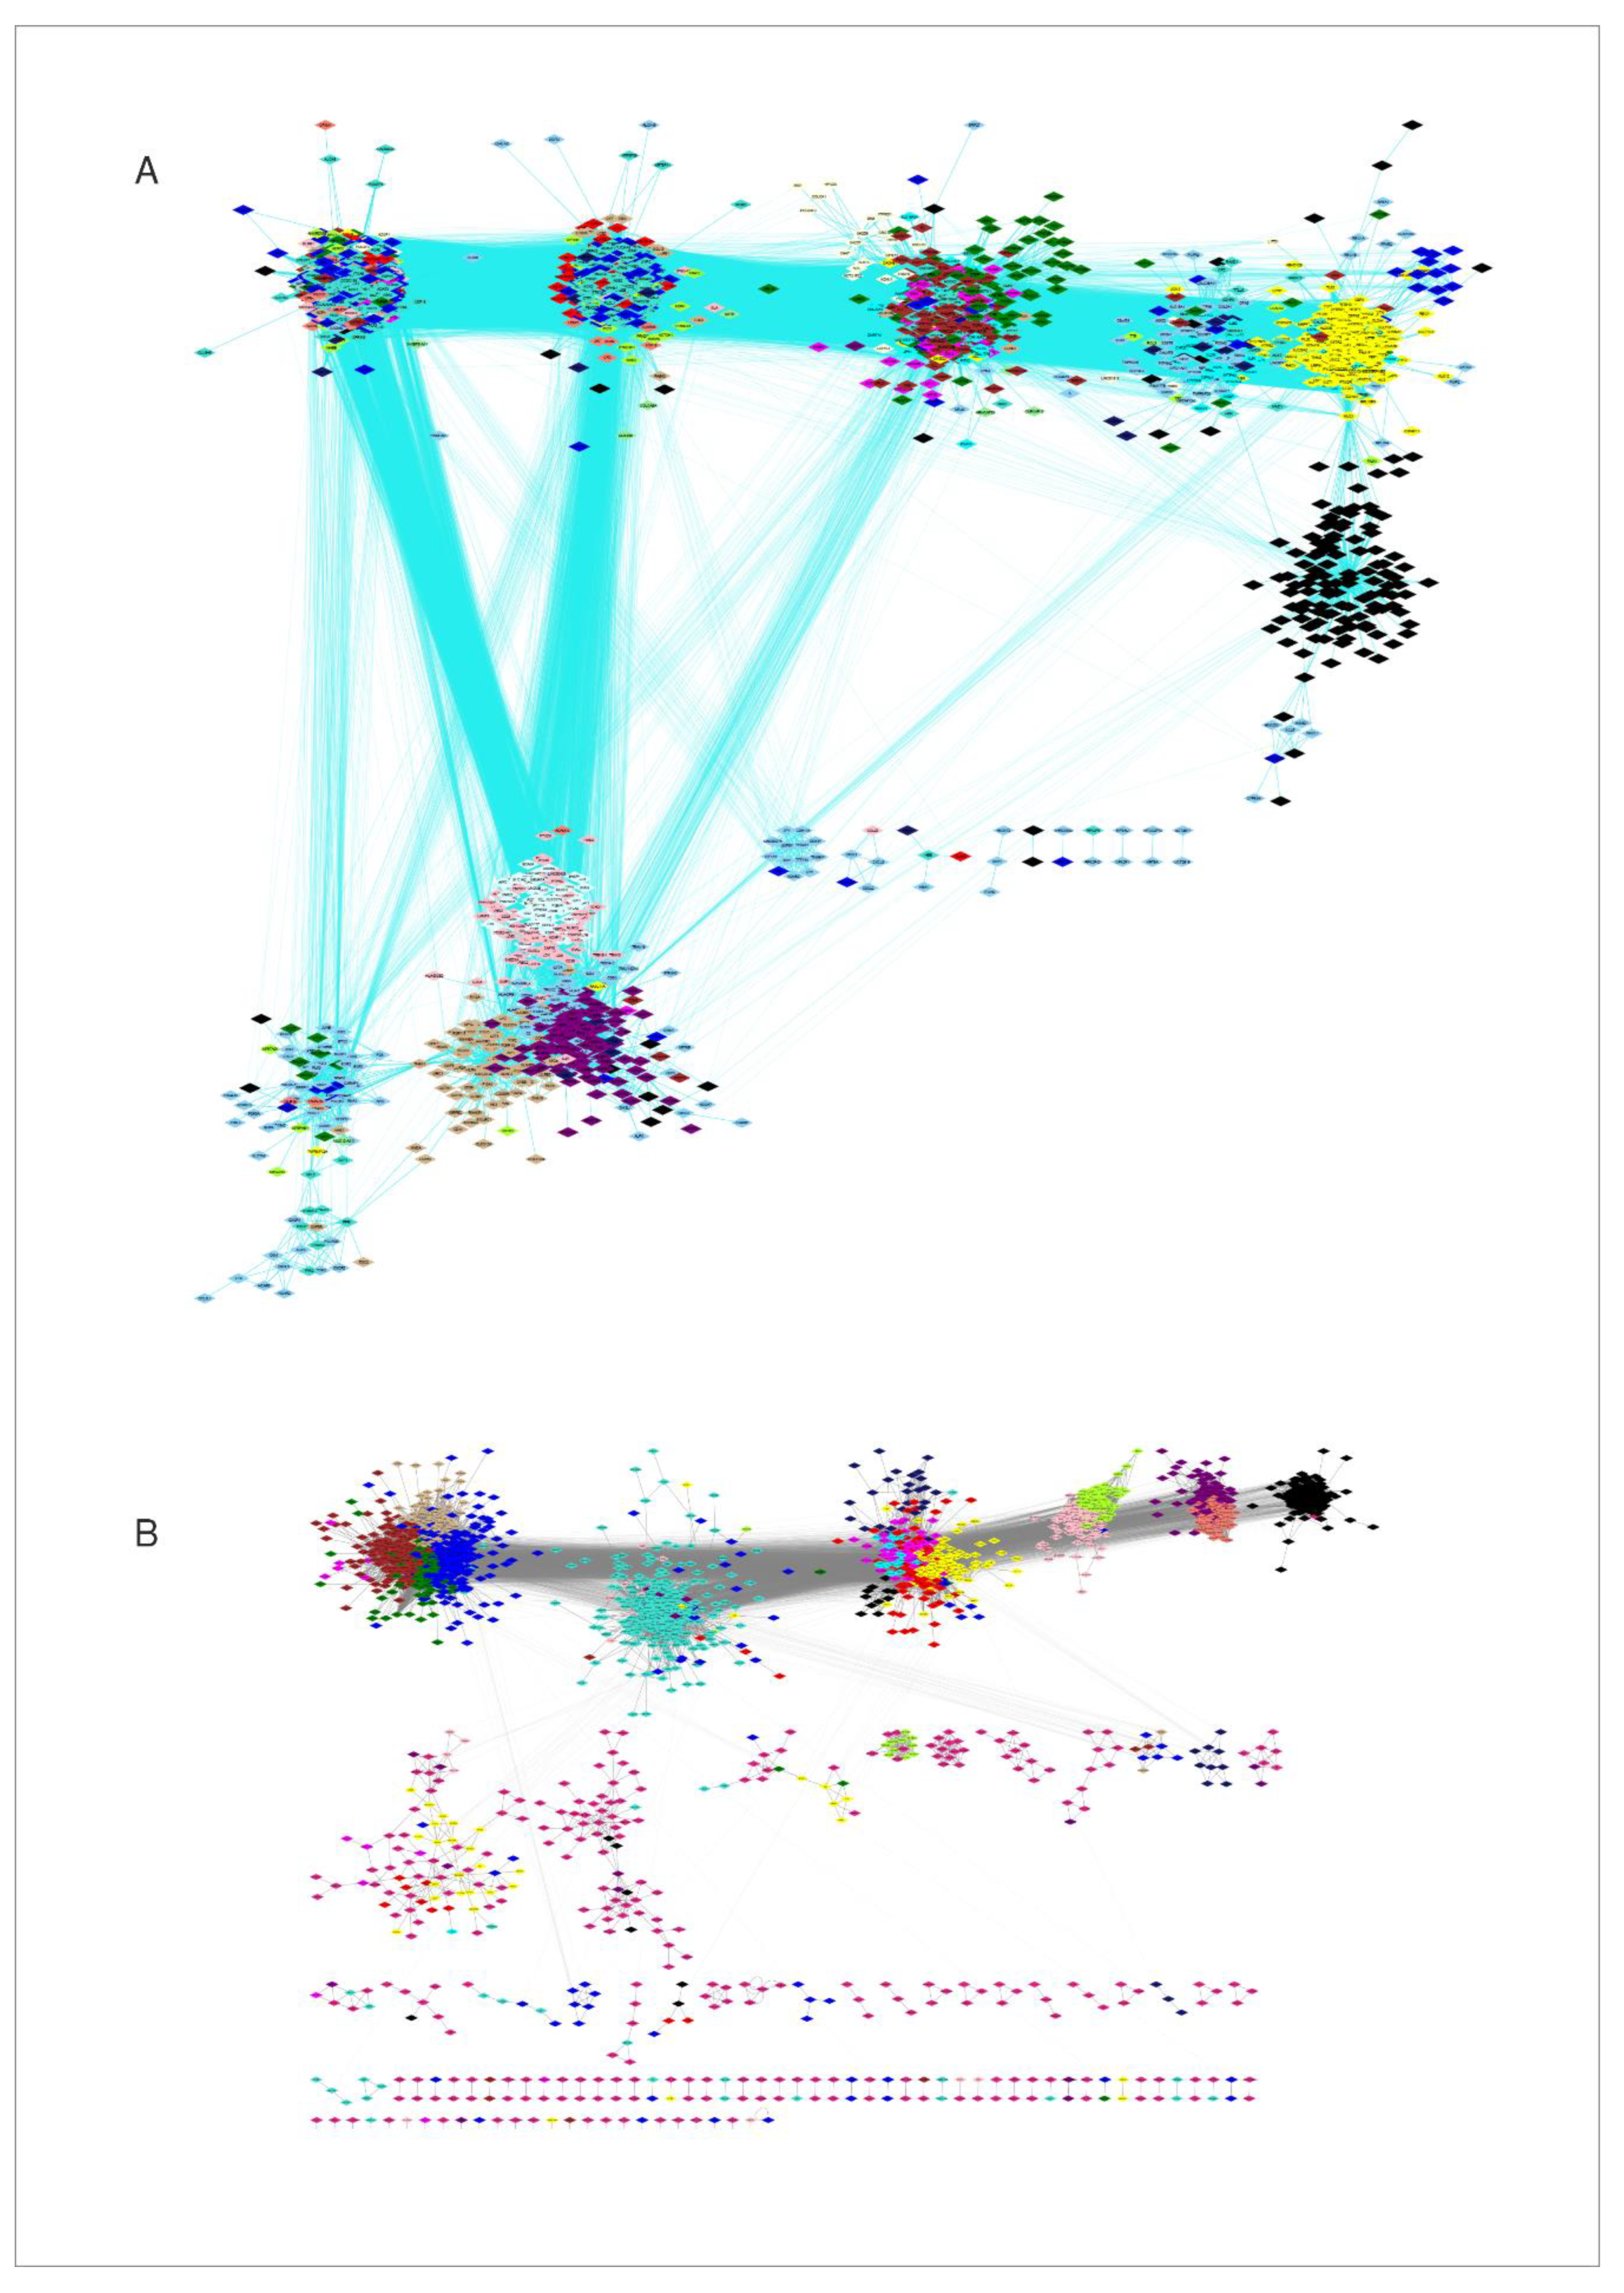
Figure 4.
Correlations of WGCNA modules eigengenes in normal and tumor tissue. (a), (b): Heatmaps of correlations between eigengene modules. Color scale- Pearson coefficients; (c), (d): Correlation networks between eigengenes; only correlations with Pearson coefficient above 0,65 are shown; Colors- module colors.
Figure 4.
Correlations of WGCNA modules eigengenes in normal and tumor tissue. (a), (b): Heatmaps of correlations between eigengene modules. Color scale- Pearson coefficients; (c), (d): Correlation networks between eigengenes; only correlations with Pearson coefficient above 0,65 are shown; Colors- module colors.
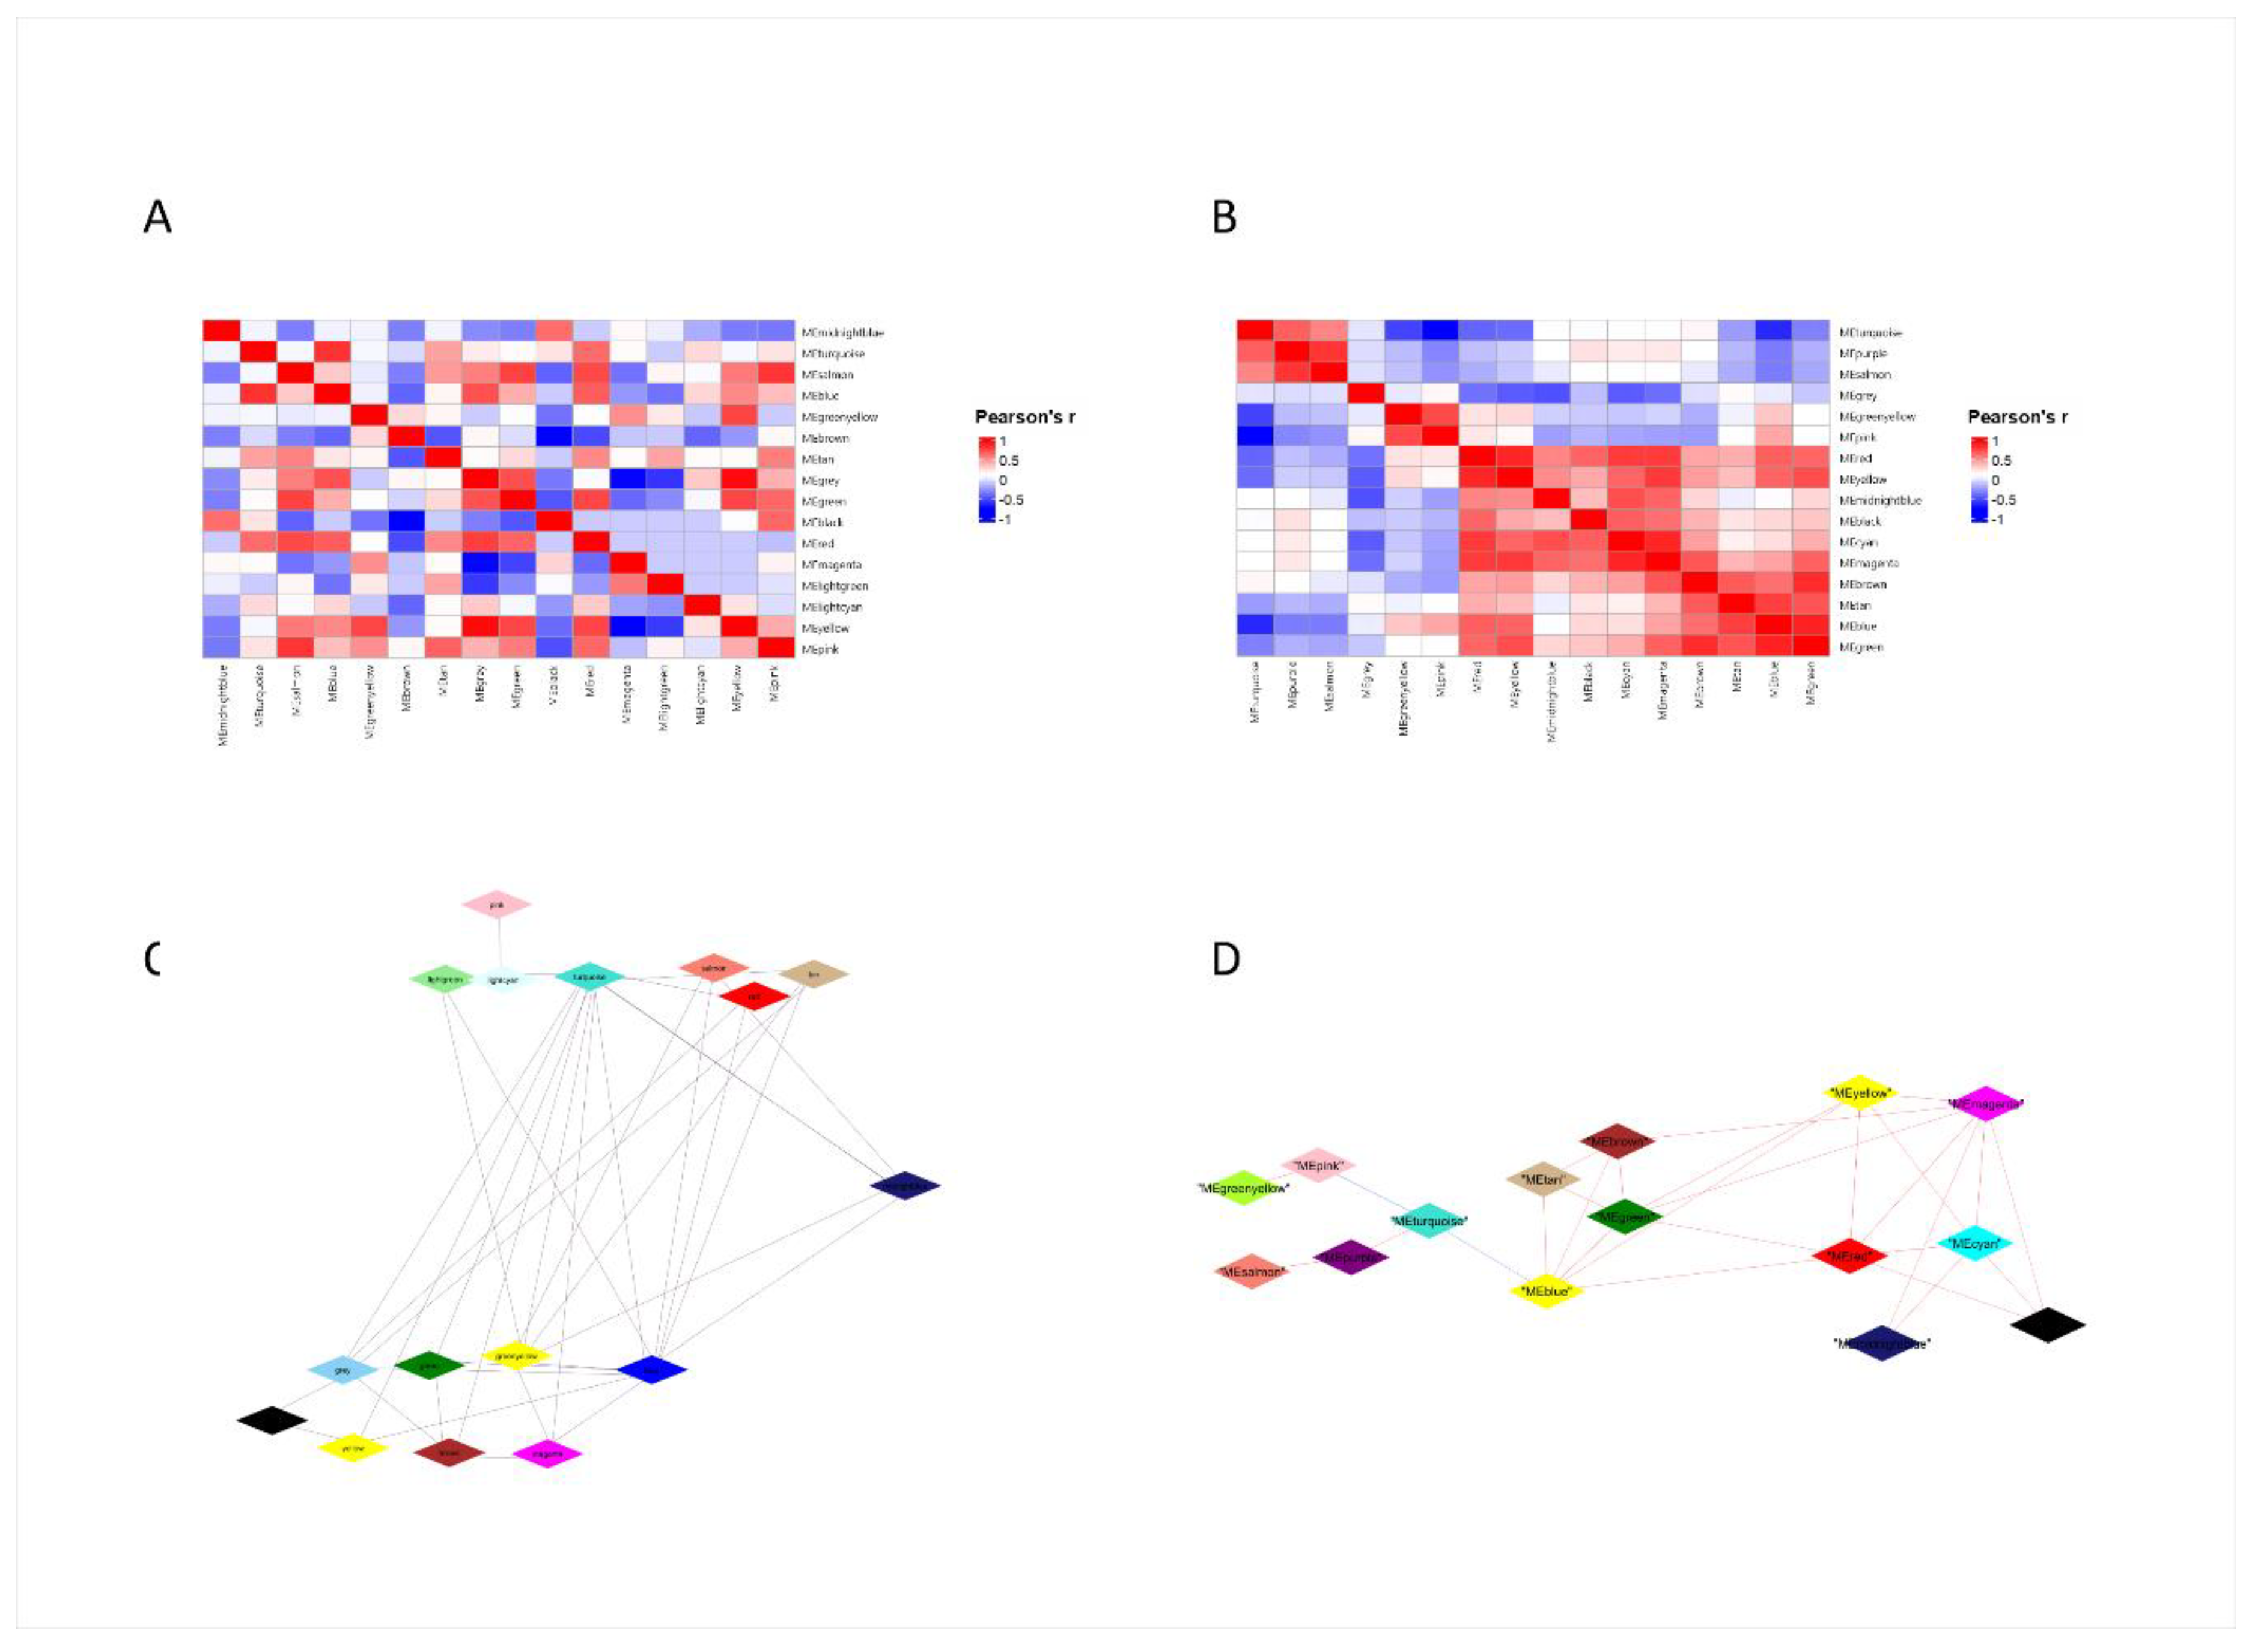
Figure 5.
Correlation between modules and the main clinical-pathological characteristics of the patients and the expression of the component genes. Node color indicates the correlation between gene expression and the indicated clinical parameter (vital status, AJCC pathological stage, or tumor laterality). (a) Expression of genes in modules compared to normal tissue, as shown by DESeq2 analysis; magenta-increased expression, blue-decreased expression. (b) Correlation with stage; brown-increases with stage, green-decreases with stage; (c) Correlation with vital status; pink-correlation with dead status, lightgreen- correlation with alive status. (d) Correlation with laterality: red-right location, yellow-left location. Cor_stage_numeric, cor_vital_status_numeric, and cor_laterality_numeric represent gene-level correlations with the numerically encoded clinical variables of pathological stage, vital status, and tumor laterality, respectively.
Figure 5.
Correlation between modules and the main clinical-pathological characteristics of the patients and the expression of the component genes. Node color indicates the correlation between gene expression and the indicated clinical parameter (vital status, AJCC pathological stage, or tumor laterality). (a) Expression of genes in modules compared to normal tissue, as shown by DESeq2 analysis; magenta-increased expression, blue-decreased expression. (b) Correlation with stage; brown-increases with stage, green-decreases with stage; (c) Correlation with vital status; pink-correlation with dead status, lightgreen- correlation with alive status. (d) Correlation with laterality: red-right location, yellow-left location. Cor_stage_numeric, cor_vital_status_numeric, and cor_laterality_numeric represent gene-level correlations with the numerically encoded clinical variables of pathological stage, vital status, and tumor laterality, respectively.
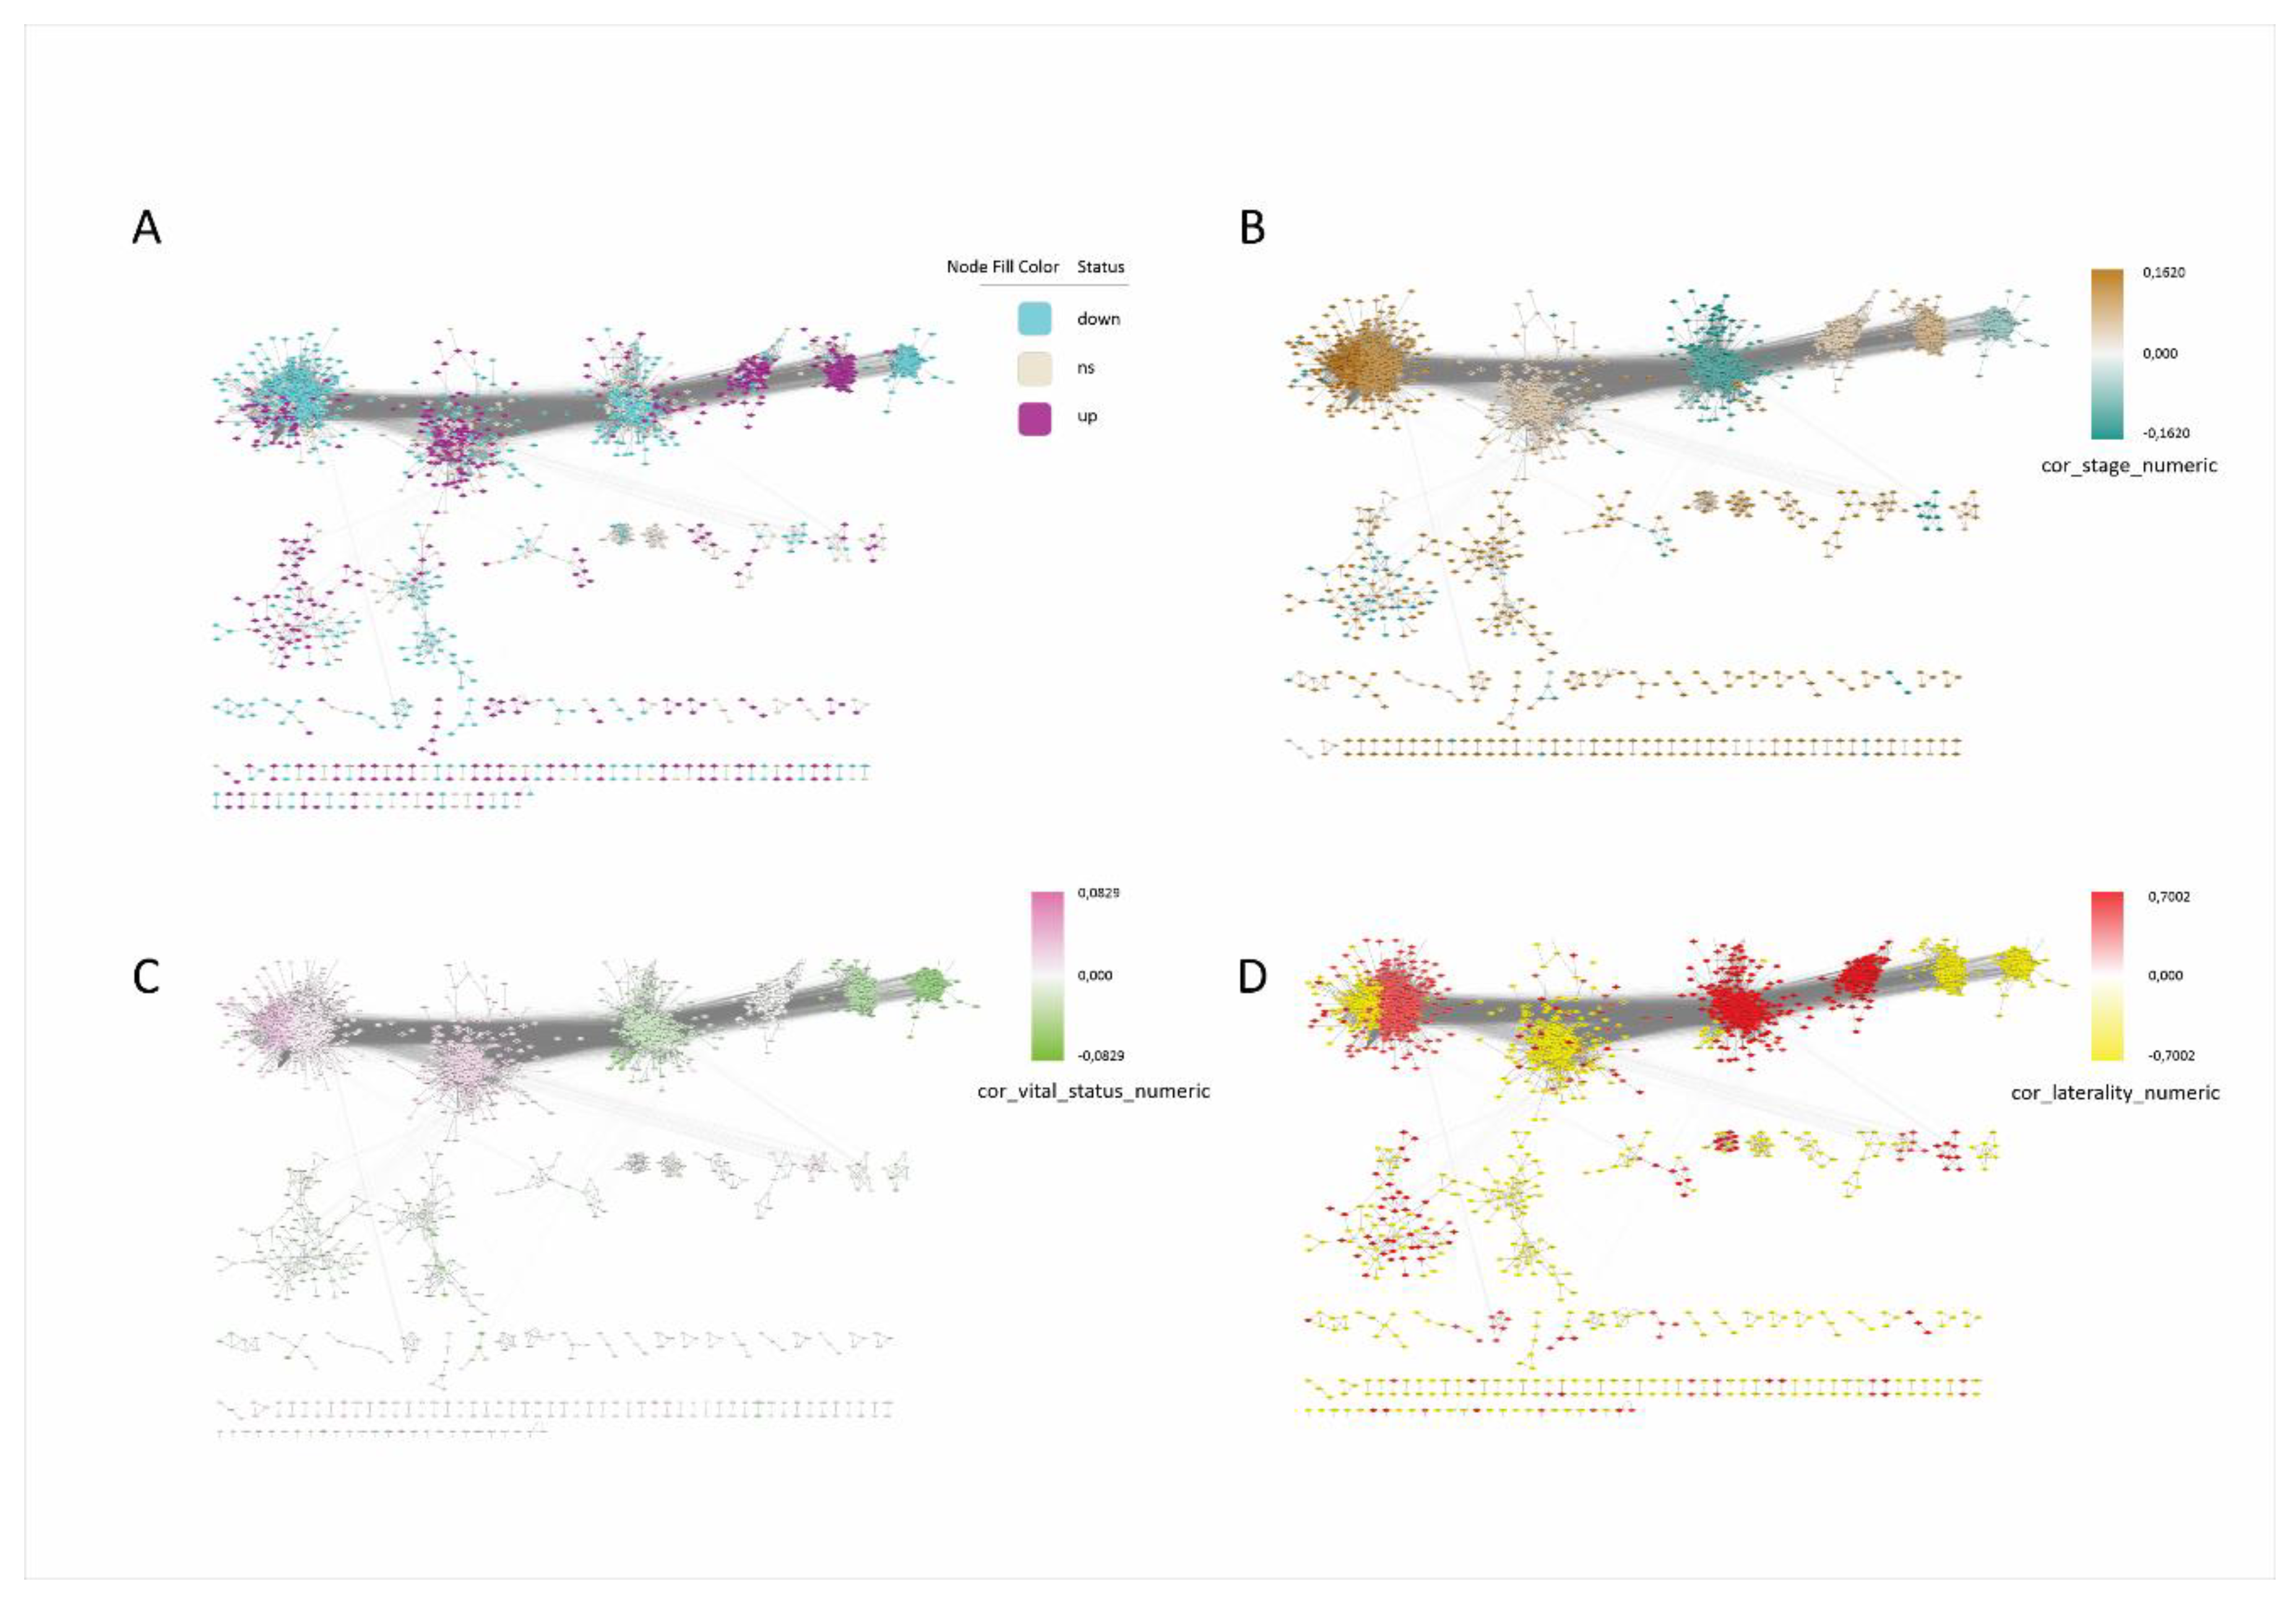
Figure 6.
Correlation network between the main signaling pathways and hub genes of WGCNA modules. (a) Correlation network; diamonds- genes; colors- module colors; (b) Network with expression data; red- up-regulated (compared to normal); blue- down-regulated; white-non-significant; blue line-positive correlation; pink line-negative correlation.
Figure 6.
Correlation network between the main signaling pathways and hub genes of WGCNA modules. (a) Correlation network; diamonds- genes; colors- module colors; (b) Network with expression data; red- up-regulated (compared to normal); blue- down-regulated; white-non-significant; blue line-positive correlation; pink line-negative correlation.
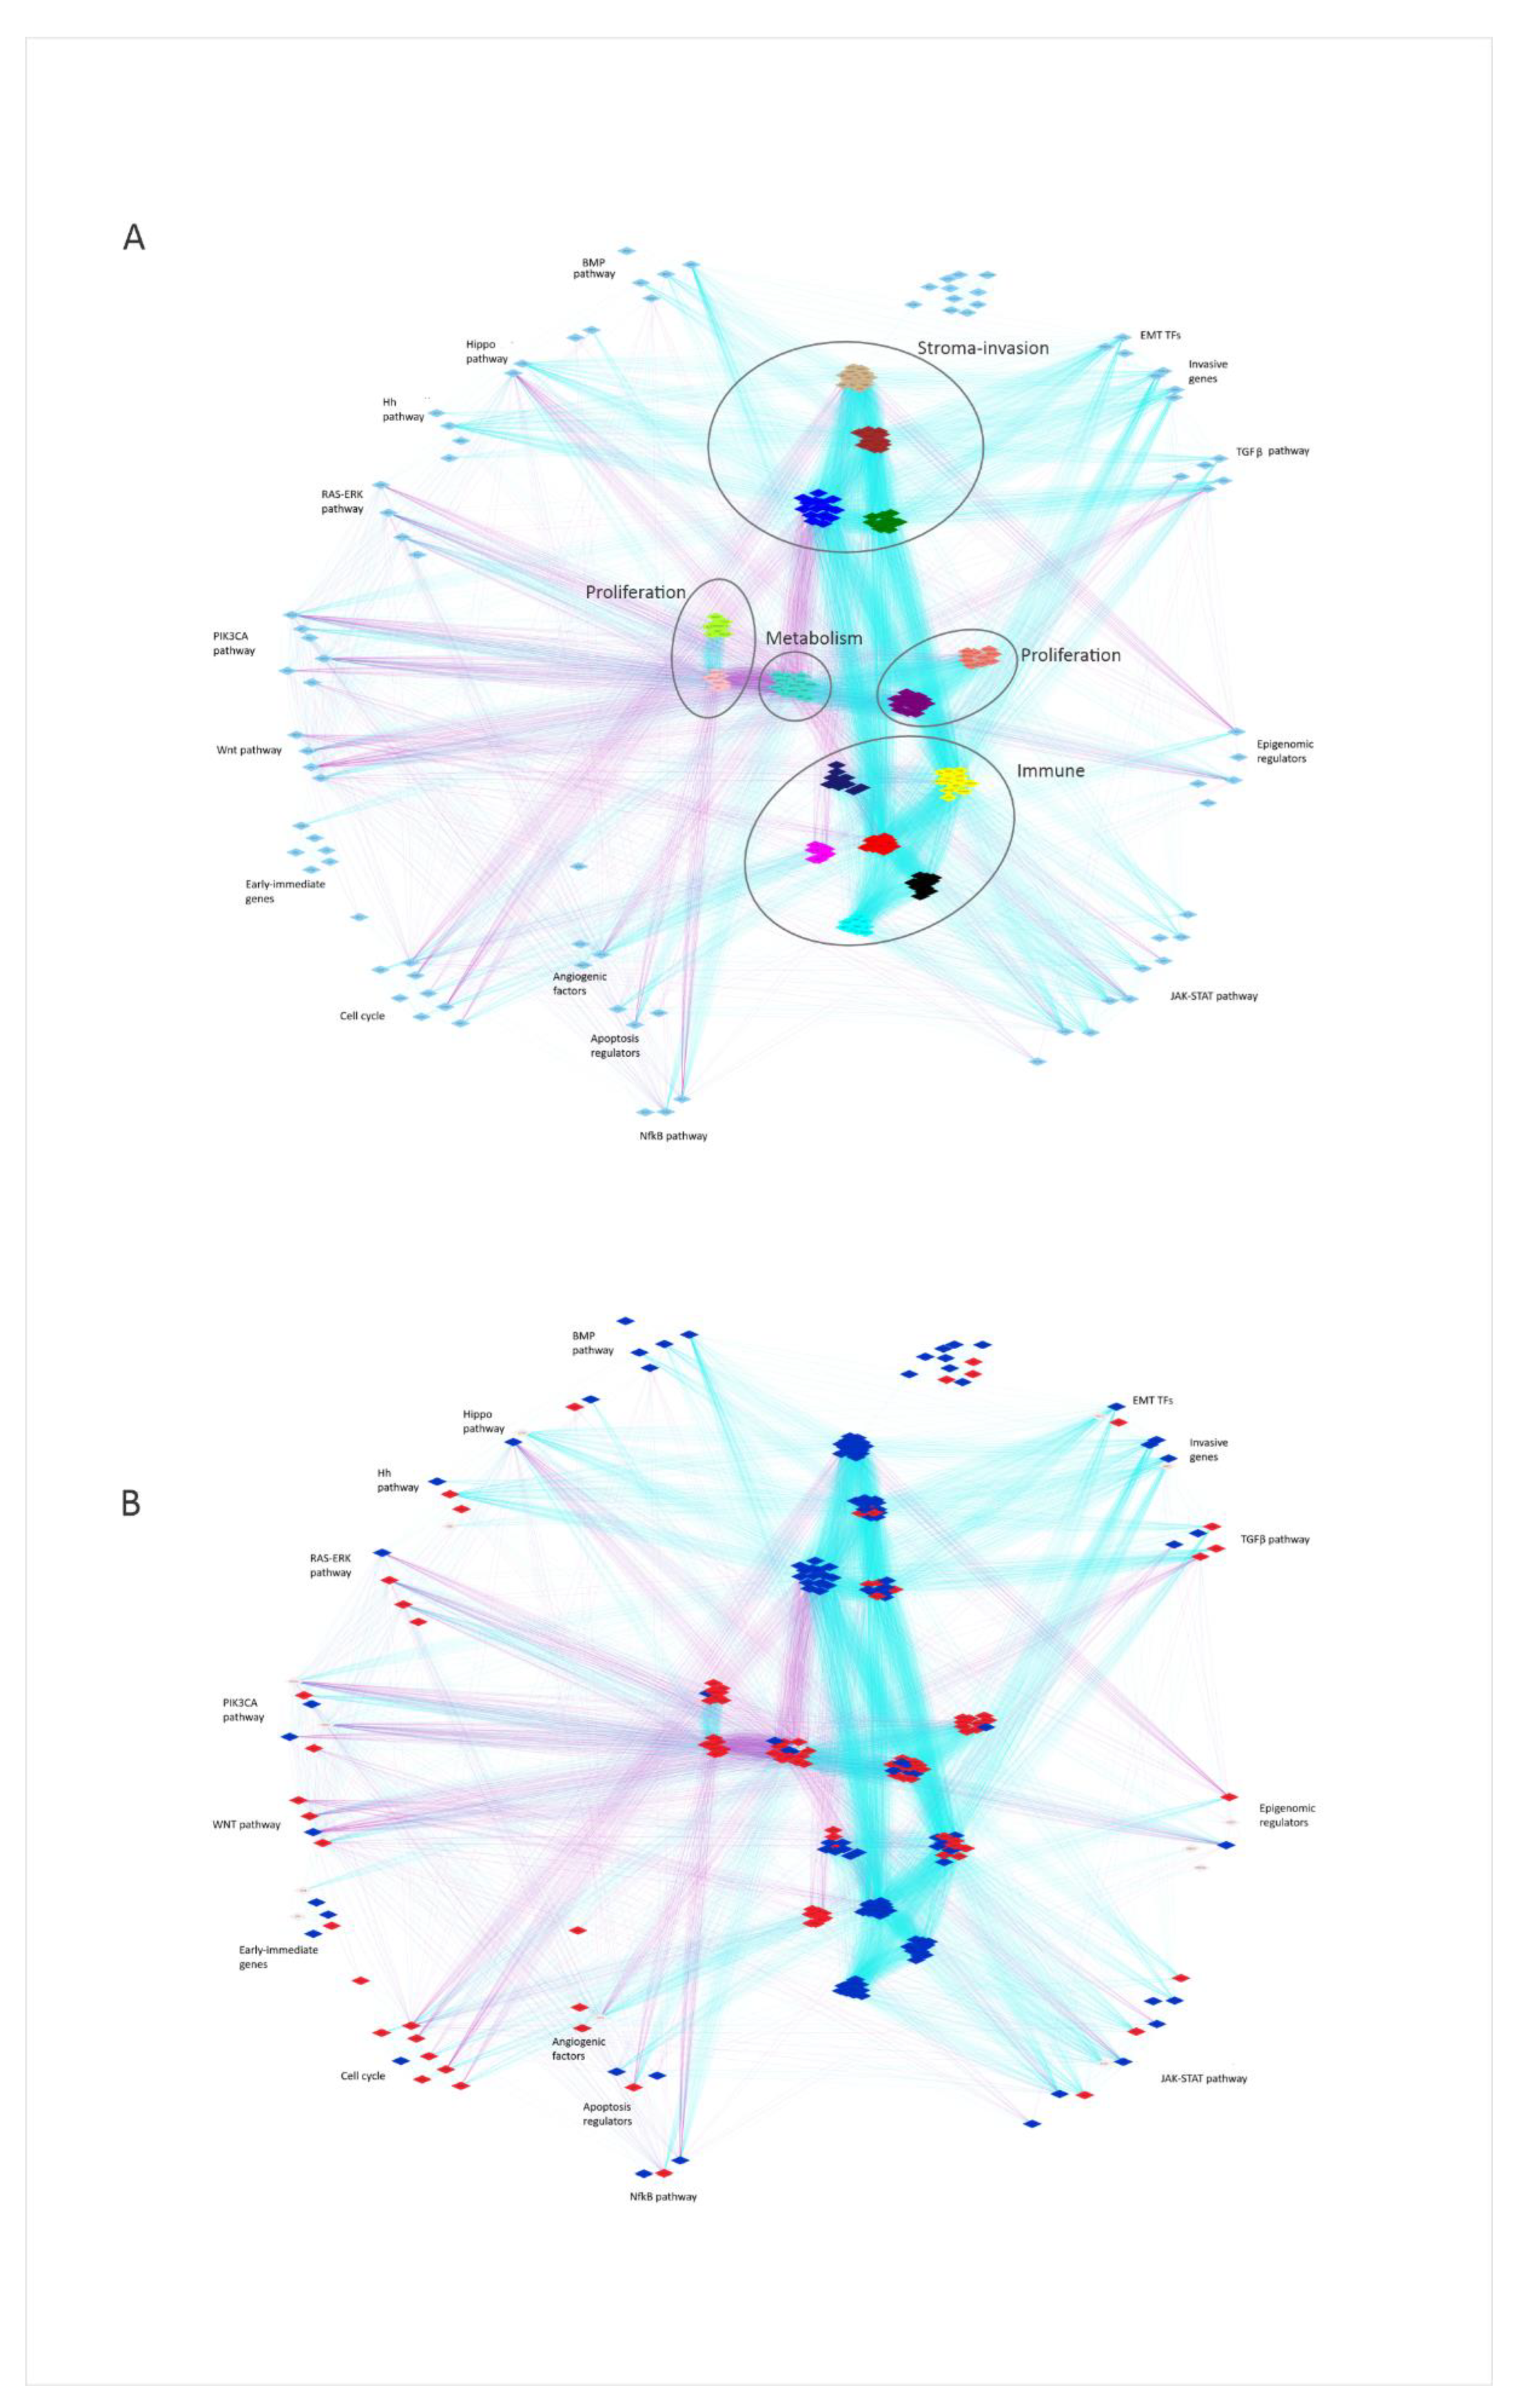
Figure 7.
(a) Transcriptome organization in colon cancer. The graph presents a conceptual, hypothesis-generating model inferred from bulk co-expression patterns. Four clusters can be observed, comprising a few WGCNA modules each, and the corresponding signaling pathways: proliferative, stroma-invasion, metabolic and immune clusters. (b) Network reconfiguration in colon cancer. Colours- module colours; LB-B lymphocyte; LT- T lymphocyte; NK- NK lymphocyte; Th1- T helper 1 lymphocyte; IFN-interferon; IL- interleukin; CC- chemokine; PAMP- pathogen-associated molecular pattern; Neutr. adhes- neutrophil adhesion; ECM- extracellular matrix; EPIG- epigenomic regulation; EIG- early immediate genes; Hh- Hedgehog pathway.
Figure 7.
(a) Transcriptome organization in colon cancer. The graph presents a conceptual, hypothesis-generating model inferred from bulk co-expression patterns. Four clusters can be observed, comprising a few WGCNA modules each, and the corresponding signaling pathways: proliferative, stroma-invasion, metabolic and immune clusters. (b) Network reconfiguration in colon cancer. Colours- module colours; LB-B lymphocyte; LT- T lymphocyte; NK- NK lymphocyte; Th1- T helper 1 lymphocyte; IFN-interferon; IL- interleukin; CC- chemokine; PAMP- pathogen-associated molecular pattern; Neutr. adhes- neutrophil adhesion; ECM- extracellular matrix; EPIG- epigenomic regulation; EIG- early immediate genes; Hh- Hedgehog pathway.
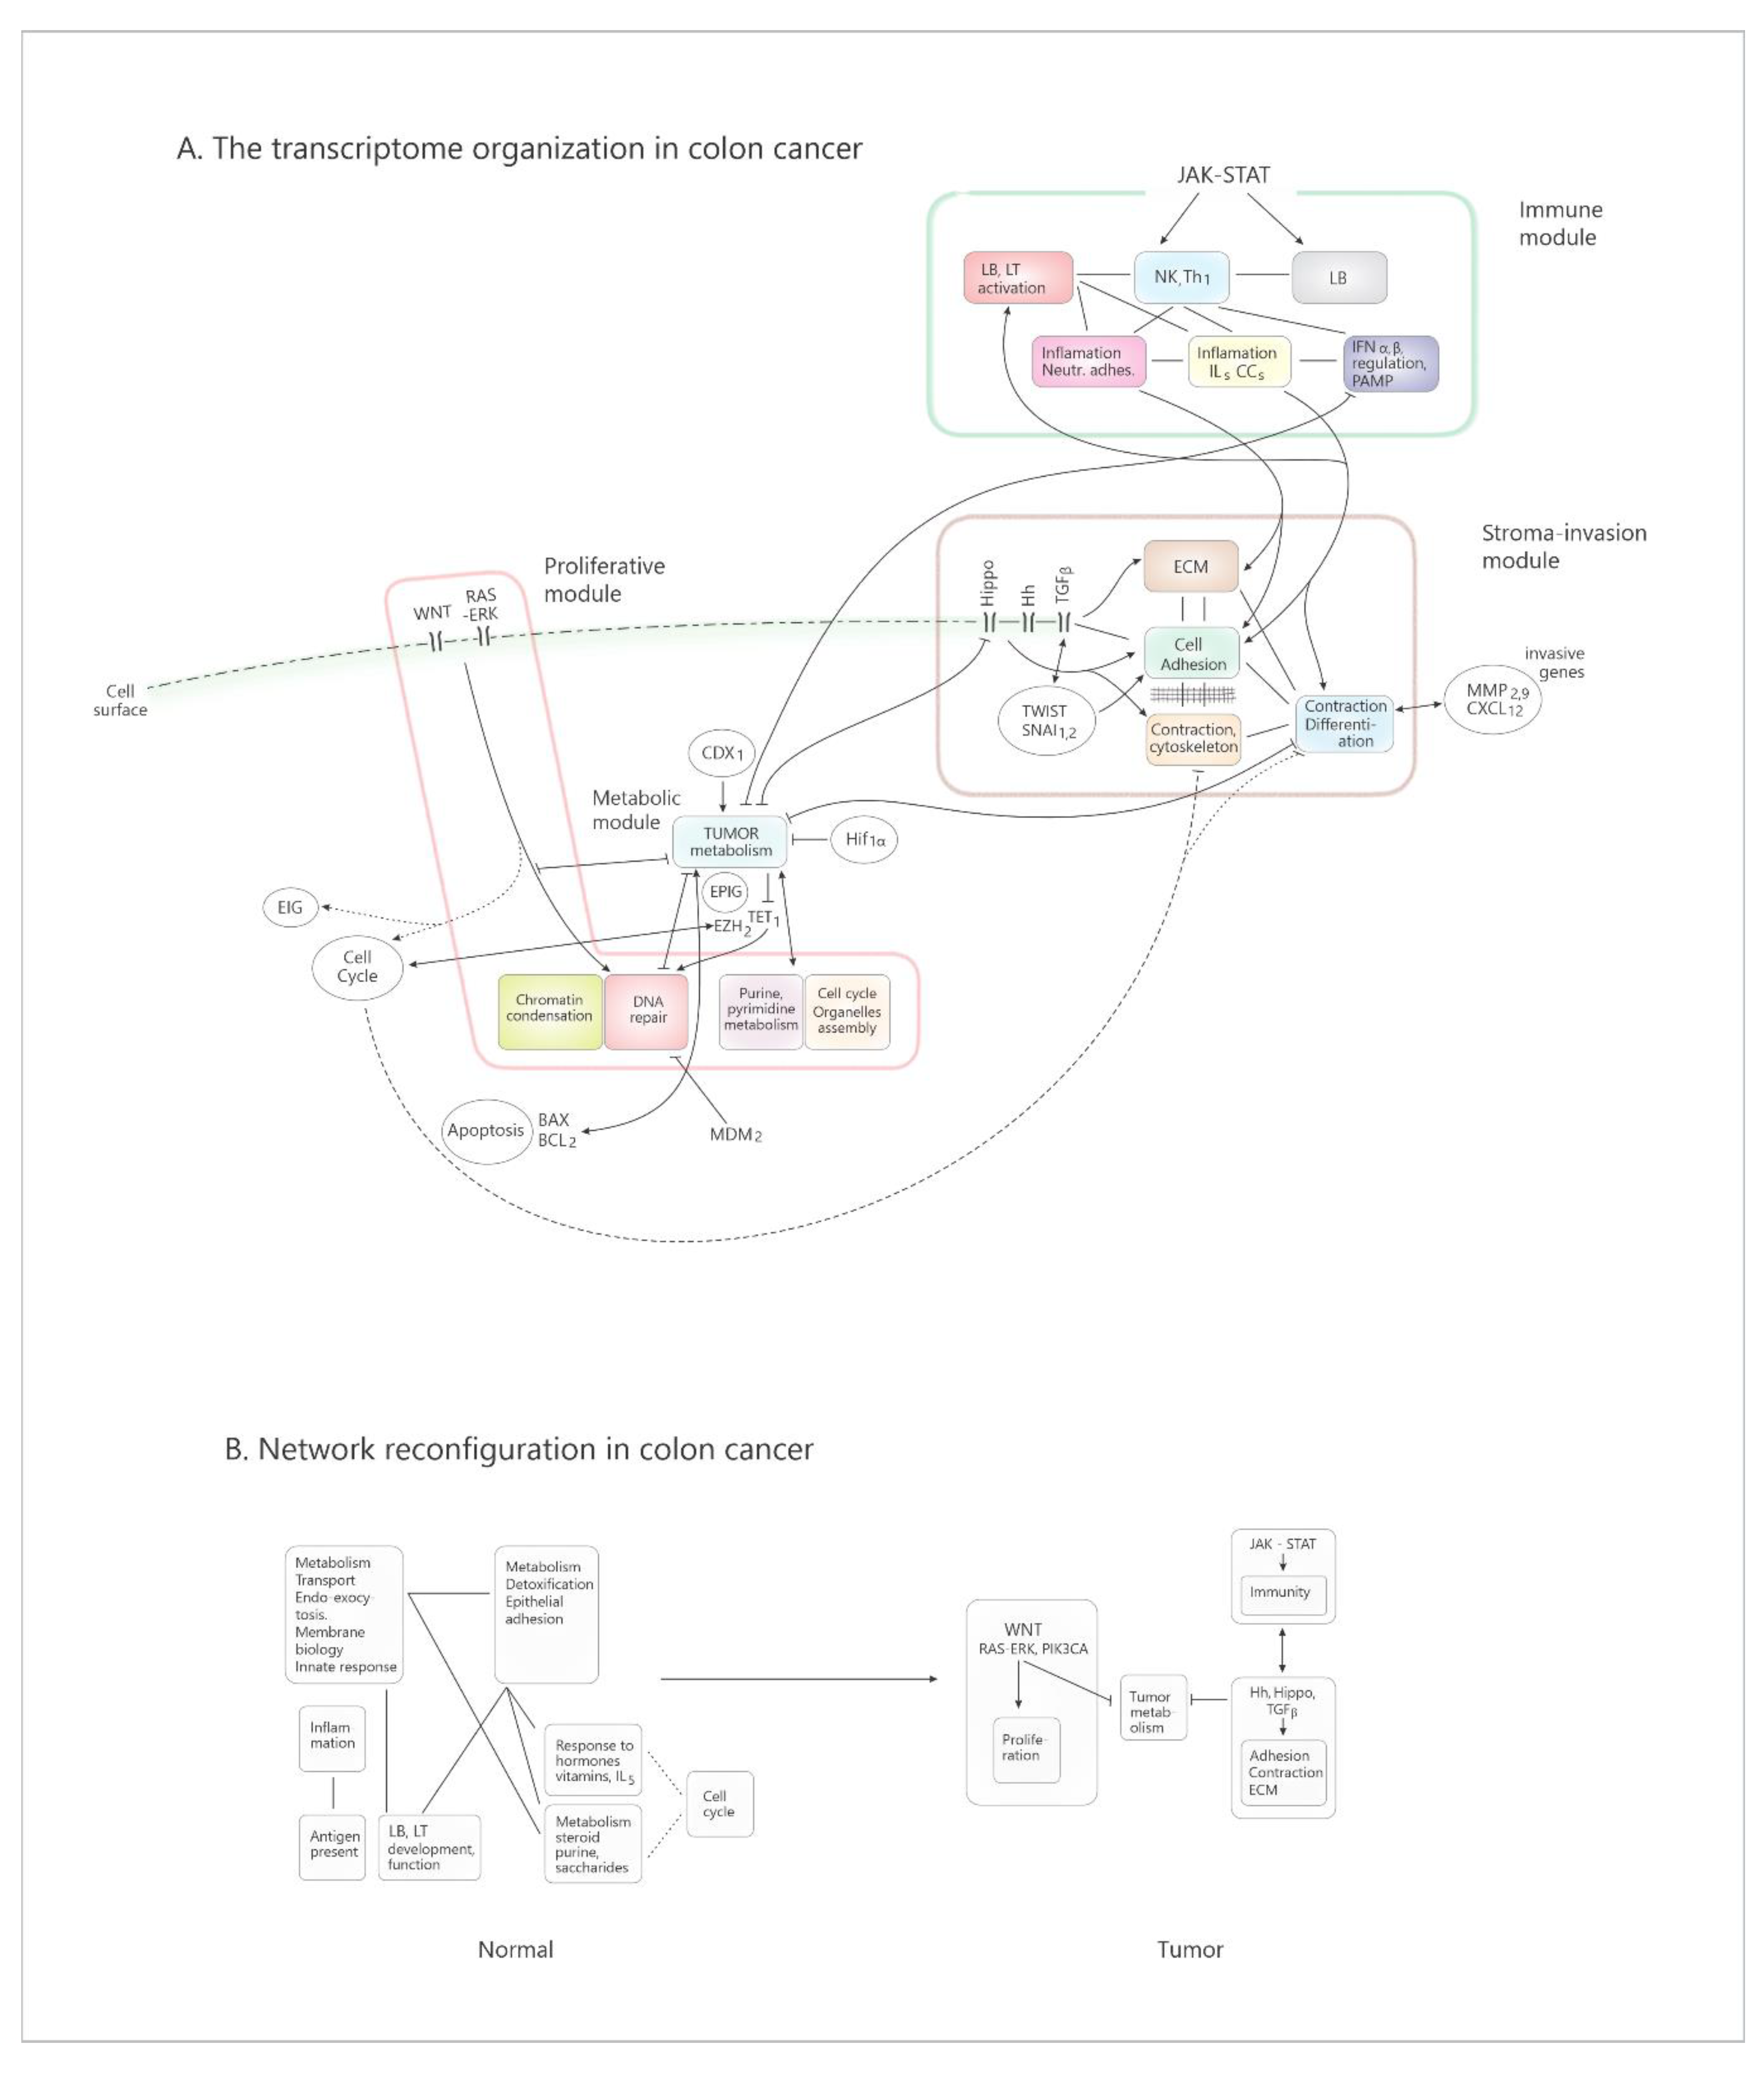

Table 1.
Demographic and clinic-pathologic characteristics of the patient cohort.
| Parameter | N (%) |
|---|---|
| Gender Male Female |
241 (52.62 %) 217 (47.38 %) |
| Mean age (years) | 66.7 |
| Race Amerindian Asiatic Afro-american Caucazian Non-responder |
1 (0.22 %) 11 (2.40 %) 59 (12.88 %) 213 (46.50 %) 174 (37.99 %) |
| Tumor TNM stage I II III IV Not available/not reported |
76 (16.6 %) 178 (38.9 %) 131 (28.6 %) 66 (14.4 %) 7 (1.53 %) |
| Tumor location Right colon Left colon (distal to the splenic flexure) N/A |
258 (56.33 %) 178 (38.86 %) 22 (4.80 %) |
| Tissue type Primary tumor Metastatic tumor |
481 (100%) 0 (0%) |
| Tumor histology (n%) Adenocarcinomas Mucinous, cystic or serous carcinomas Carcinoma in situ, nos. |
392 (85.59 %) 63 (13.76 %) 3 (0.66%) |
| Colon polyps | 193 (42.14 %) |
| Vital status Alive Deceased NA/NR |
354 (77,29 %) 102 (22.27 %) 2 (0.44 %) |
NOS-not other specified; NA- not available; NR-non-responders; n(%)-Numbers and percent.
Table 2.
Characteristics of coexpression network modules in normal and tumor tissue.
| Normal tissue |
Tumor tissue | |||||||
| Module | No of genes | Avg. degree | Function | Module | No. of genes | Hub genes | Avg. degree |
Function |
| Black | 151 | 5,49 | cell cycle | Black | 148 | IGLC2, IGHV4-28, IGLV2-14, IGLL5, IGKV1-5, IGKV4-1, IGKC, MZB1, IGHV1-46, IGLV1-40, CD79A, IGKV3-15, IGHV4-59, IGHV1-18, IGKV3-11 | 71,38 | adaptive immunity (BLts) WNT pathway |
| Blue | 757 | 160,8 | Tissue differentiation, signaling, extracellular matrix organization, cell adhesion, migration, cell projections; secretion, lipid metabolism. |
Brown | 190 | EFEMP2, EMILIN1, COL6A2, C1R, MXRA8, SYDE1, GGT5, SLC22A17, AEBP1, ADGRA2, THY1, COL6A1, MRGPRF, MFGE8, EHD2 | 62,47 | colagen synthesis TGFb pathway mesenchyme development |
| Brown | 347 | 113,32 | metabolism (glucidic, lipidic, amino acids, vitamins, hormons) transport, endo, exocytosis | Purple | 97 | PCBP1, RPL27P4, NDUFA13, TAX1BP3, MRPL2, RAB5IF, NUDT3, GNG5, BCKDHA, NME2, ALDOA, SRXN1, UQCR11, BLOC1S1, NDUFA11 | 38,33 | metabolism (purine, pyrimidine metabolism) respiratory chain |
| Cyan | 93 | 28 | membrane biology xenobiotic metabolism |
Cyan | 530 | IL2RB, CD247, ITGAL, CD3E, TRAC, ARHGAP9, RASAL3, TRBC2, PDCD1, IL12RB1, NKG7 | 27,17 | adaptive immunity (LTs,NK, Th1 activation, differentiation) |
| Green | 230 | 17,17 | Epithelial differentiation, hemidesmosomes, tight junction assembly, colesterol metabolism; | Turquoise | 450 | MLST8, NDUFS8, NUBP2, METTL26, ATP5F1D, MRPS34, TIMM13, NDUFB7, SSNA1, LSM7, HSPBP1, COPE, SF3B5, ARF5, MRPS12 | 98.58 | metabolism (lipidic, proteic, purinic, energetic); mitocondria functionning |
| Green-yellow | 110 | 16,21 | endothelial development; ECM organizțation, homophilic cell adhesion; | Green- yellow |
96 | H4C5, H2BC7, H2BC17, H2BC4, H1-3, H2BC6, H2AC16, SCARNA21, H2BC10, H2AC20 | 65,73 | chromatin condensation |
| Grey | 155 | 5,6 | response to hormons, ILs, vitamins, EGF, FGF; |
green | 153 | CCDC80, MRAS, SULF1, KCNE4, ANTXR1, RAB31, FSTL1, FBN1, ST6GALNAC5, SPARC, TIMP2, COL5A2, FAP, FRMD6, COL8A1 | 68.44 | cartilage, bone development; WNT pathway cell adhesion, extracellular matrix organization |
| Grey-60 | 52 | 12,55 | adaptive response (LTs, NK, γδ) | Mid-night-blue | 38 | IFIT3, OAS2, IFI44L, IFIT2, RSAD2, MX1, CMPK2, DDX60, IFI44, XAF1 | 6,81 | innate response regulation (PAMP, IFN αβ, pathway) |
| Light-cyan | 86 | 47,34 | adaptive response (B LTs (T LTs) | Tan | 76 | GNAO1, HSPB8, LMOD1, CASQ2, SYNPO2, MYH11, PDZRN4, RBPMS2, KCNMB1, HSPB7, JPH2, HAND2, FHL1, MYLK, TNS1 | 33,9 | myocyte biology, contraction mesenchyme migration |
| Light-green | 23 | 0 | adaptive response (LBs development) CCs, LCs migration |
Yellow | 156 | PLEK, BCL2A1, SRGN, FCGR2A, C3AR1, CD86, LCP2, MNDA, CD53, HAVCR2, AQP9, PDCD1LG2, CCR1, CLEC7A, CD163, NCF2 | 46,65 | innate immunity (inflammation, leukocytes prolif., IL-1, IL-8, NfkB pathway) |
| Light-yellow | 38 | 8,2 | taste neurons biology | Salmon | 60 | RPS3P4, RPS3P3, RPS8P8, RP8S17P16, RPS9P4, RPL32P18, EEF1DP1, RPL3P2, RPL23P6, RPS18P5 | 49,76 | organelles assembly cell cycle myosin assembly autophagy |
| Magenta | 116 | 27,68 | detoxification response to ions | Red | 132 | HCLS1, IKZF1, PTPRC, TRAF3IP3, DOCK2, IL10RA, KLHL6, P2RY10, PRKCB, APBB1IP, ITK, FYB1, PIK3CG, CCR5, TIGIT | 45,76 | Adaptive immunity (LTs activation -LT, LB-, development, transendothelial migration) |
| Mid-nightblue | 87 | 27,34 | neuron biology | Pink | 100 | : MATR3, GTF2I-AS1, CFLAR-AS1, USP3-AS1, STARD13-AS, POU5F2, JPX, RUNX1-AS1, DIAPH1-AS1, PRSS48 | 38,18 | DNA repair; myofibril assembly, cilliary protein assembly (dinein, BRCA2) |
| Pink | 120 | 7,7 | adaptive response (TCR, LTs prolife-ration, activation | Magen-ta | 106 | KIF18A, NCAPG, CIP2A, CHEK1, TTK, PLK4, DGLAP5, ECT2, CEP55, FBXO5 | 50,63 | innate response ( inflammation, neutrophil activation, leucocyte adhesion) |
| Purple | 111 | 34,41 | innate response (to virus, IFN α,β response) inflammation |
Blue | 348 | DDR2, MSRB3, FERMT2, BNC2, DNAAF9, MPDZ, GLI3, CALD1, ZNF521, AMOTL1, CCDC80, ZEB1, SGCD, FRMD6, RNF150, AKT3 | 81,29 | Muscle contraction, actin organization; cell adhesion; pathways in cancer, transcription misregulation in cancer. Developments (epithelial, muscle cell) |
| Red | 178 | 133 | innate response (IL-8, apoptosis, response to IFNγ) |
Grey | 288 | B3GNT6, FCGBP, ZFY, USP9Y, UTY, EIF1AY, KDM5D, DDX3Y, LINC00278, NLGN4Y | 4 | Developments (ureterus,lung) steroid metabolism, acute inflammation, LB. |
| Salmon | 93 | 25,62 | innate response (phagocytosis) | |||||
| Tan | 96 | 7,8 | innate response (Ag presentation, myeloid cells activation) | |||||
| Turquoi-se | 1542 | 767,43 | membrane biology-ion channels, GAP junctions; muscle contraction, synaptic transmission, cell projection, migra-tion, actin cyto-skeleton org. WNT pathway, epithelia, endothelia prolifer. | |||||
| Yellow | 309 | 114,14 | metabolism, transport (steroids, ILs, organic acids disacharids, purines, vitamins) | |||||
No-number; Avg-average; LT- lymphocyte IL-interleukin; Ag-antigen; LB-B lymphocyte; IFNγ-interferon-gamma; CC- chemokine; LC- leukocyte; T LT- T lymphocyte; TCR-T-cell receptor; Th LT-T helper lymphocyte.
Disclaimer/Publisher’s Note: The statements, opinions and data contained in all publications are solely those of the individual author(s) and contributor(s) and not of MDPI and/or the editor(s). MDPI and/or the editor(s) disclaim responsibility for any injury to people or property resulting from any ideas, methods, instructions or products referred to in the content. |
© 2026 by the authors. Licensee MDPI, Basel, Switzerland. This article is an open access article distributed under the terms and conditions of the Creative Commons Attribution (CC BY) license (http://creativecommons.org/licenses/by/4.0/).
Copyright: This open access article is published under a Creative Commons CC BY 4.0 license, which permit the free download, distribution, and reuse, provided that the author and preprint are cited in any reuse.