

Submitted:
12 November 2026
Posted:
16 November 2026
You are already at the latest version
Abstract
Fixed-tilt photovoltaic design often uses inclination near site latitude, but increased incident irradiation alone does not establish an adequate underlying solar resource or project profitability. Using 2018–2023 solar-resource histories for 54 U.S. cities across six climate groups, this study develops a two-gate preliminary screening method. Gate 1 evaluates the six-year mean annual all-sky horizontal resource before any inclined-racking benefit is credited. An initial 1,400 kWh/m²/year reference was tested against the ordered city distribution; a study-specific breakpoint of 1,525 kWh/m²/year falls between Washington, DC (approximately 1,502) and Nashville, Tennessee (approximately 1,548 kWh/m²/year). The breakpoint routes 37 cities to conventional preliminary economic review and 17 to enhanced project-specific diligence, without implying a universal feasibility boundary. Gate 2 evaluates incremental plane-of-array irradiation from south-facing latitude tilt. Independent hourly all-sky transposition yields a mean city-level latitude-tilt gain of 10.06% and a moderate latitude–gain correlation (Pearson r approximately 0.56). Selecting the modeled optimum fixed tilt separately for each year adds a mean 0.90% beyond latitude tilt. A separate clear-sky horizontal screening comparison misclassifies 16 cities (29.6% of the sample) relative to the all-sky Gate 1 screen. The findings support sequential assessment of underlying resource, atmospheric conditions, and mounting benefit; they do not constitute project-specific energy-yield or financial forecasts.
Keywords:
photovoltaics
; plane-of-array irradiation
; tilt angle
; clear sky
; all sky
; climate regions
; solar-resource screening
; fixed racking
1. Introduction
Photovoltaic mounting studies commonly begin with a geometric premise: a fixed panel oriented toward the equator and inclined near the local latitude will generally intercept more annual solar irradiation than a horizontal panel. This premise is useful for comparing mounting configurations, but it addresses only the relative effect of orientation. It does not establish whether the underlying annual solar resource is sufficiently large to warrant continued technical and economic evaluation. A substantial percentage gain from inclination may still represent only a modest absolute increase when the baseline resource is weak.
The distinction is important because photovoltaic performance depends on more than solar geometry. Direct-beam irradiance is affected by the angle of incidence, but annual plane-of-array (POA) irradiation also includes diffuse-sky and ground-reflected components and is influenced by persistent cloud conditions, atmospheric properties, albedo, seasonality, and local climate. Accordingly, latitude or idealized clear-sky geometry alone cannot reliably determine the annual solar resource available to a photovoltaic system.
Absolute annual resource also affects the broader energy value of photovoltaic deployment. Life-cycle studies show that annual insolation materially influences energy payback time, energy return on energy invested, and emissions per unit of electricity generated [1,2,3]. These studies do not establish a universal minimum irradiation threshold, but they consistently demonstrate that the magnitude of the underlying resource is a first-order input to energy performance.
The economic context for residential photovoltaic deployment in the United States has also changed materially. Through 2025, the federal Residential Clean Energy Credit permitted eligible homeowners to claim a tax credit equal to 30% of qualified residential clean-energy expenditures [4]. This incentive reduced the net capital cost borne by qualifying homeowners and could therefore improve project financial attractiveness, including in locations where the underlying solar resource was comparatively modest. Public Law 119-21 amended Internal Revenue Code Section 25D to terminate the credit for expenditures made after 31 December 2025 [5].
The removal of this federal cost offset increases the importance of distinguishing locations with intrinsically stronger photovoltaic resources from those whose project economics may have depended more heavily on external incentives. The present study does not quantify the economic effect of the policy change or determine project-specific residential payback. Instead, it addresses the preceding physical screening question: before detailed financing, tariff, equipment-cost, or incentive assumptions are introduced, does a location possess sufficient long-term all-sky solar resource to warrant further photovoltaic evaluation, and, if so, does inclined mounting provide a material additional energy benefit?
The present study therefore separates two decisions that are often treated as one. The first is a resource-screening decision: does a city possess sufficient long-term, all-sky horizontal irradiation to remain a credible candidate for continued photovoltaic evaluation? The second is a mounting-comparison decision: after the baseline resource has been established, does the additional irradiation obtained from inclined racking justify more detailed structural and economic analysis? This ordering prevents the benefit of the mounting system from being used to rescue or mask a weak underlying solar resource.
Using six years of all-sky irradiation data for 54 cities, this study compares horizontal, latitude-tilted, and annual-optimum fixed-panel configurations. A literature-informed 1.4 MWh/m²/year value was retained initially as a conservative reference and sensitivity point, but the final Gate 1 threshold was not assumed a priori. Instead, the ordered horizontal-resource distribution was examined for classification stability and natural separation among observations. That analysis identified a substantially cleaner breakpoint at 1.525 MWh/m²/year (approximately 4.2 equivalent peak-sun-hours/day). The resulting threshold is treated as a study-derived risk-routing criterion rather than a universal physical or economic boundary. The analysis remains a comparative screening framework rather than a full life-cycle, levelized-cost, or project-feasibility assessment.
2. Literature Review and Conceptual Framework
2.1. Solar Geometry and Cosine-of-Incidence Principles
The orientation of a photovoltaic surface relative to the sun determines the direct-beam irradiance intercepted by that surface. For a fixed array, the relevant geometric variables include geographic latitude, solar declination, hour angle, solar zenith angle, collector tilt, and collector azimuth. These variables determine the solar angle of incidence, defined as the angle between the incoming solar beam and the normal to the collector surface.
The direct-beam irradiance incident on an inclined surface is expressed as
G₍b,POA₎ = DNI cos(θᵢ)
where DNI is direct normal irradiance and θᵢ is the solar angle of incidence. The cosine relationship is fundamental to fixed-panel orientation: intercepted direct radiation is greatest when solar rays are normal to the collector and decreases as the incidence angle increases.
This relationship does not imply that annual photovoltaic resource can be calculated as cos(φ), where φ is geographic latitude. Latitude is one input to the solar-position calculation, whereas the incidence angle changes continuously with time of day, day of year, solar declination, collector tilt, and azimuth. A latitude-only calculation cannot reproduce annual direct-beam energy on a fixed surface.
More importantly, the cosine relationship applies only to the direct-beam component. Total POA irradiation also includes diffuse radiation from the sky and radiation reflected from the ground and surrounding surfaces [6]. In general form,
G₍POA₎ = DNI cos(θᵢ) + G₍d,POA₎ + G₍r,POA₎
where G₍d,POA₎ is the diffuse-sky component and G₍r,POA₎ is the ground-reflected component. Gueymard showed that the tilted direct term is geometrically straightforward when DNI is known, whereas diffuse and reflected terms require additional transposition assumptions and environmental inputs [6].
The treatment of diffuse irradiance is therefore central to solar-resource modeling. Isotropic models assume uniform diffuse radiance across the sky dome, while anisotropic formulations account for circumsolar radiation, horizon brightening, sky clearness, and the nonuniform angular distribution of diffuse radiation. The Perez model, for example, represents changing diffuse contributions across clear, intermediate, and overcast conditions [7].
Contemporary photovoltaic performance models retain this component-based structure. PVWatts defines POA irradiance as the sum of beam, sky-diffuse, and ground-reflected components and uses hourly DNI and diffuse horizontal irradiance to estimate tilted-plane resource [8]. The Sandia photovoltaic array model likewise treats beam irradiance, diffuse irradiance, angle-of-incidence effects, spectral response, and effective irradiance as distinct influences on performance [9]. Large-scale PV-potential modeling continues to apply the same physical distinction [10].
These formulations establish an important boundary for the present study. Latitude and incidence-angle geometry provide the physical basis for comparing orientations, but they do not independently determine annual POA irradiation. Reliable annual assessment requires time-resolved solar geometry together with measured or modeled direct, diffuse, and reflected irradiance components. Latitude should therefore be treated as an orientation variable, not as a complete representation of local solar-resource quality.
2.2. Fixed Tilt, Latitude Tilt, and Annual-Optimum Tilt
Fixed photovoltaic mounting systems retain a constant inclination and azimuth throughout the year. In the Northern Hemisphere, fixed arrays are generally oriented toward the south, while inclination is selected either to increase annual POA irradiation or to satisfy structural, architectural, land-use, and operating constraints. Fixed systems are widely deployed because they have fewer moving components, lower maintenance requirements, and less mechanical complexity than tracking or seasonally adjustable systems.
A horizontal or flat-mounted photovoltaic panel has a tilt angle of 0°. Flat mounting is common on commercial rooftops, canopies, and other constrained structures where low profile, wind loading, construction simplicity, drainage, roof penetrations, and module density may be more important than maximizing irradiation received by each module. Although a horizontal panel generally receives less annual direct-beam irradiation than an appropriately inclined surface, it may receive a comparatively larger fraction of diffuse-sky radiation and may permit more modules within a fixed roof or land area.
The distinction between irradiation per unit of module area and total site production is therefore important. In a national-scale Swiss rooftop assessment, annual irradiation was highest on south-facing surfaces inclined near the regional latitude, but estimated technical potential shifted toward shallower roof inclinations because usable area, roof form, shading, and installable capacity affected total generation [10]. Thus, the inclination that maximizes irradiation on a module is not necessarily the configuration that maximizes generation from a constrained site.
Latitude tilt refers to a fixed inclination approximately equal to the geographic latitude of the installation. It is widely used as a first-order design rule because it aligns the collector reasonably well with the annual solar path while avoiding detailed angle optimization. Regional and global studies generally find annual-optimum inclinations near latitude, while also showing departures associated with diffuse fraction, albedo, climate, and local meteorology [11,12].
The annual-optimum tilt is the fixed inclination that maximizes modeled annual irradiation or electrical energy output for a specified location, azimuth, weather dataset, and system definition. It is normally identified by calculating annual performance across candidate inclination angles. Unlike latitude tilt, the annual optimum is therefore a model result rather than a geographic rule.
The calculated optimum may differ from latitude because POA components respond differently to inclination. Direct-beam radiation is projected geometrically, while diffuse-sky and ground-reflected components require separate treatment [6]. Their relative importance changes with cloud cover, atmospheric conditions, albedo, season, and location. Two sites at similar latitudes may therefore have different annual-optimum inclinations.
Detailed performance models also distinguish incident irradiation from electrical output. The Sandia framework treats beam and diffuse irradiance, angle-of-incidence losses, spectral response, operating temperature, and mounting configuration as separate influences on effective irradiance and module performance [9]. An angle that maximizes incident irradiation may therefore differ slightly from one that maximizes electrical energy.
Despite these influences, annual response near the optimum is commonly broad. Small departures from the calculated optimum often produce only minor changes in annual output. Global regression studies report low average energy losses for modest deviations from optimum tilt, supporting latitude tilt as a transparent approximation for preliminary fixed-system analysis [12].
In a foundational U.S. analysis, Lave and Kleissl reported that optimum fixed orientation increased annual incident irradiation by approximately 10–25% relative to horizontal mounting, with benefits varying across latitude and regional atmospheric conditions [13]. Their findings establish the importance of orientation and climate effects; the present study instead evaluates a sequential screening decision, separating all-sky horizontal resource adequacy (Gate 1) from the incremental benefit of inclined mounting (Gate 2).
Recent national-scale work reinforces this distinction. Haroun et al. used six years of five-minute irradiance data from 184 U.S. training locations and 15 independent test cities to predict annual, seasonal, and monthly optimum tilt angles for monofacial and bifacial systems. For annual monofacial predictions, the best machine-learning model reproduced simulated optimum angles within 1.0°, while the associated irradiation discrepancy remained below 0.01% [14]. These results show that exact tilt optimization can be predicted efficiently across a broad geographic domain, but also that small angular departures from the modeled optimum have negligible annual-energy consequences. This supports the use of latitude tilt as a practical preliminary comparator while preserving a separate role for site-specific optimization at later design stages.
The literature therefore identifies three distinct mounting questions: whether horizontal or inclined mounting better suits site constraints; whether latitude tilt adequately approximates annual optimum; and whether the additional production from inclination is sufficient to justify added racking, spacing, structural loading, and installation cost.
The present study evaluates these questions using three fixed configurations. Horizontal mounting provides the baseline condition. Latitude tilt represents the simple inclined alternative. Annual-optimum tilt tests whether more detailed angle selection materially changes preliminary assessment. Latitude tilt and annual optimum are mounting alternatives, not measures of overall site viability. Their value should be evaluated after the underlying all-sky solar resource has been established.
While latitude tilt provides a practical approximation for annual fixed-panel orientation, its performance cannot be evaluated from solar geometry alone. The direct, diffuse, and ground-reflected components of POA irradiation respond differently to cloud cover and atmospheric conditions. Section 2.3 therefore examines clear-sky and all-sky irradiation and their implications for solar-resource classification.
2.3. Clear-Sky Versus All-Sky Irradiation and Diffuse Radiation
Solar geometry defines the deterministic position of the sun and the angle at which direct radiation reaches a receiving surface. It does not determine the amount of radiation that penetrates the atmosphere. Clouds, aerosols, water vapor, ozone, and other constituents alter both the magnitude of irradiance and its division among direct, diffuse, and reflected components. Clear-sky geometry therefore represents an idealized atmospheric condition rather than the annual resource experienced by an operating photovoltaic system.
Clear-sky irradiance refers to radiation expected when clouds are absent, although aerosols, water vapor, elevation, and other atmospheric properties may still be represented. All-sky irradiance includes clear and cloudy periods and reflects changing atmospheric conditions over the analysis period. Clouds can strongly attenuate DNI while increasing the diffuse fraction received at the surface.
Direct and diffuse components respond differently to inclination. Direct-beam irradiance is projected through the cosine of the incidence angle, whereas diffuse-sky irradiance depends on the angular distribution and brightness of the sky. Under overcast conditions, diffuse radiation may comprise most of the available resource. The effect of inclination therefore cannot be represented accurately without accounting for a changing direct-to-diffuse ratio.
This requirement is reflected in PVWatts, which uses hourly DNI and diffuse horizontal irradiance and applies the Perez transposition model to estimate beam, sky-diffuse, and ground-reflected irradiance on the array plane [8]. The model therefore requires weather-informed inputs rather than deriving annual tilted-plane performance from latitude or clear-sky geometry alone.
Gueymard found that tilted-irradiance model performance generally deteriorated when cloudy periods were included. Under all-sky conditions, bias and random error increased because cloud variability complicated the direct/diffuse distribution and spatial uniformity assumed by the models; errors increased further when direct and diffuse components had to be estimated from global horizontal irradiance [6].
Satellite-derived solar-resource products incorporate cloud and atmospheric observations. NREL validation of the National Solar Radiation Database found substantially greater scatter during cloudy periods than during clear periods. Important sources included subpixel cloud variability, cloud parallax, cloud and snow discrimination, aerosol properties, bright surfaces, and spatial mismatch between a satellite grid cell and a point instrument [15]. Cloudy-sky behavior is therefore not simply a scaled reduction of clear-sky output.
The Sandia array-performance framework similarly uses solar-resource and meteorological data and separately represents electrical, thermal, spectral, and optical effects. Outdoor validation under clear and cloudy or overcast conditions showed that actual performance reflects several simultaneously changing variables rather than solar position alone [9].
Clear-sky estimates remain useful for identifying the geometric upper structure of the resource and checking model behavior. They are not sufficient for determining annual resource adequacy. For comparative city screening, annual all-sky irradiation is the appropriate resource measure because it combines solar geometry with atmospheric conditions that determine the radiation actually available to a photovoltaic surface.
2.4. Climate-Region Effects and Geographic Heterogeneity
The atmospheric conditions that determine solar-resource availability are geographically heterogeneous. Cities at similar latitudes may experience different annual irradiation because cloud frequency, aerosol loading, humidity, elevation, snow cover, coastal influence, and seasonal weather patterns alter the transmission and partitioning of solar radiation. Latitude establishes the astronomical solar path, but regional climate determines how much of the theoretical resource reaches the ground.
Cloud regime is among the most important sources of geographic variation. Coastal locations may experience recurring marine cloud layers, while continental and arid regions may have clearer skies but greater aerosol or dust loading. Mountain environments can benefit from higher elevation and reduced atmospheric path length, while local terrain, snow cover, and rapidly changing weather introduce additional variability.
Aerosols and water vapor also vary regionally and seasonally. These effects can change total irradiation, the solar spectrum, and the relative performance of different module technologies. Ground reflectance varies as well, particularly in snowy climates, where reflected radiation can form a larger share of POA irradiation for steeply tilted surfaces.
Large-area PV modeling confirms that the geographic pattern of electrical performance does not precisely follow annual irradiation. Huld and Gracia Amillo combined satellite-derived irradiance with air temperature, wind speed, solar spectrum, angle-of-incidence effects, and irradiance-dependent efficiency, showing that sites with similar irradiation can produce different module-level energy [16].
Temperature is especially important because most modules operate less efficiently as cell temperature rises. High-resource desert locations may therefore experience thermal losses, while wind can partly offset these losses through cooling. These interactions reinforce the distinction between geographical solar resource and complete technology-specific energy yield.
The reliability of modeled solar-resource data is also geographically dependent. Palmer and Blanchard found that satellite-dataset rankings changed with site, elevation, climate, temporal resolution, aggregation method, and statistical metric [17]. NREL validation similarly showed that bias and random error were not uniform among locations or atmospheric conditions [15].
These findings have two implications for multicity analysis. First, a latitude-based or clear-sky comparison cannot substitute for long-term all-sky data. Second, a common modeled dataset improves consistency among cities but does not eliminate geographic uncertainty. City rankings should therefore be interpreted as comparative screening results rather than bankable site-specific production forecasts.
The present study addresses geographic heterogeneity by applying a common long-term all-sky methodology across all 54 cities. This permits consistent comparison of horizontal, latitude-tilted, and annual-optimum configurations while preserving climatic differences in the underlying irradiance record.
2.5. Resource Thresholds, Specific Yield, Lcoe, Energy Payback, and the Use of an External Screening Benchmark
Annual POA irradiation, photovoltaic energy yield, and project economics are related but distinct quantities. POA irradiation describes solar energy incident on the module surface. Specific yield expresses electrical energy produced per unit of installed capacity. Final delivered energy additionally reflects thermal, optical, electrical, availability, soiling, and conversion losses. Levelized cost of electricity (LCOE) then incorporates capital cost, operating cost, financing, degradation, system life, and other project assumptions.
Marion et al. formalized this distinction through reference yield, array yield, final yield, and performance ratio [18]. Reference yield characterizes the in-plane resource, while final yield represents delivered electricity normalized by installed capacity. A high performance ratio does not fully compensate for a weak resource; a lower-performing system in a strong-resource location may still generate more annual electricity than a high-performing system in a weak-resource location.
This distinction is central to the present study. A 20% improvement applied to a weak annual resource may produce less additional energy than a 5% improvement at a resource-rich site. Relative mounting gains should therefore be interpreted only after the magnitude of the underlying all-sky resource has been established.
Life-cycle studies support this resource-first interpretation. Annual insolation materially affects energy payback time, energy return on energy invested, and life-cycle emissions per kilowatt-hour [1,2,3]. These studies do not establish a universal irradiation threshold, but they show that annual resource is a first-order determinant of the energy over which embodied impacts are recovered.
Photovoltaic conversion performance also varies independently of irradiation. Huld and Gracia Amillo showed that temperature, wind speed, spectral conditions, angle-of-incidence losses, and low-irradiance behavior can cause different module-level yields at sites with similar annual irradiation [16]. Field measurements likewise distinguish reference, array, and final yields and identify temperature, inverter conversion, and soiling as contributors to the difference between available resource and delivered electricity [19].
The economic value of photovoltaic generation requires further project-specific inputs. Vartiainen et al. found that location and annual yield were among the strongest physical influences on modeled utility-scale PV LCOE, while weighted average cost of capital was a dominant financial influence [20]. A solar-resource screen therefore cannot establish commercial feasibility by itself.
The same principle applies to performance-enhancement measures. Harmailil et al. showed that gross percentage improvements must be evaluated against fabrication cost, auxiliary energy, maintenance, occupied area, equipment life, and operating complexity [21]. Applied to mounting geometry, the additional energy from inclined racking must ultimately justify added racking cost, structural loading, spacing, installation effort, and maintenance exposure.
Complete site suitability extends beyond irradiation and conversion. GIS-based studies commonly treat solar-resource magnitude as an initial criterion and then incorporate terrain, land use, environmental exclusions, access, hazards, and infrastructure. Charabi and Gastli found that only approximately 0.5% of Oman’s land area achieved a highly suitable classification despite generally strong solar resource [22].
The present study does not reproduce a complete LCOE, life-cycle, or site-suitability model for every city. Instead, it uses 1.4 MWh/m²/year as a literature-informed preliminary reference and then tests whether the 54-city all-sky horizontal-resource distribution supports a more discriminating internal breakpoint. The purpose is not to discover a universal minimum irradiation requirement, but to identify a transparent point at which the depth of required financial diligence should change.
Within this framework, cities below the final breakpoint are not declared technically incapable of supporting PV, nor are cities above it declared economically viable. The threshold is a risk-routing device. Locations above the breakpoint can proceed through a conventional Level 1 preliminary ROI review. Locations below it require Level 2 diligence in which project-specific CAPEX, financing, electricity value, incentives, interconnection, operating losses, site constraints, and other economic variables receive greater scrutiny before capital commitment.
2.6. Proposed Two-Gate Conceptual Framework
Based on the preceding literature, this study proposes a two-gate framework for evaluating fixed photovoltaic mounting options across 54 U.S. cities. The framework separates resource adequacy from mounting improvement, preventing relative tilt gains from being interpreted without reference to the magnitude of the underlying annual solar resource.
This framework addresses a decision problem that remains distinct from large-area tilt-optimization studies. Haroun et al. developed a machine-learning method for estimating optimum tilt after a location and panel configuration had already been specified [14]. The present study instead asks whether the location possesses a sufficiently strong all-sky annual resource to justify proceeding to tilt optimization at all. The contribution is therefore not the number of locations analyzed, but the ordered separation of resource adequacy from mounting optimization.
Gate 1 evaluates the underlying solar resource before inclined-racking performance is credited. Each city is screened using the six-year mean all-sky horizontal irradiation. An initial 1.4 MWh/m²/year literature-informed reference was subjected to sensitivity analysis and comparison with the ordered city distribution. The final study-specific Gate 1 breakpoint is 1.525 MWh/m²/year, equivalent to approximately 4.18 peak-sun-hours/day and rounded to 4.2 for interpretation. Passing Gate 1 does not establish profitability; it indicates that the baseline resource is sufficiently strong to proceed with a conventional preliminary economic review. Falling below the breakpoint triggers enhanced financial diligence rather than automatic rejection.
Gate 2 evaluates the value of inclined mounting after the Gate 1 resource screen. Annual irradiation from the horizontal baseline is compared with irradiation from a fixed latitude-tilted configuration. Absolute and percentage gains quantify the additional energy capture attributable to the more complex mounting system. Annual-optimum tilt is also examined to determine whether detailed angle optimization adds meaningful value beyond the simple latitude rule.
The framework produces four classifications: strong resource with a large tilt benefit; strong resource with a limited tilt benefit; weak resource with a large relative tilt benefit; and weak resource with a limited tilt benefit. The third category is particularly important because it identifies cities where inclination produces an attractive percentage improvement while the underlying annual resource remains weak.
The two-gate method is intentionally a screening framework rather than a complete feasibility model. It does not incorporate project-specific capital cost, financing, structural loading, interconnection, land or roof constraints, operating losses, hourly electricity value, or market-specific incentives. It establishes a logical sequence: first determine whether the all-sky flat-panel resource warrants ordinary or enhanced financial scrutiny; then determine whether inclined mounting warrants more detailed structural and economic analysis.
3. Materials and Methods
The analysis uses a purposive sample of 54 U.S. cities spanning six climate groups and a broad range of latitudes and atmospheric conditions. For Gate 1, annual horizontal irradiation is obtained from historical hourly NSRDB GHI values and averaged across 2018–2023. For all-sky Gate 2, each city-year's hourly GHI, DNI, DHI, and solar-zenith inputs are used in an independently implemented irradiance-transposition model. Modeled hourly irradiation for horizontal, latitude-tilted, and candidate annual-optimum fixed surfaces is summed to annual kWh/m² and then averaged over the six study years. Clear-sky comparisons in this study concern the horizontal resource; clear-sky inclined-plane values were not recalculated.
3.1. City Selection and Climate-Group Definitions
The 54-city sample was selected to provide geographic coverage across the continental United States together with Alaska and Hawaii and to span six climate groups used consistently throughout the analysis. Latitude and longitude are retained for each city so that geometric relationships can be evaluated independently of climate-group membership. Figure 1 shows the geographic distribution of the sample and the six climate groups used in subsequent comparisons.
The cities were selected to span major U.S. geographic regions, including the Pacific Northwest, Southwest, central plains, Northeast, and Southeast, with Alaska and Hawaii extending the latitude and atmospheric range. The six climate descriptors—hot humid, mixed humid, hot dry, mixed dry/high plains, cold/very cold, and marine/coastal—serve as recognizable stratification categories for comparison, not as independently estimated causal climate classes. The resulting 54-city sample is purposive rather than statistically representative of every U.S. parcel; its value lies in enabling consistent contrasts across distinct atmospheric settings and in generating hypotheses that future, more densely sampled studies can test.
3.2. Source Dataset, Temporal Coverage, and Annualization
The controlled Gate 1 analysis uses six-year mean annual all-sky horizontal irradiation derived from historical hourly NSRDB GHI records. The corrected all-sky Gate 2 analysis independently transposes recorded hourly GHI, DNI, DHI, and solar zenith to a south-facing surface at latitude tilt. Hourly modeled irradiation is summed to yearly kWh/m² and averaged across 2018–2023. Historical cumulative POA outputs with unresolved baseline discrepancies are superseded for all-sky latitude-tilt results. Clear-sky horizontal data remain separately validated; clear-sky tilted POA and annual-optimum results have not been recalculated in this analysis.
The analysis uses time-resolved NSRDB estimates of GHI, DNI, and DHI, incorporating modeled cloud and atmospheric conditions. The present calculation transposes these components to specified receiving surfaces rather than modeling the atmosphere independently. Calculations use an isotropic diffuse-sky representation, a fixed ground albedo of 0.20, and hourly solar geometry for a south-facing array. They are independently reconstructed results and should not be described as an exact replication of the earlier tilt-model implementation. The horizontal GHI identity checks underpin Gate 1; the specified transposition method defines the scope and limitations of the all-sky Gate 2 estimates.
The present multicity investigation extends the NSRDB-based photovoltaic tilt-selection and pre-design framework developed by Cegielski et al. [23]. Whereas that work centered on fixed-orientation and monthly tilt-selection performance, the present study separates the underlying horizontal resource screen (Gate 1) from subsequent inclined-mounting benefit analysis (Gate 2). This methodological connection does not imply that the earlier study validated the present 1,525 kWh/m²/year screening threshold.
A supplemental Northeast geographic check was defined after the 54-city Gate 1 classifications had been mapped, to investigate under-sampled states along the hypothesized northern Atlantic influence corridor. Five additional state capitals (Concord, NH; Hartford, CT; Providence, RI; Trenton, NJ; and Dover, DE) were evaluated, with Burlington, VT retained as an existing 54-city control. The preregistered working instructions specified the identical 2018–2023 NSRDB all-sky horizontal/flat resource workflow, six individual annual values and their arithmetic mean, annual kWh/m² and equivalent peak-sun-hours/day, the 1,525 kWh/m²/year Gate 1 classification and margin, and a comparison with the prior 1,400 benchmark. Coverage, calendar, units/scaling, and flat-versus-GHI identity checks were required. This diagnostic sample was held separate from the 54-city core; neither the main threshold nor core counts were recalculated from these supplemental observations.
3.3. Definitions and Mounting Configurations
Horizontal mounting is defined as a fixed surface at 0 degrees tilt. Latitude tilt is defined as a south-facing fixed surface inclined at the geographic latitude of the city. Annual-optimum tilt is the fixed inclination that maximizes modeled annual POA irradiation for the relevant city and weather data. Clear-sky results represent modeled irradiance under cloud-free conditions, whereas all-sky results incorporate the atmospheric and cloud conditions contained in the source dataset. POA irradiation is reported as annual-average kWh/m²/year, with MWh/m²/year used where appropriate for screening thresholds.
3.4. Quality-Assurance Rules and Formula Verification
The horizontal baseline was checked against annual reference GHI for all 54 cities, with reported differences below 0.1% in the separate validation export. The recovered all-sky archive contains 324 city-year files with 8,760 hourly records per file, including GHI, DNI, DHI, and solar zenith. Independently recalculated horizontal closure and six-year aggregation were checked. The tilted-plane calculation assumes a south-facing fixed surface, isotropic diffuse sky, and ground albedo of 0.20 because the source albedo field is blank. The annual-optimum sensitivity analysis sweeps candidate fixed tilt angles from 0° to 70° in one-degree steps, selecting a separate optimum in each year. The 2020 source files omit February 29; all results describe the provided 365-day annual records.
The source audit retained 54 distinct site identifiers and documented coordinates, source-file coverage, units, and derived fields. The horizontal identity audit and city-year completeness checks support the corrected Gate 1 resource values. Earlier cumulative inclined-plane output exhibited substantial horizontal-reference discrepancies and was superseded. Consequently, all reported all-sky latitude-tilt and annual-optimum results herein arise from the independently reconstructed hourly transposition rather than the earlier cumulative POA tables. Residual uncertainty comes from the adopted transposition approximation, fixed albedo, source-resource uncertainty, temporal conventions, and city-scale rather than site-specific conditions.
3.5. Gate 1: All-Sky Horizontal Resource Screen and Threshold Selection
Gate 1 is applied to the all-sky horizontal configuration because its purpose is to evaluate the underlying site resource before any performance benefit or cost associated with inclined racking is introduced. The analysis began with 1.4 MWh/m²/year as a conservative literature-informed reference value. Rather than treating that value as a universal boundary, candidate thresholds were compared against the ordered 54-city distribution. A threshold near 1.500 MWh/m²/year provided poor discrimination because observations occurred immediately on both sides of the line. By contrast, 1.525 MWh/m²/year fell inside an approximately 46 kWh/m²/year unoccupied interval between Washington, DC (~1,502 kWh/m²/year) and Nashville, TN (~1,548 kWh/m²/year), placing the nearest observed cities approximately 23 kWh/m²/year below and above the threshold. Gate 1 therefore adopts 1.525 MWh/m²/year, equivalent to approximately 4.18 peak-sun-hours/day, as a study-specific risk-routing breakpoint. Cities above it proceed to Level 1 preliminary economic review; cities below it proceed to Level 2 project-specific financial diligence. The threshold is not presented as a universal physical or economic viability boundary. Figure 2 presents the ranked horizontal-resource values and the adopted Gate 1 threshold.
The initial 1.400 MWh/m²/year reference was treated as a screening hypothesis, not as a physical or economic cutoff. At that value, 46 of the 54 cities pass and eight fall below the screen, but the boundary does not provide the intended practical separation. Comparison of the ordered all-sky horizontal distribution, candidate threshold margins, and post-classification geography led to a study-specific breakpoint of 1.525 MWh/m²/year. The closest observations are Washington, DC (approximately 1,502 kWh/m²/year) and Nashville, TN (approximately 1,548 kWh/m²/year), separated by about 46 kWh/m²/year. The selected breakpoint is approximately 23 kWh/m²/year from either observation; it routes 37 cities to conventional Level 1 screening and 17 to enhanced Level 2 financial diligence. Geographic clustering lends interpretive context but is not independent evidence that the threshold is economically optimal. No resource screen authorizes capital commitment without project-specific assessment.
3.6. Gate 2: Latitude-Tilt Gain Over Horizontal Mounting
Gate 2 evaluates the percentage improvement in all-sky annual POA irradiation obtained by replacing horizontal mounting with latitude tilt. The gain is calculated as the difference between latitude-tilted and horizontal annual irradiation divided by horizontal annual irradiation. The same percentage can be interpreted as an upper-bound energy-proportional installed-cost premium only under the simplifying assumption that all other lifecycle and project variables are unchanged. Figure 3 is used to evaluate the relationship between latitude and tilt gain, while Figure 4 summarizes mean tilt gain by climate group.
The latitude-versus-gain chart should be interpreted as a comparison of modeled annual irradiation gain against geographic latitude, not as a plot of optimized tilt angles. The physical mechanism combines changing direct-beam incidence with diffuse-sky and ground-reflected components; no simple cos(latitude) scaling can reproduce the observed annual gain. The approximate upward trend provides a useful screening expectation, while the dispersion among cities reminds practitioners that atmospheric and local conditions matter. The objective is not to explain every residual or optimize every angle, but to identify when an inclined mounting alternative merits cost and engineering analysis.
Climate-group mean gains make the effect of inclination legible to decision-makers, but percentage gain alone does not determine site suitability. For example, an illustrative horizontal resource of 1,450 kWh/m²/year increased by 14% would yield approximately 1,653 kWh/m²/year on the inclined plane. This does not change the city's Gate 1 classification, defined exclusively on horizontal all-sky irradiation. Instead, the gain may warrant a detailed mounting evaluation incorporating racking premium, row spacing, wind and snow loading, installation costs, energy value, and system losses. Figure 4 summarizes city-level gains produced by the independently reconstructed all-sky model.
3.7. False-Positive Test: Clear-Sky Versus All-Sky Classification
The clear-sky false-positive test applies the Gate 1 threshold to the corrected six-year mean annual clear-sky and all-sky horizontal irradiation. A false positive occurs when a city passes the 1,525 kWh/m²/year threshold under clear-sky conditions but fails under all-sky conditions. Of 54 cities, 53 pass under clear-sky assumptions, compared with 37 under all-sky conditions; the resulting 16 false positives demonstrate the risk of substituting idealized atmospheric conditions for all-sky resource estimates. Figure 5 displays the clear-sky versus all-sky classifications.
Figure 5 identifies 16 cities (29.6% of the 54-city sample) that would be routed to conventional Level 1 screening under clear-sky assumptions despite requiring enhanced Level 2 diligence based on all-sky horizontal irradiation. The other 37 cities pass both screens, while Fairbanks fails both. This classification discrepancy concerns the appropriate depth of preliminary diligence; it does not establish project-level profitability or predict actual financial failure.
3.8. Four-Quadrant Classification
The two gates are integrated using the 1,525 kWh/m²/year horizontal all-sky resource divider and an illustrative 15% latitude-tilt irradiation-gain divider. The resource threshold is study-specific; the 15% gain line is a comparative visualization choice, not a cost-benefit criterion. City placements use independently recalculated all-sky hourly transposition results and are not inferred from the superseded historical tilt ratios. Figure 6 depicts the resulting four-quadrant decision space.
The four quadrants clarify the difference between resource magnitude and the opportunity created by inclination. High-resource/low-gain cities have a comparatively strong horizontal baseline and may have little incentive to incur additional racking complexity. High-resource/high-gain cities combine a strong baseline with a potentially material tilt improvement, warranting a mounting-specific economic comparison. Resource-constrained/low-gain cities require enhanced financial diligence without a large modeled geometric uplift. Resource-constrained/high-gain cities are particularly instructive: tilt may add substantial relative irradiation, yet the weak horizontal baseline still routes them to Level 2 evaluation. Fairbanks and Honolulu illustrate opposite ends of the absolute-resource and relative-gain spectrum, but neither location can be assigned a definitive profitability outcome from annual irradiation alone.
3.9. Threshold and Optimum-Tilt Sensitivity
Sensitivity analysis now focuses on the region in which the Gate 1 decision actually changes. Candidate horizontal all-sky thresholds of 1.400, 1.450, 1.500, 1.525, 1.550, and 1.600 MWh/m²/year are compared. The purpose is not merely to count passing and enhanced-diligence classifications, but to examine how close the nearest observations lie to each candidate threshold. This comparison distinguishes thresholds that cut through a dense cluster of nearly equivalent cities from thresholds that fall within an empirical gap. Separately, annual-optimum tilt is compared with latitude tilt to quantify the incremental value of detailed angle optimization. Figure 7 presents the candidate-threshold sensitivity comparison.
The threshold sensitivity exercise evaluates whether a candidate boundary bisects a dense band of otherwise similar observations or falls inside an empirical interval with a more transparent separation margin. A threshold passing nearly all or almost none of the sample also offers limited routing discrimination. The 1,525 kWh/m²/year line lies between Washington, DC and Nashville with approximately 23 kWh/m²/year on either side, yielding the strongest separation margin among the candidate thresholds evaluated. Displaying the neighboring thresholds together allows readers to see that the revised Gate 1 value is supported not only by classification counts, but also by the spacing of the corrected observations. Figure 8 shows the incremental annual-optimum gain for the 54-city sample.
The annual-optimum sensitivity test evaluates candidate south-facing fixed tilt angles from 0° to 70° in 1° increments using the same hourly all-sky observations, isotropic-sky model, and albedo assumption as the latitude-tilt calculation. A separate best angle is selected for each calendar year; the annual optimized POA and latitude-tilt POA are then averaged over the six years. This is an upper-bound comparison for a site-specific annually selected fixed angle, not necessarily the optimal single structural angle installed for the entire six-year period.
Research Questions
RQ1: How much does latitude-based tilt improve all-sky annual POA irradiation relative to horizontal mounting across 54 U.S. cities?
RQ2: Does the ordered six-year all-sky horizontal-resource distribution reveal a defensible screening breakpoint for routing cities into different levels of photovoltaic financial diligence?
RQ3: How often does clear-sky analysis falsely classify a resource-constrained city as favorable when the Gate 1 screen is applied to horizontal all-sky resource?
RQ4: Does the geographic distribution of Gate 1 classifications reveal coherent regional patterns beyond latitude alone, and are those patterns consistent with known coastal, Great Lakes, and northern continental atmospheric influences?
RQ5: How much additional annual irradiation is obtained by optimizing tilt beyond the latitude angle?
4. Results
The results follow the two-gate sequence: sample coverage and data quality; all-sky horizontal resource and Gate 1 threshold; exploratory geographic distribution and a separate Northeast validation check; latitude-tilt benefit; clear-sky versus all-sky screening; and annual-optimum sensitivity. Gate 1 uses the validated horizontal resource series, and the Gate 2 figures use independently recalculated hourly all-sky plane-of-array irradiation under the stated isotropic-diffuse and albedo assumptions. These are model-based irradiation findings, not net electricity-output or financial feasibility predictions.
4.1. Dataset Qa and Sample Distribution
As shown in Figure 1, the 54-city sample spans a wide geographic range and six climate groups. The quality-assurance review confirmed 54 unique cities, complete core fields, valid coordinates, and internally consistent derived gain calculations.
Figure 1 demonstrates the intended breadth of the 54-city purposive sample across six recognizable climate groups. The groups are used to organize comparisons and communicate regional variation, not to imply that every city within a group experiences uniform meteorology. The subsequent resource screen is applied uniformly to individual-city all-sky horizontal values. Below-threshold observations are candidates for enhanced diligence rather than categorical exclusions, and any geographic pattern is interpreted only after the numerical classification.
4.2. Absolute All-Sky Horizontal Resource Screen and Empirical Breakpoint
Figure 2 ranks the cities by six-year mean annual all-sky horizontal irradiation. The original 1.4 MWh/m²/year reference placed several cities close to the decision line and therefore retained a substantial gray zone. Threshold comparison showed that 1.500 MWh/m²/year was also poorly discriminating, with cities immediately adjacent to the threshold. In contrast, a 1.525 MWh/m²/year screen falls within an approximately 46 kWh/m²/year gap between Washington, DC (~1,502) and Nashville, TN (~1,548). This produces approximately 23 kWh/m²/year of separation on each side of the breakpoint. At 1.525 MWh/m²/year, the corrected six-year horizontal screen classifies 37 cities above and 17 below the breakpoint.
4.3. Geographic Pattern of Gate 1 Classifications
When the 1.525 MWh/m²/year Gate 1 classifications were mapped, failures were not distributed randomly across the United States. They clustered visibly in the northern Pacific and Atlantic coastal regions, around the Great Lakes, and in portions of the northern continental interior. Most southern, southwestern, and lower-latitude inland locations exceeded the Gate 1 breakpoint. These regions were identified after the resource classifications had been completed; they were not used to construct the 1.525 threshold. Figure 9 therefore represents an exploratory geographic interpretation of the numerical screening result rather than a causal climate model.
Three heuristic overlays are used to organize the observed pattern for discussion and future testing: a northern-ocean coastal band extending approximately 50 miles inland from the northern Pacific coast through southern Oregon and from Maine south to Washington, DC; a Great Lakes influence zone extending approximately 200 miles from the five Great Lakes; and a northern-border zone extending approximately 250 miles south of Canada. These distances are interpretive screening zones rather than climatological boundaries. Their purpose is to show where known regional atmospheric mechanisms could plausibly contribute to the all-sky resource pattern and to identify where additional validation sites would be most informative. Figure 9 locates the study cities and illustrates the exploratory regional overlays.
The mapped Gate 1 results suggest three overlapping areas of interest: northern Pacific and Atlantic coastal districts, Great Lakes-adjacent locations, and selected northern-interior cities. These are hypotheses generated after screening, not boundaries that determine a city’s outcome. The 50-mile coastal, 200-mile Great Lakes, and 250-mile northern-border bands are visual heuristics and should not be generalized into automatic rules for untested locations. In particular, Fairbanks is an Alaskan interior site and is not evidence of a Pacific coastal marine-layer mechanism. A supplemental northeastern test sample can strengthen interpretation without altering the 54-city core cohort. No region identified in Figure 9 is intrinsically unprofitable; a lower solar resource simply calls for more careful project economics.
4.4. Supplementary Northeast Geographic Validation
The supplementary six-city check followed the planned 2018–2023 all-sky horizontal protocol using five new Northeast state capitals and Burlington as a control. All 36 city-year calculations completed, with zero coverage failures and a maximum absolute annual difference between calculated flat irradiation and reference GHI of 0.005010%. Of the five newly sampled locations, Concord, Hartford, Providence, and Trenton fell below the 1,525 kWh/m²/year Gate 1 threshold; Dover alone passed. Burlington also remained below the threshold. The separate validation sample therefore comprised five below-threshold locations and one above-threshold location, without altering the 37/17 split for the original 54 cities. Figure 10 displays the annual means and threshold margins, and Table 1 reports the underlying values. Figure 10 summarizes the six-location resource screening, and Table 1 reports the corresponding numerical values.
Dover, DE was the only supplemental location within ±25 kWh/m²/year of the adopted threshold (1,548.188 kWh/m²/year; margin +23.188). At the older 1,400 threshold, four of the five newly sampled capitals would have passed, whereas at 1,525 they were routed to enhanced diligence. This is an additional sensitivity illustration, not an independent optimization or economic validation of the selected cutoff. The six-site output passed source-data QA and was not pooled with the 54-city analysis.
4.5. Horizontal-Versus-Latitude-Tilt Gains
Recalculated Figure 3 shows a moderate positive relationship between geographic latitude and annual all-sky latitude-tilt gain (Pearson r approximately 0.56). The mean of the 54 city-specific gains is 10.06%, with substantial city-to-city dispersion. Figure 4 reports climate-group means derived from the same corrected hourly calculation. This replaces the stronger correlation and larger gains from the superseded historical POA outputs.
The independently recalculated hourly all-sky results show that latitude tilt generally provides greater relative irradiation gains at higher latitudes, while producing substantial variation among cities. Denver, for example, has a larger modeled relative gain than lower-latitude Miami, but latitude alone explains only part of the variation (Pearson r approximately 0.56). The direction and magnitude of any economic benefit remain dependent on structural and lifecycle costs, energy value, site geometry, and other project-specific factors.
4.6. Annual Optimum Versus Latitude Tilt
The independently recalculated annual angle sweep produces a city-average incremental irradiation gain of approximately 0.90% over latitude tilt, with the largest six-year mean city gain of 5.09%. This does not replicate the superseded 0.21% result, and should be understood as an annually reselected angle rather than one fixed angle optimized across the six-year record. Figure 8 uses the same historical hourly inputs and stated transposition model as Figure 3.
The recalculated annual-optimum comparison indicates that selecting the best fixed angle for each study year adds comparatively little mean irradiation beyond latitude tilt for most cities (city-average additional gain approximately 0.90%). This supports the latitude rule as a transparent early design comparator, while not ruling out value from detailed optimization at particular sites. The estimate depends on the isotropic-sky transposition and assumed albedo, and even a small percentage may matter for large facilities or time-dependent energy value. Annual reselection should not be confused with a single fixed installation angle chosen once for all six years.
4.7. Clear-Sky Classification Error
Figure 5 compares corrected six-year mean annual clear-sky and all-sky horizontal irradiation at the revised 1,525 kWh/m²/year Gate 1 threshold. Clear-sky screening admits 53 cities, whereas all-sky screening admits 37; the 16 false positives constitute 29.6% of the sample. These observations demonstrate a material change in preliminary diligence routing, not a measured rate of economically unsuccessful solar projects.
Sixteen cities would pass the clear-sky horizontal-resource screen but fall below the all-sky threshold. The practical risk is directing such projects to ordinary screening without the heightened investigation justified by their all-sky resource. All-sky resource estimates improve the realism of the initial comparison but do not substitute for site-specific yield and financial modeling.
4.8. Four-Quadrant City Classification
Figure 6 combines corrected horizontal resource with newly recalculated all-sky latitude-tilt gain. The 54 cities fall into the four illustrative resource–gain quadrants: Enhanced resource/high gain: 1, Enhanced resource/low gain: 16, Pass resource/high gain: 2, Pass resource/low gain: 35. These are physical irradiation comparisons, not profitability classifications.
A geographically coherent group of below-threshold cities is useful as an early warning for developers, including those considering sites near the Great Lakes. Such patterns should guide additional examination of solar data rather than substitute for an assessment of any particular project. A location with modest irradiation may still achieve attractive economics through low installed costs, strong energy prices, or complementary energy-stack value. The appropriate response to a weak Gate 1 result is Level 2 diligence before significant capital exposure.
4.9. Sensitivity of the Resource Screen
Figure 7 compares candidate thresholds at 1.400, 1.450, 1.500, 1.525, 1.550, and 1.600 MWh/m²/year. The important result is not simply the monotonic change in the number of passing cities as the threshold rises; it is the distance from each candidate threshold to the nearest observations. The 1.525 MWh/m²/year candidate is uniquely attractive in the current 54-city distribution because it lies near the center of the largest decision-relevant gap identified around the original screening range.
The most informative sensitivity result is the relatively wide interval in the observed city distribution that contains the 1,525 kWh/m²/year cutoff. Unlike thresholds close to sampled values, this midpoint offers an intelligible buffer on either side and produces a screening map with recognizable regional associations. The latter remains an exploratory visual pattern; it is not evidence that geographic zones universally obey the cutoff, nor that 1,525 kWh/m²/year maximizes returns.
4.10. Representative City Contrast
The Discussion interprets the revised Gate 1 breakpoint, the geographic pattern revealed after classification, and the Gate 2 mounting results. The geographic overlays are treated as hypotheses generated from the 54-city result rather than as causal boundaries established by the study. Figure 11 compares horizontal and latitude-tilted irradiation for the four representative locations.
5. Discussion
5.1. Resource-First Screening and Preliminary Diligence
The principal methodological result is the ordered separation of resource adequacy from mounting benefit. Gate 1 now evaluates the flat-panel all-sky resource at a study-derived 1.525 MWh/m²/year breakpoint before any improvement from inclined racking is credited. Gate 2 then asks whether the additional energy captured by latitude tilt is large enough to warrant further structural and economic evaluation. This ordering is important because a large percentage tilt gain can occur at a location with weak absolute resource, while a modest tilt gain can occur at a resource-rich location. The four-quadrant framework and representative-city contrast remain useful, but their economic interpretation is now explicitly subordinate to the Gate 1 resource-risk screen.
Four representative cities, shown in the recalculated Figure 11, illustrate why both screens matter. Honolulu has strong horizontal irradiation and a relatively small tilt gain; Denver has a strong resource and a larger modeled latitude-tilt benefit; Mobile provides a southeastern comparison; and Fairbanks combines the lowest horizontal resource with a comparatively large percentage benefit. None of these relative gains overrides Gate 1 classification.
The Gate 1 threshold changes the recommended depth of financial diligence rather than establishing a binary feasibility boundary. Locations above approximately 1,525 kWh/m²/year (~4.2 equivalent peak-sun-hours/day) proceed to conventional preliminary Level 1 economic review; locations below the line warrant enhanced Level 2 analysis of CAPEX, financing, electricity value, operating losses, interconnection and site constraints. Gate 2 then quantifies additional incident energy from inclined racking to support a subsequent mounting-specific engineering and economic comparison.
The moderate latitude–gain relationship and material intercity variation are shown in newly recalculated Figure 3; updated climate-group means are shown in Figure 4.
Latitude offers a useful geometric guide but cannot be made into a universal go/no-go rule. Most of the higher-resource observations in this purposive sample lie at lower latitudes, while inclination gains often increase farther north. Yet cloud regimes, topography, elevation, and local conditions create exceptions to any proposed 32° or 37° boundary. The geographic map is best used to prioritize all-sky resource review and targeted mounting-cost analysis rather than to assert a deterministic latitude cutoff.
5.2. Effect of Clear-Sky Assumptions on Site Classification
The classification error produced by clear-sky assumptions is shown in Figure 5 and tested across alternative screening thresholds in Figure 7.
Using clear-sky irradiation in place of all-sky resource can materially overstate available annual energy in cloud-affected locations. This difference can alter a city’s initial diligence pathway, even though no irradiance threshold is equivalent to a profitability test. Conversely, low-capital-cost installations or favorable energy contracts may support projects at below-threshold sites. The two-gate workflow therefore provides a transparent preliminary allocation of engineering and financial attention, not a substitute for site-specific economic modeling.
The clear-sky comparison remains important because atmospheric transmission and solar geometry are distinct. Under the study-specific Gate 1 threshold, 16 of 54 cities (29.6%) pass using clear-sky horizontal resource but require enhanced diligence using the all-sky horizontal resource. This is a classification difference, not a measured economic failure rate. Idealized clear-sky results may therefore misroute preliminary diligence if substituted for the historical all-sky baseline.
5.3. Geographic Clustering, Latitude, and Regional Atmospheric Effects
The geographic pattern in Figure 9 suggests that latitude alone is insufficient to explain Gate 1 classifications. The relation between latitude and the newly recalculated all-sky tilt gain is moderate, not determinative (r approximately 0.56). Coastal and Great Lakes effects remain untested explanatory hypotheses, not demonstrated causal screening zones.
The combined interpretation of absolute all-sky resource and relative tilt gain is summarized by the four-quadrant framework in Figure 6 and the representative-city contrast in Figure 11.
The observed clustering is consistent with, but does not establish, regional mechanisms involving coastal cloud decks, Great Lakes weather, and northern continental conditions. The study deliberately does not estimate causal effects of individual meteorological variables. Its contribution is to show how a uniform resource-first screen produces geographic questions worth testing while protecting project decisions from overreliance on simple latitude or projected tilt gains. Follow-up research should use more sites, observed cloud diagnostics, and parcel-scale validation to assess these hypotheses.
The preplanned six-site Northeast check was subsequently completed (Section 4.4, Figure 10 and Table 1). Four of the five newly sampled capitals—Concord, Hartford, Providence, and Trenton—fell below Gate 1, while Dover exceeded it by 23.2 kWh/m²/year; the existing Burlington control was also below the threshold. This pattern is consistent with the hypothesized northern Atlantic resource limitation in several tested locations, but the Dover exception cautions against treating the map overlays as climatic exclusion rules. Because the additional sites were purposefully selected after seeing the original map, the exercise is a targeted geographic consistency check, not an independent proof that the 1,525 threshold is statistically or economically optimal. The five new locations remain outside the 54-city statistics.
5.4. Practical Significance of Latitude Tilt Versus Annual-Optimum Tilt
Figure 8 demonstrates a recalculated mean 0.90% additional irradiation advantage from selecting the best fixed angle separately for each year, using a common transposition method. The magnitude and ranking depend on the diffuse-sky and albedo assumptions, and a distinct six-year common optimum would need a separate pooled optimization if the goal is one installation angle held constant for all six years.
For preliminary assessment, latitude tilt provides a transparent geometry-based comparison with horizontal resource. An independently recalculated one-degree annual optimum sweep adds about 0.90% mean annual irradiation over latitude tilt across this purposive 54-city sample. This small average physical benefit is not a cost-benefit result; structural complexity, mounting cost, and annual angle reset feasibility require separate study.
5.5. Implications for Racking and Preliminary Economic Screening
The resource ranking in Figure 2 and the two-gate classifications in Figure 6 establish the physical basis for deciding where a more detailed racking-cost comparison is warranted.
Gate 1 distinguishes a comparatively strong horizontal solar resource from one requiring enhanced financial scrutiny, not guaranteed high-confidence electrical production from lower-quality production. Gate 2 evaluates whether a more complex mounting configuration offers enough incremental incident energy to warrant a structural and financial comparison. Increased irradiation can improve a project case, but any conclusion about profitability requires actual yield, capital cost, operating cost, and electricity revenue assumptions.
Illustrative residential-scale energy comparison (not an economic or off-grid design study). To communicate the physical importance of horizontal resource differences, consider identical south- or north-unconstrained horizontal 400 W PV modules of 2 m² each, nominally 20% efficient. Assume an illustrative annual household electricity requirement of 13,248 kWh (1,104 kWh/month), and an aggregate 80% delivery factor for conversion and other system losses, excluding battery storage. The household load is an illustrative benchmark, not a site-specific estimate for a three-bedroom dwelling. The same assumptions are applied to both cities. Annual delivered electricity per module is E = H × A × η × f, where H is six-year mean all-sky horizontal irradiation, A = 2 m², η = 0.20, and f = 0.80. Module count is rounded upward to meet annual energy equivalence. The resulting module comparisons are summarized in Table 2.
On these uniform assumptions, the St. Petersburg resource supports approximately 615 kWh per module annually and 22 modules to match the illustrative annual load, whereas Seattle supports approximately 416 kWh per module and requires 32 modules, or about 45% more modules. The example isolates an irradiation-driven difference in preliminary array sizing; the 1,525 kWh/m²/year Gate 1 threshold routes diligence rather than determining an economic, electrical-yield, or reliability boundary. Matching annual energy is not proof of hour-by-hour supply adequacy. Off-grid operation would additionally require assessment of hourly and seasonal loads, storage capacity, battery round-trip losses, and prolonged low-resource periods. Detailed delivered-energy and financial assessments remain subjects for future research.
5.6. Limitations and Uncertainty
This study evaluates incident plane-of-array irradiation rather than net AC electricity production or project profitability. The purposive 54-city sample cannot resolve parcel-level shading, orientation constraints, terrain, or access. The analysis does not estimate project-specific capital costs, structural loading, soiling, module temperature, conversion losses, degradation, interconnection expense, financing, or energy prices. The 1,525 kWh/m²/year Gate 1 value is a sample-specific risk-routing convention rather than a universal physical or financial threshold; classifications near the boundary may change with data uncertainty, selected years, or additional cities. The coastal, Great Lakes, and northern-border overlays are exploratory hypotheses rather than validated causal zones. Gate 2's independent all-sky results depend on the isotropic-diffuse transposition approximation, assumed fixed ground albedo of 0.20, reconstructed solar geometry, 365-day source-year convention, and modeled NSRDB irradiance. Their agreement with GHI on horizontal planes validates the baseline identity but is not an independent field validation of tilted POA. The annual optimum is selected separately for each year and should not be interpreted as a single six-year fixed mounting angle. Clear-sky tilted POA was not recalculated.
5.7. Generalizability and Future Work
The six-site Northeast diagnostic provides an initial targeted geographic consistency check but does not replace a geographically broader independent validation. Future work should test the resource-first method against additional independent locations, measured tilted-plane irradiation, and operational photovoltaic electricity production. Priorities include quantifying multi-year threshold stability and uncertainty, testing the climate-zone hypotheses using meteorological covariates, evaluating alternative diffuse-sky and albedo assumptions, and comparing a single fixed six-year optimum with annually reselected tilt angles. Site-level cost and yield data would permit explicit evaluation of whether the proposed diligence routing improves development decisions.
6. Conclusions
This study proposes a sequential two-gate approach to preliminary fixed-photovoltaic evaluation across 54 U.S. cities. The original 1,400 kWh/m²/year horizontal-resource reference was tested rather than presumed to be an economic viability boundary. The six-year sample supports a study-specific Gate 1 breakpoint of 1,525 kWh/m²/year, between Washington, DC and Nashville, TN, with the nearest observations approximately 23 kWh/m²/year from the threshold on either side. The screen routes 37 cities to conventional preliminary economic review and 17 to enhanced project-specific diligence; it does not establish profitability. Clear-sky horizontal screening would route 16 cities differently from their all-sky classification. An independent hourly all-sky Gate 2 reconstruction gives a mean city latitude-tilt irradiation gain of 10.06%, with latitude–gain correlation of approximately 0.56. Annual selection of an optimum fixed tilt angle provides an additional mean 0.90% incident irradiation relative to latitude tilt under the stated isotropic-sky and albedo assumptions. Geographic clustering remains an exploratory hypothesis rather than evidence of deterministic climate boundaries. Separating underlying all-sky resource, inclination gain, and subsequent project economics provides a transparent early diligence framework without equating irradiance with financial feasibility. A separately QA-checked Northeast geographic exercise evaluated five additional state capitals plus one existing-study control: four of the five new sites were below Gate 1, while Dover was above it. This targeted check supports cautious investigation of regional patterns without changing the core 54-city estimates or proving causal geographic boundaries.
Author Contributions
Conceptualization, M.J.C.; methodology, M.J.C.; software, G.S.; validation, G.S.; formal analysis, M.J.C.; investigation, M.J.C.; resources, M.J.C.; data curation, G.S.; writing—original draft preparation, M.J.C.; writing—review and editing, M.J.C. and R.S.S.; visualization, M.J.C. and G.S.; supervision, R.S.S.; project administration, M.J.C. All authors have read and agreed to the published version of the manuscript.
Funding
This research received no external funding.
Data Availability Statement
The NSRDB input data used in this study are publicly available from the National Renewable Energy Laboratory (NREL). The processed 54-city annual irradiation datasets, supporting calculation records, supplementary Northeast validation tables, and figure-source data used to reproduce the reported results are available from the corresponding author upon reasonable request.
Acknowledgments
During the preparation of this manuscript, the authors used OpenAI’s ChatGPT for assistance with manuscript organization, technical explanations, computational workflow review, and editorial refinement. All AI-assisted material was critically reviewed and revised by the authors, who retain full responsibility for the methodology, data analysis, interpretation of results, and final published content.
Conflicts of Interest
The authors declare no conflicts of interest.
References
- Bhandari, K.P.; Collier, J.M.; Ellingson, R.J.; Apul, D.S. Energy payback time (EPBT) and energy return on energy invested (EROI) of solar photovoltaic systems: A systematic review and meta-analysis. Renew. Sustain. Energy Rev. 2015, 47, 133–141. [Google Scholar] [CrossRef]
- Louwen, A.; van Sark, W.G.J.H.M.; Faaij, A.P.C.; Schropp, R.E.I. Re-assessment of net energy production and greenhouse gas emissions avoidance after 40 years of photovoltaics development. Nat. Commun. 2016, 7, 13728. [Google Scholar] [CrossRef] [PubMed]
- Fthenakis, V.M.; Kim, H.C.; Alsema, E. Emissions from photovoltaic life cycles. Environ. Sci. Technol. 2008, 42, 2168–2174. [Google Scholar] [CrossRef] [PubMed]
- Internal Revenue Service. Residential Clean Energy Credit. Available online: https://www.irs.gov/credits-deductions/residential-clean-energy-credit (accessed on 20 August 2026).
- United States. Public Law 119-21, Section 70506, Termination of Residential Clean Energy Credit. 4 July 2025. Available online: https://www.congress.gov/119/plaws/publ21/PLAW-119publ21.pdf (accessed on 20 August 2026).
- Gueymard, C.A. Direct and indirect uncertainties in the prediction of tilted irradiance for solar engineering applications. Sol. Energy 2009, 83, 432–444. [Google Scholar] [CrossRef]
- Perez, R.; Ineichen, P.; Seals, R.; Michalsky, J.; Stewart, R. Modeling daylight availability and irradiance components from direct and global irradiance. Sol. Energy 1990, 44, 271–289. [Google Scholar] [CrossRef]
- Dobos, A.P. NREL/TP-6A20-62641; PVWatts Version 5 Manual. National Renewable Energy Laboratory: Golden, CO, USA, 2014.
- King, D.L.; Boyson, W.E.; Kratochvil, J.A. SAND2004-3535; Photovoltaic Array Performance Model. Sandia National Laboratories: Albuquerque, NM, USA, 2004.
- Walch, A.; Castello, R.; Mohajeri, N.; Scartezzini, J.-L. Big data mining for the estimation of hourly rooftop photovoltaic potential and its uncertainty. Appl. Energy 2020, 262, 114404. [Google Scholar] [CrossRef]
- Benghanem, M. Optimization of tilt angle for solar panel: Case study for Madinah, Saudi Arabia. Appl. Energy 2011, 88, 1427–1433. [Google Scholar] [CrossRef]
- Nicolás-Martín, C.; Santos-Martín, D.; Chinchilla-Sánchez, M.; Lemon, S. A global annual optimum tilt angle model for photovoltaic generation to use in the absence of local meteorological data. Renew. Energy 2020, 161, 722–735. [Google Scholar] [CrossRef]
- Lave, M.; Kleissl, J. Optimum fixed orientations and benefits of tracking for capturing solar radiation in the continental United States. Renew. Energy 2011, 36, 1145–1152. [Google Scholar] [CrossRef]
- Haroun, H.; Issa, J.S.; Rahme, P. Machine learning-based prediction of optimal tilt angles for monofacial and bifacial PV systems. Sol. Energy 2025, 301, 113924. [Google Scholar] [CrossRef]
- Habte, A.; Sengupta, M.; Lopez, A. NREL/TP-5D00-67722; Evaluation of the National Solar Radiation Database (NSRDB): 1998–2015. National Renewable Energy Laboratory: Golden, CO, USA, 2017.
- Huld, T.; Gracia Amillo, A.M. Estimating PV module performance over large geographical regions: The role of irradiance, air temperature, wind speed and solar spectrum. Energies 2015, 8, 5159–5181. [Google Scholar] [CrossRef]
- Palmer, D.; Blanchard, R. Evaluation of high-resolution satellite-derived solar radiation data for PV performance simulation in East Africa. Sustainability 2021, 13, 11852. [Google Scholar] [CrossRef]
- Marion, B.; Adelstein, J.; Boyle, K.; Hayden, H.; Hammond, B.; Fletcher, T.; Canada, B.; Narang, D.; Kimber, A.; Mitchell, L.; et al. Performance parameters for grid-connected PV systems. In Proceedings of the 31st IEEE Photovoltaic Specialists Conference, Lake Buena Vista, FL, USA, 3–7 January 2005; pp. 1601–1606. [Google Scholar]
- Chowdhury, K.; Mandal, R. Techno-economic viability and environmental assessment study of a small-scale grid-tied rooftop PV plant under changing weather condition. In Proceedings of the International Conference on Power Electronics and Sustainable Development, 2022; pp. 261–268. [Google Scholar]
- Vartiainen, E.; Masson, G.; Breyer, C.; Moser, D.; Román Medina, E. Impact of weighted average cost of capital, capital expenditure, and other parameters on future utility-scale PV levelised cost of electricity. Prog. Photovolt. Res. Appl. 2020, 28, 439–453. [Google Scholar] [CrossRef]
- Harmailil, I.; et al. A review on recent photovoltaic module cooling techniques: Types and assessment methods. Results Eng. 2024, 22, 102225. [Google Scholar] [CrossRef]
- Charabi, Y.; Gastli, A. PV site suitability analysis using GIS-based spatial fuzzy multi-criteria evaluation. Renew. Energy 2011, 36, 2554–2561. [Google Scholar] [CrossRef]
- Cegielski, M.J.; Santhanam, G.; Srinivasan, R.S. A Data-Driven Pre-Design Framework for Annual Fixed and Monthly Optimized Building-Mounted Photovoltaic Tilt Selection Using NSRDB Irradiance Data. Buildings 2026, 16(21), 4304. [Google Scholar] [CrossRef]
Figure 1.
Geographic coverage of the 54-city sample by climate group.
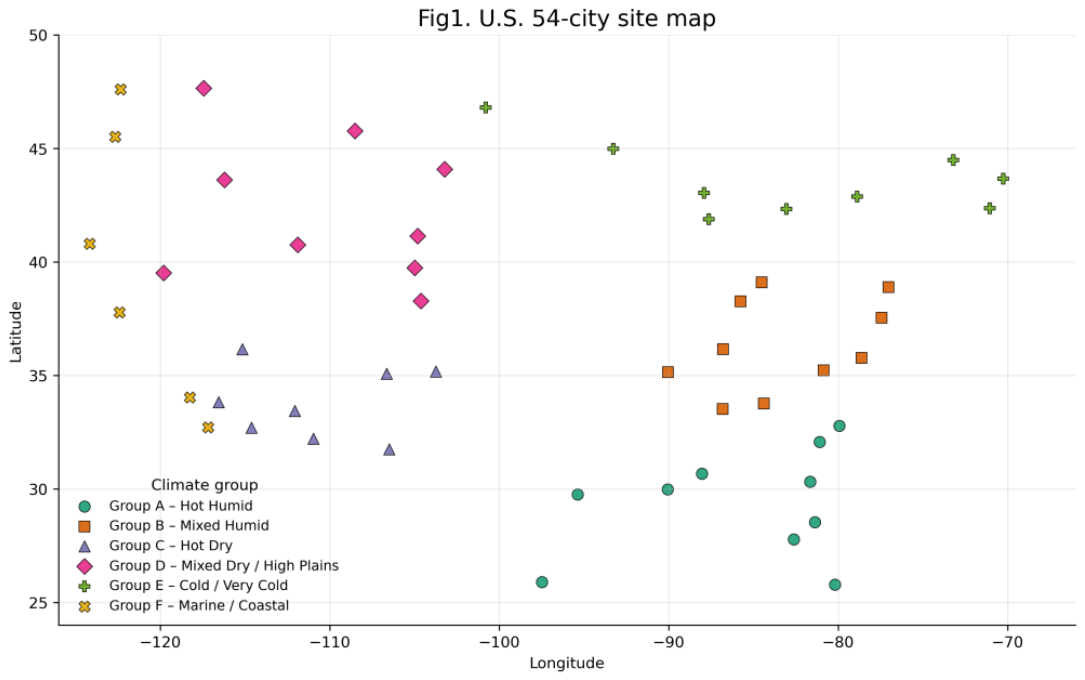
Figure 2.
Ranked six-year mean annual all-sky horizontal irradiation for 54 U.S. cities (2018–2023). The initial 1,400 kWh/m²/year reference and the revised 1,525 kWh/m²/year Gate 1 threshold are shown. At 1,525 kWh/m²/year, 37 cities proceed to conventional preliminary economic screening and 17 require enhanced project-specific diligence.
Figure 2.
Ranked six-year mean annual all-sky horizontal irradiation for 54 U.S. cities (2018–2023). The initial 1,400 kWh/m²/year reference and the revised 1,525 kWh/m²/year Gate 1 threshold are shown. At 1,525 kWh/m²/year, 37 cities proceed to conventional preliminary economic screening and 17 require enhanced project-specific diligence.
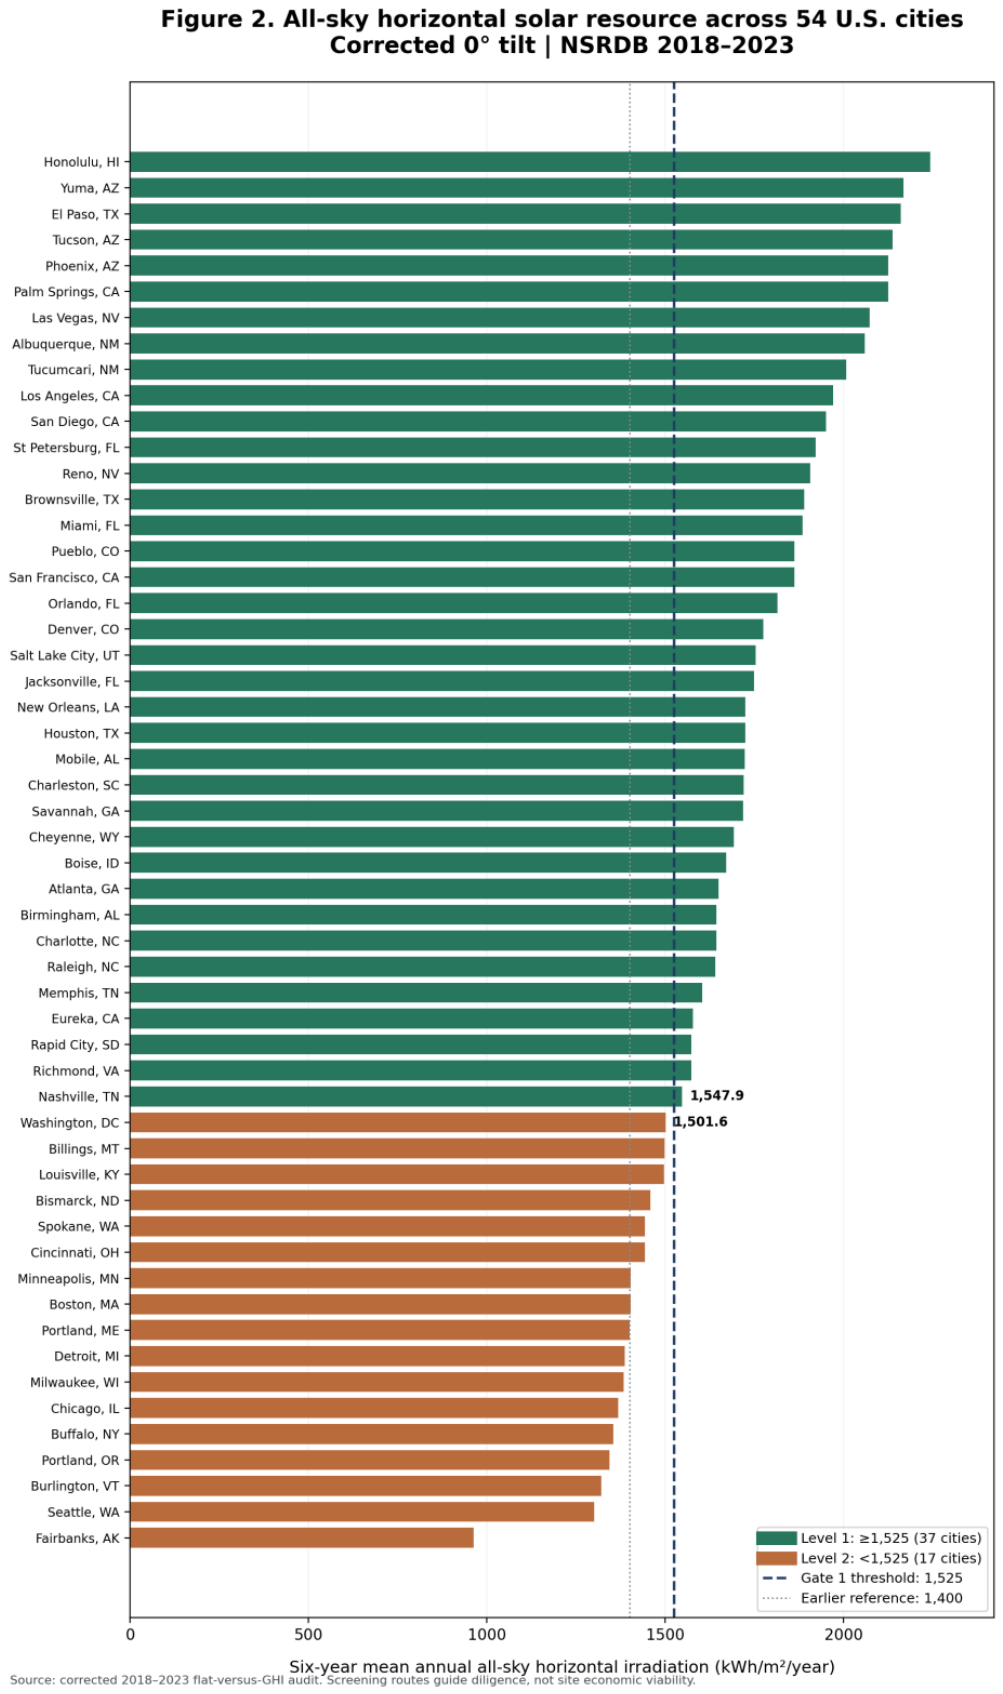
Figure 3.
Recalculated 2018–2023 all-sky latitude-tilt irradiation gain versus geographic latitude for 54 cities. Hourly observed GHI, DNI, DHI, and solar zenith were used with a south-facing latitude-tilted isotropic diffuse-sky model and fixed albedo of 0.20; latitude–gain Pearson correlation is approximately 0.56.
Figure 3.
Recalculated 2018–2023 all-sky latitude-tilt irradiation gain versus geographic latitude for 54 cities. Hourly observed GHI, DNI, DHI, and solar zenith were used with a south-facing latitude-tilted isotropic diffuse-sky model and fixed albedo of 0.20; latitude–gain Pearson correlation is approximately 0.56.
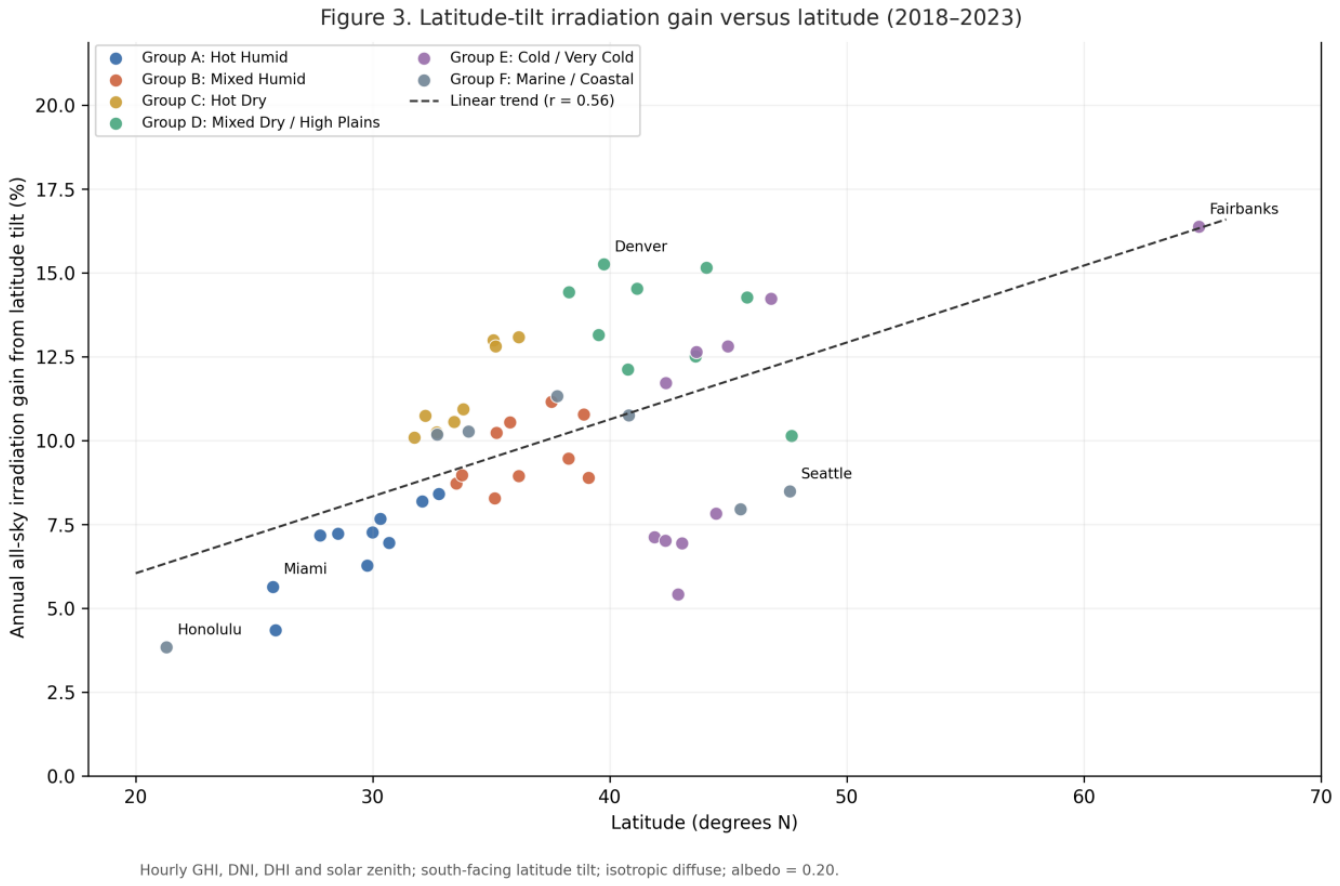
Figure 4.
Recalculated mean annual all-sky latitude-tilt irradiation gain by the six study climate groups, based on 324 city-year hourly histories (2018–2023). Bars represent city means rather than causal climate effects.
Figure 4.
Recalculated mean annual all-sky latitude-tilt irradiation gain by the six study climate groups, based on 324 city-year hourly histories (2018–2023). Bars represent city means rather than causal climate effects.
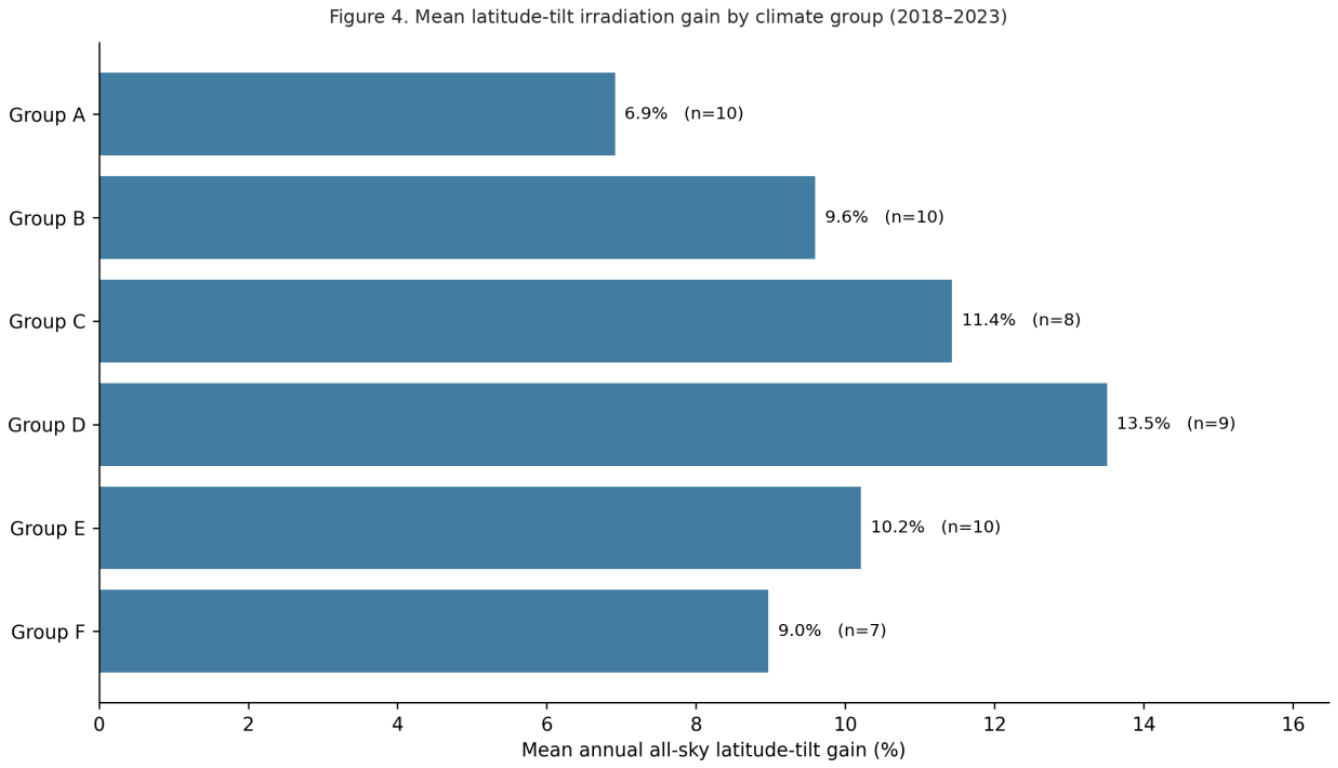
Figure 5.
Six-year mean annual clear-sky and all-sky horizontal irradiation across 54 U.S. cities (2018–2023). At the 1,525 kWh/m²/year Gate 1 threshold, 16 cities (29.6% of the sample) pass the clear-sky screen but fall below the all-sky threshold. The diagonal indicates equal irradiation; shading identifies the false-positive region.
Figure 5.
Six-year mean annual clear-sky and all-sky horizontal irradiation across 54 U.S. cities (2018–2023). At the 1,525 kWh/m²/year Gate 1 threshold, 16 cities (29.6% of the sample) pass the clear-sky screen but fall below the all-sky threshold. The diagonal indicates equal irradiation; shading identifies the false-positive region.
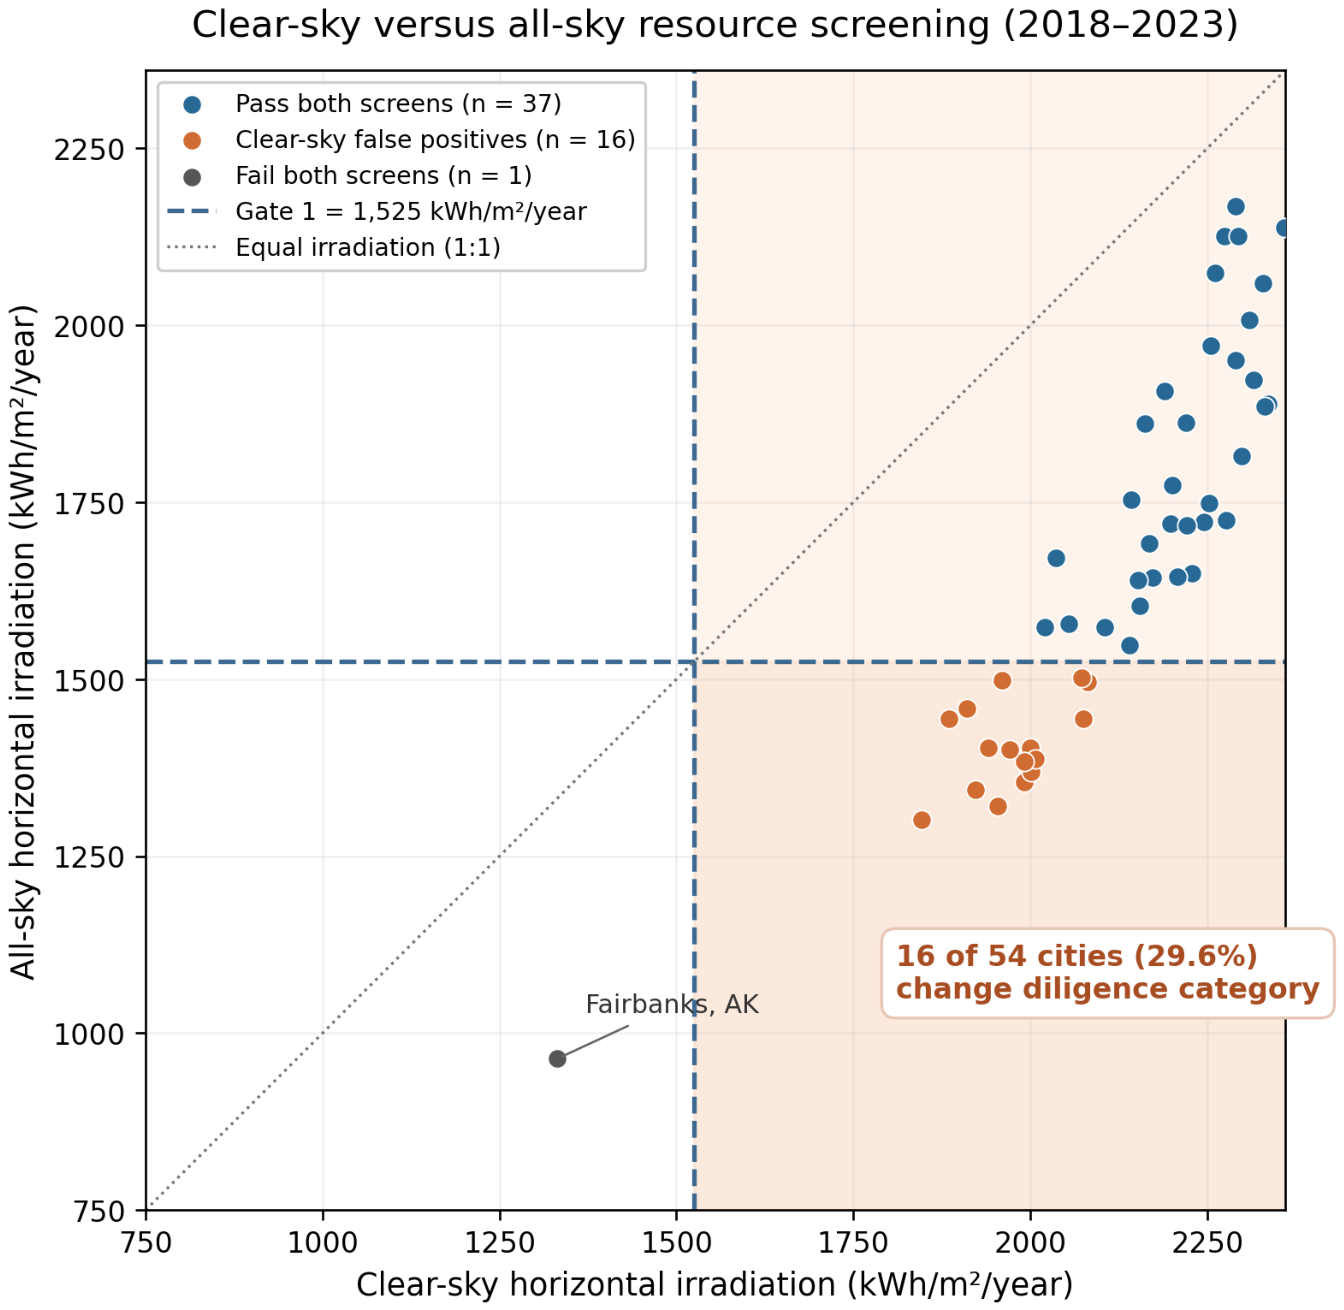
Figure 6.
Recalculated 54-city all-sky resource–gain decision space. The horizontal divider is the study-specific 1,525 kWh/m²/year Gate 1 threshold; the 15% gain divider is an illustrative screening choice, not an empirically validated financial threshold. Quadrant counts: enhanced resource/high gain = 1, enhanced resource/low gain = 16, pass resource/high gain = 2, pass resource/low gain = 35.
Figure 6.
Recalculated 54-city all-sky resource–gain decision space. The horizontal divider is the study-specific 1,525 kWh/m²/year Gate 1 threshold; the 15% gain divider is an illustrative screening choice, not an empirically validated financial threshold. Quadrant counts: enhanced resource/high gain = 1, enhanced resource/low gain = 16, pass resource/high gain = 2, pass resource/low gain = 35.
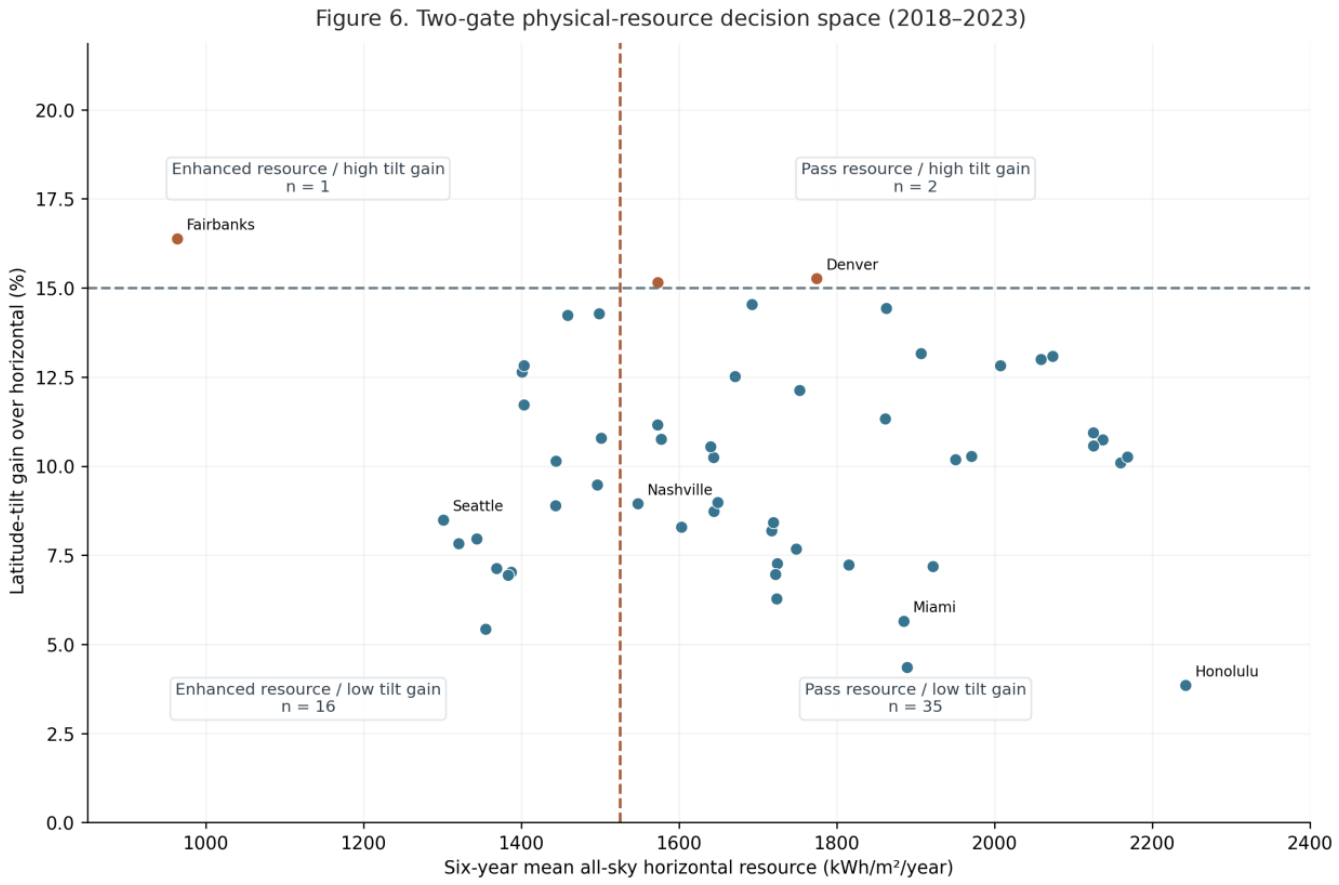
Figure 7.
Two-panel Gate 1 threshold sensitivity analysis across candidate all-sky horizontal-resource values of 1.400, 1.450, 1.500, 1.525, 1.550, and 1.600 MWh/m²/year. Panel (a) reports the number of cities passing Gate 1 and the number routed to enhanced Level 2 diligence at each candidate threshold. Panel (b) reports the smaller distance from each threshold to the nearest passing and failing observation. The 1.525 MWh/m²/year threshold provides the strongest decision-space separation within the candidate range examined.
Figure 7.
Two-panel Gate 1 threshold sensitivity analysis across candidate all-sky horizontal-resource values of 1.400, 1.450, 1.500, 1.525, 1.550, and 1.600 MWh/m²/year. Panel (a) reports the number of cities passing Gate 1 and the number routed to enhanced Level 2 diligence at each candidate threshold. Panel (b) reports the smaller distance from each threshold to the nearest passing and failing observation. The 1.525 MWh/m²/year threshold provides the strongest decision-space separation within the candidate range examined.
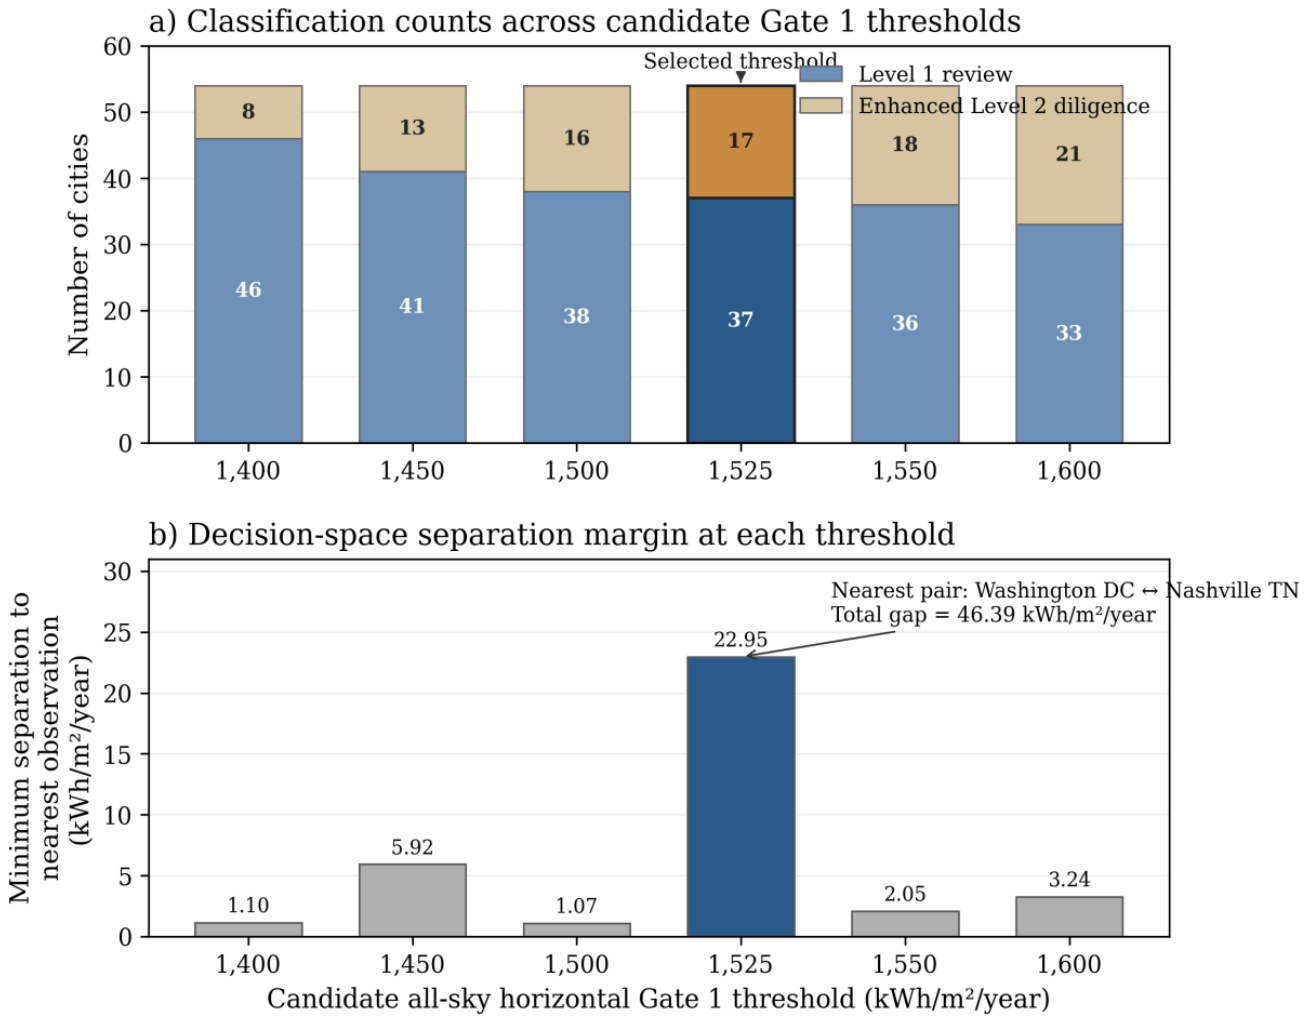
Figure 8.
Recalculated additional incident irradiation obtained by annually optimizing the fixed south-facing tilt angle over 0–70° at 1° steps, relative to latitude tilt. Each study year is optimized separately and results averaged over 2018–2023; this represents a year-by-year optimum, not one common fixed angle across six years.
Figure 8.
Recalculated additional incident irradiation obtained by annually optimizing the fixed south-facing tilt angle over 0–70° at 1° steps, relative to latitude tilt. Each study year is optimized separately and results averaged over 2018–2023; this represents a year-by-year optimum, not one common fixed angle across six years.
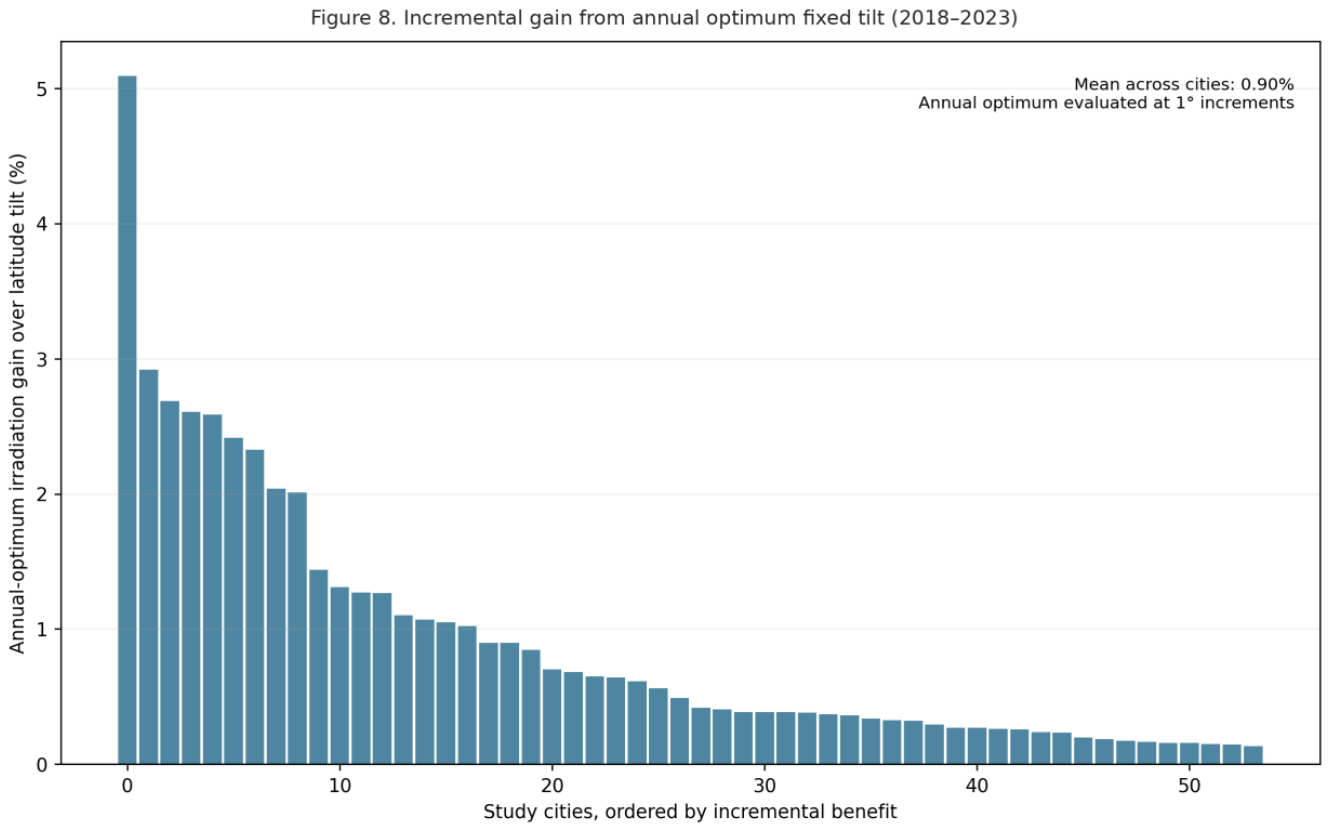
Figure 9.
Exploratory geographic interpretation of the 54-city Gate 1 classifications using six-year mean annual all-sky horizontal irradiation (2018–2023) at the 1,525 kWh/m²/year study-specific threshold. Green markers indicate the 37 cities meeting the resource screen; red markers indicate the 17 cities routed to enhanced diligence. Dashed coastal, northern-border, and Great Lakes overlays depict hypothesized climate-influence zones for subsequent testing, not validated causal boundaries or parcel-level siting recommendations. City positions are approximate.
Figure 9.
Exploratory geographic interpretation of the 54-city Gate 1 classifications using six-year mean annual all-sky horizontal irradiation (2018–2023) at the 1,525 kWh/m²/year study-specific threshold. Green markers indicate the 37 cities meeting the resource screen; red markers indicate the 17 cities routed to enhanced diligence. Dashed coastal, northern-border, and Great Lakes overlays depict hypothesized climate-influence zones for subsequent testing, not validated causal boundaries or parcel-level siting recommendations. City positions are approximate.
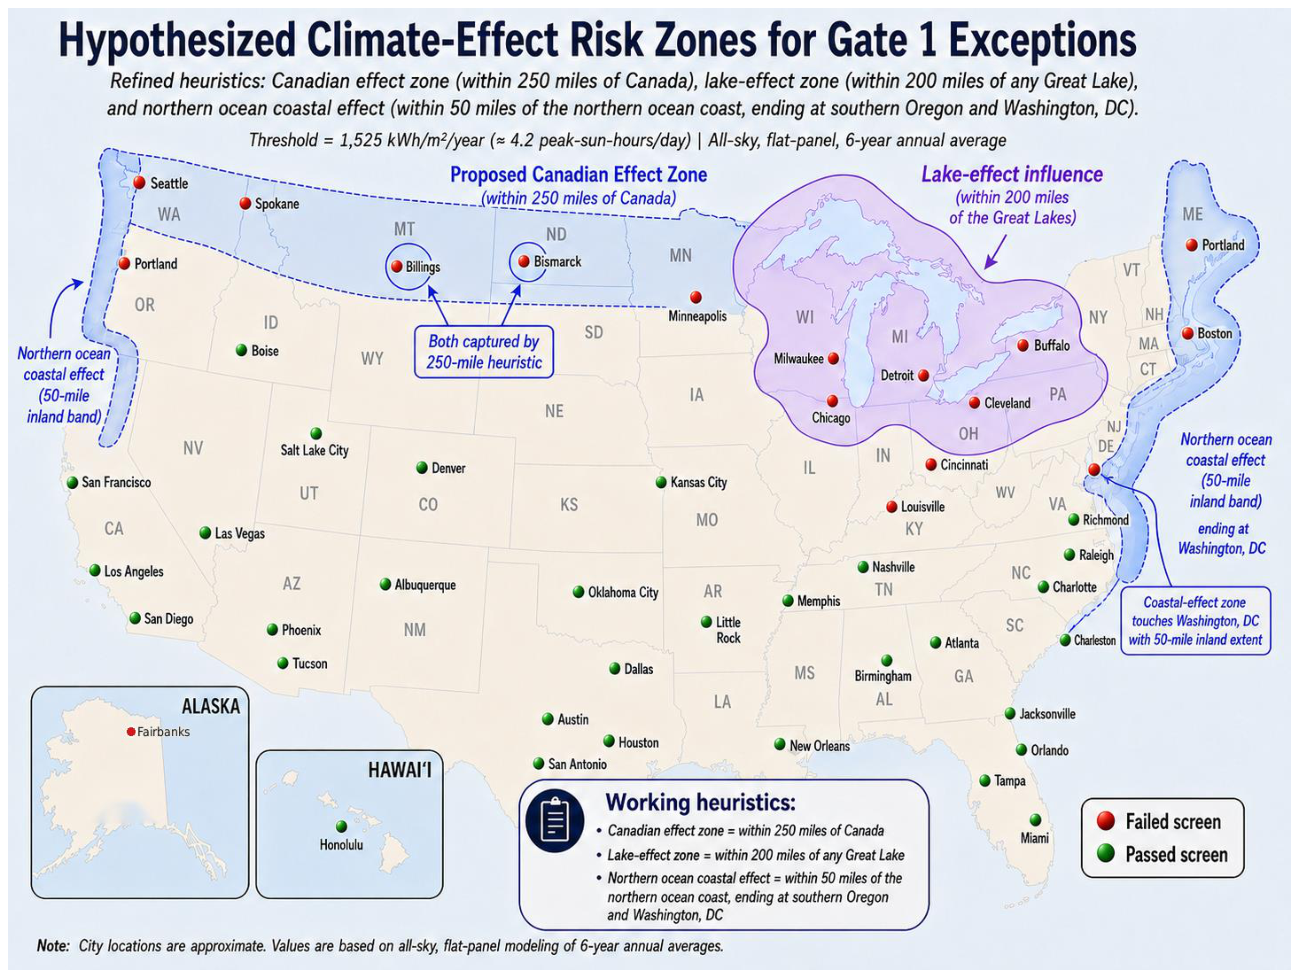
Figure 10.
Supplemental 2018–2023 all-sky horizontal irradiation screening for five new northeastern state capitals and Burlington, VT (existing-sample control). The dashed 1,525 kWh/m²/year line is the study-specific Gate 1 screen; the dotted 1,400 reference permits direct comparison with the earlier proposal. Parentheses show margins to 1,525. The six locations do not alter the principal 54-city sample.
Figure 10.
Supplemental 2018–2023 all-sky horizontal irradiation screening for five new northeastern state capitals and Burlington, VT (existing-sample control). The dashed 1,525 kWh/m²/year line is the study-specific Gate 1 screen; the dotted 1,400 reference permits direct comparison with the earlier proposal. Parentheses show margins to 1,525. The six locations do not alter the principal 54-city sample.
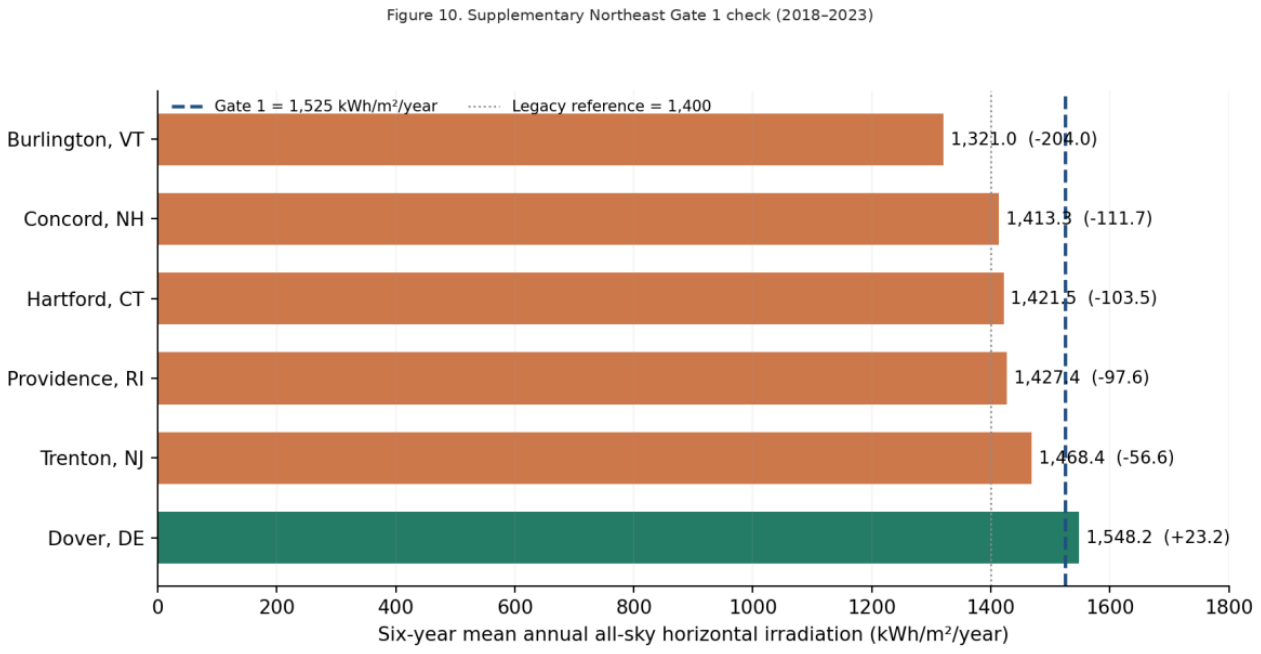
Figure 11.
Recalculated representative-city comparison of the 2018–2023 mean annual all-sky horizontal GHI and latitude-tilted POA for Honolulu, Denver, Mobile, and Fairbanks. The 1,525 kWh/m²/year Gate 1 line applies to horizontal GHI only.
Figure 11.
Recalculated representative-city comparison of the 2018–2023 mean annual all-sky horizontal GHI and latitude-tilted POA for Honolulu, Denver, Mobile, and Fairbanks. The 1,525 kWh/m²/year Gate 1 line applies to horizontal GHI only.
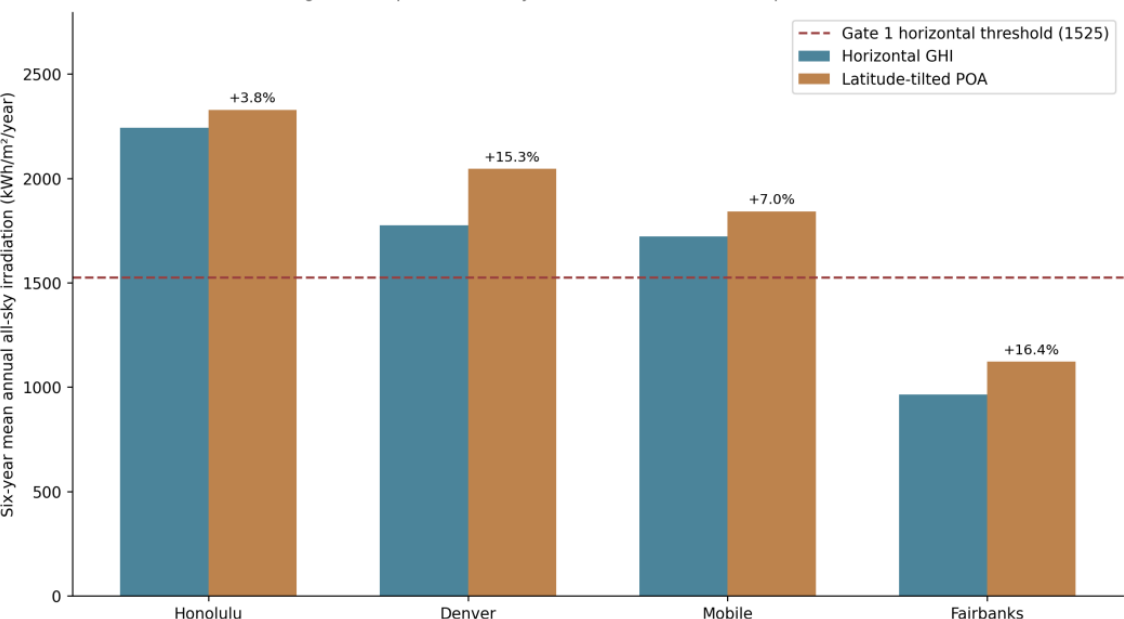

Table 1.
Supplemental Northeast Gate 1 results (six-year mean annual resource, 2018–2023).
| Site | Annual horizontal irradiation (kWh/m²) | Margin to 1,525 (kWh/m²) | Gate 1 |
| Burlington, VT (control) | 1,321.0 | -204.0 | Below |
| Concord, NH | 1,413.3 | -111.7 | Below |
| Hartford, CT | 1,421.5 | -103.5 | Below |
| Providence, RI | 1,427.4 | -97.6 | Below |
| Trenton, NJ | 1,468.4 | -56.6 | Below |
| Dover, DE | 1,548.2 | +23.2 | Above |
Table 2.
Illustrative horizontal-array sizing comparison for a common 13,248 kWh/year annual load (400 W modules; 2 m²/module; 20% module efficiency; 80% delivery factor excluding storage).
Table 2.
Illustrative horizontal-array sizing comparison for a common 13,248 kWh/year annual load (400 W modules; 2 m²/module; 20% module efficiency; 80% delivery factor excluding storage).
| Metric | St. Petersburg, FL | Seattle, WA |
| All-sky horizontal irradiation (kWh/m²/year) | 1,922.2 | 1,301.4 |
| Delivered annual energy per module (kWh/year) | 615 | 416 |
| Modules matching illustrative 13,248 kWh/year demand | 22 | 32 |
| Nominal DC array capacity (kW) | 8.8 | 12.8 |
Disclaimer/Publisher’s Note: The statements, opinions and data contained in all publications are solely those of the individual author(s) and contributor(s) and not of MDPI and/or the editor(s). MDPI and/or the editor(s) disclaim responsibility for any injury to people or property resulting from any ideas, methods, instructions or products referred to in the content. |
© 2026 by the authors. Licensee MDPI, Basel, Switzerland. This article is an open access article distributed under the terms and conditions of the Creative Commons Attribution (CC BY) license (http://creativecommons.org/licenses/by/4.0/).
Copyright: This open access article is published under a Creative Commons CC BY 4.0 license, which permit the free download, distribution, and reuse, provided that the author and preprint are cited in any reuse.