

Submitted:
12 November 2026
Posted:
13 November 2026
You are already at the latest version
Abstract
Sleep disturbance is common in disorders of the gut-brain interaction, and many patients with gastrointestinal diseases report symptom associations with sleep. Yet, how gastric myoelectrical activity varies across sleep remains poorly characterised. This scoping review mapped the evidence on sleep and gastric myoelectrical activities in healthy and clinical adult populations, and evaluated the methods used for overnight gastric monitoring. Following PRISMA-ScR guidelines and JBI methodology, three databases were searched in October 2026 for studies published from 1996 that analysed gastric myoelectrical activity in relation to sleep. Six studies were included, all using cutaneous electrogastrography. Two studies analysed gastric activity by polysomnography-resolved sleep stage, whereas four compared samples of gastric activity during sleep with waking periods. No two studies quantified gastric activity in the same way. Slow-wave magnitude was lower during sleep in every study that assessed it, whereas slow-wave rate was largely preserved. Slow-wave rhythm tended to become less regular, with less time spent in normogastria, although findings were not consistent. In clinical populations, modulation of gastric activity appeared altered, though these were diverse and patterns differed between them. Sleep appears to be associated with changes in gastric myoelectrical activity, most consistently a decrease in slow-wave magnitude. However, the evidence base is small, methodologically heterogeneous, and reliant on recording modalities of limited reliability. Moreover, no study has characterised how gastric activity changes across the night. High-resolution recording of gastric myoelectrical activity is needed to form a more comprehensive understanding of nocturnal gastric physiology.
Keywords:
sleep
; gastric myoelectrical activity
; electrogastrography
; slow wave
; polysomnography
; gut–brain axis
; disorders of gut–brain interaction
; scoping review
1. Introduction
The gut-brain axis, a complex neurohormonal pathway that allows direct communication between the brain and the gastrointestinal system, is increasingly recognised as integral to the understanding of gastrointestinal health and disease [1]. This communication pathway is facilitated by the autonomic and enteric nervous systems, alongside endocrine, immune, and microbial signalling [2]. Sleep may offer a particularly useful window into this interaction, as it brings about substantial and structured changes in brain activity across the night, which may also influence gastrointestinal function.
Sleep cycles roughly every 90 minutes between non-rapid-eye movement (NREM) sleep, which comprises stages N1 to N3, and rapid eye movement (REM) sleep. REM sleep comprises a greater portion of the sleep cycle as sleep progresses, lengthening towards morning [3]. These stages are accompanied by distinct autonomic states, with autonomic balance shifting towards parasympathetic dominance during NREM, and towards a profile resembling wakefulness, except with intermittent surges in sympathetic activity, during REM [4,5]. As parasympathetic input broadly enhances gastric activity [6], while sympathetic activity is broadly inhibitory [7], the electrical rhythm of the stomach could be expected to shift with these changes in autonomic balance across sleep. Yet, whether and how gastric myoelectrical activity varies with sleep stage or across the night remains poorly characterised.
Furthermore, research has shown that gastrointestinal symptoms are closely linked with sleep, making this area of research highly relevant to clinical populations. Sleep disturbance is common in disorders of the gut-brain interaction, such as irritable bowel syndrome and functional dyspepsia [8,9]. Some gastrointestinal symptoms reportedly arise more during sleep itself, such as heartburn and regurgitation [10], and the severity of others, such as abdominal pain and dyspepsia, can be predicted by sleep quality [11,12,13].
To better understand the physiological mechanisms behind these relationships, gastric activity patterns in healthy populations must first be established as a baseline, to allow the subsequent assessment of how they deviate in clinical populations. However, current evidence is limited, likely due to the practical challenges of measuring gastric myoelectrical activity during sleep, given the relative inaccessibility of the gastrointestinal tract and variable nature of sleep [14,15]. Thus it is important to establish the current gaps in the literature, including where existing methodologies fall short, in order to provide a foundation for future work using more suitable modalities.
Therefore, the primary objective of this scoping review was to map the current evidence on the relationship between sleep and gastric myoelectrical activity in healthy and patient populations. The second objective was to evaluate the limitations of existing methodologies for overnight gastric monitoring and identify the gaps these leave in current understanding.
2. Methods
2.1. Study Design
The methodology and reporting of this scoping review are in accordance with the Preferred Reporting Items for Systematic Reviews and Meta-Analyses (PRISMA) 2020 guidelines and the Scoping Review extension (PRISMA-ScR) [16,17] (completed checklist in Appendix C), and is further guided by the Joanna Briggs Institute (JBI) Scoping Review methodology [18].A written protocol was prepared a priori, but was not registered. Eligibility criteria were therefore specified before screening began; however, amendments were made during conduct as described in Section 2.3.1.
2.2. Search Strategy
The search was conducted across three databases: MEDLINE (via PubMed), Embase (via Ovid), and Scopus. Gastric terms combined an anatomical term (gastric, stomach, or antral) with an outcome term (motility, activity, function, myoelectrical activity, electrical activity, electrical signals, and truncated terms empty* or clear*) to capture the varied ways gastric activity is described across the literature. These deliberately spanned motor function and emptying as well as myoelectrical activity, as the protocol included all of these when the search was built (Appendix A). Sleep terms searched for comprised sleep, REM, NREM, and circadian as well as sleep paired with stages, phases, and architecture aimed at studies reporting results specific to portions of sleep rather than whole night results. An example search is shown in Figure 1, with full search strategies and further details provided in Appendix A.
The strategy was adapted to the syntax of each platform while keeping the search as consistent as possible. Filters available on each platform were used to limit the searches to human studies published in English from 1996 onwards, and to exclude reviews, systematic reviews, and meta-analyses. Where a limit was not applied within the literature search itself, the corresponding criterion was applied during screening instead. Search fields included title, keywords, and abstracts. Furthermore, no additional searching of reference lists, citation indexes or grey literature was undertaken.
We conducted the primary search on 21 April 2026 and re-run on 8 October 2026 to capture any relevant recent publications. The full search strategy for each database, including the records retrieved by each, can be found in Appendix A.
2.3. Study Selection and Eligibility Criteria
Records retrieved from the three databases were combined in EndNote (Clarivate). De-duplication was carried out before any screening, using the validated multi-step procedure described by Bramer et al. [19]. Unique records were then imported into the web-based platform Rayyan [20] and were independently screened by two reviewers (LJ and MB). Screening was initially carried out based on abstract and title against the eligibility criteria (Table 1). Records retained following this were then assessed for eligibility using the full article. Disagreements between reviewers were resolved through discussion, with input from a third reviewer (GOG) where consensus could not be reached. Full-text articles were obtained through institutional subscriptions and, where unavailable, by request through the University of Auckland Library. Additionally, this research team did not have the resources to contact the authors of articles to request their data for inclusion in the review.
Eligibility was structured as Population, Concept and Context as per PRISMA guidelines [16,17]. Human subjects were required because this review concerns human sleep physiology, with paediatric populations (<18y) being excluded because both sleep architecture and gastric slow-wave characteristics change during development [21,22]. The rationale for the Concept criteria (Table 1) is provided in Section 2.3.1.
Pharmacologically-induced sleep was excluded because sedative and hypnotic agents can directly alter the architecture of sleep, with several also directly influencing gastrointestinal motility. Inclusion of studies where sleep is pharmacologically-induced would therefore compromise whether gastric findings could be attributed to sleep.
The publication window was set at thirty years from the date of the search (1996-2026), and the setting and clinical population was left unrestricted, in order to maximise coverage of a sparse literature. Literature published in languages other than English were excluded from this study due to limited language proficiency and resources for the translation of articles. Only peer-reviewed primary studies that were available as full-text were included, to allow the methodologies to be assessed in full and to ensure that every charted measurement had passed peer-review.
2.3.1. Eligibility Criteria Amendments
The criteria described in Table 1 are an updated form of those specified in the a priori protocol from before screening, which is reproduced in Appendix B. Three significant amendments were made during conduct. Firstly, the scope was narrowed from gastric function in general to gastric myoelectrical activity, with symptom measures hence also dropped as an eligible outcome. Motor outcomes such as contraction amplitude, motility index, and migrating motor complex characteristics share no common units or denominators with measures of gastric myoelectrical activity, which record gastric slow-wave activity rather than contractile activity [14,23]. Including both would therefore have limited the comparability and homogeneity of the evidence and thus they were subsequently excluded. Migrating motor complex outcomes were also excluded as their incidence at night is largely attributed to night as a fasting state rather than inherent to sleep itself [24]. Additionally, symptoms were dropped because they are subjective consequences of gastric activity rather than a measurement of it, and thus were decided to be out of scope of this review. Secondly, the requirement that gastric activity be recorded during natural sleep was updated to require it to instead be analysed in relation to sleep. Recordings that span the night without analysing sleep cannot support a finding specific to sleep, hence were excluded. Thirdly, the publication window was moved from 1995 to 1996 so that it captured thirty years backwards from the date of the search rather than at the date the protocol was drafted. As these changes narrowed the criteria, rather than expanding it, the original broader search was still considered to have captured all eligible sources.
2.4. Data Charting and Synthesis of Results
A data-charting form was developed in Excel (by LJ), and was revised iteratively through discussion with the third reviewer (GOG). It captured the author, year and journal of publication, country of origin, populations and sample sizes, sleep verification method, sleep states analysed, gastric myoelectrical activity recording method, gastric outcome metrics, and sleep-specific gastric activity findings. Data were charted by LJ and verified by GOG.
An outcome measure was considered relevant, and therefore was charted, only where it was an objective measure of gastric myoelectrical activity that was analysed against sleep, or a defined period standing in for sleep. Null results that satisfied these conditions were charted alongside significant results. Where a study reported a sleep-relevant gastric outcome only within figures, values were extracted using plot digitisation of the published figure. This was done according to the procedure implemented by the WebPlotDigitizer tool, which has been formally assessed as having reliability and validity for extracting data [25]. Digitised values are marked as estimates only used to describe the patterns the source figures display. Furthermore, due to heterogeneous data as well as a limited number of studies available, meta-analysis was not performed. Results were synthesised descriptively.
3. Results
3.1. Literature Search Results
As shown in Figure 2, the original search retrieved a total of 1,891 records, comprised of 712 records from MEDLINE, 689 from Embase, and 490 from Scopus. De-duplication removed 317 duplicates. 39 full-text publications were screened for inclusion, with six studies meeting all eligibility criteria. No record retained after title and abstract screening was excluded because its full-text article could not be obtained.
Of note, the search, rerun on 8 October 2026, retrieved 744, 727, and 499 records from the three databases respectively. After de-duplication against the original library, additional unique records were screened and none met the inclusion criteria.
3.2. Study-Level Characteristics
The six articles span 1997 to 2023, with three conducted in the USA [26,27,28], two in Japan [29,30], and one in Poland [31]. Two pairs of studies came from the same research group: Orr et al. [26], and Elsenbruch et al. [27] from one laboratory in Oklahoma City, USA, and Suzuki et al. [29] and Sakakibara et al. [30] from Chiba University, Japan. Neither pair reported whether participants overlapped between studies.
All six are observational cross-sectional studies, each based on a single recording session per participant. Only Elsenbruch et al. [27] assessed healthy volunteers alone, whereas the other five investigated clinical populations against a healthy comparison group. The clinical populations comprised irritable bowel syndrome (IBS) [26], multiple system atrophy (MSA) and Parkinson’s disease (PD) [29,30], cardiological syndrome X with dyspeptic symptoms (CSX) [31], and idiopathic gastroparesis (I-GP), diabetic gastroparesis (D-GP), and diabetic non-gastroparesis patients (D-NGP) [28]. Individual sample sizes ranged from 13 to 80.
Of note, Kolasińska-Kloch et al. [31] and Elsenbruch et al. [27] contained numerous discrepancies between the narrative text and visual data. In all instances, the values in the tables and figures were prioritised for this review. Kolasińska-Kloch et al. [31] also did not provide units of measurement for PDP, DPIC, DFIC, or amplitude. In Subramanian et al. [28], reporting of gastric metrics during provided sleep periods were descriptive throughout, and no statistical test is reported for any gastric activity comparison.
Further information regarding the derivation, scales, and measurement units for gastric outcome measures (Table 4) is provided in Section 3.4.

Table 2.
Summary of the key data from the six studies that resulted from the literature search and eligibility criteria.
Table 2.
Summary of the key data from the six studies that resulted from the literature search and eligibility criteria.
| Study | Population | Age | Sex (% female) | Study Protocol | Gastric outcomes |
|---|---|---|---|---|---|
| Orr et al., 1997 [26] | N = 20; 10 IBS, 10 healthy | IBS: mean 38.6y (26–54) Healthy: not reported (age-matched) |
100% | Overnight EGG; sleep by PSG | DF, DF-A |
| Elsenbruch et al., 1999 [27] | N = 16 healthy | Mean 36.2 ± 2.3y (SEM) (22–55) | 71% | Overnight EGG; sleep by PSG | DF, DP, ICDF, %normal rhythm, %brady/tachy/arry/dysrhythmia |
| Suzuki et al., 2005 [29] | N = 23; 14 MSA, 9 healthy | MSA: 59.4 ± 8.7y Healthy: 59.3 ± 11.0y |
MSA: 57% Healthy: 33% |
24h ambulatory EGG; sleep by self-report diary | DF, DP, ICDF |
| Kolasińska-Kloch et al., 2007 [31] | N = 80; 40 CSX, 40 healthy | CSX: 46 ± 8y (33–62) Healthy: 47 ± 5y (33–63) |
CSX: 50% Healthy: not reported (sex-matched) |
24h EGG; sleep by clock time only | Amplitude, PDF, PDP, DFIC, DPIC, Percentage of time in brady/normo/tachygastria (%brady/normo/tachygastria) |
| Sakakibara et al., 2009 [30] | N = 42; 17 PD, 17 MSA, 8 healthy | PD: 66 ± 8.3y MSA: 64 ± 7.3y Healthy: 63 ± 8.3y |
PD: 65% MSA: 24% Healthy: 38% |
24h ambulatory EGG; sleep by self-report diary | DF, ICDF, Percentage of power in low/normal/high frequency ranges (%LFR/NFR/HFR power) |
| Subramanian et al., 2023 [28] | N = 13; 4 healthy, 4 I-GP, 3 D-GP, 2 D-NGP | All: 22–70y | 38% | 24h ambulatory EGG; sleep by self-report diary + actigraphy | Gastric slow-wave band power |
Ages are mean ± SD (range) unless stated. Abbreviations: CSX, cardiological syndrome X; D-GP, diabetic gastroparesis; D-NGP, diabetic non-gastroparesis; DF, dominant frequency; DF-A, dominant frequency amplitude; DFIC, dominant frequency instability coefficient; DP, dominant power; DPIC, dominant power instability coefficient; EGG, electrogastrography; HFR, high-frequency range; IBS, irritable bowel syndrome; ICDF, instability coefficient of dominant frequency; I-GP, idiopathic gastroparesis; LFR, low-frequency range; MSA, multiple system atrophy; NFR, normal-frequency range; PD, Parkinson’s disease; PDF, period dominant frequency; PDP, period dominant power; PSG, polysomnography; SD, standard deviation; SEM, standard error of the mean.
3.3. Methods of Sleep Verification
Methods used to identify sleep periods varied across the six studies: two used polysomnography [26,27], two relied on participant self-reporting [29,30], one used accelerometry supplemented with self-reporting where accelerometry was absent [28], and one applied a fixed-clock time window with no participant-specific input [31] (Table 3).
Only two of the studies resolved sleep by stage, but did so at differing levels of detail. Orr et al. [26] reported waking, REM, and NREM, whereas Elsenbruch et al. [27] distinguished stage 2 and 4 within NREM, alongside waking and REM stages. None of the remaining studies identified stages within sleep. Kolasińska-Kloch et al. [31] and Subramanian et al. [28] did not subdivide sleep and instead treat it as a single, undifferentiated block, being a fixed 8-hour overnight window in the former, and the final three hours of algorithmically-defined sleep in the latter.
No included study reports a gastric parameter computed across an entire night of independently confirmed sleep. Kolasińska-Kloch et al. [31] alone calculated gastric outcome measures across the full window used as a proxy for sleep, but because this was a fixed clock-time window, they did not verify that participants were asleep during it. Subramanian et al. [28] computed a single value under the normalised gastric power curve for a three-hour window within sleep (Table 3), but reported it only as a fasting reference for measuring postprandial power.
The remaining four studies analysed only samples taken within sleep. Orr et al. [26] and Elsenbruch et al. [27] analysed 20-minute segments of each distinguished sleep stage. Similarly, Suzuki et al. [29] and Sakakibara et al. [30] both analysed 20-minute EGG segments from early and late sleep, although their definitions of these periods differed slightly (Table 3). Elsenbruch et al. [27] selected segments on polysomnographic criteria alone. Recordings were scored in 30-second epochs before the gastric signal was examined, and one 20-minute window per stage was chosen that was free of stage shifts, movements and arousals, with the participant not lying prone. Suzuki et al. [29] selected EGG segments that carried the fewest motion artifacts. Orr et al. [26] and Sakakibara et al. [30] did not report any criteria for choosing segments.
3.4. Gastric Myoelectrical Activity Outcome Measures
All six studies were conducted using cutaneous electrogastrography (EGG), but no two quantified gastric myoelectrical activity in the same way. To allow comparison, reported gastric outcome measures were grouped by the physiological property each assesses (Table 4). These properties are slow-wave rate, slow-wave magnitude, rhythm stability, and rhythm distribution. Coverage of these aspects of gastric myoelectrical activity was uneven across the included studies.
Table 4.
Gastric myoelectrical outcome measures reported by each included study, grouped by the physiological property assessed.
Table 4.
Gastric myoelectrical outcome measures reported by each included study, grouped by the physiological property assessed.
| Study | Slow-wave rate | Slow-wave magnitude | Rhythm stability | Rhythm distribution |
|---|---|---|---|---|
| Orr et al., 1997 [26] | DF (cpm) | DF-A (dB) | None reported | None reported |
| Elsenbruch et al., 1999 [27] | DF (cpm) | DP (dB) | ICDF (ratio) | %normogastria %brady/tachy/arry/dysrhythmia |
| Suzuki et al., 2005 [29] | DF (cpm) | DP (µV) | ICDF (%) | None reported |
| Kolasińska-Kloch et al., 2007 [31] | PDF (cpm) | PDP (no units provided) Signal amplitude (no units provided) |
DFIC (no units stated), DPIC (no units stated) | %brady/normo/tachygastria |
| Sakakibara et al., 2009 [30] | DF (cpm) | None reported | ICDF (%) | LFR/NFR/HFR %power |
| Subramanian et al., 2023 [28] | None reported | Normalised slow-wave band power (no units provided) | None reported | None reported |
Abbreviations: cpm, cycles per minute; DF, dominant frequency; DF-A, dominant frequency amplitude; DP, dominant power; ICDF, instability coefficient of dominant frequency; PDF, period dominant frequency; PDP, period dominant power; DFIC, dominant frequency instability coefficient; DPIC, dominant power instability coefficient; LFR, low-frequency range; NFR, normal-frequency range; HFR, high-frequency range.
Slow-wave rate was assessed in five of the six studies, predominantly using dominant frequency (DF), which is the frequency of the largest peak in the EGG power spectrum. Three studies computed DF using the short EGG recording segments sampled for each sleep and waking period (Section 3.3) [27,29,30]. The frequency ranges search for the peak differed between them, with Sakakibara et al. [30] restricting the search to the normal band (2.0-4.0cpm) so their DF could not move into bradygastria or tachygastria by construction. Orr et al. [26] did not describe how DF was derived, only that it remained within 2-4cpm across sleep and waking periods. Kolasińska-Kloch et al. [31] reported period domain frequency (PDF), which was calculated as the peak of a spectrum averaged across an entire day or night block. As this averages calculations over a greater recording period, this measure of slow-wave rate is less sensitive to transient dysrhythmia than measures derived from shorter segments.
Slow-wave magnitude was the most heterogeneous across the included studies. Four studies used a measure of peak power: three took the power at the peak of a single spectrum computed across the analysis window, differing mainly in segment length [26,27,31]. Orr et al. [26] and Elsenbruch et al. [27] used their 20 minute recording windows, whereas Kolasińska-Kloch et al. [31] used its 8-hour recording windows. Kolasińska-Kloch et al. [31] also used power and amplitude interchangeably, and tabulated a separate signal amplitude that was never defined. Suzuki et al. [29] instead took the mean of peak powers from running spectral analysis. Subramanian et al. [28] used normalised slow-wave band power, calculated as the mean power in the 2.4-3.6cpm band minus the mean power in the adjacent 3.6-6cpm band, which served as an estimate of background noise. Sakakibara et al. [30] reported no magnitude measure, as their frequency range (LFR/NFR/HFR) percentages captures only how power is distributed between bands. Values were reported on four different scales: decibels [26,27], a logarithmic scale [26,27], microvolts [29], a linear scale, and unspecified units [28,31]. While Orr et al. [26] and Elsenbruch et al. [27] both derived their magnitude measures (DF-A and DP respectively) using the methods of Chen and McCallum [32] and the same recording device, their waking values differed by approximately 20dB. Neither study reported the reference against which decibels were calculated, so the reason for this difference is unclear. However, because a difference in decibels expresses a ratio, within-subject changes on these scales remain comparable whereas absolute values are not. Consequently, only the direction and relative size of change in magnitude is able to be compared across studies.
Three studies reported the instability coefficient of dominant frequency (ICDF), which is the standard deviation of DF across successive spectra divided by its mean. The window length used for running spectral analysis differed between studies [27,29,30]. ICDF was also reported as a ratio in one study [27], and as a percentage in others [29,30]. Kolasińska-Kloch et al. [31] defined equivalent coefficients for dominant frequency (DFIC) and dominant power (DPIC) but did not report values or units for these measures. Rhythm distribution was assessed in three of six studies. Two reported time spent in normal (2-4cpm) rhythm, bradygastria, and tachygastria [27,31], with Elsenbruch et al. [27] additionally reporting arrhythmia, which the methods they cite defines as periods without a discernible dominant frequency [32]. Sakakibara et al. [30] reported the proportion of total spectral power in low, normal, and high frequency ranges. The thresholds for categories differed in these studies, with the low band beginning at 0.5cpm in two studies [27,31], and at 1.6cpm in the third [30].
3.5. Gastric Myoelectrical Activity by Sleep Stage
Across the two studies which resolved sleep by stage (Section 3.3), two common trends were identified in regards to slow-wave magnitude and slow-wave rate, although the first did not extend to REM sleep or IBS participants. Firstly, slow-wave magnitude fell from waking into NREM sleep in healthy participants. In Elsenbruch et al. [27], DP was significantly lower in stage 2 (23.1dB) and stage 4 (24.4dB) than while awake (31.4dB), with p<0.001 for both. In the control group for Orr et al. [26], DF-A fell significantly from waking to NREM sleep (digitised estimates 52.5 to 45.4dB, p<0.05). Although absolute values could not be compared between the two studies (Section 3.4), the size of this fall was similar, at an estimated 7.1dB in Orr et al. [26] compared with 8.3dB to stage 2 and 6.7dB to stage 4 in Elsenbruch et al. [27]. The studies diverged, however, in REM sleep. DF-A increased significantly from NREM to REM (45.4dB to 54.7dB, p<0.05) in Orr et al. [26], returning to around its waking level. In Elsenbruch et al. [27] DP remained as low in REM sleep (24.3 dB) as in stage 2 and stage 4 NREM sleep. Orr et al. [26] also found that IBS patients did not exhibit the same change in DF-A, reporting no significant decrease between waking and any sleep stage in this group. The second common trend was that slow-wave rate was unaffected by sleep, in both healthy and disease groups. In Orr et al. [26], DF did not change across all states in both the IBS and control group, remaining within 2-4cpm. In Elsenbruch et al. [27], DF was similarly unchanged between waking (2.9 cpm) and sleep (2.9-3.0cpm), although this should be interpreted with caution, as no dominant peak could be identified in a substantial minority of participants during sleep.
Elsenbruch et al. [27] alone assessed rhythm stability and distribution, and both were reported to deteriorate during sleep. ICDF was significantly larger at 0.36 during stage 2, 0.47 during stage 4, and at 0.34 during REM sleep compared to 0.19 while awake, indicating a less stable slow-wave rate in every sleep stage (p<0.05). The proportion of normal 2-4cpm activity also decreased from 90.8% while awake to 64.6% in stage 2 (p<0.05) and 57.5% in stage 4 (p<0.001), but not significantly in REM sleep (74.1%). This shift was accompanied most markedly by tachygastria, which increased significantly in both NREM stages, while arrhythmia increased significantly in stage 4 only (Table 5). Bradygastria also increased in both NREM stages, however the paper is internally inconsistent on whether this was significant, reporting it as significant in the figure legend and insignificant in the figure and main text. In REM sleep, normal activity and dysrhythmias did not differ significantly from waking.
3.6. Gastric Myoelectrical Activity Across the Sleep Period
Of the four studies that did not resolve sleep by stage, only Kolasińska-Kloch et al. [31] formally tested a night period directly with a waking period. Suzuki et al. [29] only tested for variation across all eight segments, including the two sleep segments, but did not compare the sleep segments with any other segment directly. Both Suzuki et al. [29] and Sakakibara et al. [30] otherwise compared sleep segments only between participant groups. Subramanian et al. [28] did not report any values or statistical test for its comparison between its postprandial and sleep period.
Table 6.
Gastric myoelectrical findings across waking and sleep in studies that did not resolve sleep by stage.
Table 6.
Gastric myoelectrical findings across waking and sleep in studies that did not resolve sleep by stage.
| Study | Slow-wave rate | Slow-wave magnitude | Rhythm stability | Rhythm distribution |
|---|---|---|---|---|
| Suzuki et al., 2005 [29] | At late sleep, DF was significantly higher in MSA (3.24 cpm) than in controls (2.99 cpm). | DP appeared to fall during sleep in both groups, but not significantly. | ICDF did not vary significantly between waking and sleep segments. | Not reported |
| Kolasińska-Kloch et al., 2007 [31] | PDF fell significantly from day to night in controls (2.63 to 2.35 cpm) and in both CSX subgroups. | In controls, amplitude (857.5 to 403.1) and PDP (803.9 to 409.2) fell significantly at night. In CSX, amplitude fell significantly in both subgroups. PDP fell significantly in low-ANS (1086 to 319) and rose non-significantly in normal-ANS (500.8 to 689.7) |
DFIC and DPIC reportedly rose at night, but no values or tests were given. | In controls, %normogastria fell (84.5 to 78.7%) and %tachygastria rose (9.1 to 12.9%) at night. %bradygastria rose in both CSX subgroups (low-ANS 28.8 to 38.6%; normal-ANS 16.0 to 26.1%), and %normogastria fell in low-ANS only (64.8 to 55.5%). |
| Sakakibara et al., 2009 [30] | DF did not differ between early and late sleep, within or between groups. | Not reported | At late sleep, ICDF was significantly higher in PD (8.58*) than in MSA (4.53*), and neither differed from controls (6.59*). ICDF did not differ between groups at early sleep. | %power in the LFR, NFR and HFR did not differ between early and late sleep, within or between groups. |
| Subramanian et al., 2023 [28] | Not reported | Slow-wave band power separated clearly between the postprandial period and late sleep in healthy controls, diabetics without gastroparesis, and idiopathic gastroparesis with stimulators. The separation was greater in controls than in gastroparesis without stimulators, and minimal in most diabetic gastroparesis patients, with or without stimulators. | Not reported | Not reported |
*estimated values generated by WebPlotDigitizer. Abbreviations: ANS, autonomic nervous system; cpm, cycles per minute; CSX, cardiological syndrome X; DF, dominant frequency; DFIC, dominant frequency instability coefficient; DP, dominant power; DPIC, dominant power instability coefficient; HFR, high-frequency range; ICDF, instability coefficient of dominant frequency; LFR, low-frequency range; MSA, multiple system atrophy; NFR, normal-frequency range; PD, Parkinson’s disease; PDF, period dominant frequency; PDP, period dominant power.
Slow-wave magnitude was lower at night or during sleep wherever it was assessed. In healthy controls, Kolasińska-Kloch et al. [31] reported PDP and signal amplitude to be roughly half its daytime values. In syndrome X patients, amplitude decreased at night regardless of autonomic subgroup, however PDP only fell in those with low-ANS activity [31]. Estimation of DP values in Suzuki et al. [29] showed DP to decrease during sleep in both MSA and healthy groups, although this difference was found to be insignificant. Subramanian et al. [28] only reported a difference in slow-wave magnitude between sleep and waking states. It stated that slow-wave band power during the last three hours of sleep, its fasting reference, was clearly separated from postprandial power in healthy controls, diabetics, and idiopathic gastroparesis patients with gastric stimulators, but only minimally in diabetic gastroparesis patient, including those with stimulators. No statistical tests or values were provided to support this [28].
Slow-wave rate also showed a nocturnal decrease in some studies, however these results were less consistent. PDF decreased for every group in Kolasińska-Kloch et al. [31] to below 2cpm in both patient subgroups. Suzuki et al. [29] reported that DF was lower in sleep compared to waking segments in controls, however the figure indicates that pre-breakfast DF was similarly reduced, at a level comparable to DF in late sleep. Notwithstanding this, the nocturnal dip in DF was blunted in MSA, with markedly higher late-sleep DF compared to controls. Sakakibara et al. [30] reported that DF during late sleep did not differ significantly from waking segments for controls, MSA, and PD, and no significant difference in trends was observed between groups.
Rhythm was also found to become less regular at night in Kolasińska-Kloch et al. [31], with normogastria decreasing in controls and syndrome X patients with low-ANS activity. Tachygastria was also found to rise in controls, and both syndrome X patient subgroups experienced an increase in bradygastria [31]. Conversely, Sakakibara et al. [30] found no difference in power distribution between sleep segments or cohorts. Rhythm stability, however, showed different trends between studies. Suzuki et al. [29] found that ICDF showed no significant diurnal variation in groups. Kolasińska-Kloch et al. [31] stated its measures of frequency and power instability to rise at night in both study groups, however did not provide supporting values or statistical tests. Sakakibara et al. [30] did not assess changes in ICDF across the night, only reporting that the ICDF was significantly higher in PD compared to MSA for late sleep, but neither group differed from controls.
4. Discussion
4.1. Summary of Evidence
All six included studies suggest that sleep is associated with changes to gastric myoelectrical activity, when compared to waking states. The most consistent finding was a reduction in slow-wave magnitude during sleep, which was observed in every study that assessed it, though not always with statistical significance [26,27,29,31]. Gastric slow-wave rhythm tended to be less regular during sleep, with less time spent in normal 2-4cpm activity and more dysrhythmia [27,31], although this was not found uniformly across the studies [29]. Additionally, findings on rhythm stability were inconsistent across the studies that assessed it [29,31]. In contrast to other gastric activity measures, slow-wave rate appeared largely preserved throughout sleep, remaining within normal range in both REM and NREM sleep states [26,27], and largely unchanged across waking, early, and late sleep [29,30]. Two studies reported a significant nocturnal dip in slow-wave rate [29,31], although nighttime values were similar to those in fasted waking states when compared directly [29,30].
These patterns were drawn largely from healthy participants. Across the clinical populations studied, modulation of gastric activity appeared altered rather than simply diminished [26,28,29,30,31], although this as a finding is limited by each condition being examined in only one or two studies (Section 4.3). While all studies recorded gastric myoelectrical recording using a largely similar modality, methodologies used for sleep verification and how outcomes were computed and analysed differed substantially (Section 4.4). This heterogeneity necessitated a narrative synthesis of this literature base, largely limited to the direction of change. Nonetheless, this review highlights that sleep-related changes emerged consistently across studies of differing designs, indicating that sleep is a meaningful modulator of gastric myoelectrical activity. The overnight period remains a largely untapped window with considerable potential for characterising the gut-brain axis in health and disease.
4.2. Physiological Underpinnings
In healthy participants, the observed nocturnal gastric activity patterns do not appear to be fully explained by the shifts in autonomic balance that characterise NREM and REM sleep. NREM is characterised by relatively stable parasympathetic dominance [4], and REM sleep by intermittent sympathetic surges [4,5], so one might expect slow-wave rhythm to be most stable in NREM and least stable in REM. Similarly, sslow-wave magnitude might be expected to be greater in NREM, with increased vagal input, and reduced in REM, with increased sympathetic activity [33]. Because REM sleep becomes more prominent as the night progresses [3], gastric activity sampled later in the night may more closely reflect REM gastric patterns. However, most studies in this review saw magnitude to fall during sleep with no differences in power across different portions of the night [27,29,30], with only one study reporting amplitude being further reduced in REM compared to NREM [30].
Rhythm instability also increased throughout the night in the majority of studies that assessed this [27,31], with no difference between NREM and REM seen [27]. This may indicate that changes in central or cortical activity during sleep modulate gastric activity more strongly than autonomic input, although the concurrent fall in signal power may have inflated instability estimates. Dominant frequency showed conflicting evidence on whether it changed with sleep stage or time of night [26,27,29,30]. However, where assessed, late-sleep dominant frequency was similar to that during pre-breakfast waking [29,30], bringing into question whether this nocturnal decrease reflects the fasted state rather than sleep itself. Alternatively, as nocturnal sympathetic surges have been suggested to persist into early waking hours [34], this similarity may instead reflect similar autonomic states shared between late sleep and early waking hours. The relative roles of autonomic, central and fasting-related influences in healthy populations therefore remain unclear, however methodological limitations may play a role (Section 4.4).
4.3. Sleep-Related Gastric Activity in Disease
As each clinical population was examined by only one to two studies, findings ascertained from within patients are hypothesis-generating. A recurring theme was that disease altered the modulation of gastric activity during sleep. IBS patients showed none of the stage-related changes in magnitude seen in controls [26], and in Subramanian et al. [28], diabetic gastroparesis patients showed minimal separation in slow-wave power between postprandial and sleep periods. In MSA, the nocturnal decrease in DF was blunted [29,30], and slow-wave rhythm was unusually stable [30]. Both studies attributed the blunted modulation of gastric rhythm to impaired central and vagal regulation [29,30]. This is supported by MSA typically affecting central autonomic nuclei [35] while generally preserving enteric neurons [36]. Conversely, PD showed greater rhythmic instability compared to MSA during late sleep [30,37]. This may be due to the additional involvement of enteric plexus pathology in PD [37]. Lastly, in syndrome X patients, those with low autonomic activity spent the most time in bradygastria [31], further bringing into question the potential role of autonomic dysregulation. Taken together, these findings suggest that the modulation of gastric slow-wave activity is not intrinsic to the stomach, but depends on autonomic and wider central nervous system regulation. This could imply that disruption across the gut-brain axis may influence nocturnal gastric activity. Overnight gastric activity therefore has the potential to serve as an insightful window into autonomic function.
4.4. Limitations of Study Methodologies and Evidence
Sleep was poorly characterised across the included studies, with only two resolving sleep by stage using polysomnography [26,27]. Others identified sleep periods using self-reporting [28,29,30], accelerometry [28,31], or clock time without confirming objective sleep [31]. No study examined how gastric activity changed across the night. Instead, short segments [26,27,29,30], or single aggregated blocks [28], were compared between sleep and waking or between sleep stages. Several studies also recorded sleep data that could have supported further comparisons but were never formally analysed [28,29,30].
Several features of how EGG was recorded and analysed may also have confounded comparisons between sleep and waking. Ambulatory studies compared sleep against fed or peri-prandial states rather than fasted waking periods [28,29,30,31], so nocturnal changes described may in part reflect a fasted state rather than sleep. Body position varies across the night, whereas waking recordings made while supine [27] or recumbent [30] are less likely to be affected by movement. Only one study examined whether sleeping position impacted observed changes in a gastric outcome measure, finding that the fall in DP from waking to stage 4 sleep did not differ between supine and non-supine sleepers, although this was only tested in one outcome and one stage [27]. No ambulatory study formally accounted for position, despite one study that concurrently recorded accelerometry therefore could have done so [28]. Only two studies reported how recording segments were selected [27,29], and selection of nocturnal segments by fewest motion artefacts may still be affected by motion with movement being more frequent while awake. Ambulatory recordings may also carry non-gastric signals near 1.5cpm [38], so ambulatory recordings reported without artefact filtering may not be entirely gastric in origin.
The quality of reporting across the studies was also variable. Recorded sleep data often went unanalysed or incompletely reported, with two studies plotting gastric outcomes over sleep and waking segments that were not formally tested or reported [29,30],, so some descriptive statements are supported only by digitised estimates (Section 2.4). Two studies also described changes in a singular gastric outcome without providing values or statistical tests [28,31]. Contradictions between text and figures were also apparent [27,31], and measures were rarely comparable due to differences in or unspecified units (Section 3.4), and therefore they could be compared across studies only by direction of change. Furthermore, most studies were small in sample size, so null findings, such as the absence of significant changes in dominant frequency or rhythm stability during sleep, may reflect limited statistical power rather than a true absence of effect.
4.5. Limitations of This Review and Future Directions
This review was limited to publications from 1996 onwards in English only, and did not include grey literature or citation chasing. The search did not include the term electrogastrography and carried nocturnal only paired with symptoms, so studies describing solely by these terms may have been missed. Furthermore, narrowing the scope to myoelectrical activity excluded studies assessing nocturnal gastric symptoms and motor function, such as migrating motor complexes in context of manometry, which may have been relevant to comprehensive characterisation of nocturnal gastric activity. Consistent with scoping review methodology, no formal critical appraisal was undertaken.
This review identified a small and heterogeneous body of evidence that is insufficient to define how sleep, and particularly individual sleep stages, modulates gastric myoelectrical activity in health and disease. Given the small sample sizes and heterogeneity of the outcome measures and sleep verification, a scoping review was most appropriate to map the existing evidence. High-quality primary research that captures gastric activity using standardised and comparable outcome measures across objectively categorised sleep, with the potential methodological confounders identified in this review accounted for, is required. This is particularly needed in clinical populations. Among disorders of the gut-brain interaction, only IBS was studied. Larger cohorts that include participants with a more comprehensive range gastrointestinal disorders, specifically those closely linked with sleep, such as in FD and other disorders of the gut-brain interaction [8,9,39], are needed to establish whether abnormal nocturnal gastric activity is a consistent disease feature.
High-resolution body surface gastric mapping (BSGM) [40,41,42] would be well suited to this, as it offers non-invasive overnight recording using established gastric outcomes [43] and validated artefact correction and reporting [44]. BSGM has the potential to better characterise the physiological relationship between sleep and nocturnal gastric activity. Pairing gastric myoelectrical activity recordings with a direct measure of autonomic activity, such as heart rate variability, would also allow nocturnal gastric activity to be assessed against autonomic activity directly rather than inferred from sleep stage, which would help to separate autonomic, central, and fasting-related influences to nocturnal gastric myoelectrical activity.
5. Conclusions
This scoping review summarised the research findings from six papers that assessed gastric myoelectrical activity during sleep, across both healthy and clinical populations. Findings showed that sleep is associated with changes in gastric myoelectrical activity, most consistently a reduction in slow-wave magnitude. Slow-wave rhythm tended to become less regular, whereas slow-wave rate appeared largely preserved. In clinical populations, the modulation of gastric myoelectrical activity appeared altered rather than simply reduced, and trends varied substantially between disease groups. However, the evidence base is small, methodologically heterogeneous, and relies on modalities for analysing gastric activity that are low-resolution and susceptible to movement artefact. This is compounded by inconsistent outcome measures and sparse, conflicting evidence on how gastric activity varies with sleep stage. Moreover, existing studies analysed only brief snapshots of sleep or treated the night as a single period, so no study has yet characterised how gastric activity changes across the course of the night. Future studies that combine high-resolution recordings of gastric activity with sleep staging are needed to establish nocturnal gastric physiology in healthy populations, and to determine whether its disruption is a feature of gastrointestinal disorders. Further investigation into the underlying mechanisms of nocturnal changes in gastric myoelectrical activity, including autonomic regulation and meal-related influences, would help to provide a more comprehensive understanding of gastric physiology during sleep.
Author Contributions
Conceptualization, L.J., S.V.H., G.O.; methodology, L.J., S.V.H., and G.O.; investigation, L.J. and M.B.; formal analysis, L.J.; data curation, L.J.; writing—original draft preparation, L.J.; writing—review and editing, L.J., M.B., C.W., S.V.H., M.L. and G.O.; supervision, M.L. and G.O. All authors have read and agreed to the posted version of the manuscript.
Funding
L.J. was supported by a summer research studentship grant from the University of Auckland.
Institutional Review Board Statement
Not applicable. This review used only data from previously published studies and involved no new data collection from human participants.
Informed Consent Statement
Not applicable.
Data Availability Statement
All data analysed in this review are drawn from published studies cited in the reference list. Full search strategies, the a priori eligibility criteria and the completed PRISMA-ScR checklist are provided in Appendix A, Appendix B and Appendix C. The data-charting form and the values digitised using WebPlotDigitizer are available from the corresponding author on reasonable request.
Conflicts of Interest
G.O. is a co-founder and shareholder of Alimetry Ltd. and The Insides Company. S.V.H. and M.L. are employed by Alimetry Ltd. Alimetry Ltd. develops body surface gastric mapping technology, which is discussed in this review. L.J., M.B. and C.W. declare no conflicts of interest. The funders had no role in the design of the study; in the collection, analyses, or interpretation of data; in the writing of the manuscript; or in the decision to publish the results.
Abbreviations
The following abbreviations are used in this manuscript:
| ANS | autonomic nervous system |
| BSGM | body surface gastric mapping |
| cpm | cycles per minute |
| CSX | cardiological syndrome X |
| D-GP | diabetic gastroparesis |
| D-NGP | diabetic non-gastroparesis |
| DF | dominant frequency |
| DF-A | dominant frequency amplitude |
| DFIC | dominant frequency instability coefficient |
| DP | dominant power |
| DPIC | dominant power instability coefficient |
| EGG | electrogastrography |
| FD | functional dyspepsia |
| HFR | high-frequency range |
| IBS | irritable bowel syndrome |
| ICDF | instability coefficient of dominant frequency |
| I-GP | idiopathic gastroparesis |
| JBI | Joanna Briggs Institute |
| LFR | low-frequency range |
| MSA | multiple system atrophy |
| NFR | normal-frequency range |
| NREM | non-rapid eye movement |
| PD | Parkinson’s disease |
| period dominant frequency | |
| PDP | period dominant power |
| PRISMA-ScR | Preferred Reporting Items for Systematic Reviews and Meta-Analyses extension for Scoping Reviews |
| PSG | polysomnography |
| REM | rapid eye movement |
| SD | standard deviation |
| SEM | standard error of the mean |
Appendix A. Search Strategy
The gastric terms used were searched by combining an anatomical term with an outcome term. The anatomical terms were gastric, stomach, or antral, and the outcome terms motility, activity, function, myoelectrical activity, electrical activity, electrical signals, empty*, or clear*). This structure was used to capture the varying ways measurements of gastric function are described across the literature. The outcome terms deliberately span motor function, emptying, and symptoms as well as myoelectrical activity because the a priori protocol included all of these at the time the search was built. Sleep terms were searched both individually and as pairs. The single terms were sleep, REM, NREM, and circadian. The paired terms were sleep with stages, phases, or architecture, as well as symptoms with nocturnal or overnight. Terms that more broadly approximate sleep, such as REM or circadian, were included to avoid missing studies that describe periods inclusive of sleep using vocabulary that does not contain the word itself. The pairings of sleep with stages, phases, and architecture were aimed at studies reporting results specific to portions of sleep rather than whole-night results.
Proximity searching was preferred because it captures a pairing in any order and with intervening words, increasing search sensitivity. In Embase and Scopus, the paired terms were hence joined by a proximity operator. While PubMed also supports proximity searching, it cannot be combined with truncated terms, such as with the terms empty* or clear*. Therefore, combinations were expanded and written as individual phrases.
Table A1.
Full search strategies for each database.
| MEDLINE (via PubMed) | |
|---|---|
|
Search: (“Gastrointestinal Motility”[Mesh] OR “Gastric Emptying”[Mesh] OR “gastrointestinal motility”[tiab] OR “gastric motility”[tiab] OR “stomach motility”[tiab] OR “antral motility”[tiab] OR “gastric activity”[tiab] OR “stomach activity”[tiab] OR “antral activity”[tiab] OR “stomach function”[tiab] OR “gastric function”[tiab] OR “antral function”[tiab] OR “gastric myoelectrical activity”[tiab] OR gastric electrical signals[tiab] OR gastric electrical activity[tiab] OR gastric empty*[tiab] OR stomach empty*[tiab] OR antral empty*[tiab] OR gastric clear*[tiab] OR stomach clear*[tiab] OR antral clear*[tiab] OR “gastric symptoms”[tiab] OR “gastrointestinal symptoms”[tiab] OR “stomach symptoms”[tiab] OR (gastric[tiab] AND myoelectric[tiab] AND functioning[tiab])) AND (“Sleep”[Mesh] OR “Sleep Stages”[Mesh] OR “Circadian Rhythm”[Mesh] OR sleep[tiab] OR sleep stage*[tiab] OR sleep phase*[tiab] OR “sleep architecture”[tiab] OR REM[tiab] OR NREM[tiab] OR circadian[tiab] OR nocturnal symptoms[tiab] OR overnight symptoms[tiab]) NOT (Review[pt] OR “Systematic Review”[pt] OR “Meta-Analysis”[pt]) Additional Limits: Outside of the query string, limits were applied using the PubMed interface filters for: English language, humans, and publication from 1995 onwards. Records retrieved: 712 on 21 April 2026; 744 on 8 October 2026 re-run. | |
| Embase (via Ovid) | |
| Line | Search statement |
| 1 | ((stomach or gastric or antral) adj3 (motility or activity or function)).ti,ab,kw. |
| 2 | (stomach or gastric or antral) adj3 (myoelectrical activity or electrical activity or electrical signals)).ti,ab,kw. |
| 3 | ((stomach or gastric or antral) adj3 (empty* or clear*)).ti,ab,kw. |
| 4 | ((stomach or gastric or antral or gastrointestinal) adj3 symptoms).ti,ab,kw. |
| 5 | 1 or 2 or 3 or 4 |
| 6 | exp sleep/ |
| 7 | (sleep adj1 (stage* or phase* or architecture)).ti,ab,kw. |
| 8 | REM.ti,ab,kw. |
| 9 | NREM.ti,ab,kw. |
| 10 | circadian.ti,ab,kw. |
| 11 | ((nocturnal or overnight) adj1 symptoms).ti,ab,kw. |
| 12 | 6 or 7 or 8 or 9 or 10 or 11 |
| 13 | 5 and 12 |
| 14 | limit 13 to (human and english language and embase and yr=“1995 -Current”) |
|
Records retrieved: 689 on 21 April 2026; 727 on 8 October 2026 re-run. | |
| Scopus | |
|
Search: ( TITLE-ABS-KEY ( ( stomach OR gastric OR antral ) W/3 ( motility OR function OR activity OR “myoelectrical activity” OR “electrical activity” OR “electrical signals” OR empty* OR clear* OR symptom* ) ) ) AND ( TITLE-ABS-KEY ( ( sleep W/1 ( stage* OR architecture OR phase* ) ) OR sleep OR REM OR NREM OR “Rapid Eye Movement” OR “Non-Rapid Eye Movement” OR circadian OR ( ( nocturnal OR overnight ) W/1 symptoms ) ) ) AND NOT ( TITLE-ABS-KEY ( review OR “systematic review” OR “meta-analysis” ) OR DOCTYPE ( re ) OR DOCTYPE ( cp ) OR DOCTYPE ( ed ) ) Additional Limits: Outside of the query string, limits were applied using the Scopus interface filters for: English language, and publication from 1995 onwards. Records retrieved: 490 on 21 April 2026; 499 on 8 October 2026 re-run. | |
Appendix B. A Priori Eligibility Criteria
Table A2.
Eligibility criteria as specified in the a priori protocol, before the amendments described in Section 2.3.1.
Table A2.
Eligibility criteria as specified in the a priori protocol, before the amendments described in Section 2.3.1.
| Type: | Included | Excluded |
|---|---|---|
| Population | Human subjects; adults ≥18 years old | Non-human subjects; paediatric populations <18 years old |
| Concept | Objective measurement of gastric myoelectrical activity OR gastric motor function during sleep OR quantification of related gastric symptoms using objective quantitative measures | Studies that do not measure gastric activity or gastric symptoms in relation to sleep |
| Context | Overnight recording during natural sleep in any setting, whether sleep laboratory, hospital/clinic, or free-living; published from 1995 onwards; published in English | Pharmacologically-induced sleep; publication before 1995; published in a language other than English |
| Types of sources | Peer-reviewed primary studies | Conference abstracts; review articles; preprints and other non-peer-reviewed sources |
Appendix C. PRISMA-ScR Checklist
Table A3.
Completed PRISMA-ScR checklist [16], showing where each item is reported in this manuscript. Items 12 and 16 are optional.
Table A3.
Completed PRISMA-ScR checklist [16], showing where each item is reported in this manuscript. Items 12 and 16 are optional.
| Section | # | PRISMA-ScR item | Reported in |
|---|---|---|---|
| Title | 1 | Title | Title |
| Abstract | 2 | Structured summary | Abstract |
| Introduction | 3 | Rationale | Section 1, paragraphs 1–4 |
| 4 | Objectives | Section 1, final paragraph | |
| Methods | 5 | Protocol and registration | Section 2.1; Appendix B (Table A2) |
| 6 | Eligibility criteria | Section 2.3; Table 1; Section 2.3.1 | |
| 7 | Information sources | Section 2.2 | |
| 8 | Search | Section 2.2; Figure 1; Appendix A (Table A1) | |
| 9 | Selection of sources of evidence | Section 2.3 | |
| 10 | Data charting process | Section 2.4 | |
| 11 | Data items | Section 2.4 | |
| 12 | Critical appraisal of individual sources of evidence | Not performed; Section 4.5 | |
| 13 | Synthesis of results | Section 2.4; Section 3.4 | |
| Results | 14 | Selection of sources of evidence | Section 3.1; Figure 2 |
| 15 | Characteristics of sources of evidence | Section 3.2 and Section 3.3; Table 2 | |
| 16 | Critical appraisal within sources of evidence | Not applicable | |
| 17 | Results of individual sources of evidence | Section 3.4, Section 3.5 and Section 3.6; Table 4, Table 5 and Table 6 | |
| 18 | Synthesis of results | Section 3.5 and Section 3.6 | |
| Discussion | 19 | Summary of evidence | Section 4.1 |
| 20 | Limitations | Section 4.4 and Section 4.5 | |
| 21 | Conclusions | Section 5 | |
| Funding | 22 | Funding | Funding and Conflicts of Interest statements |
References
- Black, C.J.; Drossman, D.A.; Talley, N.J.; Ruddy, J.; Ford, A.C. Functional gastrointestinal disorders: advances in understanding and management. Lancet 2020, 396(10263), 1664–1674. [Google Scholar] [CrossRef] [PubMed]
- Carabotti, M.; Scirocco, A.; Maselli, M.A.; Severi, C. The Gut-Brain Axis Interactions between Enteric Microbiota, Central and Enteric Nervous Systems. In Annals of Gastroenterology; - References - Scientific Research Publishing, 2015; Volume 28, pp. 203–209. Available online: https://www.scirp.org/reference/referencespapers?referenceid=3171275 (accessed on 13 October 2026).
- Carskadon, W.C.; Dement, M.A. Normal Human Sleep An Overview. In Principles and Practice of Sleep Medicine, Fifth Edition; Elsevier Saunders: St. Louis; - References - Scientific Research Publishing, 2011; pp. 16–26. Available online: https://www.scirp.org/reference/referencespapers?referenceid=2768091 (accessed on 13 October 2026).
- Trinder, J.; Kleiman, J.; Carrington, M.; et al. Autonomic activity during human sleep as a function of time and sleep stage. J. Sleep Res. 2001, 10(4), 253–264. [Google Scholar] [CrossRef] [PubMed]
- Somers, V.K.; Dyken, M.E.; Mark, A.L.; Abboud, F.M. Sympathetic-nerve activity during sleep in normal subjects. N Engl. J. Med. 1993, 328(5), 303–307. [Google Scholar] [CrossRef] [PubMed]
- Travagli, R.A.; Anselmi, L. Vagal neurocircuitry and its influence on gastric motility. Nat. Rev. Gastroenterol. Hepatol. 2016, 13(7), 389–401. [Google Scholar] [CrossRef] [PubMed]
- Browning, K.N.; Travagli, R.A. Central control of gastrointestinal motility. Curr. Opin. Endocrinol. Diabetes Obes. 2019, 26(1), 11–16. [Google Scholar] [CrossRef] [PubMed]
- Wang, B.; Duan, R.; Duan, L. Prevalence of sleep disorder in irritable bowel syndrome: A systematic review with meta-analysis. Saudi J. Gastroenterol. 2018, 24(3), 141–150. [Google Scholar] [CrossRef] [PubMed]
- Koloski, N.A.; Jones, M.; Walker, M.M.; Keely, S.; Holtmann, G.; Talley, N.J. Sleep disturbances in the irritable bowel syndrome and functional dyspepsia are independent of psychological distress: a population-based study of 1322 Australians. Aliment Pharmacol. Ther. 2021, 54(5), 627–636. [Google Scholar] [CrossRef] [PubMed]
- Vakil, N.; Wernersson, B.; Wissmar, J.; Dent, J. Sleep disturbance due to heartburn and regurgitation is common in patients with functional dyspepsia. United Eur. Gastroenterol. J. 2016, 4(2), 191–198. [Google Scholar] [CrossRef] [PubMed]
- Buchanan, D.T.; Cain, K.; Heitkemper, M.; et al. Sleep measures predict next-day symptoms in women with irritable bowel syndrome. J. Clin. Sleep Med. 2014, 10(9), 1003–1009. [Google Scholar] [CrossRef] [PubMed]
- Topan, R.; Vork, L.; Fitzke, H.; et al. Poor subjective sleep quality predicts symptoms in irritable bowel syndrome using the experience sampling method. Am. J. Gastroenterol. 2024, 119(1), 155–164. [Google Scholar] [CrossRef] [PubMed]
- Wuestenberghs, F.; Melchior, C.; Desprez, C.; Leroi, A.M.; Netchitailo, M.; Gourcerol, G. Sleep quality and insomnia are associated with quality of life in functional dyspepsia. Front Neurosci. 2022, 16, 829916. [Google Scholar] [CrossRef] [PubMed]
- Yin, J.; Chen, J.D.Z. Electrogastrography: methodology, validation and applications. J. Neurogastroenterol. Motil. 2013, 19(1), 5–17. [Google Scholar] [CrossRef] [PubMed]
- Wick, A.Z.; Combertaldi, S.L.; Rasch, B. The first-night effect of sleep occurs over nonconsecutive nights in unfamiliar and familiar environments. Sleep 2024, 47(10), zsae179. [Google Scholar] [CrossRef] [PubMed]
- Tricco, A.C.; Lillie, E.; Zarin, W.; et al. PRISMA extension for Scoping Reviews (PRISMA-ScR): Checklist and explanation. Ann. Intern Med. 2018, 169(7), 467–473. [Google Scholar] [CrossRef] [PubMed]
- Page, M.J.; McKenzie, J.E.; Bossuyt, P.M.; et al. The PRISMA 2020 statement: an updated guideline for reporting systematic reviews. BMJ 2021, 372, n71. [Google Scholar] [CrossRef] [PubMed]
- Aromataris, E.; Lockwood, C.; Porritt, K.; Pilla, B.; Jordan, Z. (Eds.) JBI Manual for Evidence Synthesis; JBI, 2024. [Google Scholar] [CrossRef]
- Bramer, W.M.; Giustini, D.; de Jonge, G.B.; Holland, L.; Bekhuis, T. De-duplication of database search results for systematic reviews in EndNote. J. Med. Libr Assoc. 2016, 104(3), 240–243. [Google Scholar] [CrossRef] [PubMed]
- Ouzzani, M.; Hammady, H.; Fedorowicz, Z.; Elmagarmid, A. Rayyan-a web and mobile app for systematic reviews. Syst. Rev. 2016, 5(1), 210. [Google Scholar] [CrossRef] [PubMed]
- Ohayon, M.M.; Carskadon, M.A.; Guilleminault, C.; Vitiello, M.V. Meta-analysis of quantitative sleep parameters from childhood to old age in healthy individuals: developing normative sleep values across the human lifespan. Sleep 2004, 27(7), 1255–1273. [Google Scholar] [CrossRef] [PubMed]
- Chen, J.D.; Co, E.; Liang, J.; et al. Patterns of gastric myoelectrical activity in human subjects of different ages. Am. J. Physiol. 1997, 272 5 Pt 1, G1022–G1027. [Google Scholar] [CrossRef] [PubMed]
- Parkman, H.P.; Hasler, W.L.; Barnett, J.L.; Eaker, E.Y. American Motility Society Clinical GI Motility Testing Task Force. Electrogastrography: a document prepared by the gastric section of the American Motility Society Clinical GI Motility Testing Task Force. Neurogastroenterol. Motil. 2003, 15(2), 89–102. [Google Scholar] [CrossRef]
- Kumar, D.; Idzikowski, C.; Wingate, D.L.; Soffer, E.E.; Thompson, P.; Siderfin, C. Relationship between enteric migrating motor complex and the sleep cycle. Am. J. Physiol. 1990, 259 6 Pt 1, G983–G990. [Google Scholar] [CrossRef] [PubMed]
- Drevon, D.; Fursa, S.R.; Malcolm, A.L. Intercoder reliability and validity of WebPlotDigitizer in extracting graphed data. Behav. Modif. 2017, 41(2), 323–339. [Google Scholar] [CrossRef] [PubMed]
- Orr, W.C.; Crowell, M.D.; Lin, B.; Harnish, M.J.; Chen, J.D. Sleep and gastric function in irritable bowel syndrome: derailing the brain-gut axis. Gut 1997, 41(3), 390–393. [Google Scholar] [CrossRef] [PubMed]
- Elsenbruch, S.; Orr, W.C.; Harnish, M.J.; Chen, J.D. Disruption of normal gastric myoelectric functioning by sleep. Sleep 1999, 22(4), 453–458. [Google Scholar] [CrossRef]
- Subramanian, S.; Kunkel, D.C.; Nguyen, L.; Coleman, T.P. Exploring the gut-brain connection in gastroparesis with autonomic and gastric myoelectric monitoring. IEEE Trans. BioMed Eng. 2023, 70(12), 3342–3353. [Google Scholar] [CrossRef] [PubMed]
- Suzuki, A.; Asahina, M.; Ishikawa, C.; et al. Impaired circadian rhythm of gastric myoelectrical activity in patients with multiple system atrophy. Clin. Auton. Res. 2005, 15(6), 368–372. [Google Scholar] [CrossRef] [PubMed]
- Sakakibara, Y.; Asahina, M.; Suzuki, A.; Hattori, T. Gastric myoelectrical differences between Parkinson’s disease and multiple system atrophy. Mov. Disord. 2009, 24(11), 1579–1586. [Google Scholar] [CrossRef] [PubMed]
- Kolasińska-Kloch, W.; Furgała, A.; Kloch, M.; Hybel, J.; Thor, P.J. Gastric myoelectric and autonomic activities and dyspeptic symptoms in cardiological syndrome X patients. Folia Med. Cracov 2007, 48(1-4), 45–56. Available online: https://pubmed.ncbi.nlm.nih.gov/19051692/ (accessed on 11 October 2026). [PubMed]
- Chen, J.; McCallum, R.W. Electrogastrography: Principles and Applications; Raven Press, 1994. [Google Scholar]
- Browning, K.N.; Travagli, R.A. Central nervous system control of gastrointestinal motility and secretion and modulation of gastrointestinal functions. Compr. Physiol. 2014, 4(4), 1339–1368. [Google Scholar] [CrossRef] [PubMed]
- Miglis, M.G. Autonomic dysfunction in primary sleep disorders. Sleep Med. 2016, 19, 40–49. [Google Scholar] [CrossRef] [PubMed]
- Benarroch, E.E.; Schmeichel, A.M.; Sandroni, P.; Low, P.A.; Parisi, J.E. Involvement of vagal autonomic nuclei in multiple system atrophy and Lewy body disease. Neurology 2006, 66(3), 378–383. [Google Scholar] [CrossRef] [PubMed]
- Craig, C.F.; Finkelstein, D.I.; McQuade, R.M.; Diwakarla, S. Understanding the potential causes of gastrointestinal dysfunctions in multiple system atrophy. Neurobiol. Dis. 2023, 187(106296), 106296. [Google Scholar] [CrossRef] [PubMed]
- Braak, H.; de Vos, R.A.I.; Bohl, J.; Del Tredici, K. Gastric alpha-synuclein immunoreactive inclusions in Meissner’s and Auerbach’s plexuses in cases staged for Parkinson’s disease-related brain pathology. Neurosci. Lett. 2006, 396(1), 67–72. [Google Scholar] [CrossRef] [PubMed]
- Kaiho, T.; Shimoyama, I.; Nakajima, Y.; Ochiai, T. Gastric and non-gastric signals in electrogastrography. J. Auton. Nerv. Syst. 2000, 79(1), 60–66. [Google Scholar] [CrossRef] [PubMed]
- Kumar, N.; Bashar, Q.; Reddy, N.; et al. Cyclic Vomiting Syndrome (CVS): is there a difference based on onset of symptoms--pediatric versus adult? BMC Gastroenterol. 2012, 12(1), 52. [Google Scholar] [CrossRef] [PubMed]
- O’Grady, G.; Varghese, C.; Schamberg, G.; et al. Principles and clinical methods of body surface gastric mapping: Technical review. Neurogastroenterol. Motil. 2023, 35(10), e14556. [Google Scholar] [CrossRef] [PubMed]
- Gharibans, A.A.; Calder, S.; Varghese, C.; et al. Gastric dysfunction in patients with chronic nausea and vomiting syndromes defined by a noninvasive gastric mapping device. Sci. Transl. Med. 2022, 14(663), eabq3544. [Google Scholar] [CrossRef] [PubMed]
- Varghese, C.; Dachs, N.; Schamberg, G.; et al. Expert clinical consensus on body Surface Gastric Mapping phenotypes for gastroduodenal disorders: “Auckland Classification” v1.0. Neurogastroenterol. Motil. 2026, 38(7), e70377. [Google Scholar] [CrossRef] [PubMed]
- Varghese, C.; Schamberg, G.; Calder, S.; et al. Normative values for body surface gastric mapping evaluations of gastric motility using Gastric Alimetry: Spectral analysis. Am. J. Gastroenterol. 2023, 118(6), 1047–1057. [Google Scholar] [CrossRef] [PubMed]
- Calder, S.; Schamberg, G.; Varghese, C.; et al. An automated artifact detection and rejection system for body surface gastric mapping. Neurogastroenterol. Motil. 2022, 34(11), e14421. [Google Scholar] [CrossRef] [PubMed]
Figure 1.
Example search strategy syntax.

Figure 2.
PRISMA flow diagram of study selection.
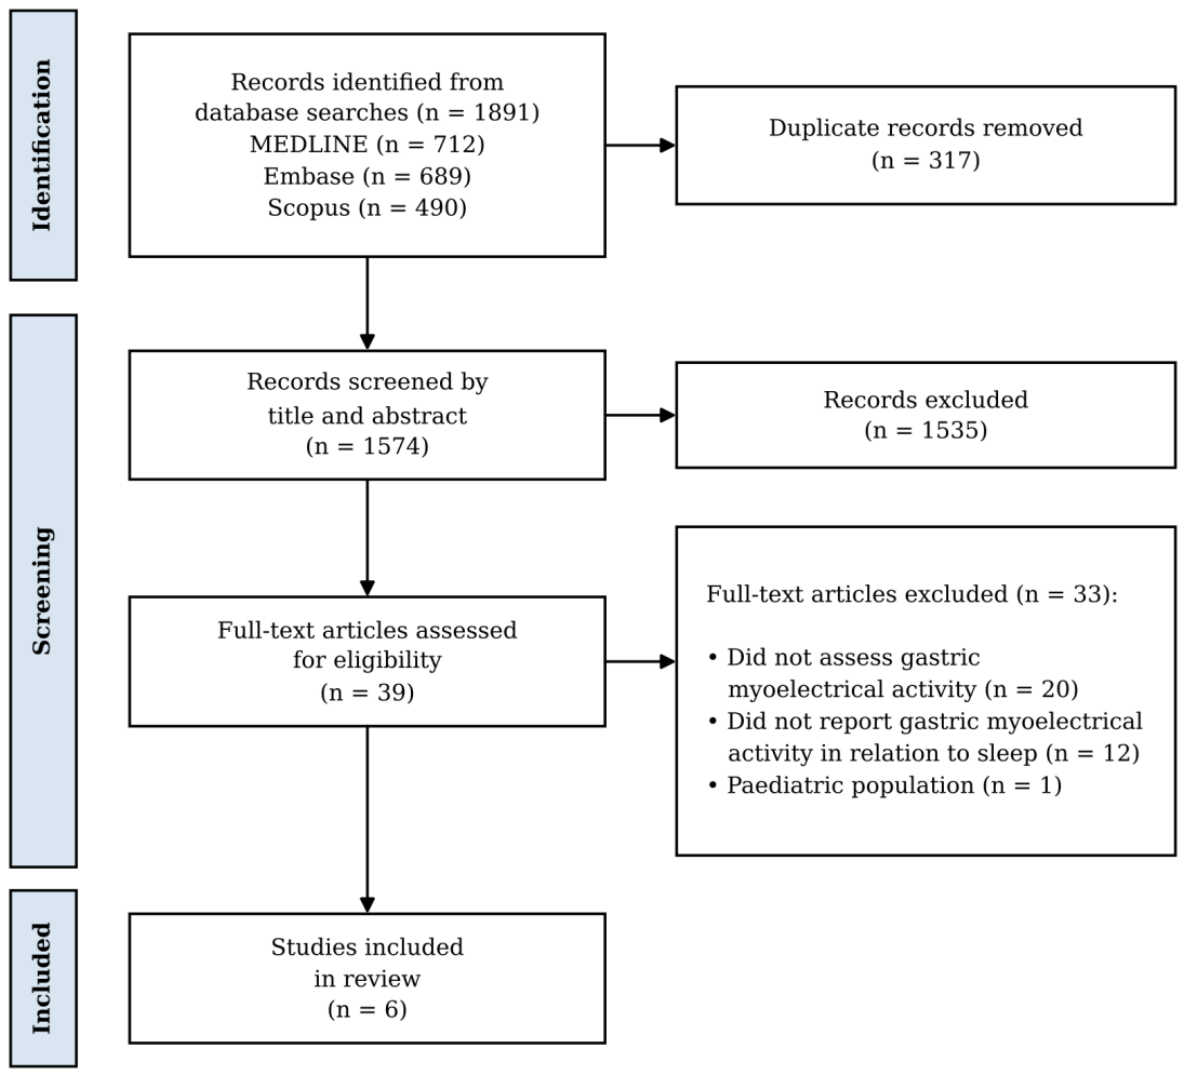
Table 1.
Inclusion and exclusion criteria.
| Type: | Included | Excluded |
|---|---|---|
| Population | Human subjects; adults >18 years old | Non-human subjects; paediatric populations <18 years old |
| Concept | Objective measurement of gastric myoelectrical activity, analysed in relation to sleep | Studies that do not analyse gastric activity in relation to sleep; gastric motor function rather than myoelectrical activity |
| Context | Overnight recording during natural sleep in any setting, whether sleep laboratory, hospital/clinic, or free-living; published from 1996 onwards; published in English | Pharmacologically-induced sleep; publication before 1996; published in a language other than English |
| Types of sources | Peer-reviewed primary studies | Conference abstracts; review articles; preprints and other non-peer-reviewed sources |
Table 3.
Methods of sleep verification.
| Study | Method of sleep verification | Sleep and waking states compared | Recording setting |
|---|---|---|---|
| Kolasińska-Kloch, 2007 [31] | Fixed clock-time window | Day 06:00-22:00 against night 22:00-06:00 | Hospital inpatient |
| Suzuki, 2005 [29] | Participant-reported activity diary: sleep onset and offset provided | Early sleep, defined as one hour from sleep onset to 02:00, and late sleep, defined as 03:00 to 05:00, are compared against waking segments subdivided into pre-breakfast/lunch/dinner and post-breakfast/lunch/dinner. | Free-living; participants following their usual daily activities |
| Sakakibara, 2009 [30] | Participant-reported activity diary: bedtime, and waking time provided | Early sleep, between 1-2 hours after going to bed, and late sleep, 1-2 hours before waking, are compared against waking segments subdivided into pre-breakfast/lunch/dinner and post-breakfast/lunch/dinner. | Free-living; participants following their usual daily activities |
| Subramanian, 2023 [28] | Sleep and wake times calculated algorithmically from triaxial accelerometry and participants’ manual annotation of sleep and wake times. | Last three hours of sleep are selected as “late sleep” and compared against a 4-hour postprandial awake segment. Sleep is used explicitly as a fasting proxy, not a state of interest. | Home |
| Orr, 1997 [26] | Polysomnography | Comparisons made between waking, and combined NREM, and REM sleep stages | Sleep laboratory |
| Elsenbruch, 1999 [27] | Polysomnography | Comparisons made between waking, stage 2, stage 4, and REM. | Sleep laboratory |
Abbreviations: NREM, non-rapid eye movement; REM, rapid eye movement.
Table 5.
Gastric myoelectrical findings across waking and sleep stages in studies that resolved sleep by stage.
Table 5.
Gastric myoelectrical findings across waking and sleep stages in studies that resolved sleep by stage.
| Study | Slow-wave rate | Slow-wave magnitude | Rhythm stability | Rhythm distribution |
|---|---|---|---|---|
| Orr et al., 1997 [26] | DF did not change across sleep and waking states in IBS or controls. | In controls, DF-A decreased significantly from waking (52.5 dB*) to NREM (45.4 dB*), and rose from NREM to REM (54.7 dB*). In IBS patients, no significant changes in DF-A were seen across sleep stages. |
Not reported | Not reported |
| Elsenbruch et al., 1999 [27] | DF did not change significantly across sleep and waking stages. | DP decreased significantly from waking (31.4 dB) to every sleep stage (23.1–24.7 dB). | ICDF increased significantly from waking (0.19) to every sleep stage (0.34–0.47). | From waking to NREM, %normogastria fell significantly (90.8% to 57.5–64.6%), while %tachygastria rose (5.0%* to 23.5%* in stages 2 and 4) and %arrhythmia rose (0.6%* to 7.2%* in stage 4). %bradygastria also rose (5.0%* to 7.4%* in stage 2 and 12.4%* in stage 4), though significance is reported only in the figure legend (see Section 3.5). Rhythm distribution in REM did not differ significantly from waking (%normal rhythm 74.1%). |
*estimated values generated by WebPlotDigitizer. Abbreviations: DF, dominant frequency; DF-A, dominant frequency amplitude; DP, dominant power; ICDF, instability coefficient of dominant frequency; IBS, irritable bowel syndrome; NREM, non-rapid eye movement; REM, rapid eye movement.
Disclaimer/Publisher’s Note: The statements, opinions and data contained in all publications are solely those of the individual author(s) and contributor(s) and not of MDPI and/or the editor(s). MDPI and/or the editor(s) disclaim responsibility for any injury to people or property resulting from any ideas, methods, instructions or products referred to in the content. |
© 2026 by the authors. Licensee MDPI, Basel, Switzerland. This article is an open access article distributed under the terms and conditions of the Creative Commons Attribution (CC BY) license (http://creativecommons.org/licenses/by/4.0/).
Copyright: This open access article is published under a Creative Commons CC BY 4.0 license, which permit the free download, distribution, and reuse, provided that the author and preprint are cited in any reuse.