

Submitted:
12 November 2026
Posted:
13 November 2026
You are already at the latest version
Abstract
On 9 November 2026, while excavating the second bench of the connecting tunnel, a water-ingress event was reported at the Tarbela 5th Extension Hydropower Project (T-5). Project officials blamed the inflow on the failure of weak rock between the intake pit and the tunnel, while accounts from the Haripur Deputy Commissioner said it was due to a failure of a protective bund and another report cited a falling girder. There is also a different public accounts, with respect to the workforce outcome. The incident is located within a geographical and hydraulic context, the two accounts are compared on a set of common criteria, and three testable hypotheses, resulting from the analysis of the mechanisms, are presented: rock-mass failure, temporary-barrier failure, and a coupled sequence. The comparison is then made to three known failures: Teton Dam (1976), Oroville Spillway (2017), and Vajont landslide (1963). These cases are not considered proof of the T-5 failure mechanism, but rather provide lessons to be transferred for future projects. Project-history context is provided in the separate inquiry on upstream-cofferdam which was held in August 2025. No public records of the initiating cause exist, and a conclusion must involve the inquiry record, site evidence, construction documentation and monitoring data.
Keywords:
Tarbela T-5 water ingress
; rock-mass failure
; protective bund
; cofferdam
; tunnel excavation
; temporary works
; geotechnical investigation
; flood
1. Introduction
It is rare for water-retaining and underground construction to fail in one stroke. A local weakness, such as an overstressed rock block, a seepage path or a damaged temporary wall, can develop into a major incident once a ground mass, temporary barrier or hydraulic boundary stops performing its intended function. At hydropower sites, excavations are often separated from reservoir water by a combination of natural rock, permanent structures and temporary works. The engineering task after an incident is therefore to reconstruct the sequence of ground response, structural response, water movement and site actions, rather than to adopt a cause from the first public explanation.
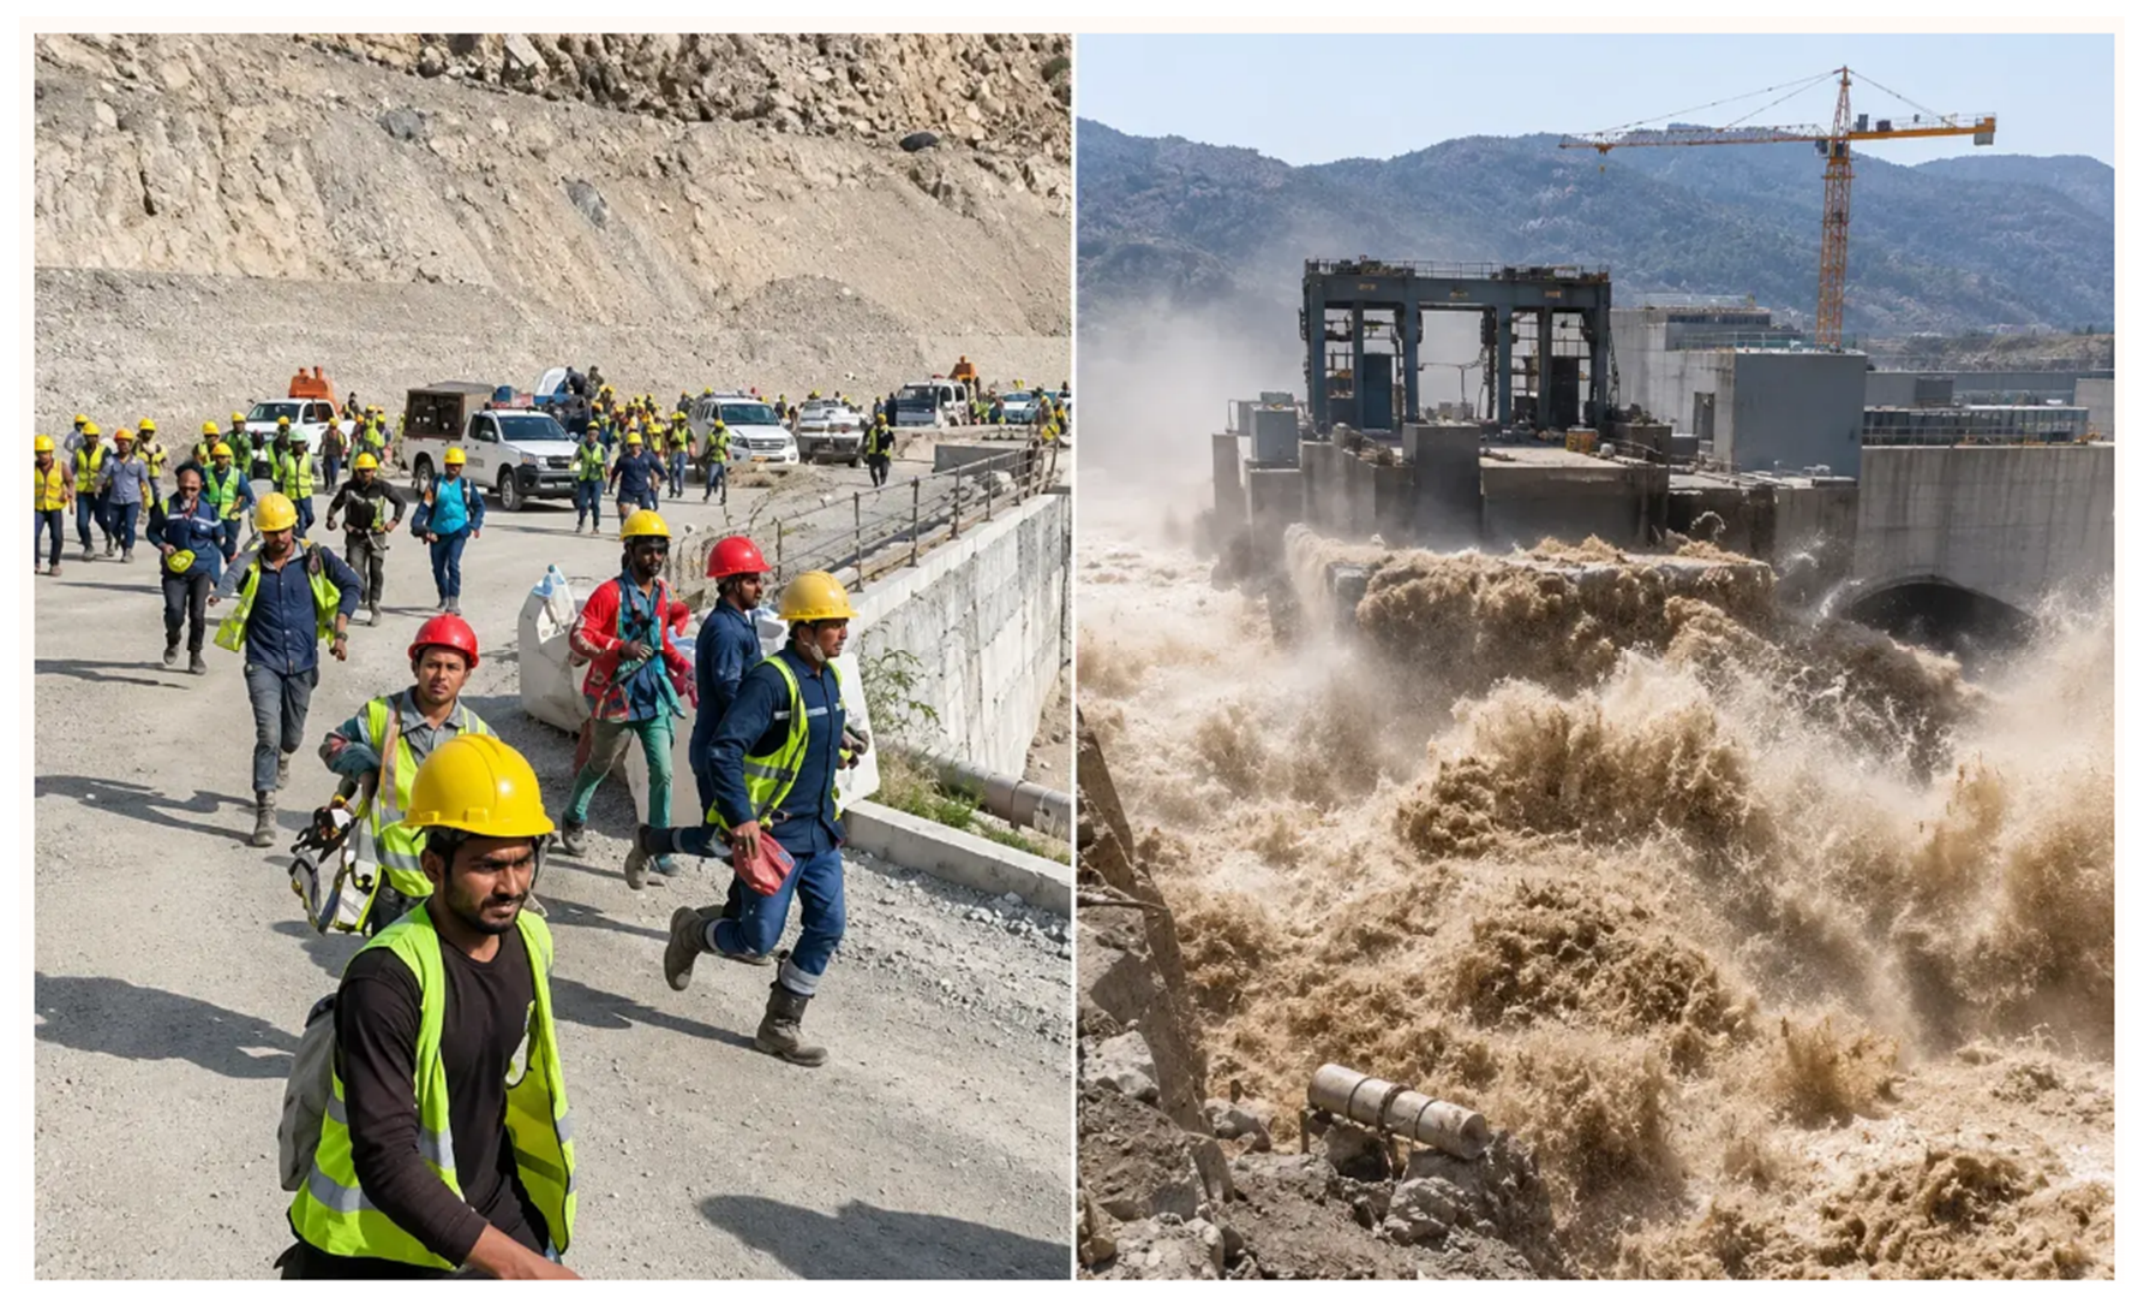
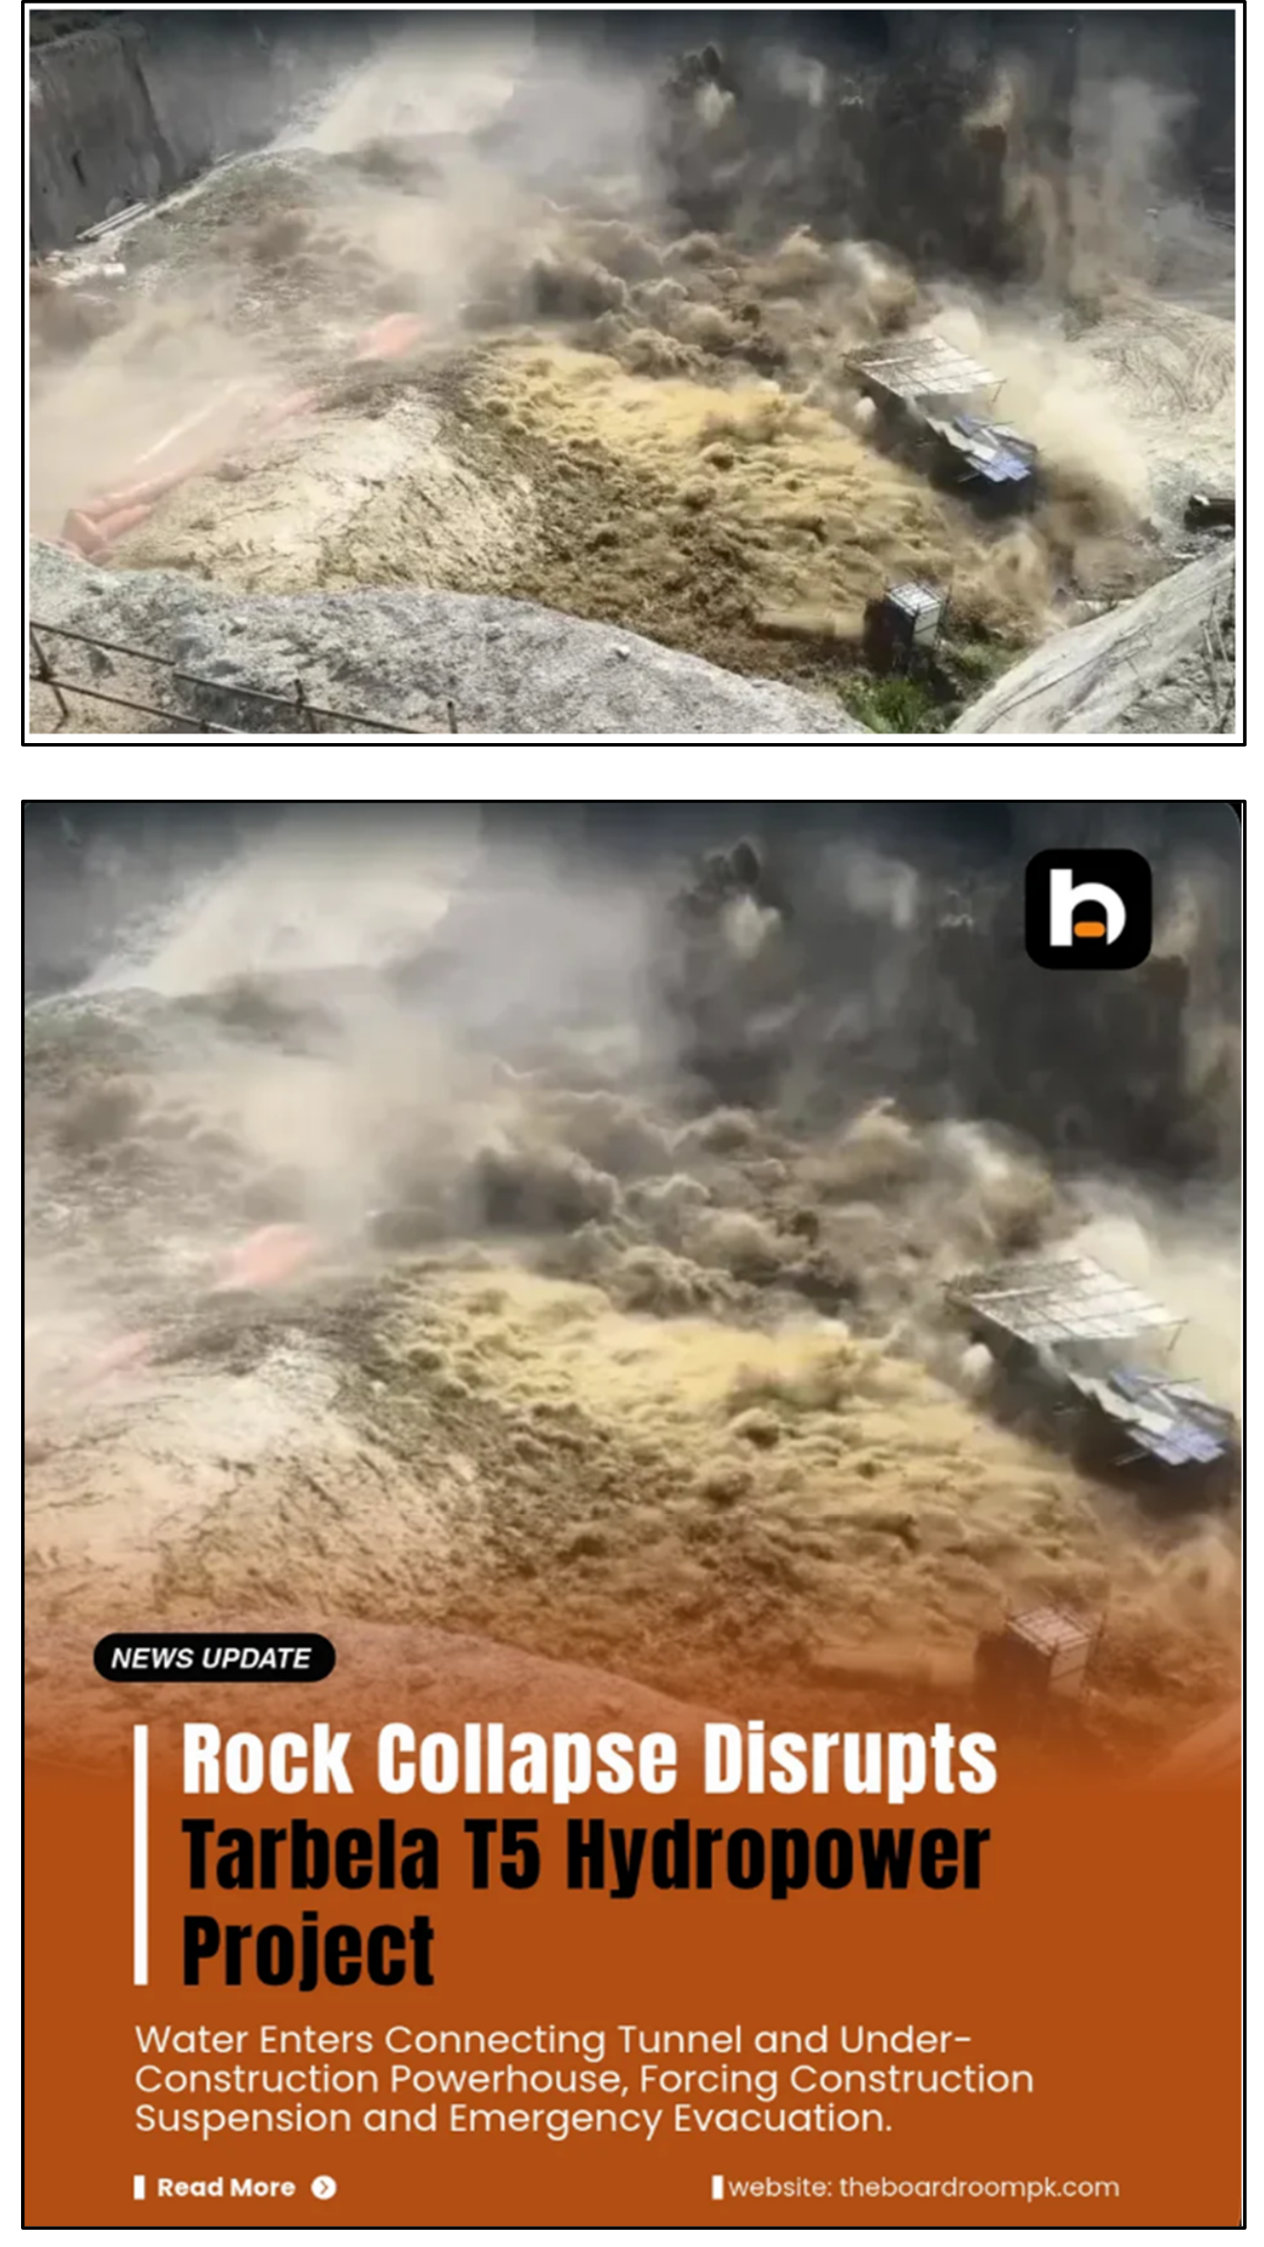
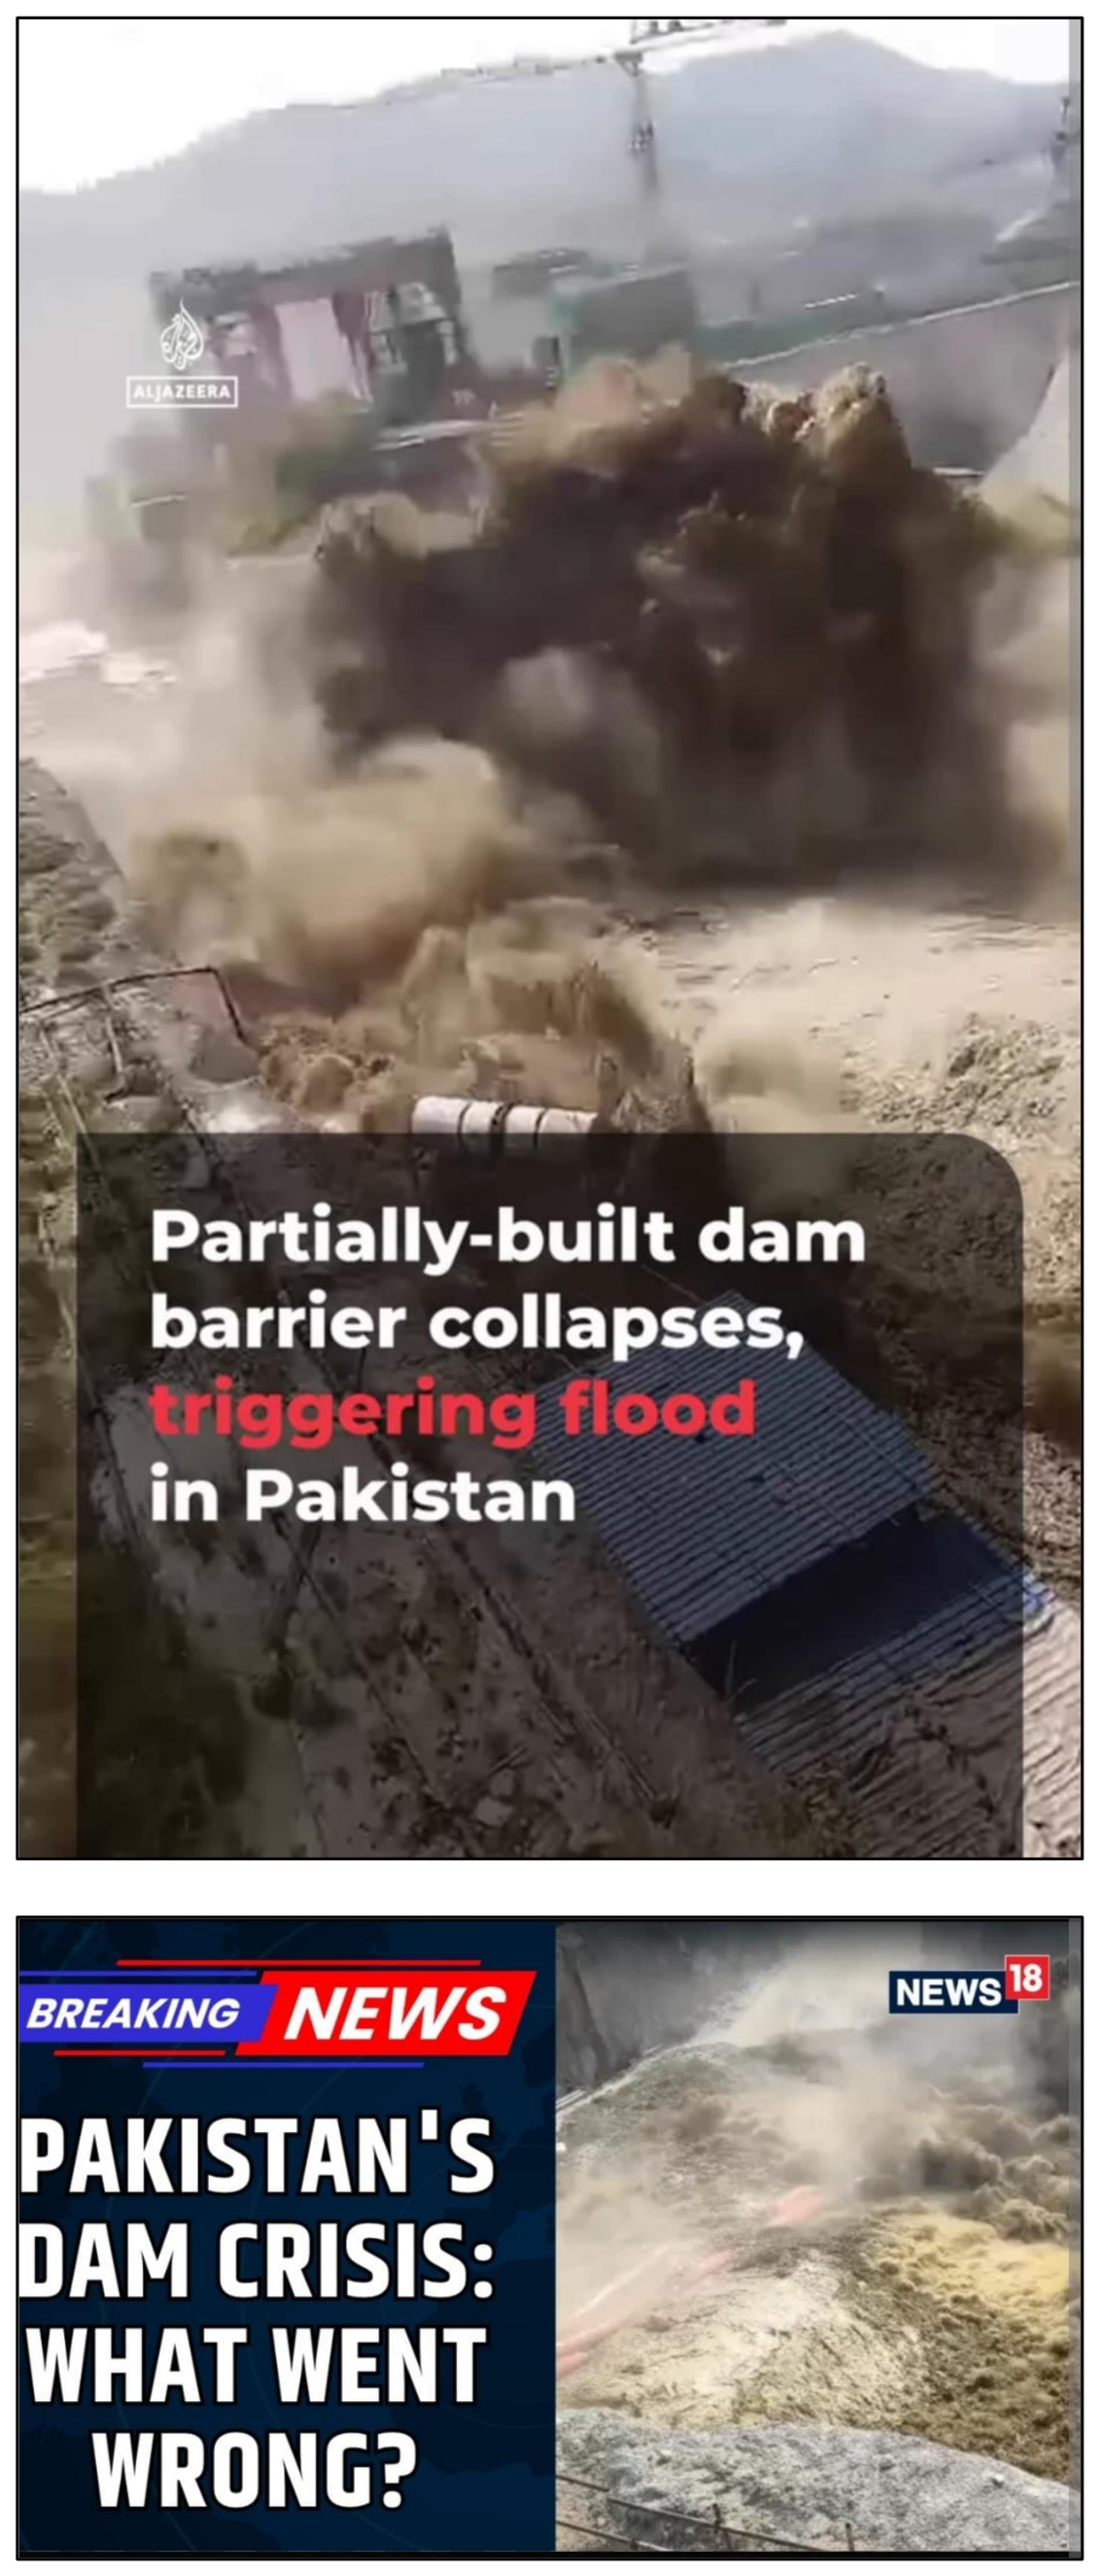
On 9 November 2026 water was reported to have entered the construction works of the Tarbela 5th Extension Hydropower Project (T-5). The project-authority statement says that a weak part of the rock fell while workers were excavating the second bench of the connecting tunnel, allowing water from the intake pit to enter the tunnel and powerhouse area [1]. Failure of the protective bund is reported in lieu of the Deputy Commissioner's statement, and one report indicates that the girder fell, causing part of the bund to break [2,3]. There were also differences in accounts regarding the workers' safety, with Business Recorder stating that one worker was swept away but rescued [4] while Radio Pakistan's WAPDA statement stated that all workers were evacuated safely [1].
This report is a technical case report based on a source driven review. Its goals are: (i) to identify the location of the incident; (ii) to construct conceptual schematic diagrams of each of the reported mechanisms and clearly state what must be true for each mechanism; (iii) to compare each of the accounts in terms of common criteria, and clearly state what can and cannot be judged from the public record; and (iv) to test this comparison against three published case histories. Public reports are considered reported information, any suggested mechanisms are referred to as hypotheses, and there is no allegation of negligence or contractual liability.
The report is organized as follows: The project setting and hydraulic arrangement is described in Section 2. Section 3 documents the event, and the state of the evidence. In Section 4 the three hypotheses are developed and in Section 5 the technical judgement is advanced as to what evidence is available now. The previous cofferdam inquiry is summarized in Section 6 as project history. Section 7 discusses the Teton and Oroville and Vajont cases, while Section 8 takes the lessons learned from these cases to T-5. Consequences, recommended investigation, questions for the inquiry and conclusions are covered from 9-12.
2. Project Setting and Location
2.1. Geographical Location
Tarbela Dam is on the Indus River in Khyber Pakhtunkhwa, in the area of Haripur and Swabi districts [13]. It is approximately 55 km from Islamabad on a straight path (an estimate) and 110 km by road [13]. Figure 1 shows the dam and reservoir on the Indus within the national river system, with the Besham Qila stream gauge upstream.
Figure 2 locates the reported incident on the Tarbela site. The area of the incident lies on the right-hand side of the layout, between the two Tarbela spillways and close to the reservoir edge. This is the new intake and construction area; it is not the main earth-filled dam or the existing Tarbela power house. The exact failure point, site geometry and dimensions are not public.
2.2. T-5 Extension and Hydraulic Arrangement
The T-5 extension is reported to add 1,530 MW, raising the overall Tarbela capacity from 4,888 MW to 6,418 MW [8]. Funding comprises US$390 million from the World Bank and US$300 million from the Asian Infrastructure Investment Bank (AIIB) [8]. The powerhouse is configured for three 510 MW units [14].
Described in Figure 3, Water flows from the reservoir through a new water intake structure, and then through Tunnel 5, an existing irrigation tunnel 3,675 ft long which is being converted for hydropower generation [14]. It then flows through a new penstock, a steep and powerful pipe-like tunnel [15], to the powerhouse turbines and the used water re-enters the Indus River via the tailrace. The intake and connecting tunnel are under construction with parts of this chain being open excavations, which must be kept separate from the reservoir water until the permanent structure is finished.
2.3. Construction Terms Used in This Report
There are four terms that are repeated throughout. Bund or cofferdam is termed as, A temporary wall that is built to temporarily retain water to allow work to be carried out in a dry environment. The new intake is excavated in the intake pit. A benching is a step in a tunnel that is being excavated, typically the upper part first, followed by the lower part of the tunnel. The connecting tunnel connects the intake area to the powerhouse work area. These definitions lead to the central engineering question of this review: At each point between reservoir, pit and tunnel, which was supposed to contain the water??
3. Incident Overview and Evidence Status
A common core is available in the public record. Water flowed into the T-5 construction works from the intake-pit side, emergency action was taken, workers were removed and construction was halted. The information reported is summarised below in Table 1.
- Project authority: WAPDA stated that a weak part of the rock fell during second-bench excavation of the connecting tunnel, and that the main tunnel, powerhouse structure, tailrace culvert and switchyard were not damaged [1].
- Public safety: Advice was issued to avoid bathing, swimming and boating in the Indus and to follow official notices [5].
Table 1 separates the reported information from the status of each claim. These statements should be reconciled using the signed incident log, muster roll, medical records, rescue register, CCTV, excavation diary and official inquiry findings.
4. Hypotheses on the Failure Mechanism
4.1. Overview of the Water-Entry Problem
There are three theories about it. They are not findings, but hypotheses. The project-authority account is Hypothesis A in which the water flowed from the intake pit through weak rock into the tunnel. Hypothesis B is the account of the Deputy Commissioner, in which the bund failed first, possibly due to a girder failure. Coupled mechanism in which rock movement would cause damage to the bund, or ground movement and a change of the ground and water path would cause damage to the bund (hypothesis C).
Figure 4 shows the two possible entry paths on one simplified section. Reservoir water, on the left, acts on the temporary barrier at the intake pit. The pit, which is the work area, may hold water. Between the pit and the connecting tunnel (which had its lower step, the bench, being dug) lies a mass of rock, with a tunnel running towards the powerhouse under construction. Path A is the flow of water from the pit, through the rock to the tunnel. Path B is water from the reservoir coming through or around the barrier into the pit. Hypothesis A is only for Path A, Hypothesis B is for Path B and then followed by Path A. Hypothesis C is for the two to interact.
4.2. Hypothesis A: Rock-Mass Pathway (WAPDA Account)
Figure 5 interprets the project-authority account in two stages. In the pre-failure condition (Figure 5A), the intake pit, a work area excavated beside the raised intake, already holds water, and the natural rock mass between the pit and the connecting tunnel is intact while the second bench is being excavated. The figure marks the source of the pit water as not established in the WAPDA statement. In the reported failure (Figure 5B), a localised weak rock mass at the second-bench excavation collapses, the pit water drains into the connecting tunnel through the collapse zone, and it reaches the powerhouse work area. The event sequence is therefore: (1) water already present in the pit; (2) weak rock collapses at the second bench; (3) pit water flows into the connecting tunnel, and (4) water reaches the powerhouse work area [1].
This account is internally consistent as a description of the final flow path and consistent with what the owner states as the end result, the main tunnel and powerhouse structure were not damaged. It also raises a question: If the ground between the pit and the tunnel had to be treated as a hydraulic separation, then the investigation should be used to determine why the pit containing water was allowed adjacent to a downwardly advancing lower bench. Testing the hypothesis involves making a map of the exposed face, and determining lithology, weathering, joint orientation, persistence, joint infill, permeability, groundwater pressure, the support sequence, excavation method, and confirming whether the design and ground report took into account the water-retaining function of that rock.
4.3. Hypothesis B: Temporary-Barrier Pathway
Figure 6 interprets the alternative account. The permanent raised intake structure remains intact, but the temporary protective embankment (cofferdam) between the reservoir and the pit, which is a construction-stage structure, is reported to have been breached after a girder fell. Reservoir water enters the intake pit through the breach; the pit water then moves into the connecting tunnel through a construction opening whose exact geometry is unverified; and the downstream powerhouse work area is affected, with inundation reported. The event sequence is (1) the failure of the temporary embankment following the girder fall; (2) inflow of reservoir water into the work area; (3) inflow of pit water into the connecting tunnel at the second-bench excavation; (4) the downstream work area is flooded [2,3]. The number is also given in the owner's claim that the major Tunnel 5 is not damaged [1].
This account explains directly why the pit contained water, which Hypothesis A takes as a pre-existing condition. It must be based on the approved design, as-built geometry, type of material, preparation of the foundation, seepage and drainage plans, freeboard, water-level history, temporary loading, construction quality records and inspection sheets. The involvement of the girders should be confirmed from time stamped photographs, CCTV and site documentation prior to it being considered as a trigger. The account must also include how pit water ended up in the tunnel as there is no report describing the connection.
4.4. Hypothesis C: Coupled Pathway
It is not an either/or situation: the rock explanation and barrier explanation do not mutually exclude each other. There are distinct coupled sequences. A sequence with a rock first causes damage or destabilisation to the barrier. In a barrier first sequence, deformation of the barrier or seepage will load the surrounding terrain and cause a change in groundwater pressure, which will further weaken the rock. A coupled mechanism is still a viable possibility. The chronology should answer the question of whether the movement, cracking, seepage, or loss of water-level control occurred in one or more of the components.
5. Technical Assessment and Judgement
5.1. Assessment Framework
Four engineering rules frame the assessment. First, a ground condition should be treated as a contractual surprise only where an experienced contractor could not reasonably have foreseen it at tender stage; FIDIC Sub-Clause 4.12 and the ground reports are the reference [12]. Second, known weak ground must be designed for rather than dismissed as an excuse: the Teton and Oroville investigations are examples in which ground conditions were known but not adequately addressed [9,10]. Third, temporary bunds and cofferdams are structures and require design for water pressure, foundation conditions and imposed loads; design changes need checking. Fourth, excavation beside a water-retaining boundary should not depend on a single barrier; sensors, warning thresholds and stop-work authority are needed.
5.2. Comparison of the Hypotheses
Table 2 compares the hypotheses against the same criteria. The comparison tests which account is better supported by documentary evidence; it does not select a winner, because the public record does not allow it. Hypothesis C is an analytical framing rather than a reported account.
5.3. What Can and Cannot Be Concluded
From Table 2, the following three points are derived. First, the two reports are not in conflict regarding the water path; both report water in the intake pit and then in the connecting tunnel. They differ over which was lost first, and that depends on the cause of the loss of the pit water, which the WAPDA statement does not indicate, and the bund account provides. Second, the evidence available indicates that water flowed from the intake pit into the works and the system was designed to prevent such water flow [1,2]. It doesn't imply that someone was negligent, that the rock theory is incorrect, or that only the engineers are liable. Third, previous failures have included decisions by owners, contractors, consultants and regulators [6,10].
So, a fair technical question is what was supposed to hold the water back, and, did it provide for the conditions on the ground, as they existed? . Table 3 lists observations that would allow the hypotheses to be discriminated once primary records are available. The entries are illustrative of the logic of the investigation and are not findings.
6. Project-History Context: The August 2025 Cofferdam Inquiry
An earlier downstream-cofferdam collapse at the same project was followed by an inquiry. In July 2023 the owner requested a cofferdam performance report from the consultant; in October 2024 the contractor submitted its monitoring report, more than a year later; in August 2025 the downstream cofferdam collapsed; and in July 2026 an inquiry reportedly assigned findings to the contractor, consultant and owner [6,7,8,9].
According to the reported findings, the committee found that the contractor changed the approved cofferdam design to a weaker rock-fill type, contrary to the contract; the engineer accepted it with conditions and the owner approved it late [6,7]. River flows were within Tarbela’s historical records and below the design limit, so flooding was not identified as the cause [6]. Project cost is reported to have increased from Rs82 billion to about Rs316 billion, with the completion date moved from 2026 to June 2028 [6].
Important distinction: The two events must be separated. The collapse of the cofferdam in 2025 was at an entirely different structure. That past event provides a good example of what to do when working on a temporary construction project, but it does not provide proof of the causes of the intake pit problem on November 9, 2026. No details should be accepted as facts until the official investigation report has been read, approved and final building plans have been examined and any approved design changes have been reviewed..
7. Comparative Case Studies
Three published case histories are used to make engineering comparisons. The types of structures and failures are different, as are the mechanisms of failure: seepage-driven internal erosion at Teton, failure of the spillway slab and failure of the foundation at Oroville, and the wave generated by a landslide at Vajont. They're important because of lessons learned regarding the ground conditions, design, checking and oversight, not because T-5 were the same physical processes. A snapshot and sequence are provided for each case in an overview figure, while a detail figure shows a mechanism discussed in the case.
7.1. Case Study 1: Teton Dam, Idaho, 1976
Overview: The zoned earthfill dam, Teton, was approximately 93 m high and 914 m long, and held approximately 283 million m³ (229,000 acre-ft) of water on the Teton River (Figure 7). This was during its first filling and it failed on 5 June 1976. Abnormally high seepage reported at approximately 11:00 continued to grow and the water became turbid about 12:00; a breach was forming rapidly between approximately 13:00 and 14:00, and the reservoir was released when the dam failed. It resulted in extensive flooding in the Teton and Snake River valleys, approximately 11 deaths (up to 14 reported) and damage valued around $400 million USD [9]. The event resulted in the development of design modifications to dams, foundation treatments, seepage control and monitoring.
Mechanism. The independent panel attributed the failure to internal erosion (piping) of the fine silt core in the deep right foundation key trench (Figure 8). With a reservoir head of about 78 m, seepage developed through highly jointed, pervious rock and talus in the right abutment, where the grout curtain left joints inadequately sealed. The flow eroded core material at the key trench, eroded particles travelled along enlarging channels at the dam–rock interface towards the downstream right groin, and rapid enlargement of the piping path led to breach [9]. Flow was observed at the downstream right groin before the breach. The mechanism is not a foundation collapse and not an overtopping failure: it is a seepage path through ground that was known to be fractured, meeting a water-retaining element that was erodible.
Event sequence: (1) reservoir head drives seepage into inadequately sealed rock beneath and around the grout cap; (2) seepage reaches the key trench and erodes the fine silt core; (3) eroded particles travel along channels at the dam–rock interface; (4) rapid enlargement of the piping path leads to breach. Simplified mechanism based on the independent panel findings; not to scale [9].
Lesson for T-5. The transferable lesson is to investigate the complete seepage path and the interfaces between the ground and the water-retaining structures. Teton shows that a failure can begin invisibly inside the ground–structure interface and appear only as a sudden visible event, which is consistent with a coupled rock-and-barrier reading at T-5. It does not establish that piping occurred at Tarbela.
7.2. Case Study 2: Oroville Spillway, California, 2017
Overview. Oroville is an earthfill dam about 235 m high with a gated concrete main spillway and an ungated emergency spillway weir (Figure 9). On 7 February 2017 damage to the main spillway chute (slab uplift and erosion) was discovered during releases of about 100,000 cfs. The spillway was taken out of service while the reservoir kept rising, and on 11–12 February the emergency spillway (crest about 901 ft) overtopped and rapidly eroded the hillside below it. About 188,000 people were evacuated [10].
Mechanism. Figure 10 shows the two sequential events. In the main spillway (Figure 10a), water entered through cracks and joints in the concrete slab; pressure developed beneath the slab and pushed it upward; the initial failure, a slab uplift and erosion zone about 180 m downstream of the gates, exposed weak foundation rock to erosion. In the emergency spillway (Figure 10b), with the reservoir at about elevation 901 ft, water overtopped the ungated weir and rapidly eroded the weathered hillside, cutting a large gully and an eroded channel towards the Feather River that posed a risk to the stability of the dam and led to mass evacuations. Poor ground had been reported in the geological reports, but not necessarily provided in the design and construction and later reviews have been incorrectly labeled good ground. The forensic team identified numerous minor failures over the years by the owner, by regulators and by industry [10].
Lesson: Transferable lesson T-5 is an assessment of the barrier and the foundation, including the drainage, water pressure, construction aspects and historical site inspections. A second failure appears on the Oroville record after the first with the same message: having a single line of defence is not enough as was stated in the T-5 concern. The case does not directly represent a tunnel water-ingress situation.
7.3. Case Study 3: Vajont, Italy, 1963
Overview. Vajont was a concrete double-curvature arch dam about 261–265 m high in the Vajont Valley, north-eastern Italy (Figure 11). On 9 October 1963 about 270 million m³ of rock from Mount Toc slid into the reservoir along a pre-existing failure surface, generating a displacement wave that travelled both upstream and downstream, overtopped the dam and devastated Longarone and nearby settlements in the Piave Valley. The dam itself remained substantially intact. The death toll is estimated at about 1,900 to 2,500 depending on source [11].
Mechanism. Mechanism: The slope had been moving prior to the disaster (Figure 12). A large and existing landslide mass on Mt Toc was unstable and was influenced by long-term creep, fluctuations in water level and rainfall. The impact of the mass entering the reservoir created a large wave in the water. The water, air and debris that accompanied the overtopping surge, reached far into the town of Longarone and the surrounding communities, causing great destruction. The displacement and overtopping of reservoirs were not caused by a structural failure of the dam itself but rather by landslides. It was estimated that Vajont was an “avoidable disaster” by the United Nations in 2008 [11]. The key principle is to be aware of warning signs and monitoring, but only if decisions and actions follow.
Lesson for T-5: Review of pre-event deformation, seepage and monitoring records at T-5. The dam remained intact while the surrounding ground failed, indicating that the structure and the ground must be considered as a system. It does not necessarily represent the tunnel water-ingress event as has been reported.
8. Applying the Case Lessons to T-5
Table 4 summarises what each case contributes and where its limits lie. The cases do not favour either reported account by themselves, but they do favour the coupled reading as a serious possibility: at Teton the ground and the water-retaining element failed together at their interface; at Oroville a failed primary system loaded a second system; and at Vajont the ground failed against an intact structure. In each, the investigation panel abstained from a one-causes-one-effect analysis.
The three investigations also found that the technical aspects of the incidents were distinct from accountability, and that accountability was divided among the owners, designers, contractors, regulators and decision makers [9,10,11]. The separation should be applied to T-5: no finding of responsibility is made in this review; any finding of responsibility should be postponed till the inquiry record and the contract documents.
9. What Is at Stake
Reported impacts are not included here with possible consequences. Emergency was declared and workers evacuated; one worker was said to be swept away and rescued [2,4]. Public-safety advice was issued to avoid bathing, swimming and boating in the Indus and to follow official notices [5]. Work was reported stopped without a new schedule, while the project completion date had already moved to June 2028 [6].
Possible Outcomes: It is reported that a Planning Commission warning that power would cost Rs27–28 per unit was issued, and if the delay continues, additional expenses will be incurred [6]. The question of whether the ground constitutes a 'surprise' could have implications for any additional time and money, subject to the contract and evidence [12].These are potential consequences, not confirmed liabilities.
10. Recommended Response and Investigation Plan
There are six actions that are consistent with a source-led investigation:
- Store and share evidence: Document and keep copies of all documents including bund drawings, approved documents, as-built documents, excavation log, sensor data, photographs, CCTV, incident log and all design change approvals.
- re-check the ground before restarting: map the weak rock near the intake pit and tunnel, check the borehole and core logs and compare the actual situation with the contractual ground report [12].
- Check temporary walls: review the design, foundation, seepage-control, material property and changes after the 2025 findings, and independently check the wall [6].
- Install and check sensors and warning limits: establish measurable warning limits and provide well-defined authority for site engineers to halt excavation when warnings are triggered.
- Determine responsibility: differentiate between technical cause and contractual allocation and individual responsibility [12].
The technical investigation should be used to reconstruct the event chronologically based on reservoir and intake-pit water levels, seepage observations, survey records, sequence of excavation, installation of supports and equipment movements and witness testimony. Work should only resume following an independent review to ensure a safe hydraulic separation arrangement, appropriate temporary works and an updated ground model and excavation sequence have been developed.
11. Questions for the Inquiry
Q1. Was the rock between the intake pit and the tunnel counted on to hold the water back, and was it designed for that function?
Q2. What did the sensors show in the days before the incident, and were warning limits established?
Q3. Who reviewed the design work, geotechnical profiles of the rock mass, temporary structure ?
Q4. If the ground is later described as a contractual ‘surprise’, what did the contract’s ground report say?
12. Conclusions
The material confirms the entry of water into the T-5 construction works on the intake-pit side on 9 November 2026 and an emergency response to this. The cause of the incident was elusive: While administration told weak-rock collapse during the excavation of second bench, the accounts to the local bodies in Haripur told the failure of the protective-bund, one of which mentioned a girder falling. The differences need to be resolved using primary sources and an independent investigation.
All three mechanisms proposed (rock mass failure, barrier/bund failure and coupled sequence) should be kept open until the evidence has been evaluated. The comparison reveals that the two mechanism concur on the route for the water (from intake pit into the tunnel). Previous cases such as Teton, Oroville and Vajont, are more inclined towards an integrated assessment of ground, barrier, monitoring and decisions to prove the failure at T-5 cause. The downstream-cofferdam inquiry for 2025 is not necessarily applicable to project governance but refers to a different cofferdam and event. In this report no liability or individual responsibility is found.
Appendix: News Highlights
References
- Water and Power Development Authority (WAPDA). “All Workers Safely Evacuated After Water Inflow Incident at Tarbela Project,” Radio Pakistan, p. Pages 1 (of unspecified total), Nov. 09, 2026. Available online: https://www.radio.gov.pk/09-11-2026/all-workers-safely-evacuated-after-water-inflow-incident-at-tarbela-project (accessed on 11 November 2026).
- Hayat, Y. Tarbela T 5 Project Work Suspended Indefinitely After Protective Bund Breach. The Express Tribune. Available online: https://tribune.com.pk/story/2639423/tarbela-t-5-project-work-suspended-indefinitely-after-protective-bund-breach (accessed on 11 November 2026).
- Rehman, S. ur. Water Enters Tarbela Powerhouse After Rockfall, All Workers Safely Evacuated. Geo News. Available online: https://www.geo.tv/latest/690388-water-enters-tarbela-power-house-after-rockfall-all-workers-safely-evacuated (accessed on 11 November 2026).
- B. Web Desk, “Rock Collapse at Tarbela T5 Sends Water Into Tunnel, Work Stopped,” Brecorder. Available online: https://www.brecorder.com/news/40448122 (accessed on 11 November 2026).
- Khan, M. “Water Surges Into Nearby Work Areas After Rock Mass Collapse at Tarbela Dam,” Dawn. Available online: https://www.dawn.com/news/2043275 (accessed on 11 November 2026).
- Kiani, K. “Stakeholders Blamed for Tarbela-5 Cofferdam Collapse,” Dawn. Available online: https://www.dawn.com/news/2014942 (accessed on 11 November 2026).
- Monitoring Report, “Tarbela-5 Cost Surges to Rs317 Billion After Cofferdam Collapse Delays Project by Two Years,” Profit by Pakistan Today. Available online: https://profit.pakistantoday.com.pk/2026/07/13/tarbela-5-cost-surges-to-rs317-billion-after-cofferdam-collapse-delays-project-by-two-years (accessed on 11 November 2026).
- NNPS Desk, Tarbela 5Th Extension 56% Complete; Generation to Commence in April 2027. Associated Press of Pakistan. Available online: https://www.app.com.pk/national/tarbela-5th-extension-56-complete-generation-to-commence-in-april-2027/ (accessed on 11 November 2026).
- U.S. DEPARTMENT OF THE INTERIOR AND STATE OF IDAHO, “FAILURE OF TETON DAM, BY INDEPENDENT PANEL TO REVIEW CAUSE OF TETON DAM FAILURE,” Bureau of reclamation (.gov). Available online: https://www.usbr.gov/pn/snakeriver/dams/uppersnake/teton/1976failure.pdf.
- France, J.W.; Alvi, I.A.; Dickson, P.A.; Falvey, H.T.; Rigbey, S.J.; Trojanowski, J. “INDEPENDENT FORENSIC TEAM REPORT OROVILLE DAM SPILLWAY INCIDENT,” 2018. Available online: https://cawaterlibrary.net/wp-content/uploads/2018/03/Independent-Forensic-Team-Report-Final-01-05-18.pdf (accessed on 11 November 2026).
- Paolo, P.; Bolla, A. The Prehistoric Vajont Rockslide: An Updated Geological Model. Geomorphology 2012, 169–170, 165–191. [Google Scholar] [CrossRef]
- Fédération Internationale Des Ingénieurs-Conseils (FIDIC). “Conditions of Contract for Construction, Second edition,” Scribd. Available online: https://www.scribd.com/document/665835828/fidic-construction-contract-2nd-ed-2017 (accessed on 11 November 2026).
- MINISTRY OF WATER RESOURCES, “Tarbela 5th Extension Hp (1,410 Mw),” Mowr.gov.pk. Available online: https://www.mowr.gov.pk/Detail/Y2VkZWQ3Y2ItNTBiNy00ZWEyLWJmMGQtNjI1YTk3ZjVlYjI5 (accessed on 11 November 2026).
- Asian Infrastructure Investment Bank, “Pakistan: Tarbela 5 Hydropower Extension,” 000005, 2016. Available online: https://www.aiib.org/en/projects/details/2016/approved/Pakistan-Tarbela-5-Hydropower-Extension.html.
- Darling, Brian B. “Innovative Solutions for the Development of the 1410MW 5Th Hydropower Extension Project at Tarbela Dam, Pakistan.” Aug. 31, 2017. Available online: https://darlinghydro.co.uk/assets/files/HYDRO-2017-Tarbela5thExtension-PaperbyBBDarlingver0gfinal.pdf (accessed on 11 November 2026).
- Rafique, A.; Burian, S.; Hassan, D.; Bano, R. Analysis of Operational Changes of Tarbela Reservoir to Improve the Water Supply, Hydropower Generation, and Flood Control Objectives. Sustainability 2020, 12, 7822. [Google Scholar] [CrossRef]
- huhindustry. A recent bund collapse at Tarbela Dam caused water to enter the under-construction Tunnel 5, leading to the evacuation of workers and suspension of construction activities. Instagram. Available online: https://www.instagram.com/p/DfhWWGsNM0s/.
Figure 1.
Location of Tarbela Dam and Reservoir on the Indus River within the Pakistan river system (stream gauge at Besham Qila shown upstream) [16].
Figure 1.
Location of Tarbela Dam and Reservoir on the Indus River within the Pakistan river system (stream gauge at Besham Qila shown upstream) [16].
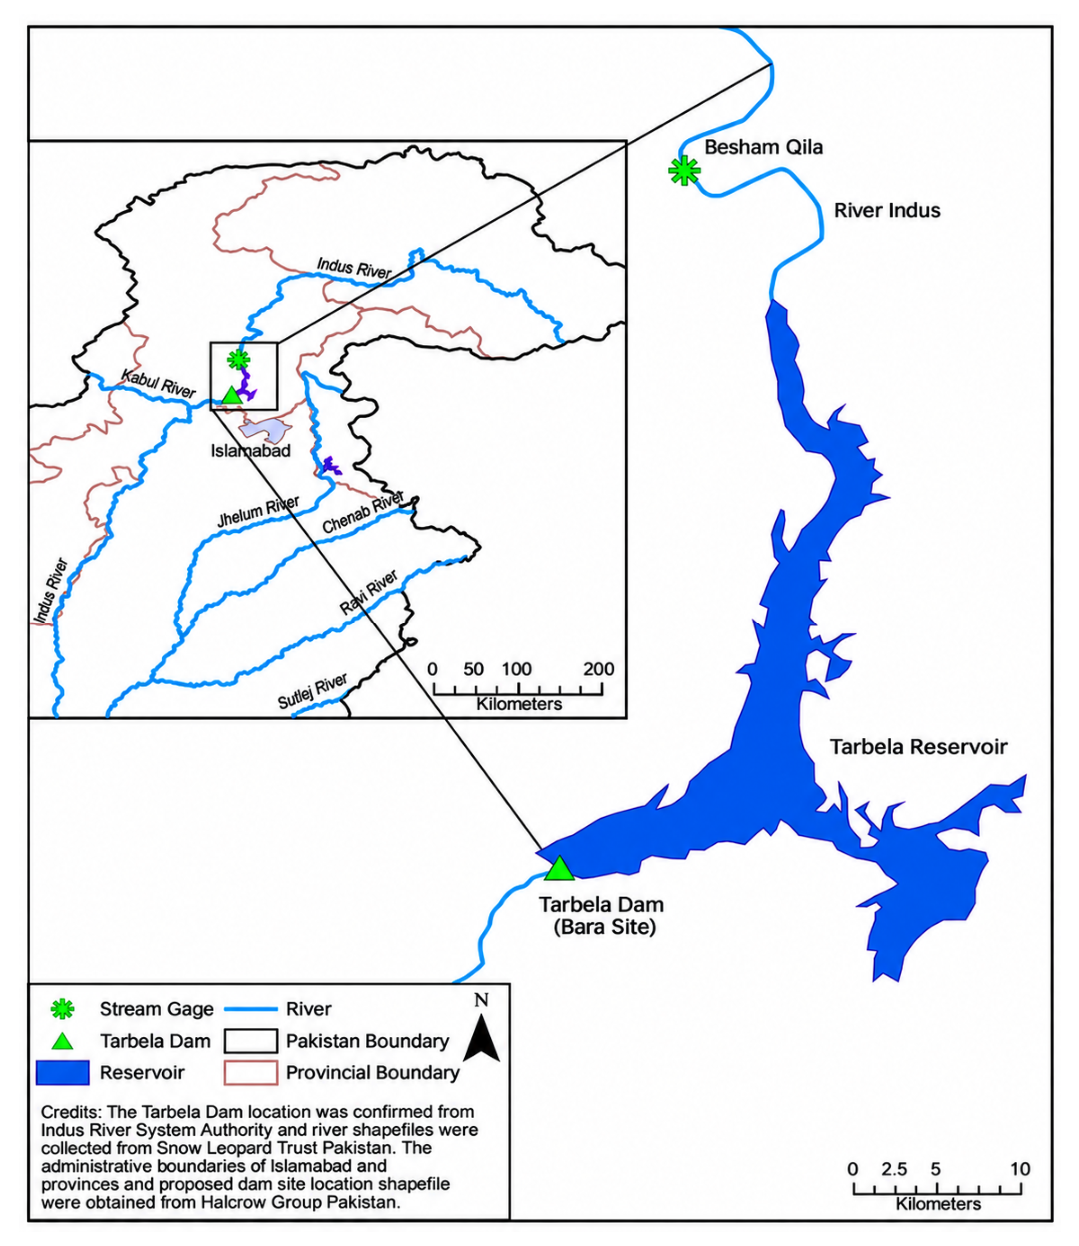
Figure 2.
Site map showing the reported area of the 9 November 2026 incident relative to the main earth-filled dam, spillways, reservoir and existing powerhouse. Annotated satellite view [17].
Figure 2.
Site map showing the reported area of the 9 November 2026 incident relative to the main earth-filled dam, spillways, reservoir and existing powerhouse. Annotated satellite view [17].
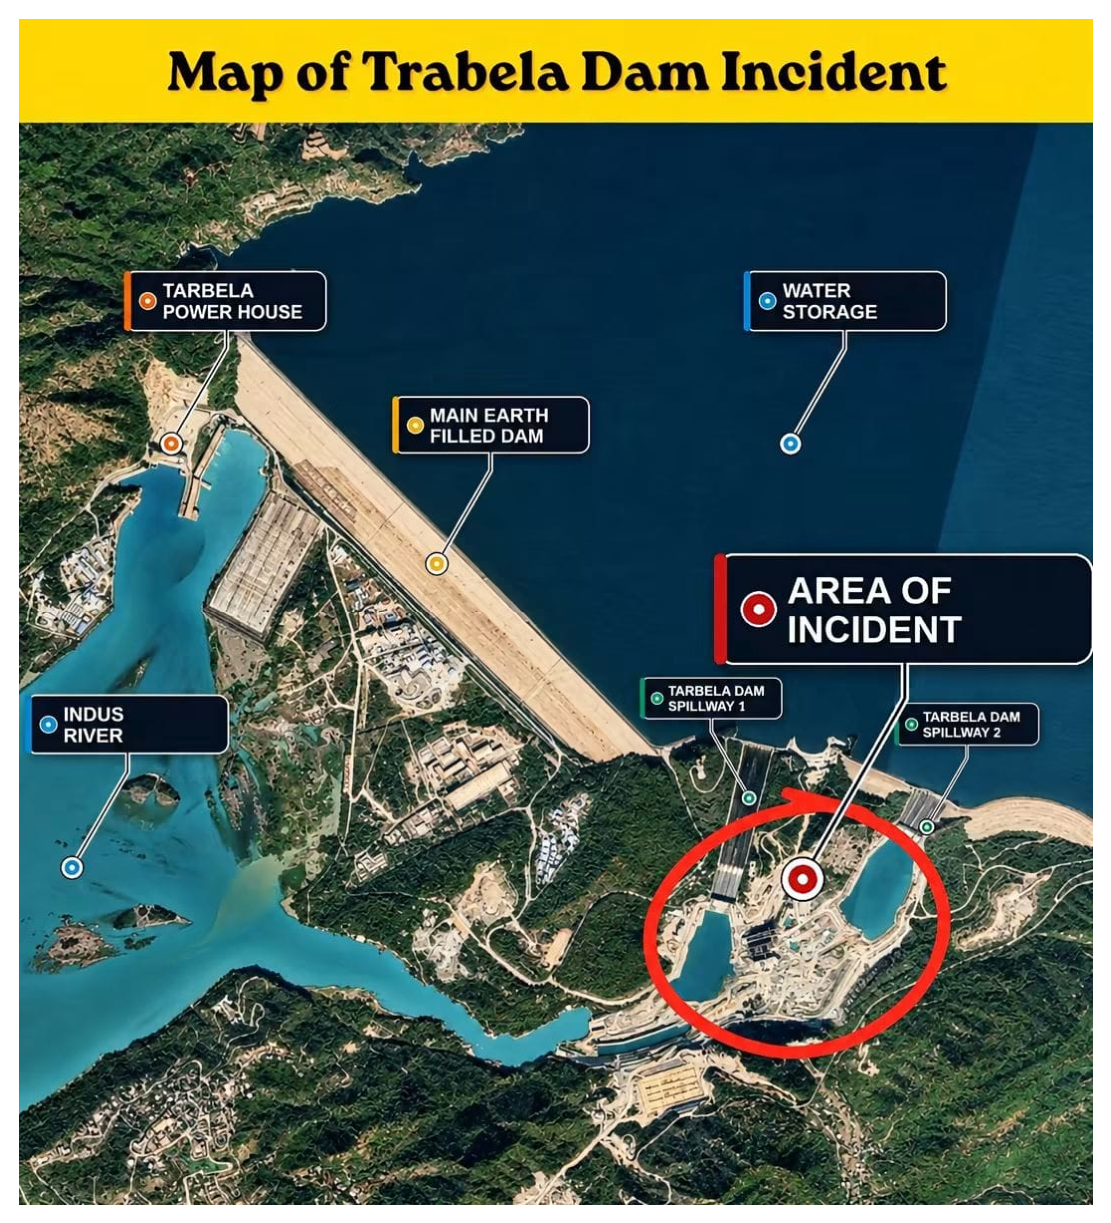
Figure 3.
T-5 water-to-power flow chart: (1) reservoir, (2) new raised water intake, (3) old irrigation tunnel (Tunnel 5) being adapted to transport water for power generation, (4) new penstock, (5) powerhouse (3 × 510 MW), and (6) tailrace returning water to the Indus River. Not a construction drawing, but a simplified scheme [14,15].
Figure 3.
T-5 water-to-power flow chart: (1) reservoir, (2) new raised water intake, (3) old irrigation tunnel (Tunnel 5) being adapted to transport water for power generation, (4) new penstock, (5) powerhouse (3 × 510 MW), and (6) tailrace returning water to the Indus River. Not a construction drawing, but a simplified scheme [14,15].
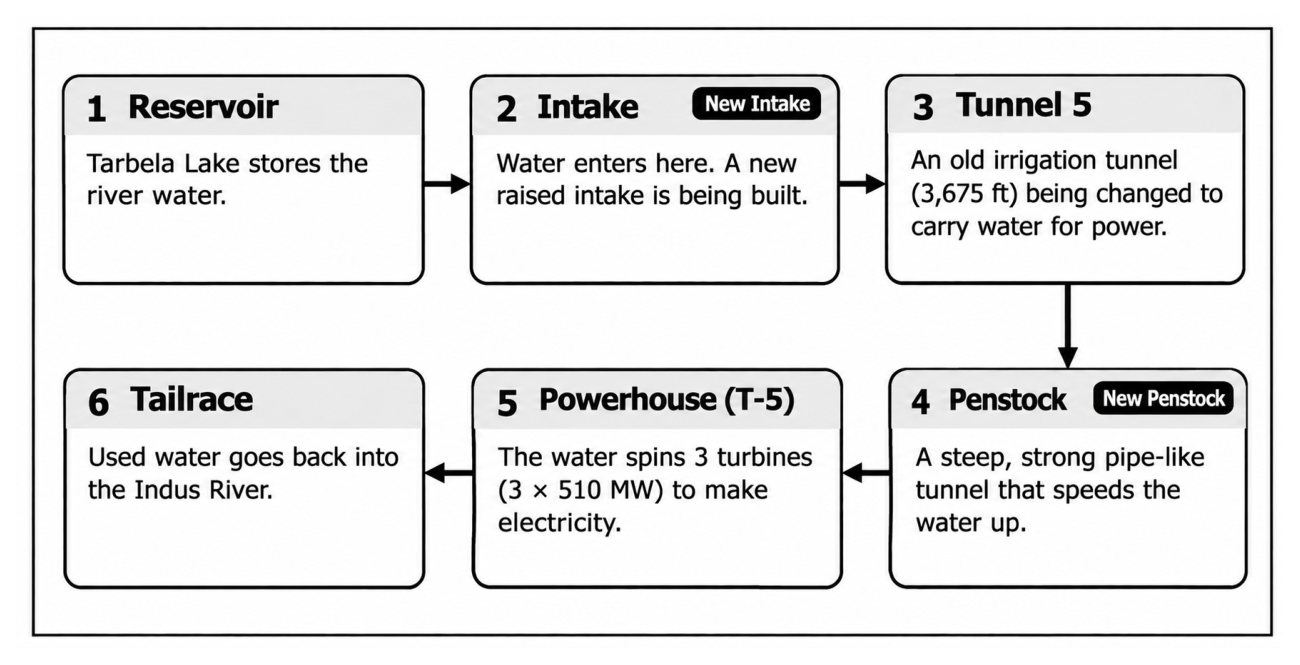
Figure 4.
Overview of the water-entry problem at the T-5 intake pit. Path A: pit water to the connecting tunnel through the rock between them. Path B: Barrier that is under the influence of reservoir water at the intake pit. Side view is simplified and actual shape and dimensions are not public.
Figure 4.
Overview of the water-entry problem at the T-5 intake pit. Path A: pit water to the connecting tunnel through the rock between them. Path B: Barrier that is under the influence of reservoir water at the intake pit. Side view is simplified and actual shape and dimensions are not public.
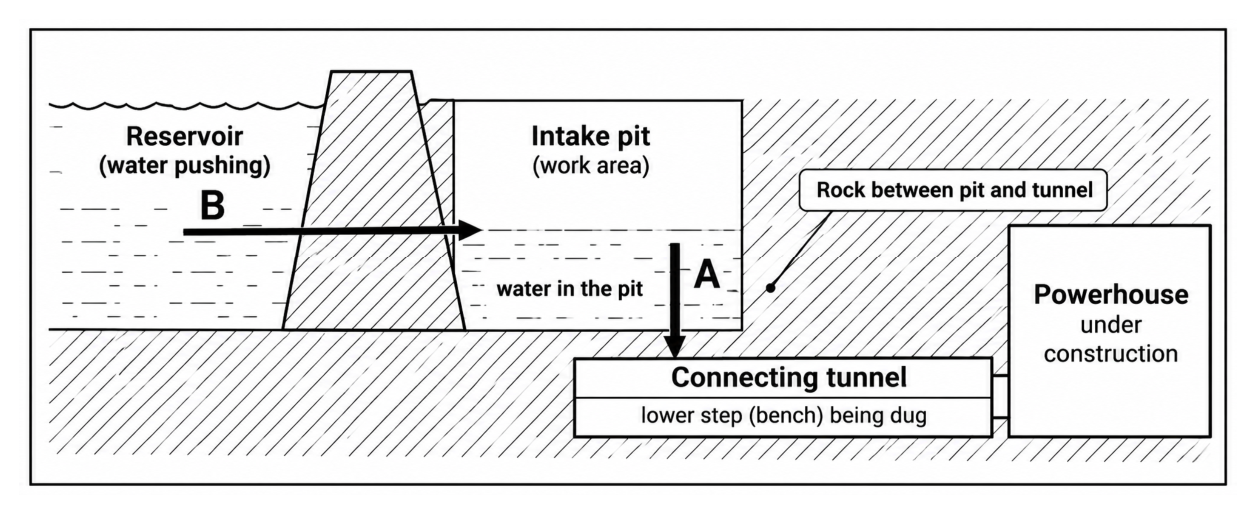
Figure 5.
(B) Localised weak rock-mass collapse at the second-bench excavation opens the pit-to-tunnel path, and pit water drains into the connecting tunnel towards the powerhouse under construction [1].
Figure 5.
(B) Localised weak rock-mass collapse at the second-bench excavation opens the pit-to-tunnel path, and pit water drains into the connecting tunnel towards the powerhouse under construction [1].
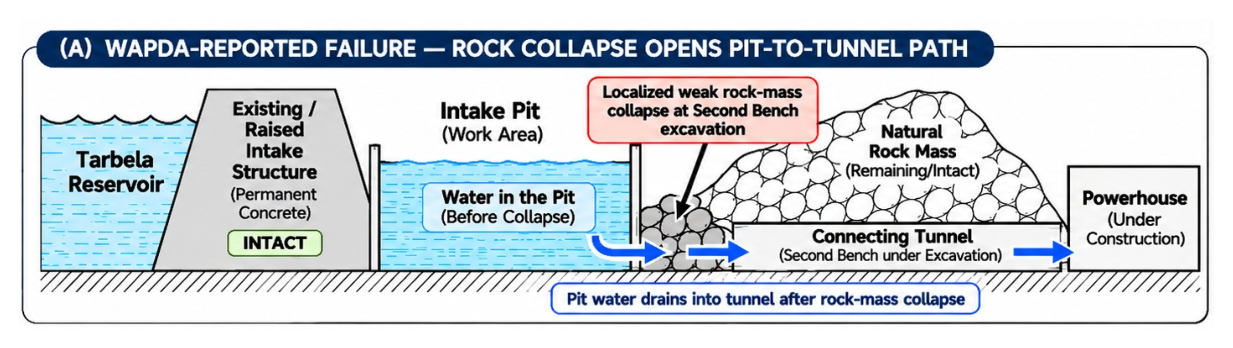
Figure 6.
Hypothesis B: breach of the temporary protective embankment (cofferdam) (conceptual interpretation of the local-administration account). Reservoir water enters the pit after the reported breach, then moves through a construction opening to the connecting tunnel and the powerhouse work area [2,3].
Figure 6.
Hypothesis B: breach of the temporary protective embankment (cofferdam) (conceptual interpretation of the local-administration account). Reservoir water enters the pit after the reported breach, then moves through a construction opening to the connecting tunnel and the powerhouse work area [2,3].
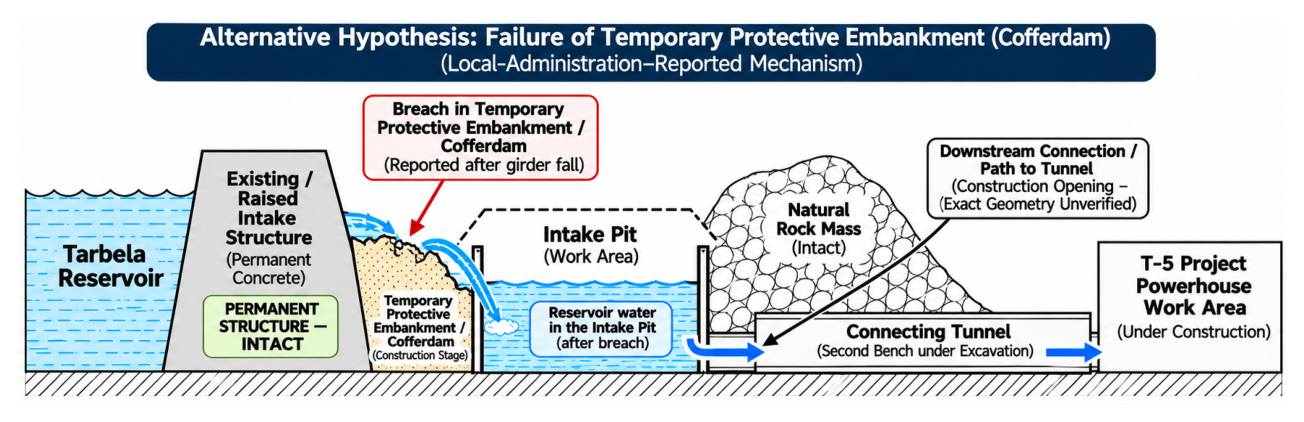
Figure 7.
Case Study 1 overview: Teton Dam (1976) project snapshot, schematic failure sequence from normal condition (1) through onset of piping (2) and breach development (3) to final breach and outflow (4), with timeline and key outcomes [9].
Figure 7.
Case Study 1 overview: Teton Dam (1976) project snapshot, schematic failure sequence from normal condition (1) through onset of piping (2) and breach development (3) to final breach and outflow (4), with timeline and key outcomes [9].
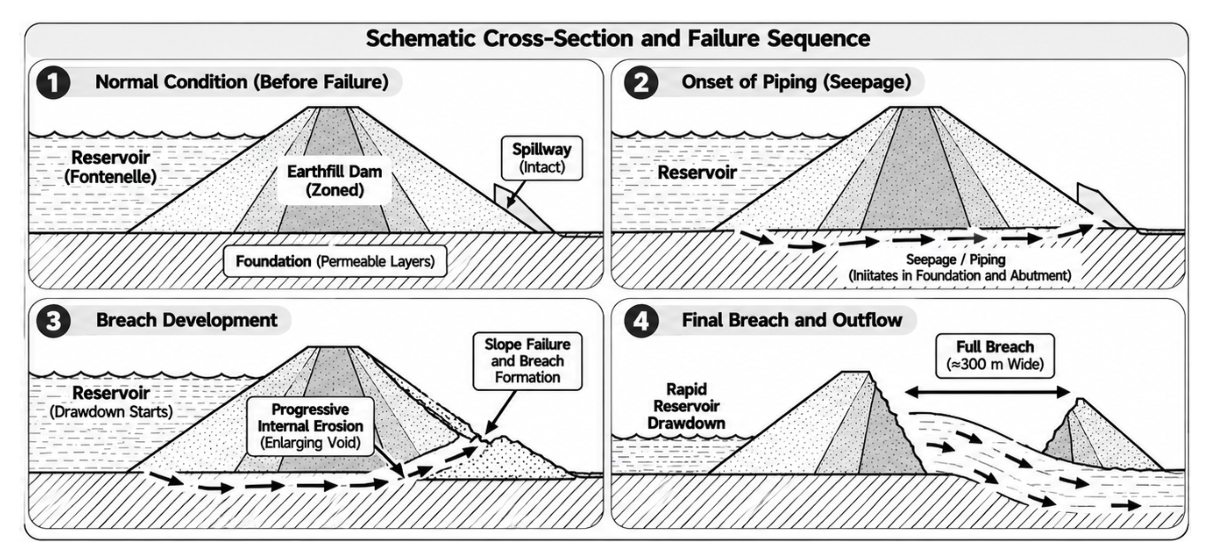
Figure 8.
Case Study 1 detail: Teton Dam, internal erosion of the core fill at the right foundation key trench, with seepage exiting along the right abutment interface.
Figure 8.
Case Study 1 detail: Teton Dam, internal erosion of the core fill at the right foundation key trench, with seepage exiting along the right abutment interface.
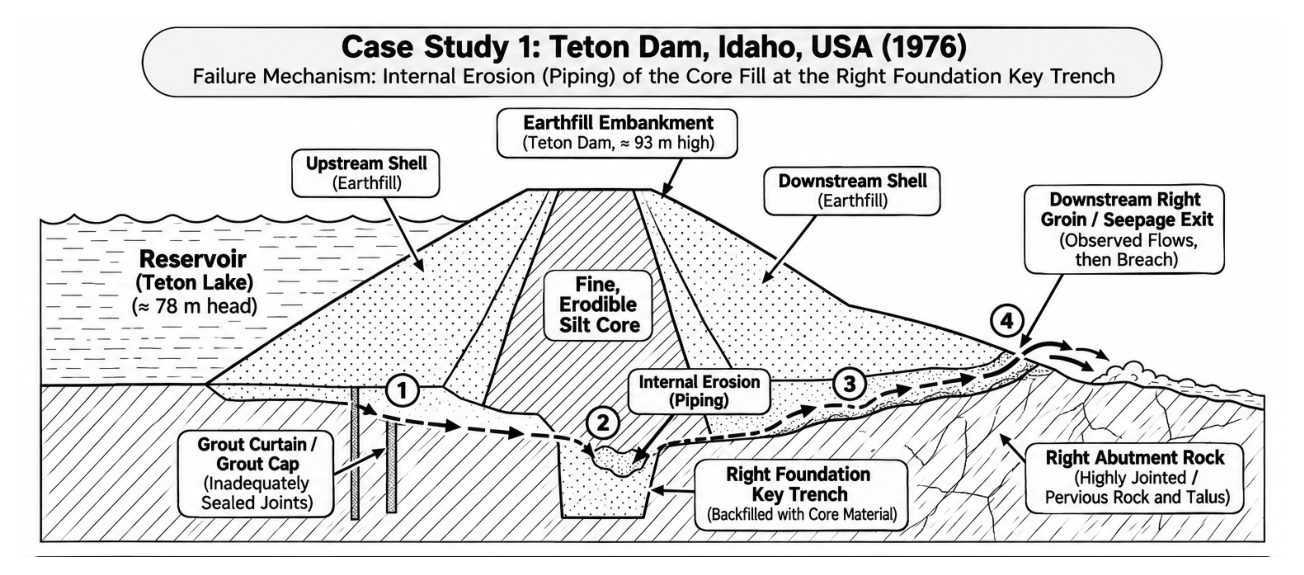
Figure 9.
Case Study 2 overview: Oroville Dam project layout and key components (reservoir, gated spillway control structure, main spillway chute [10].
Figure 9.
Case Study 2 overview: Oroville Dam project layout and key components (reservoir, gated spillway control structure, main spillway chute [10].
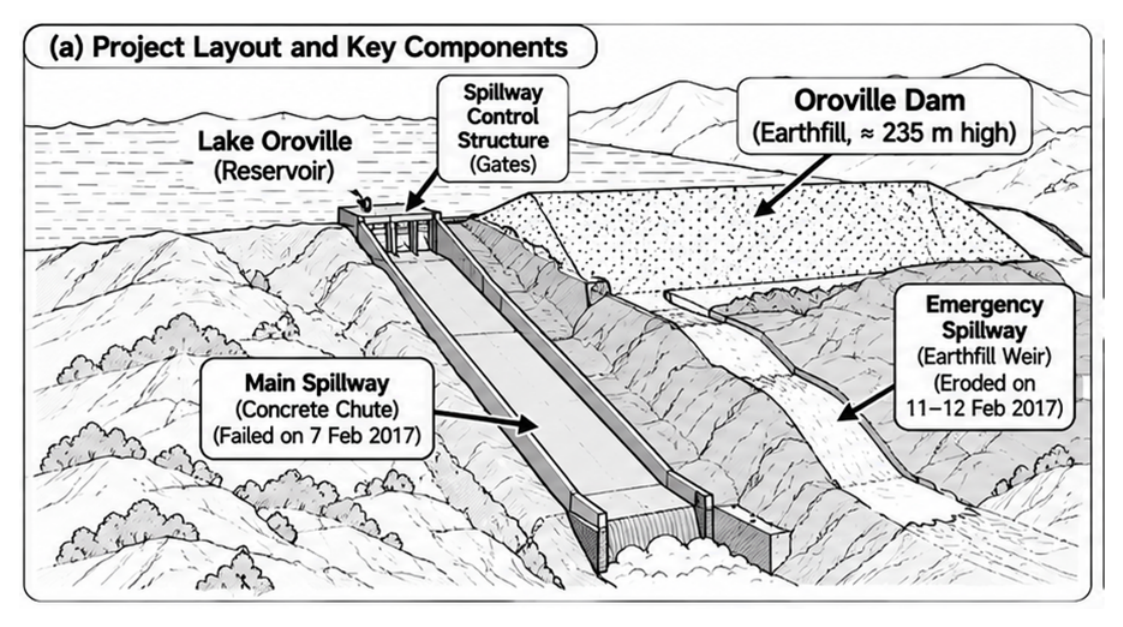
Figure 10.
Case Study 2 detail: Oroville failure mechanism, (a) main spillway incident of 7 Feb 2017 and (b) emergency spillway incident of 11–12 Feb 2017, with event sequence: (1) damage discovered during high releases (about 100,000 cfs); (2) spillway taken out of service while inflows continued; (3) overtopping of emergency spillway; (4) rapid erosion [10].
Figure 10.
Case Study 2 detail: Oroville failure mechanism, (a) main spillway incident of 7 Feb 2017 and (b) emergency spillway incident of 11–12 Feb 2017, with event sequence: (1) damage discovered during high releases (about 100,000 cfs); (2) spillway taken out of service while inflows continued; (3) overtopping of emergency spillway; (4) rapid erosion [10].
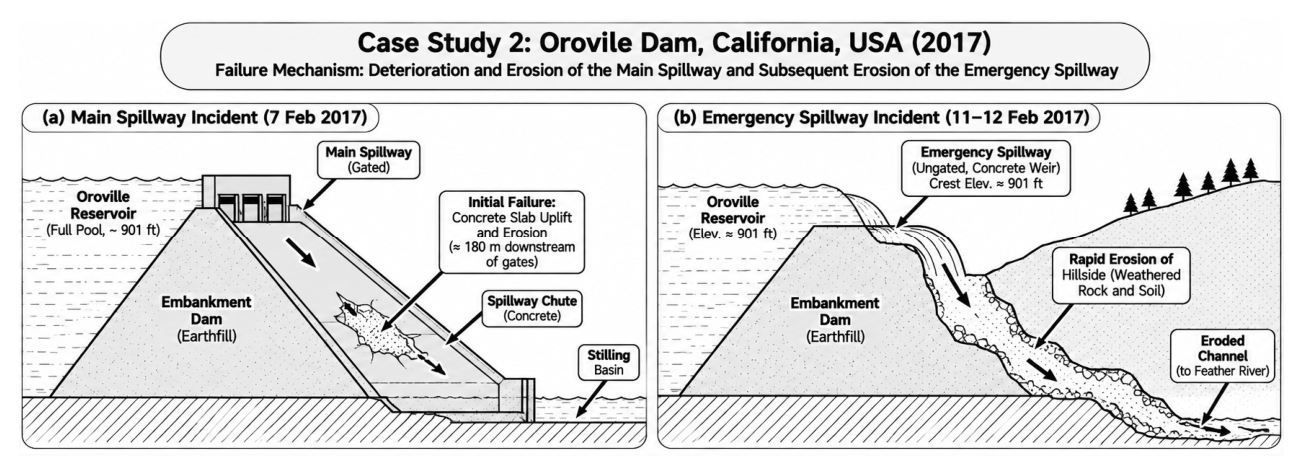
Figure 11.
Case Study 3 overview: Vajont Dam disaster (9 October 1963), project snapshot and cross-section of the landslide: Mount Toc, the pre-existing failure surface, the unstable rock mass (about 270 million m³), the displacement wave and overtopping of the arc dam [11].
Figure 11.
Case Study 3 overview: Vajont Dam disaster (9 October 1963), project snapshot and cross-section of the landslide: Mount Toc, the pre-existing failure surface, the unstable rock mass (about 270 million m³), the displacement wave and overtopping of the arc dam [11].
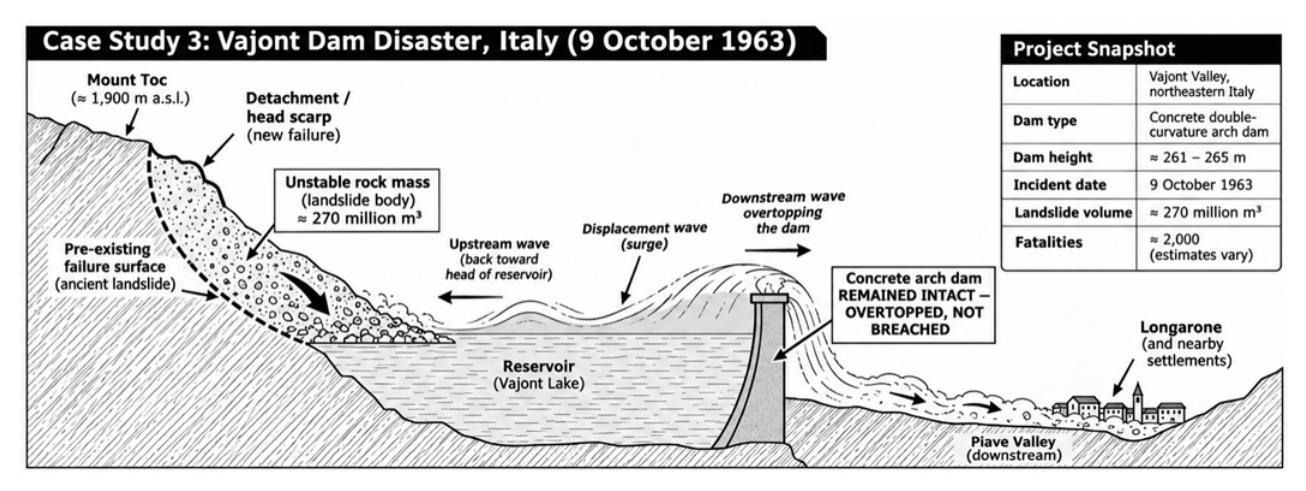
Figure 12.
Case Study 3 detail: Vajont event sequence, from (1) a pre-existing unstable slope, through (2) landslide entry into the reservoir on 9 October 1963 and (3) reservoir displacement and overtopping, to (4) downstream flooding and damage [11].
Figure 12.
Case Study 3 detail: Vajont event sequence, from (1) a pre-existing unstable slope, through (2) landslide entry into the reservoir on 9 October 1963 and (3) reservoir displacement and overtopping, to (4) downstream flooding and damage [11].
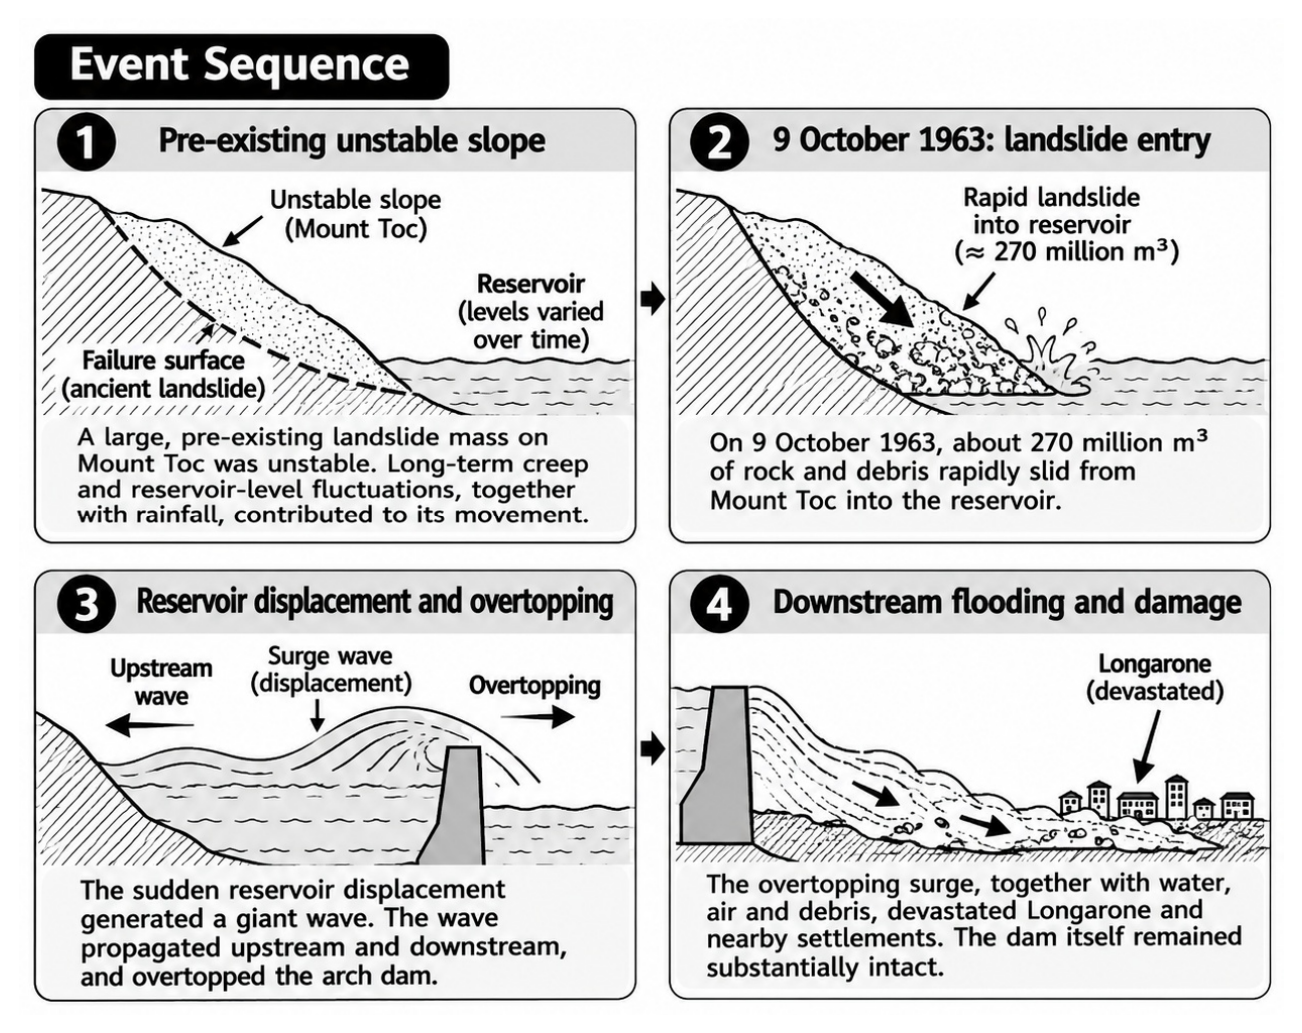

Table 1.
REPORTED ACCOUNTS AND EVIDENCE STATUS.
| Item | Reported account | Evidence status |
|---|---|---|
| Initiation | Weak rock collapsed during second-bench excavation [1]. | WAPDA / project-authority account |
| Alternative initiation | Protective bund failed; one report mentions a girder falling [2,3]. | Deputy Commissioner/Media/Local Administratives |
| Water path | Water entered connecting tunnel and powerhouse area from intake-pit side [1,2]. | Common reported outcome |
| People | All workers evacuated [1]; one worker reportedly swept away and rescued [4]. | Conflicting public reports |
| Asset damage | Main tunnel, powerhouse, tailrace culvert and switchyard reportedly not damaged [1]. | Owner statement; inspection records required |
Table 2.
COMPARISON OF THE HYPOTHESES AGAINST COMMON CRITERIA.
| Criterion | A: rock-mass collapse (WAPDA) [1] | B: bund failure (Local bodies) [2,3] | C: coupled sequence (analytical) |
|---|---|---|---|
| What failed first | Weak rock at the second-bench excavation. | Temporary protective bund, possibly after a girder fell. | Undetermined; rock-first, barrier-first or common trigger. |
| Source of pit water | Not specified in the statements, but water was present already | Reservoir water through the breach. | Reservoir water, with the route altered by ground or barrier movement. |
| Water path | Pit to tunnel through collapsed rock (Path A). | Reservoir to pit via breach, then pit to tunnel (Path B then A). | Paths A and B acting together or in sequence. |
| Explains well | The final pit-to-tunnel flow and the undamaged main tunnel. | Why water was in the pit at all. | Why a sudden event may follow hidden deterioration, and why both public accounts can be partly true. |
| Remains open | Why a water-filled pit was adjacent to the advancing bench. | Girder involvement, bund design and as-built condition. | Order of events and the interaction mechanism. |
| Evidence to test | Face mapping, core logs, groundwater and support records. | Bund drawings, material and inspection records, CCTV, water-level history. | Time-synchronised sensor, survey, level and CCTV chronology. |
Table 3.
OBSERVATIONS THAT WOULD DISCRIMINATE BETWEEN THE HYPOTHESES.
| Observation to establish | Would point towards | Primary record |
|---|---|---|
| Pit water level before the collapse or breach | A high, stable level with no breach record favours A; a level rising at the time of a breach favours B or C. | Level gauges, CCTV, dewatering and survey logs |
| First recorded movement | Movement, spalling or seepage at the bench favours A or rock-first C; movement at the bund favours B or barrier-first C. | Deformation monitoring, excavation diary, piezometers |
| Timing of the girder fall | A fall before the inflow supports a barrier-first sequence; a fall after the inflow suggests a consequence. | Time-stamped photographs, CCTV, crane and equipment logs |
| Inflow geometry in the tunnel | Inflow concentrated at the collapsed zone favours A; inflow at a construction opening or other connection favours B. | Post-event survey, as-built drawings, inspection records |
| Origin of pit water | Reservoir-connected water indicates a barrier or seepage path; other sources would weaken B. | Water-level history, seepage observations, drainage records |
Table 4.
TRANSFERABLE LESSONS FROM THE THREE CASE STUDIES.
| Case | Failure mode | Transferable lesson | Check at T-5 (limit of comparison) |
|---|---|---|---|
| Teton (1976) [9] | Internal erosion of the silt core along jointed abutment rock and the dam–rock interface. | Investigate the complete seepage path and the ground–structure interfaces. | Inspect the bund–rock and pit–rock interfaces and seepage records. Piping at Tarbela is not established. |
| Oroville (2017) [10] | Slab uplift and erosion of weak foundation, then overtopping and erosion of the emergency spillway. | Evaluate barrier and foundation as one; don't expect one line of defence to protect the other; deal with inherent weak ground. | Compare drainage, water pressure and ground reports with the design; confirm a second barrier. Not a tunnel analogue. |
| Vajont (1963) [11] | Landslide into the reservoir along a pre-existing surface; arch dam overtopped but intact. | Pre-event warning signs and monitoring matter only if action follows; judge ground and structure as one system. | Review deformation, seepage and monitoring records before 9 November. Not a direct analogue. |
Disclaimer/Publisher’s Note: The statements, opinions and data contained in all publications are solely those of the individual author(s) and contributor(s) and not of MDPI and/or the editor(s). MDPI and/or the editor(s) disclaim responsibility for any injury to people or property resulting from any ideas, methods, instructions or products referred to in the content. |
© 2026 by the authors. Licensee MDPI, Basel, Switzerland. This article is an open access article distributed under the terms and conditions of the Creative Commons Attribution (CC BY) license (http://creativecommons.org/licenses/by/4.0/).
Copyright: This open access article is published under a Creative Commons CC BY 4.0 license, which permit the free download, distribution, and reuse, provided that the author and preprint are cited in any reuse.