
Submitted:
11 November 2026
Posted:
12 November 2026
You are already at the latest version
Abstract
Urban transportation systems in automobile-dependent cities face increasing challenges associated with traffic congestion, environmental sustainability, and limited infrastructure for active mobility. This study examines public preferences for bicycle-friendly infrastructure, perceived road safety, climatic barriers, and willingness to adopt cycling as an alternative transportation mode in Muscat, Oman. A quantitative, cross-sectional field survey involving 400 adult respondents was conducted, supported by field observations of existing cycling conditions. Descriptive statistics, pairwise ordinal logistic regression, and mixed-effects ordinal logistic regression were employed to examine infrastructure preferences and account for respondent-level heterogeneity. The findings reveal substantial dependence on private vehicles, with 71.8% of respondents identifying cars as their primary transportation mode, compared with only 1.5% using bicycles. The mixed-effects model identifies protected bicycle lanes as the most preferred intervention (OR = 30.70), followed by safe low-traffic routes (OR = 18.94) and shaded bicycle routes (OR = 13.73), relative to bicycle–public transport integration. Perceived heat barriers were associated with lower cycling willingness, with positive intentions declining from approximately 70% among respondents reporting moderate barriers to 54% among those reporting very high barriers. Infrastructure preferences remained relatively consistent across age groups, indicating broad support for protected cycling facilities. The findings highlight the importance of prioritizing dedicated cycling infrastructure, improving roadway safety, and incorporating climate-responsive design into urban transportation planning. The study provides empirical evidence to inform infrastructure investment priorities and support sustainable mobility development in automobile-dependent urban environments.
Keywords:
bicycle-friendly infrastructure
; sustainable urban mobility
; cycling preferences
; road safety
; climatic barriers
; ordinal logistic regression
; active transportation
1. Introduction
Urban transportation systems have historically been developed with greater emphasis on motorized mobility, often at the expense of walking and cycling infrastructure. This approach has contributed to automobile dependence, traffic congestion, environmental pollution, and limited opportunities for active transportation. Koglin and Rye [1] argue that the marginalisation of cycling is deeply embedded in conventional transportation planning practices, where infrastructure investment and spatial allocation predominantly favour motorized vehicles. Although cycling is increasingly recognized as an environmentally sustainable and economically accessible mode of transportation, its adoption remains influenced by urban design, infrastructure availability, and individual travel preferences [2]. Fraser and Lock [3] further demonstrate that the built environment plays an important role in encouraging cycling, particularly through the provision of accessible and connected transportation networks.
The availability of bicycle-friendly infrastructure is considered an important factor influencing individuals’ willingness to adopt cycling for everyday travel. Basu and Vasudevan [4], in their study of urban India, found that dedicated bicycle lanes were among the most preferred infrastructure interventions for encouraging bicycle use. Similar findings have been reported by Caulfield et al. [5], who highlighted the importance of separation from motorized traffic in shaping cycling preferences. Road safety remains another important consideration, as evidence suggests that infrastructure characteristics, route conditions, and intersection design can significantly influence cyclists’ exposure to traffic-related risks [6,7]. These findings indicate that promoting cycling requires not only infrastructure development but also an understanding of how potential users perceive different cycling facilities.
In countries characterized by high automobile dependence and extreme climatic conditions, the development of cycling infrastructure presents additional challenges. Research conducted in Qatar identifies climatic discomfort, traffic safety concerns, and inadequate cycling facilities as important barriers to bicycle adoption [8]. Weather conditions, particularly high temperatures, can influence cycling participation, although their effects vary across geographical settings and travel purposes [9]. Furthermore, individual attitudes, perceived safety, and route characteristics influence people’s willingness to cycle [10]. These issues are particularly relevant to Oman, where high summer temperatures, automobile-oriented urban development, and limited dedicated cycling infrastructure may discourage the adoption of bicycles for routine transportation.
The present study examines public preferences for bicycle-friendly infrastructure and the factors influencing cycling adoption among adults in Muscat, Oman. Using field surveys, the research investigates existing transportation patterns, preferences for different cycling infrastructure and policy interventions, perceived road safety, climatic barriers, and differences across socio-demographic groups. Ordinal logistic regression is employed to examine the relative importance of infrastructure-related factors, while descriptive and comparative analyses explore cycling willingness and transportation preferences. The study also incorporates field observations to illustrate existing roadway conditions and infrastructural limitations. By examining the relationships between infrastructure preferences, environmental constraints, and individual perceptions, this research aims to provide empirical evidence for identifying cycling interventions and informing sustainable urban transportation planning.
2. Literature Review
2.1. Automobile-Oriented Urban Planning and the Marginalisation of Cycling
The dominance of motorized transportation in urban planning has contributed to the gradual marginalisation of cycling as an alternative mode of travel. Conventional transportation policies have largely prioritized roadway capacity, vehicle movement, and travel-time efficiency, often overlooking the accessibility and safety requirements of cyclists and pedestrians. Piatkowski and Bopp [11] emphasize that increasing bicycle use requires coordinated interventions addressing infrastructure, individual behaviour, and transportation policies. Similarly, Bland et al. [12] highlight the importance of reconsidering traditional transportation investment priorities to support active mobility.
Urban form and infrastructure connectivity are important determinants of cycling accessibility. Hagen and Rynning [13] identify network continuity, route directness, and the quality of the surrounding environment as important elements of bicycle-friendly urban development. Ferster et al. [14] demonstrate the value of consistent infrastructure classifications for identifying spatial inequalities in cycling networks. Studies examining infrastructure distribution further indicate that accessibility varies considerably between neighbourhoods and socio-economic groups [15,16]. Cunha et al. [17] argue that cycling investments frequently concentrate in central urban areas, potentially overlooking peripheral communities. Furthermore, major road infrastructure can create physical barriers that reduce local accessibility for active transportation users [18]. The contrasting approaches to urban transportation planning, particularly the separation of motorized traffic from cycling and pedestrian movement, are illustrated in Figure 1.
Data-driven network planning, equitable infrastructure allocation and local governance also shape where cycling improvements are delivered [19,20,21]. Research on cycling cultures and political support indicates that adoption depends on social practices as well as road design [22,23,24]. Streets additionally support everyday social uses beyond traffic movement [25].
2.2. Bicycle-Friendly Infrastructure, Perceived Safety, and Cycling Preferences
The provision of dedicated cycling infrastructure is widely recognized as an important intervention for encouraging bicycle use. Rérat and Schmassmann [26], using observations and intercept surveys, reported increased cycling activity and improved perceptions of safety following the installation of a bicycle lane. However, Williams et al. [27] demonstrate that infrastructure expansion does not necessarily produce immediate increases in cycling participation, suggesting that broader network conditions and contextual factors also influence outcomes.
A systematic review by Mölenberg et al. [28] identifies methodological differences that complicate the evaluation of infrastructure interventions, while Durão et al. [29] emphasize the limitations of existing evidence concerning population-level physical activity outcomes. Consequently, evaluations should distinguish between infrastructure availability, perceived safety, and actual behavioural changes.
Infrastructure quality also extends beyond the presence of designated lanes. Deng et al. [30] demonstrate the importance of examining cycling networks at both street-segment and neighbourhood scales. Similarly, Cai et al. [31] highlight the potential of network design approaches that consider route connectivity and travel-time equity. Discontinuities in cycling facilities, particularly where cyclists must re-enter mixed traffic, may reduce the effectiveness of otherwise well-developed networks [32].
Route-choice surveys and comparative urban-design research highlight the effects of streetscape design and perceived comfort [33,34]. Measures of neighbourhood bikeability, enriched geospatial datasets and video-based conflict analysis offer complementary ways to assess safety and accessibility [35,36,37].
Road safety remains central to infrastructure preferences. Costa et al. [38] identify variations in cycling accident relationships across different built environments, while Chen et al. [39] demonstrate that infrastructure design, separation from traffic, and intersection configurations are important considerations for cyclist safety. Importantly, perceptions of safety and physical comfort may differ between individuals, even when evaluating the same infrastructure [40]. These findings support examining different cycling interventions separately rather than treating bicycle infrastructure as a single uniform improvement. Longitudinal and natural-experiment research provides an important counterpoint to stated-preference evidence when evaluating whether infrastructure changes translate into use [41].
2.3. Environmental, Climatic, and Socio-Demographic Barriers
Cycling behaviour is influenced by environmental conditions, individual characteristics, and perceptions of convenience. Research examining older adults indicates that social, psychological, and physical environmental factors contribute to changes in active transportation participation [42]. Similarly, studies of cycling motivation suggest that people differ in their willingness to adopt cycling depending on perceived barriers, attitudes, and existing transportation practices [43].
Climatic conditions introduce additional constraints, particularly in cities experiencing prolonged periods of high temperatures. Writzl et al. [44] demonstrate that thermal comfort varies considerably across cycling routes depending on urban morphology and microclimatic conditions. Cao et al. [45] further highlight the importance of shade provision along bicycle infrastructure for reducing heat exposure. These findings indicate that the suitability of cycling routes cannot be evaluated through distance and connectivity alone.
Urban heat adaptation research supports combining microclimate measures with locally relevant indicators [46]. Research on Omani settlement morphology and green infrastructure further points to the value of shading, enclosure and environmental quality for the experience of urban space [47,48].
Environmental characteristics also interact with personal motivations. Pedersen et al. [49] identify accessibility and infrastructure quality as recurring influences on participation in physical activity, whereas Logan et al. [50] emphasize the combined importance of safety, weather, convenience, and individual confidence. Fischer et al. [51] additionally demonstrate the spatial variation in cycling-related risks, highlighting the importance of local roadway conditions. Research from Gulf Cooperation Council countries identifies extreme heat, automobile-oriented urban development, and socio-cultural factors as important considerations for active mobility [52]. Together, these studies suggest that climate-sensitive planning should be integrated with infrastructure improvements and behavioural interventions. Cycling uptake also reflects identities, social expectations and unequal access to mobility options, as demonstrated by qualitative research on travel practices [53].
2.4. Cycling Adoption, Modal Shift, and Research Gaps
Promoting cycling requires understanding how individuals evaluate alternatives to their existing transportation modes. Quintero-Gomez and Calvo-Bascones [54] demonstrate that cycling readiness involves multiple dimensions, including infrastructure, environmental conditions, services, and safety. Economic evaluations also suggest that infrastructure investment benefits depend partly on the extent to which improvements generate sustained changes in travel behaviour [55].
Research on bike-sharing and public-transit coordination shows that intermodal services depend on institutional arrangements and user characteristics [56,57,58]. Economic assessments similarly identify societal benefits when cycling replaces higher-cost car trips [59].
Existing research has established important relationships between cycling infrastructure and transportation preferences. However, evidence remains geographically concentrated, with relatively limited empirical investigation of adult cycling preferences in hot, automobile-dependent Gulf cities. Studies from other urban contexts may not adequately capture the interaction between climatic discomfort, infrastructure limitations, and established motorized travel habits. The present research addresses this gap by examining infrastructure preferences, safety perceptions, environmental barriers, and socio-demographic differences through field surveys. Particular attention is given to identifying which improvements may encourage greater bicycle use and how these preferences vary across population groups. Studies of commuting health and changes following new infrastructure distinguish stated intentions from observed travel and health outcomes [60,61,62].
3. Conceptual Framework
3.1. Cycling Infrastructure, Perceived Safety, and Behavioural Intentions
Cycling adoption is influenced by the interaction between infrastructure availability, perceived safety, and individual attitudes toward transportation. Passafaro et al. [63] demonstrate that attitudes, social norms, and emotional factors contribute to individuals’ willingness to use bicycles. Similarly, Lv et al. [64] identify perceived safety and accident risks as important determinants of cycling route preferences. However, preferences vary across population groups, with differences in the perceived effectiveness of cycling interventions [65]. Infrastructure quality also influences cycling satisfaction and travel frequency [66], while perceived safety does not always correspond with recorded accident risks [67]. Liu et al. [68] further demonstrate that street characteristics, including lane width, greenery, and intersection facilities, influence infrastructure preferences. Accordingly, this study examines whether protected bicycle lanes, safer intersections, low-traffic routes, and other infrastructure interventions are associated with greater willingness to cycle. Public perceptions of high-rise environments in Muscat also suggest that urban connectivity, environmental experience and cultural fit interact in the appraisal of development [69].
3.2. Environmental Barriers and Socio-Demographic Influences
Individual perceptions of cycling conditions may differ from objective infrastructure characteristics [70]. Behavioural research also indicates that attitudes, perceived control, and social expectations influence cycling intentions [71]. Furthermore, the integration of cycling with public transportation can improve accessibility and expand sustainable travel opportunities [72]. Socio-demographic characteristics, including age and employment, may influence intended cycling frequency [73]. Environmental barriers are equally important, as weather conditions and inadequate safe routes can discourage bicycle adoption [74]. Lee and Berkelhammer [75] further demonstrate that temperature influences bicycle-sharing demand. Building upon these relationships, the present study examines differences in infrastructure preferences and cycling willingness across adult age groups, perceived heat barriers, and existing travel modes. These relationships are investigated through descriptive analysis and ordinal logistic regression to identify the factors associated with cycling preferences and potential modal shifts. Research on technology-enabled municipal services highlights the relevance of perceived value and institutional trust when governments communicate and deliver new infrastructure [76].
4. Study Area and Methodology
4.1. Study Area
The study focuses on Muscat, Oman, with particular attention to the Al Baithaa neighbourhood in Bawshar. Muscat has experienced considerable urban expansion, characterized by dispersed residential development, extensive roadway infrastructure, and high dependence on private vehicles. Didero et al. [77,78] identify urban fragmentation and automobile dependence as important characteristics of the city’s transportation environment. Similarly, De Siqueira et al. [79] highlight differences between perceived and objectively measured neighbourhood characteristics influencing active mobility in Oman.
The study area includes residential streets, commercial activities, and community facilities connected through a predominantly vehicle-oriented road network. The neighbourhood boundary and an approximate two-kilometre axis are illustrated in Figure 2. Street connectivity, surrounding land uses, and the provision of greenery are important considerations when examining cycling environments [80,81]. These characteristics, together with the region’s climatic conditions, provide a relevant geographical context for investigating cycling preferences and infrastructure requirements.
4.2. Field Survey and Variable Selection
The research employs a quantitative, cross-sectional field survey to examine bicycle infrastructure preferences and transportation behaviour among adults in Muscat, Oman. Data were collected using a structured questionnaire designed to capture respondents’ existing travel patterns, perceptions of cycling infrastructure, environmental barriers, and willingness to adopt cycling as a mode of transportation. The analytical sample comprises 400 adult respondents aged 18 years and above. Survey-based approaches are useful for investigating stated transportation preferences and potential changes in travel behaviour [82,83].
The questionnaire examined seven infrastructure and policy interventions: protected bicycle lanes, shared bicycle routes, safe low-traffic routes, safer intersections, bicycle-sharing services, bicycle–transit integration, and workplace cycling incentives. Respondents were asked to indicate their preferences for each intervention using a five-point Likert scale, ranging from Definitely No to Definitely Yes. The survey also collected information on respondents’ primary modes of transportation, perceived heat-related barriers, and willingness to cycle under different environmental conditions. Perceived heat barriers were classified into five categories, ranging from very low to very high, allowing comparisons between climatic perceptions and cycling intentions.
Socio-demographic information included respondents’ age, categorized into five groups: 18–24, 25–34, 35–44, 45–54, and 55 years and above. These classifications were used to examine variations in cycling preferences across different age groups. Consistent survey-response measurement and data-quality assessment are important for reliable statistical interpretation [84,85].
4.3. Statistical Analysis
The analysis combines descriptive statistics, comparative evaluation, and ordinal logistic regression. Initially, frequency distributions and percentages were used to summarize existing transportation modes and responses to the seven infrastructure interventions. Relationships between perceived heat barriers and cycling willingness were subsequently examined, together with differences in infrastructure preferences across age groups.
Ordinal logistic regression provides a statistical framework for examining associations involving ordered categorical responses. This approach is particularly suitable for preference measurements where response categories have a meaningful ranking but cannot necessarily be treated as equally spaced observations [86]. Similar applications in transportation research demonstrate the usefulness of ordinal regression for examining relationships between infrastructure, psychological characteristics, and travel behaviour [87].
Regression results are presented as odds ratios with 95% confidence intervals, allowing the relative strength and precision of estimated associations to be examined. The findings are supported by graphical comparisons of infrastructure preferences and respondent characteristics. Distinguishing between perceived safety and observed transportation risks is important when interpreting the results, as these measures do not necessarily exhibit identical relationships with cycling behaviour [88].
4.4. Analytical Considerations
The analysis focuses on respondents’ reported preferences and intentions rather than assuming that stated willingness necessarily results in changes in travel behaviour. Previous research emphasizes that observed cycling patterns may differ from survey-based preferences [89]. Furthermore, objective thermal exposure varies with urban morphology, environmental conditions, and individual movement patterns [90,91]. Consequently, perceived heat barriers are interpreted as subjective assessments rather than direct measurements of thermal exposure.
The regression findings should be interpreted in relation to the coding of the ordinal outcomes, the model specifications, and the relevant statistical assumptions.
5. Results
5.1. Field Observations and Existing Cycling Conditions
Field observations in Al Baithaa neighbourhood illustrate the existing roadway conditions and limitations associated with cycling infrastructure (Figure 3A). Panel A shows a wide roadway near a school, with substantial space allocated to motorized transportation but no visible dedicated cycling facilities. Figure 3B depicts a commercial area characterized by parked vehicles and a cyclist navigating the roadside. Figure 3C illustrates bicycle use within a residential street, where cycling takes place without designated lanes or physical separation from motor vehicles. Figure 3D shows a cyclist travelling along an unpaved roadside surface adjacent to a paved roadway.
Collectively, these observations highlight discontinuities in cycling infrastructure, inadequate separation from motorized traffic, and uneven roadside conditions. Although the photographs represent selected locations rather than a comprehensive assessment of the neighbourhood, they provide an important physical context for interpreting respondents’ infrastructure preferences.
5.2. Existing Transportation Patterns and Infrastructure Preferences
The transportation patterns of the 400 surveyed adults indicate substantial dependence on private vehicles. Figure 4 presents respondents’ preferences for cycling infrastructure and the factors influencing their willingness to cycle. Figure 4A shows that protected bicycle lanes received the strongest support, followed by safe low-traffic routes and shaded bicycle routes, while bicycle–transit integration attracted comparatively lower ratings. Figure 4B presents the mixed-effects ordinal logistic regression results, with protected bicycle lanes demonstrating the highest odds ratio (OR = 30.70), followed by low-traffic routes (OR = 18.94) and shaded routes (OR = 13.73).
All six interventions showed positive associations relative to bicycle–transit integration, with 95% confidence intervals above unity. Figure 4C indicates that positive willingness to cycle declined as perceived heat barriers increased, from approximately 70% under moderate barriers to 54% under very high barriers. Figure 4D demonstrates consistently strong preferences for protected bicycle lanes across all age groups, generally exceeding 90%, while shaded routes also received substantial support.
5.3. Pairwise Ordinal Logistic Regression
Pairwise ordinal logistic regression was employed to compare the relative preferences for six bicycle-friendly interventions against bicycle–public transport integration (BF6), which served as the reference category. Each model included 800 infrastructure ratings from 400 respondents. The estimated coefficients, odds ratios, and infrastructure rankings are presented in Table 1.
Protected bicycle lanes demonstrated the strongest relative preference, with an odds ratio of 12.32, indicating substantially greater odds of expressing stronger support compared with the reference intervention. Safe low-traffic routes ranked second (OR = 8.60), followed by shaded bicycle routes (OR = 6.83) and bicycle-friendly intersections (OR = 5.00). Bicycle-sharing services (OR = 2.06) and workplace cycling incentives (OR = 1.60) exhibited comparatively weaker associations.
The ranking demonstrates a clear preference for physical infrastructure improvements, particularly interventions providing safer and more comfortable cycling environments. However, the pairwise approach does not account for respondent-specific variation across repeated infrastructure evaluations.
5.4. Mixed-Effects Ordinal Logistic Regression
To account for repeated evaluations by individual respondents, a cumulative link mixed-effects model was estimated using respondent-specific random intercepts. The model incorporated all seven infrastructure alternatives, with bicycle–public transport integration retained as the reference category. Table 2 presents the estimated coefficients, standard errors, z-statistics, significance levels, odds ratios, and confidence intervals.
All six infrastructure interventions demonstrated positive and statistically significant coefficients (p < 0.001). Protected bicycle lanes produced the largest odds ratio (OR = 30.70; 95% CI: 22.23–42.39), indicating considerably greater odds of stronger support relative to bicycle–public transport integration, conditional on the model’s random effects. Safe low-traffic routes ranked second (OR = 18.94; 95% CI: 13.95–25.72), followed by shaded bicycle routes (OR = 13.73; 95% CI: 10.21–18.45).
Bicycle-friendly intersections also exhibited a strong association (OR = 9.02), while bicycle-sharing services (OR = 2.67) and workplace incentives (OR = 1.94) produced smaller estimates. The confidence intervals for all six interventions were above unity, supporting the statistical significance of their relative preference estimates.
The infrastructure ranking remained consistent with the pairwise models. However, the mixed-effects estimates were generally larger, reflecting differences in model specification and the incorporation of respondent-level heterogeneity. These results are illustrated in Figure 4B.
5.5. Model Fit and Respondent-Level Heterogeneity
The mixed-effects model incorporated 2,800 observations, representing seven infrastructure evaluations from each of the 400 respondents. A respondent-specific random intercept was included to account for potential correlations among repeated evaluations and differences in individuals’ underlying preferences for cycling infrastructure. The model was estimated using the Laplace approximation with a logit link function, allowing the ordinal nature of the response variable to be retained.
This approach provides a more comprehensive assessment of infrastructure preferences by accounting for both the relative effects of individual interventions and unobserved variation between respondents. Model-fitting statistics, estimation characteristics, and random-effects parameters are reported in Table 3.
The inclusion of respondent-level random effects is particularly important because each participant evaluated multiple infrastructure alternatives, and these responses may not be independent. Individuals with generally favourable attitudes toward cycling may consistently assign higher ratings across different interventions, while others may express lower levels of support regardless of infrastructure type. Accounting for this variation reduces the risk of attributing differences in individual response tendencies solely to infrastructure characteristics.
The estimated random-intercept variance was 1.574, corresponding to a standard deviation of 1.255. This indicates considerable between-respondent heterogeneity in the underlying tendency to express support for cycling infrastructure. The model produced a log-likelihood of −3,088.26 and an AIC of 6,198.52. These statistics provide measures of model fit but require comparison with alternative specifications for relative evaluation. The maximum absolute gradient of 0.00203 warrants further assessment of numerical convergence. Four threshold parameters were estimated to distinguish adjacent response categories on the underlying ordinal scale (Table 4).
6. Discussion
The findings demonstrate a clear preference for cycling infrastructure that provides separation from motorized traffic and improves route safety. Protected bicycle lanes received the highest relative preference (OR = 30.70), followed by safe low-traffic routes (OR = 18.94) and shaded bicycle routes (OR = 13.73). These results are consistent with Basu and Vasudevan [4] and Caulfield et al. [5], who identified dedicated cycling infrastructure as an important factor influencing public preferences. Similar evidence from infrastructure evaluations highlights the importance of safety, route continuity, and physical separation [6,26,28].
The results also reflect broader limitations associated with automobile-oriented urban planning. Koglin and Rye [1] argue that conventional transportation planning has historically prioritized motorized movement, contributing to the marginalisation of cycling. This approach is illustrated in Figure 5, which contrasts mixed urban traffic with the separation of transportation movements through grade-separated infrastructure. Although such separation was intended to improve traffic circulation, it does not necessarily provide accessible cycling environments. Contemporary planning therefore requires greater attention to infrastructure designed specifically for cyclists and pedestrians [2,27].
The importance assigned to protected bicycle lanes and safer intersections suggests that perceived road safety is a central consideration in cycling infrastructure preferences. Previous research demonstrates that roadway design and intersection characteristics influence cycling risks [7,39]. Adeel et al. [92] similarly identify street-level design attributes as important determinants of public preferences for sustainable urban development. Their findings are particularly relevant because infrastructure design must accommodate users with different expectations regarding accessibility, comfort, and safety.
Climatic conditions introduce additional challenges. The results indicate that positive cycling willingness declined from approximately 70% among respondents reporting moderate heat barriers to 54% among those reporting very high barriers. This pattern is consistent with evidence that weather and thermal exposure influence cycling behaviour [9,45,91]. Research from Qatar also identifies climatic discomfort and inadequate cycling facilities as barriers to bicycle adoption [8]. Nevertheless, the continued willingness to cycle among respondents reporting substantial heat barriers suggests that climatic conditions should be considered alongside infrastructure quality rather than as an isolated constraint.
Infrastructure preferences remained relatively consistent across age groups, with protected bicycle lanes receiving strong support among both younger and older adults. This finding supports the importance of developing cycling networks that accommodate different demographic groups rather than concentrating on a narrow segment of existing cyclists [10,63].
Research on urban transport policy portfolios suggests that combined interventions may generate environmental and welfare gains beyond isolated roadway measures [93].
The substantial reliance on private cars (71.8%) and limited bicycle use (1.5%) demonstrate the challenges associated with encouraging alternative transportation modes. Previous research identifies automobile dependence and dispersed urban development as important characteristics of Muscat’s transportation environment [77,78]. However, the strong preference for protected cycling infrastructure indicates potential opportunities to improve the attractiveness of cycling.
Adeel et al. [94] emphasize the importance of climate-sensitive streetscape design in Muscat, while their related research identifies road safety and personal security as important constraints on sustainable transportation choices [95]. Similarly, Sheikh et al. [96] demonstrate the relevance of balancing pedestrian and vehicle movements through transportation management. The integration of cycling with public transportation may also contribute to broader accessibility improvements [72]. Research on transit-oriented urban development further highlights the relationships between transportation infrastructure, land development, and environmental sustainability [97,98].
Spatial visualization and immersive design research provide additional approaches for communicating infrastructure alternatives to planning stakeholders [99].
Overall, the findings suggest that cycling infrastructure development should prioritize protected routes, safe intersections, and climate-responsive design while considering opportunities for integration with existing transportation networks. However, stated infrastructure preferences should not be interpreted as direct evidence of future modal shifts without additional behavioural evaluation.
7. Planning and Policy Implications
The findings provide important implications for developing bicycle-friendly infrastructure and promoting sustainable urban mobility in automobile-dependent cities. Given the strong preference for protected bicycle lanes, transportation authorities should prioritize dedicated cycling corridors that provide physical separation from motorized traffic. Previous research similarly emphasizes the importance of infrastructure quality and route safety in encouraging bicycle use [4,6,39]. Particular attention should be directed toward improving intersection safety, maintaining continuous cycling networks, and connecting residential neighbourhoods with commercial and recreational destinations.
Climatic conditions require additional consideration in Oman, where extreme temperatures may discourage outdoor travel [8]. The provision of shaded bicycle routes, roadside vegetation, and climate-responsive infrastructure could improve cycling comfort and reduce exposure to excessive heat [45,91]. Furthermore, integrating cycling facilities with public transportation could enhance accessibility and support multimodal travel, particularly for shorter journeys [72].
Considering the existing automobile dependence in Muscat [77], infrastructure improvements should be accompanied by public awareness initiatives, cycling safety education, and policies encouraging active transportation. A phased implementation approach, beginning with neighbourhoods demonstrating favourable infrastructure preferences, could provide opportunities to evaluate cycling participation and guide future investments.
Distributional implications also warrant attention: studies of housing affordability and forced residential mobility demonstrate that household location and access can change for reasons beyond transport preference [100].
8. Limitations
Several limitations should be considered when interpreting the findings. First, the cross-sectional survey design captures respondents’ preferences and intentions at a particular point in time, limiting the ability to establish causal relationships between infrastructure improvements and cycling adoption. Second, self-reported perceptions of safety, heat barriers, and willingness to cycle may differ from actual transportation behaviour. Third, the geographical concentration of the study limits the generalizability of findings to other urban environments with different climatic and infrastructural characteristics. Additionally, the photographic observations provide contextual information but do not represent a systematic assessment of cycling infrastructure. Finally, although mixed-effects ordinal logistic regression accounts for respondent-level heterogeneity, further research incorporating longitudinal observations, objective environmental measurements, and post-implementation cycling patterns would strengthen the empirical evidence.
9. Conclusions
This study examined bicycle-friendly infrastructure preferences, perceived safety, and environmental barriers influencing cycling adoption among adults in Muscat, Oman. The findings reveal substantial dependence on private vehicles, with cycling accounting for only 1.5% of respondents’ primary transportation modes. Despite this limited use, respondents expressed strong preferences for improvements in cycling infrastructure, particularly protected bicycle lanes, safe low-traffic routes, and shaded bicycle routes. The mixed-effects ordinal logistic regression identified protected bicycle lanes as the most preferred intervention, followed by low-traffic routes and shaded routes.
The findings also indicate that perceived heat barriers influence willingness to cycle, although considerable interest remains even among respondents reporting high climatic discomfort. Infrastructure preferences were relatively consistent across adult age groups, suggesting broad support for safer cycling environments. These results highlight the importance of integrating physical protection, route connectivity, and climate-responsive design into urban transportation planning. Prioritizing dedicated cycling infrastructure alongside safer intersections and shaded routes may improve cycling conditions and encourage greater consideration of bicycles as an alternative transportation mode. The study provides empirical evidence to inform cycling infrastructure priorities and sustainable mobility planning in automobile-dependent urban environments.
Author Contributions
Conceptualization, R.A.K; methodology, R.A.K; software, R.A.K; validation, R.A.K; formal analysis, R.A.K; investigation, R.A.K; resources, R.A.K; data curation, R.A.K; writing—original draft preparation, R.A.K; writing—review and editing, R.A.K; visualization, R.A.K; project administration, R.A.K. The author has read and agreed to the published version of the manuscript.
Funding
This research received no external funding.
Informed Consent Statement
Informed consent was obtained from all individual participants involved in the study.
Data Availability Statement
The data supporting the findings of this study are available from the corresponding author upon reasonable request.
Acknowledgments
During the preparation of this work, the author used ChatGPT (GPT-5.5) to assist with manuscript organization, language refinement, and improving clarity. Additionally, Google Gemini was used to generate conceptual illustrations depicting potential future adaptive reuse and urban regeneration scenarios for selected underutilized spaces. These AI-generated visualizations are intended solely to illustrate proposed design interventions and do not represent actual or implemented developments. The author reviewed and edited all AI-assisted content as necessary and takes full responsibility for the final manuscript.
Conflicts of Interest
The author declare no conflict of interest.
References
- Koglin, T.; Rye, T. The marginalisation of bicycling in Modernist urban transport planning. J. Transp. Health 2014, 1, 214–222. [Google Scholar] [CrossRef]
- Handy, S.; van Wee, B.; Kroesen, M. Promoting cycling for transport: Research needs and challenges. Transp. Rev. 2014, 34, 4–24. [Google Scholar] [CrossRef]
- Fraser, S.D.S.; Lock, K. Cycling for transport and public health: A systematic review of the effect of the environment on cycling. Eur. J. Public Health 2011, 21, 738–743. [Google Scholar] [CrossRef] [PubMed]
- Basu, S.; Vasudevan, V. Effect of bicycle friendly roadway infrastructure on bicycling activities in urban India. Procedia-Soc. Behav. Sci. 2013, 104, 1139–1148. [Google Scholar] [CrossRef]
- Caulfield, B.; Brick, E.; McCarthy, O.T. Determining bicycle infrastructure preferences—A case study of Dublin. Transp. Res. Part D. Transp. Environ. 2012, 17, 413–417. [Google Scholar] [CrossRef]
- Teschke, K.; Harris, M.A.; Reynolds, C.C.O.; Winters, M.; Babul, S.; Chipman, M.; Cusimano, M.D.; Brubacher, J.R.; Hunte, G.; Friedman, S.M.; et al. Route infrastructure and the risk of injuries to bicyclists: A case-crossover study. Am. J. Public Health 2012, 102, 2336–2343. [Google Scholar] [CrossRef] [PubMed]
- Harris, M.A.; Reynolds, C.C.O.; Winters, M.; Cripton, P.A.; Shen, H.; Chipman, M.L.; Cusimano, M.D.; Babul, S.; Brubacher, J.R.; Friedman, S.M.; et al. Comparing the effects of infrastructure on bicycling injury at intersections and non-intersections using a case–crossover design. Inj. Prev. 2013, 19, 303–310. [Google Scholar] [CrossRef] [PubMed]
- Shaaban, K. Why don’t people ride bicycles in high-income developing countries, and can bike-sharing be the solution? The case of Qatar. Sustainability 2020, 12, 1693. [Google Scholar] [CrossRef]
- Nosal, T.; Miranda-Moreno, L.F. The effect of weather on the use of North American bicycle facilities: A multi-city analysis using automatic counts. Transp. Res. Part A Policy Pract. 2014, 66, 213–225. [Google Scholar] [CrossRef]
- Winters, M.; Davidson, G.; Kao, D.; Teschke, K. Motivators and deterrents of bicycling: Comparing influences on decisions to ride. Transportation 2011, 38, 153–168. [Google Scholar] [CrossRef]
- Piatkowski, D.; Bopp, M. Increasing bicycling for transportation: A systematic review of the literature. J. Urban Plan. Dev. 2021, 147, 04021008. [Google Scholar] [CrossRef]
- Bland, M.; Burke, M.I.; Bertolaccini, K. Taking steps toward healthy and sustainable transport investment: A systematic review of economic evaluations on large-scale active transport infrastructure. Int. J. Sustain. Transp. 2024, 18, 201–220. [Google Scholar] [CrossRef]
- Hagen, O.H.; Rynning, M.K. Promoting cycling through urban planning and development: A qualitative assessment of bikeability. Urban Plan. Transp. Res. 2021, 9, 276–305. [Google Scholar] [CrossRef]
- Ferster, C.; Nelson, T.; Manaugh, K.; Beairsto, J.; Laberee, K.; Winters, M. Developing a national dataset of bicycle infrastructure for Canada using open data sources. Environ. Plan. B Urban Anal. City Sci. 2023, 50, 2543–2559. [Google Scholar] [CrossRef]
- Winters, M.; Fischer, J.; Nelson, T.; Fuller, D.; Whitehurst, D.G.T. Equity in spatial access to bicycling infrastructure in mid-sized Canadian cities. Transp. Res. Rec. 2018, 2672, 24–32. [Google Scholar] [CrossRef]
- Bonsma-Fisher, M.; Lin, B.; Chan, T.C.Y.; Saxe, S. Exploring the geographical equity-efficiency tradeoff in cycling infrastructure planning. J. Transp. Geogr. 2024, 121, 104010. [Google Scholar] [CrossRef]
- Cunha, I.; Silva, C.; Büttner, B.; Toivonen, T. Pursuing cycling equity? A mixed-methods analysis of cycling plans in European cities. Transp. Policy 2024, 145, 237–246. [Google Scholar] [CrossRef]
- van Eldijk, J.; Gil, J.; Marcus, L. Disentangling barrier effects of transport infrastructure: Synthesising research for the practice of impact assessment. Eur. Transp. Res. Rev. 2022, 14, 1. [Google Scholar] [CrossRef]
- Olmos, L.E.; Tadeo, M.S.; Vlachogiannis, D.; Alhasoun, F.; Ochoa, C.; Targa, F.; González, M.C.; et al. A data science framework for planning the growth of bicycle infrastructures. Transp. Res. Part C Emerg. Technol. 2020, 115, 102640. [Google Scholar] [CrossRef]
- van Laake, T. Situating equitable infrastructure: Differentiated cycling planning in Mexico City and Toronto. Plan. Theory Pract. 2026, 27, 100–118. [Google Scholar] [CrossRef]
- Nyamai, D.N.; Schramm, S. Infrastructure segments evolving through transient governance: Nairobi metropolitan services and active mobility infrastructures. Urban Stud. 2025, 62, 1793–1807. [Google Scholar] [CrossRef]
- Nello-Deakin, S.; Nikolaeva, A. The human infrastructure of a cycling city: Amsterdam through the eyes of international newcomers. Urban Geogr. 2021, 42, 289–311. [Google Scholar] [CrossRef]
- Roberts, C. Into a headwind: Canadian cycle commuting and the growth of sustainable practices in hostile political contexts. Energy Res. Soc. Sci. 2020, 70, 101679. [Google Scholar] [CrossRef]
- Davidson, J.H.; Nam, S.J.; Karam, S.; Ryerson, M.S. Cycling in a crisis: Employing quasi-experimental designs to estimate the effects of provisional bicycle infrastructure. J. Plan. Educ. Res. 2026, 46, 53–71. [Google Scholar] [CrossRef]
- Arif, M.M.; Adeel, A.; Sheikh, N.B. Social relations and the making of urban space in informal settlements: Everyday appropriation and public space production. Sustainability 2026, 18, 5844. [Google Scholar] [CrossRef]
- Rérat, P.; Schmassmann, A. Build it and they will come? The effects of a new infrastructure on cycling practices and experiences. Transp. Res. Interdiscip. Perspect. 2024, 25, 101121. [Google Scholar] [CrossRef]
- Williams, T.; Whitehurst, D.G.T.; Nelson, T.; Fuller, D.; Therrien, S.; Gauvin, L.; Winters, M. All ages and abilities cycling infrastructure, cycling activity, and perceived safety: Findings from a natural experiment study in three mid-sized Canadian cities. J. Cycl. Micromobility Res. 2023, 1, 100005. [Google Scholar] [CrossRef]
- Mölenberg, F.J.M.; Panter, J.; Burdorf, A.; et al. A systematic review of the effect of infrastructural interventions to promote cycling: Strengthening causal inference from observational data. Int. J. Behav. Nutr. Phys. Act. 2019, 16, 93. [Google Scholar] [CrossRef] [PubMed]
- Durão, S.; Burns, J.; Schmidt, B.M.; et al. Infrastructure, policy and regulatory interventions to increase physical activity to prevent cardiovascular diseases and diabetes: A systematic review. BMC Public Health 2023, 23, 112. [Google Scholar] [CrossRef] [PubMed]
- Deng, X.; Zhao, Z.; Tang, L.; Yang, H.; Yu, Y.; Liao, G. A multi-scale user-friendliness evaluation approach on cycling network utilizing multi-source data. Appl. Geogr. 2024, 173, 103454. [Google Scholar] [CrossRef]
- Cai, Y.; Ong, G.P.; Meng, Q. Sidewalk-based bicycle path network design incorporating equity in cycling time. Comput.-Aided Civ. Infrastruct. Eng. 2024, 39, 3063–3082. [Google Scholar] [CrossRef]
- Nabavi Niaki, M.S.; Bourdeau, J.-S.; Miranda-Moreno, L.; Saunier, N. Cycling network discontinuities as indicators for performance evaluation: Case study in four cities. Transp. Res. Procedia 2025, 82, 1071–1088. [Google Scholar] [CrossRef]
- Mendiate, C.J.; Nkurunziza, A.; Soria-Lara, J.A.; Monzón, A. Exploring users’ perceptions of factors influencing cycling route choice: A perspective from Quelimane, Mozambique. Transp. Plan. Technol. 2022, 45, 119–137. [Google Scholar] [CrossRef]
- Boonpan, T.; Buddhimedhee, K. The impact of urban design on bicycle usage: A case study of Kyoto’s bicycle-friendly infrastructure. J. Urban Des. 2026, 31, 429–442. [Google Scholar] [CrossRef]
- Porter, A.K.; Kohl, H.W.; Pérez, A.; Reininger, B.; Gabriel, K.P.; Salvo, D. Bikeability: Assessing the objectively measured environment in relation to recreation and transportation bicycling. Environ. Behav. 2020, 52, 861–894. [Google Scholar] [CrossRef]
- Li, W.; Matijevic, J.; Beil, C.; Arzoumanidis, L.; Kolbe, T.H.; Dehbi, Y. Bidirectional enrichment of OpenStreetMap and CityGML 3.0 to facilitate cycling safety assessment. Int. J. Geogr. Inf. Sci. Online first. 2026. [Google Scholar] [CrossRef]
- Jeong, J.; Park, Y.; Park, S. Safety-critical events in bicycle lanes in Jongno, Seoul. J. Urban. Int. Res. Placemaking Urban Sustain. 2023, 16, 101–124. [Google Scholar] [CrossRef]
- Costa, M.; Azevedo, C.L.; Siebert, F.W.; Marques, M.; Moura, F. Unraveling the relation between cycling accidents and built environment typologies: Capturing spatial heterogeneity through a latent class discrete outcome model. Accid. Anal. Prev. 2024, 200, 107533. [Google Scholar] [CrossRef] [PubMed]
- Chen, C.; Lin, X.; Yu, G. Infrastructure matters: A systematic review of bicycle infrastructure design influencing cycling crash and injury risk. J. Saf. Res. 2026, 98, 190–203. [Google Scholar] [CrossRef] [PubMed]
- Berghoefer, F.L.; Vollrath, M. Cyclists’ perception of cycling infrastructure—A Repertory Grid approach. Transp. Res. Part F Traffic Psychol. Behav. 2022, 87, 249–263. [Google Scholar] [CrossRef]
- Winters, M.; Branion-Calles, M.; Therrien, S.; Fuller, D.; Gauvin, L.; Whitehurst, D.G.T.; Nelson, T. Impacts of Bicycle Infrastructure in Mid-Sized Cities (IBIMS): Protocol for a natural experiment study in three Canadian cities. BMJ Open 2018, 8, e019130. [Google Scholar] [CrossRef] [PubMed]
- Mertens, L.; Van Dyck, D.; Deforche, B.; De Bourdeaudhuij, I.; Brondeel, R.; Van Cauwenberg, J. Individual, social, and physical environmental factors related to changes in walking and cycling for transport among older adults: A longitudinal study. Health Place 2019, 55, 120–127. [Google Scholar] [CrossRef] [PubMed]
- Zarabi, Z.; Laviolette, J.; Waygood, O.; Manaugh, K. What type of person is at different stages of change for cycling? A case study of Montreal. Travel Behav. Soc. 2025, 39, 100969. [Google Scholar] [CrossRef]
- Writzl, L.; Wollmann, C.A.; Costa, I.T.; Gobo, J.P.A. Outdoor human thermal comfort along bike paths in Balneário Camboriú/SC, Brazil. Atmosphere 2022, 13, 2092. [Google Scholar] [CrossRef]
- Cao, B.; Sun, M.; Bardhan, R. Measuring shaded bike lanes for heat stress mitigation with deep learning: A case study in Amsterdam, Netherlands. Urban Clim. 2024, 57, 102126. [Google Scholar] [CrossRef]
- Tuomimaa, J.; Käyhkö, J.; Juhola, S.; Räsänen, A. Developing adaptation outcome indicators to urban heat risks. Clim. Risk Manag. 2023, 41, 100533. [Google Scholar] [CrossRef]
- Al Bulushi, F.; Adeel, A.; Al Ofi, I.; Agirbas, E.; Arif, M.M. Heritage values in vernacular settlement morphology: An integrated framework for climate-responsive conservation and urban regeneration. Land 2026, 15, 1356. [Google Scholar] [CrossRef]
- Sheikh, N.B.; Arif, M.M.; Raja, A.Z.; Raja, Z.A. Assessing the role of green infrastructure in fostering resident satisfaction within eco-centric smart cities: A multidimensional empirical analysis. In Signals and Communication Technology (Springer); 2026; pp. 403–421. [Google Scholar] [CrossRef]
- Pedersen, M.R.L.; Bredahl, T.V.G.; Elmose-Østerlund, K.; Hansen, A.F. Motives and barriers related to physical activity within different types of built environments: Implications for health promotion. Int. J. Environ. Res. Public Health 2022, 19, 9000. [Google Scholar] [CrossRef] [PubMed]
- Logan, G.; Somers, C.; Baker, G.; et al. Benefits, risks, barriers, and facilitators to cycling: A narrative review. Front. Sports Act. Living 2023, 5, 1168357. [Google Scholar] [CrossRef] [PubMed]
- Fischer, J.; Sersli, S.; Nelson, T.; et al. Spatial variation in bicycling risk based on crowdsourced safety data. Can. Geogr. 2022, 66, 556–568. [Google Scholar] [CrossRef]
- Janahi, H.; Furlan, R.; Marthya, K.L.; Awwaad, R. Built environment determinants of urban health in Gulf Cooperation Council countries: A PRISMA-based systematic review. J. Phys. Act. Health 2026, Online first, 1–16. [Google Scholar] [CrossRef] [PubMed]
- Steinbach, R.; Green, J.; Datta, J.; Edwards, P. Cycling and the city: A case study of how gendered, ethnic and class identities can shape healthy transport choices. Soc. Sci. Med. 2011, 72, 1123–1130. [Google Scholar] [CrossRef] [PubMed]
- Quintero-Gomez, A.; Calvo-Bascones, P. BIKE (Bicycle Integration Key Elements) Index: Benchmarking urban bikeability and cycling readiness: Evidences from European capitals. Sustain. Cities Soc. 2026, 136, 107096. [Google Scholar] [CrossRef]
- Candio, P.; Frew, E. How much behaviour change is required for the investment in cycling infrastructure to be sustainable? A break-even analysis. PLoS ONE 2023, 18, e0284634. [Google Scholar] [CrossRef] [PubMed]
- Zhang, X.; Chen, H.; Sun, T. Critical factors influencing the synergies of bike-sharing and public transport: An integrated DEMATEL-ISM-MICMAC approach. Res. Transp. Bus. Manag. 2026, 67, 101728. [Google Scholar] [CrossRef]
- Rodríguez, A.; Delgado-Lindeman, M.; Sipone, S.; dell’Olio, L. Gender dynamics in electric bike-sharing: Insights on usage and fare structures. Res. Transp. Econ. 2025, 111, 101561. [Google Scholar] [CrossRef]
- Wang, R.; Liu, C. Bicycle-transit integration in the United States, 2001–2009. J. Public Transp. 2013, 16, 95–119. [Google Scholar] [CrossRef]
- Gössling, S.; Choi, A.S. Transport transitions in Copenhagen: Comparing the cost of cars and bicycles. Ecol. Econ. 2015, 113, 106–113. [Google Scholar] [CrossRef]
- Berrie, L.; Feng, Z.; Rice, D. Does cycle commuting reduce the risk of mental ill-health? An instrumental variable analysis using distance to nearest cycle path. Int. J. Epidemiol. 2024, 53, dyad153. [Google Scholar] [CrossRef] [PubMed]
- Goodman, A.; Sahlqvist, S.; Ogilvie, D. iConnect Consortium Who uses new walking and cycling infrastructure and how? Longitudinal results from the UK iConnect study. Prev. Med. 2013, 57, 518–524. [Google Scholar] [CrossRef] [PubMed]
- Panter, J.; Heinen, E.; Mackett, R.; Ogilvie, D. Impact of new transport infrastructure on walking, cycling, and physical activity. Am. J. Prev. Med. 2016, 50, e45–e53. [Google Scholar] [CrossRef] [PubMed]
- Passafaro, P.; Rimano, A.; Piccini, M.P.; Metastasio, R.; Gambardella, V.; Gullace, G.; Lettieri, C. The bicycle and the city: Desires and emotions versus attitudes, habits and norms. J. Environ. Psychol. 2014, 38, 76–83. [Google Scholar] [CrossRef]
- Lv, H.; Li, H.; Zhang, F.; Bai, X.; Feng, T. Integrating crowding and safety in the analysis of cyclists’ route preferences: Insights from a hybrid choice model. Transp. Lett. 2026, 18, 789–808. [Google Scholar] [CrossRef]
- Jahanshahi, D.; Costello, S.B.; Dirks, K.N.; van Wee, B. Who benefits from cycling initiatives? An evaluation of perceived effectiveness and differences among population groups. Case Stud. Transp. Policy 2023, 13, 101049. [Google Scholar] [CrossRef]
- Echiburú, T.; Hurtubia, R.; Muñoz, J.C. The role of perceived satisfaction and the built environment on the frequency of cycle-commuting. J. Transp. Land Use 2021, 14, 171–196. [Google Scholar] [CrossRef]
- Duren, M.; Corrigan, B.; Kennedy, R.D.; Pollack Porter, K.M.; Ehsani, J. Identifying and assessing perceived cycling safety components. Safety 2023, 9, 75. [Google Scholar] [CrossRef]
- Liu, Y.; Yang, D.; Timmermans, H.J.P.; de Vries, B. Differences in street-scale built environment preferences towards biking: A latent class analysis of stated choice data. Int. J. Urban Sustain. Dev. 2021, 13, 706–714. [Google Scholar] [CrossRef]
- Al Sulaimani, G.; Arif, M.M.; Adeel, A.; Basheer, M.A.; Sheikh, N.B. Rethinking vertical cities: The influence of public perception on design, form, and socio-cultural integration. Societies 2025, 15, 250. [Google Scholar] [CrossRef]
- Fuest, S.; Batista, M.; Berghoefer, F.L.; Flesser, M.; Grandhi, B.S.; Spühler, F.; Sester, M.; Vollrath, M. I bet you feel safe! Assessing cyclists’ subjective safety by objective scores. J. Urban Mobil. 2023, 4, 100066. [Google Scholar] [CrossRef]
- Baeli, V.; Hichy, Z.; Sciacca, F.; De Pasquale, C. Comparing the relative importance of predictors of intention to use bicycles. Front. Psychol. 2022, 13, 840132. [Google Scholar] [CrossRef] [PubMed]
- Zuo, T.; Wei, H.; Chen, N.; Zhang, C. First-and-last mile solution via bicycling to improving transit accessibility and advancing transportation equity. Cities 2020, 99, 102614. [Google Scholar] [CrossRef]
- Barbour, N.; Mannering, F. Intended cycling frequency and the role of happiness and environmental friendliness after COVID-19. Sci. Rep. 2023, 13, 636. [Google Scholar] [CrossRef] [PubMed]
- Batomen, B.; Cloutier, M.-S.; Palm, M.; Widener, M.; Farber, S.; Bondy, S.J.; Di Ruggiero, E. Frequent public transit users views and attitudes toward cycling in Canada in the context of the COVID-19 pandemic. Multimodal Transp. 2023, 2, 100067. [Google Scholar] [CrossRef]
- Lee, J.; Berkelhammer, M. Spatiotemporal response of urban bike-sharing ridership to weather, air quality, and future climate change in major U.S. cities. J. Environ. Manag. 2026, 414, 130431. [Google Scholar] [CrossRef] [PubMed]
- Raja, Z.A.; Arif, M.M.; Sheikh, N.B. The digital city dividend: Modeling residents’ expected financial gains from tech-enabled service delivery. Urban Sci. 2026, 10, 292. [Google Scholar] [CrossRef]
- Didero, M.; Nebel, S.; Pfaffenbach, C. Gender and mobility in the car-dependent urban society of Muscat/Oman. DIE ERDE – J. Geogr. Soc. Berl. 2021, 152, 126–144. [Google Scholar] [CrossRef]
- Didero, M.; Nebel, S.; Pfaffenbach, C. Urban structures and daily mobility patterns in a city of long distances—the case of Muscat/Oman. Singap. J. Trop. Geogr. 2019, 40, 361–386. [Google Scholar] [CrossRef]
- De Siqueira, G.; Mabry, R.; Al Siyabi, H.; Adeel, A.; Malaj, S.; Oyeyemi, A. Construct validity of the physical activity neighborhood environment scale-Oman. Front. Public Health 2023, 11, 1007075. [Google Scholar] [CrossRef] [PubMed]
- Nawrath, M.; Kowarik, I.; Fischer, L.K. The influence of green streets on cycling behavior in European cities. Landsc. Urban Plan. 2019, 190, 103598. [Google Scholar] [CrossRef]
- Yi, D.; Zhang, J. Urban streets profiling with coupled spatio-temporal characteristics and topological information from the biking perspective. Comput. Environ. Urban Syst. 2024, 113, 102180. [Google Scholar] [CrossRef]
- Irawan, M.Z.; Andani, I.G.A.; Hasanah, A.; Bastarianto, F.F. Do cycling facilities matter during the COVID-19 outbreak? A stated preference survey of willingness to adopt bicycles in an Indonesian context. Asian Transp. Stud. 2023, 9, 100100. [Google Scholar] [CrossRef]
- Allen, H.; Nolmark, H. Active transportation, the ultimate low carbon way to travel—A review of international research and education. Front. Sustain. Cities 2022, 4, 824909. [Google Scholar] [CrossRef]
- Griffin, M.; Martino, R.J.; LoSchiavo, C.; Comer-Carruthers, C.; Krause, K.D.; Stults, C.B.; Halkitis, P.N. Ensuring survey research data integrity in the era of internet bots. Qual. Quant. 2022, 56, 2841–2852. [Google Scholar] [CrossRef] [PubMed]
- Ellerby, Z.; Wagner, C.; Broomell, S.B. Capturing richer information: On establishing the validity of an interval-valued survey response mode. Behav. Res. Methods 2022, 54, 1240–1262. [Google Scholar] [CrossRef] [PubMed]
- Al-Jaishi, A.A.; Cuerden, M.S.; Luo, B.; et al. Statistical analysis of Likert-based ordinal scales: A guide for clinical trialists. BMC Med. Res. Methodol. 2026, 26, 78. [Google Scholar] [CrossRef] [PubMed]
- Gößwein, E.; Aertker, J.; Wittowsky, D.; Liebherr, M. The role of infrastructural and psychological factors in sustainable transportation mode choices. Appl. Sci. 2025, 15, 5953. [Google Scholar] [CrossRef]
- Huber, S.; Lindemann, P.; Schröter, B. Safety and bicycle route choice: To what extent do accident risk and perceived safety influence bicycle route choice? Transp. Eng. 2024, 18, 100240. [Google Scholar] [CrossRef]
- Schnötzlinger, P.; Brezina, T.; Emberger, G. Volunteered mass cycling self-tracking data—Grade of representation and aptitude for planning. Transp. A Transp. Sci. 2022, 18, 1470–1495. [Google Scholar] [CrossRef]
- Yin, Y.; Grundstein, A.; Mishra, D.R.; Ramaswamy, L.; Tonekaboni, N.H.; Dowd, J. DTEx: A dynamic urban thermal exposure index based on human mobility patterns. Environ. Int. 2021, 155, 106573. [Google Scholar] [CrossRef] [PubMed]
- Sun, Q.C.; Macleod, T.; Both, A.; Hurley, J.; Butt, A.; Amati, M. A human-centred assessment framework to prioritise heat mitigation efforts for active travel at city scale. Sci. Total Environ. 2021, 763, 143033. [Google Scholar] [CrossRef] [PubMed]
- Adeel, A.; Arif, M.M.; Sheikh, N.B.; Ahsan, M.; Bashir, N. Designing livable transit-oriented development: A multi-stakeholder choice experiment on street-level trade-offs. Int. J. Civ. Infrastruct. 2025, 8, 138–154. [Google Scholar] [CrossRef]
- Liotta, C.; Viguié, V.; Creutzig, F. Environmental and welfare gains via urban transport policy portfolios across 120 cities. Nat. Sustain. 2023, 6, 1067–1076. [Google Scholar] [CrossRef]
- Adeel, A.; Arif, M.M.; Sheikh, N.B. From transit corridors to vibrant streets: Urban development preferences in Muscat’s TOD zones. Proc. ICCSTE 2025, Paper 334. [Google Scholar] [CrossRef]
- Adeel, A.; Arif, M.M.; Sheikh, N.B.; Ahsan, M.; Khan, M.S.U. Road safety as the binding constraint on sustainable mode choice: Discrete choice experiment estimated via conditional logit. Proceedings of ICCSTE 2026, 2026; Paper 185. [Google Scholar] [CrossRef]
- Sheikh, N.B.; Arif, M.M.; Adeel, A. Balancing pedestrian and vehicular needs in urban environments: An agent based signal timing study. J. Res. Archit. Plan. 2025, 35, 1–17. [Google Scholar] [CrossRef] [PubMed]
- Mehmood, R.T.; Shah, M.Z.; Moeinaddini, M.; Arif, M.M.; Chuhdary, R.; Tahira, M. Assessing urban land parcel dynamics driven by bus rapid transit (BRT) as an exclusive transit route. Urban Sci. 2024, 8, 227. [Google Scholar] [CrossRef]
- Sheikh, N.B.; Arif, M.M.; Laverge, J.; Delghust, M. Residential energy and transport coupling for neighborhood decarbonization in transit-oriented development. E3S Web Conf. 2026, 716, 04039. [Google Scholar] [CrossRef]
- Adeel, A.; Arif, M.M.; Sheikh, N.B. The impact of VR-based design simulations on spatial understanding among architects and urban planning students. Proc. NewTech 2025, Paper ICCEIA 173. [Google Scholar] [CrossRef]
- Arif, M.M.; Adeel, A.; Sheikh, N.B. Housing affordability pressure and forced residential mobility in British Columbia, Canada. Proceedings of NewTech 2026; 2026; Paper ICCEIA 131. [Google Scholar] [CrossRef]
Figure 1.
Principles of transport-mode separation in urban planning. Source: Gunnarsson and Lindström (1970), reproduced in Koglin and Rye (2014) [1].
Figure 1.
Principles of transport-mode separation in urban planning. Source: Gunnarsson and Lindström (1970), reproduced in Koglin and Rye (2014) [1].
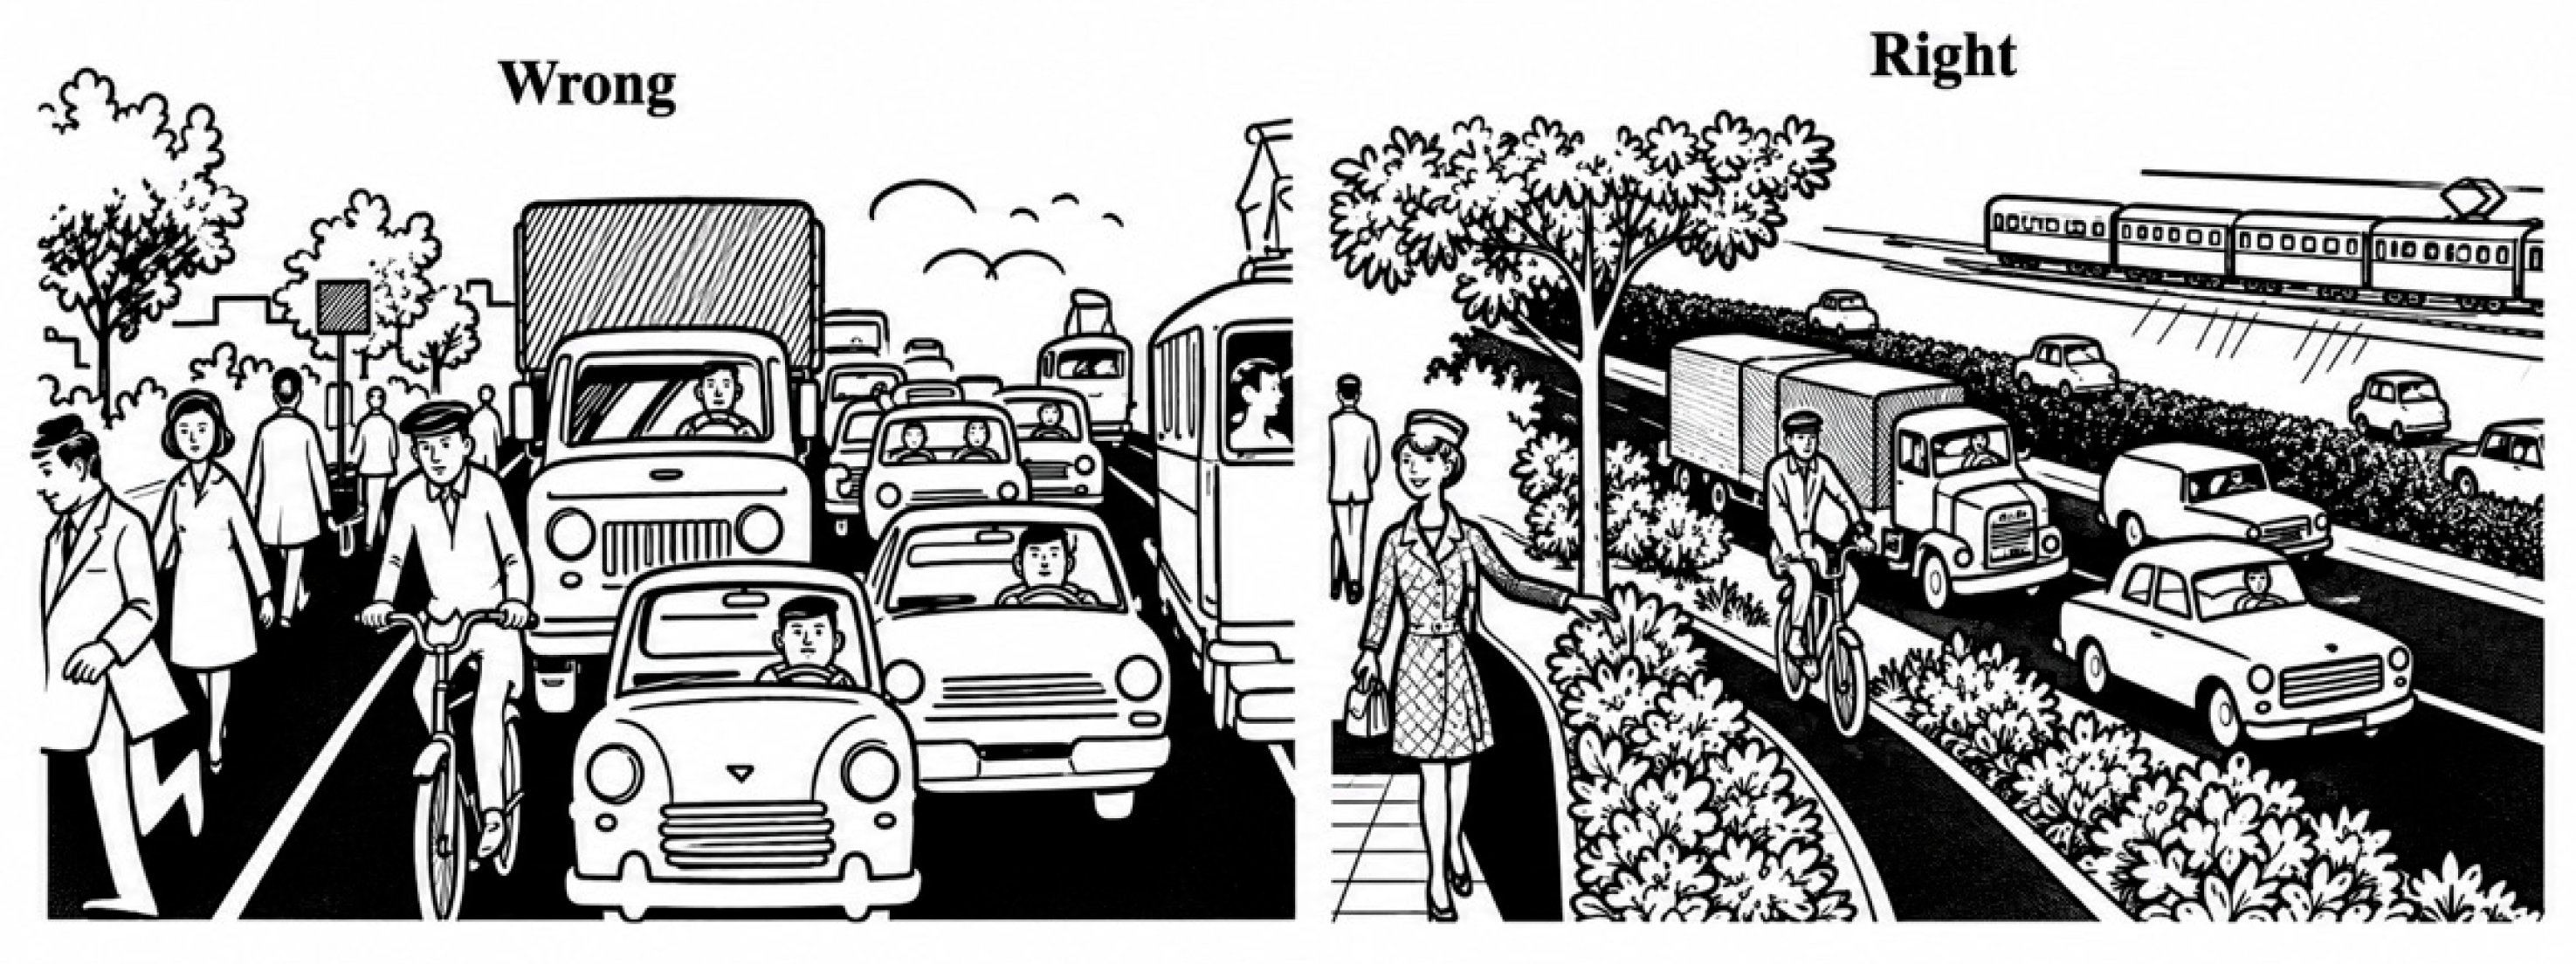
Figure 2.
Study area boundary and approximate two-kilometre axis in Al Baithaa neighbourhood, Muscat, Oman.
Figure 2.
Study area boundary and approximate two-kilometre axis in Al Baithaa neighbourhood, Muscat, Oman.
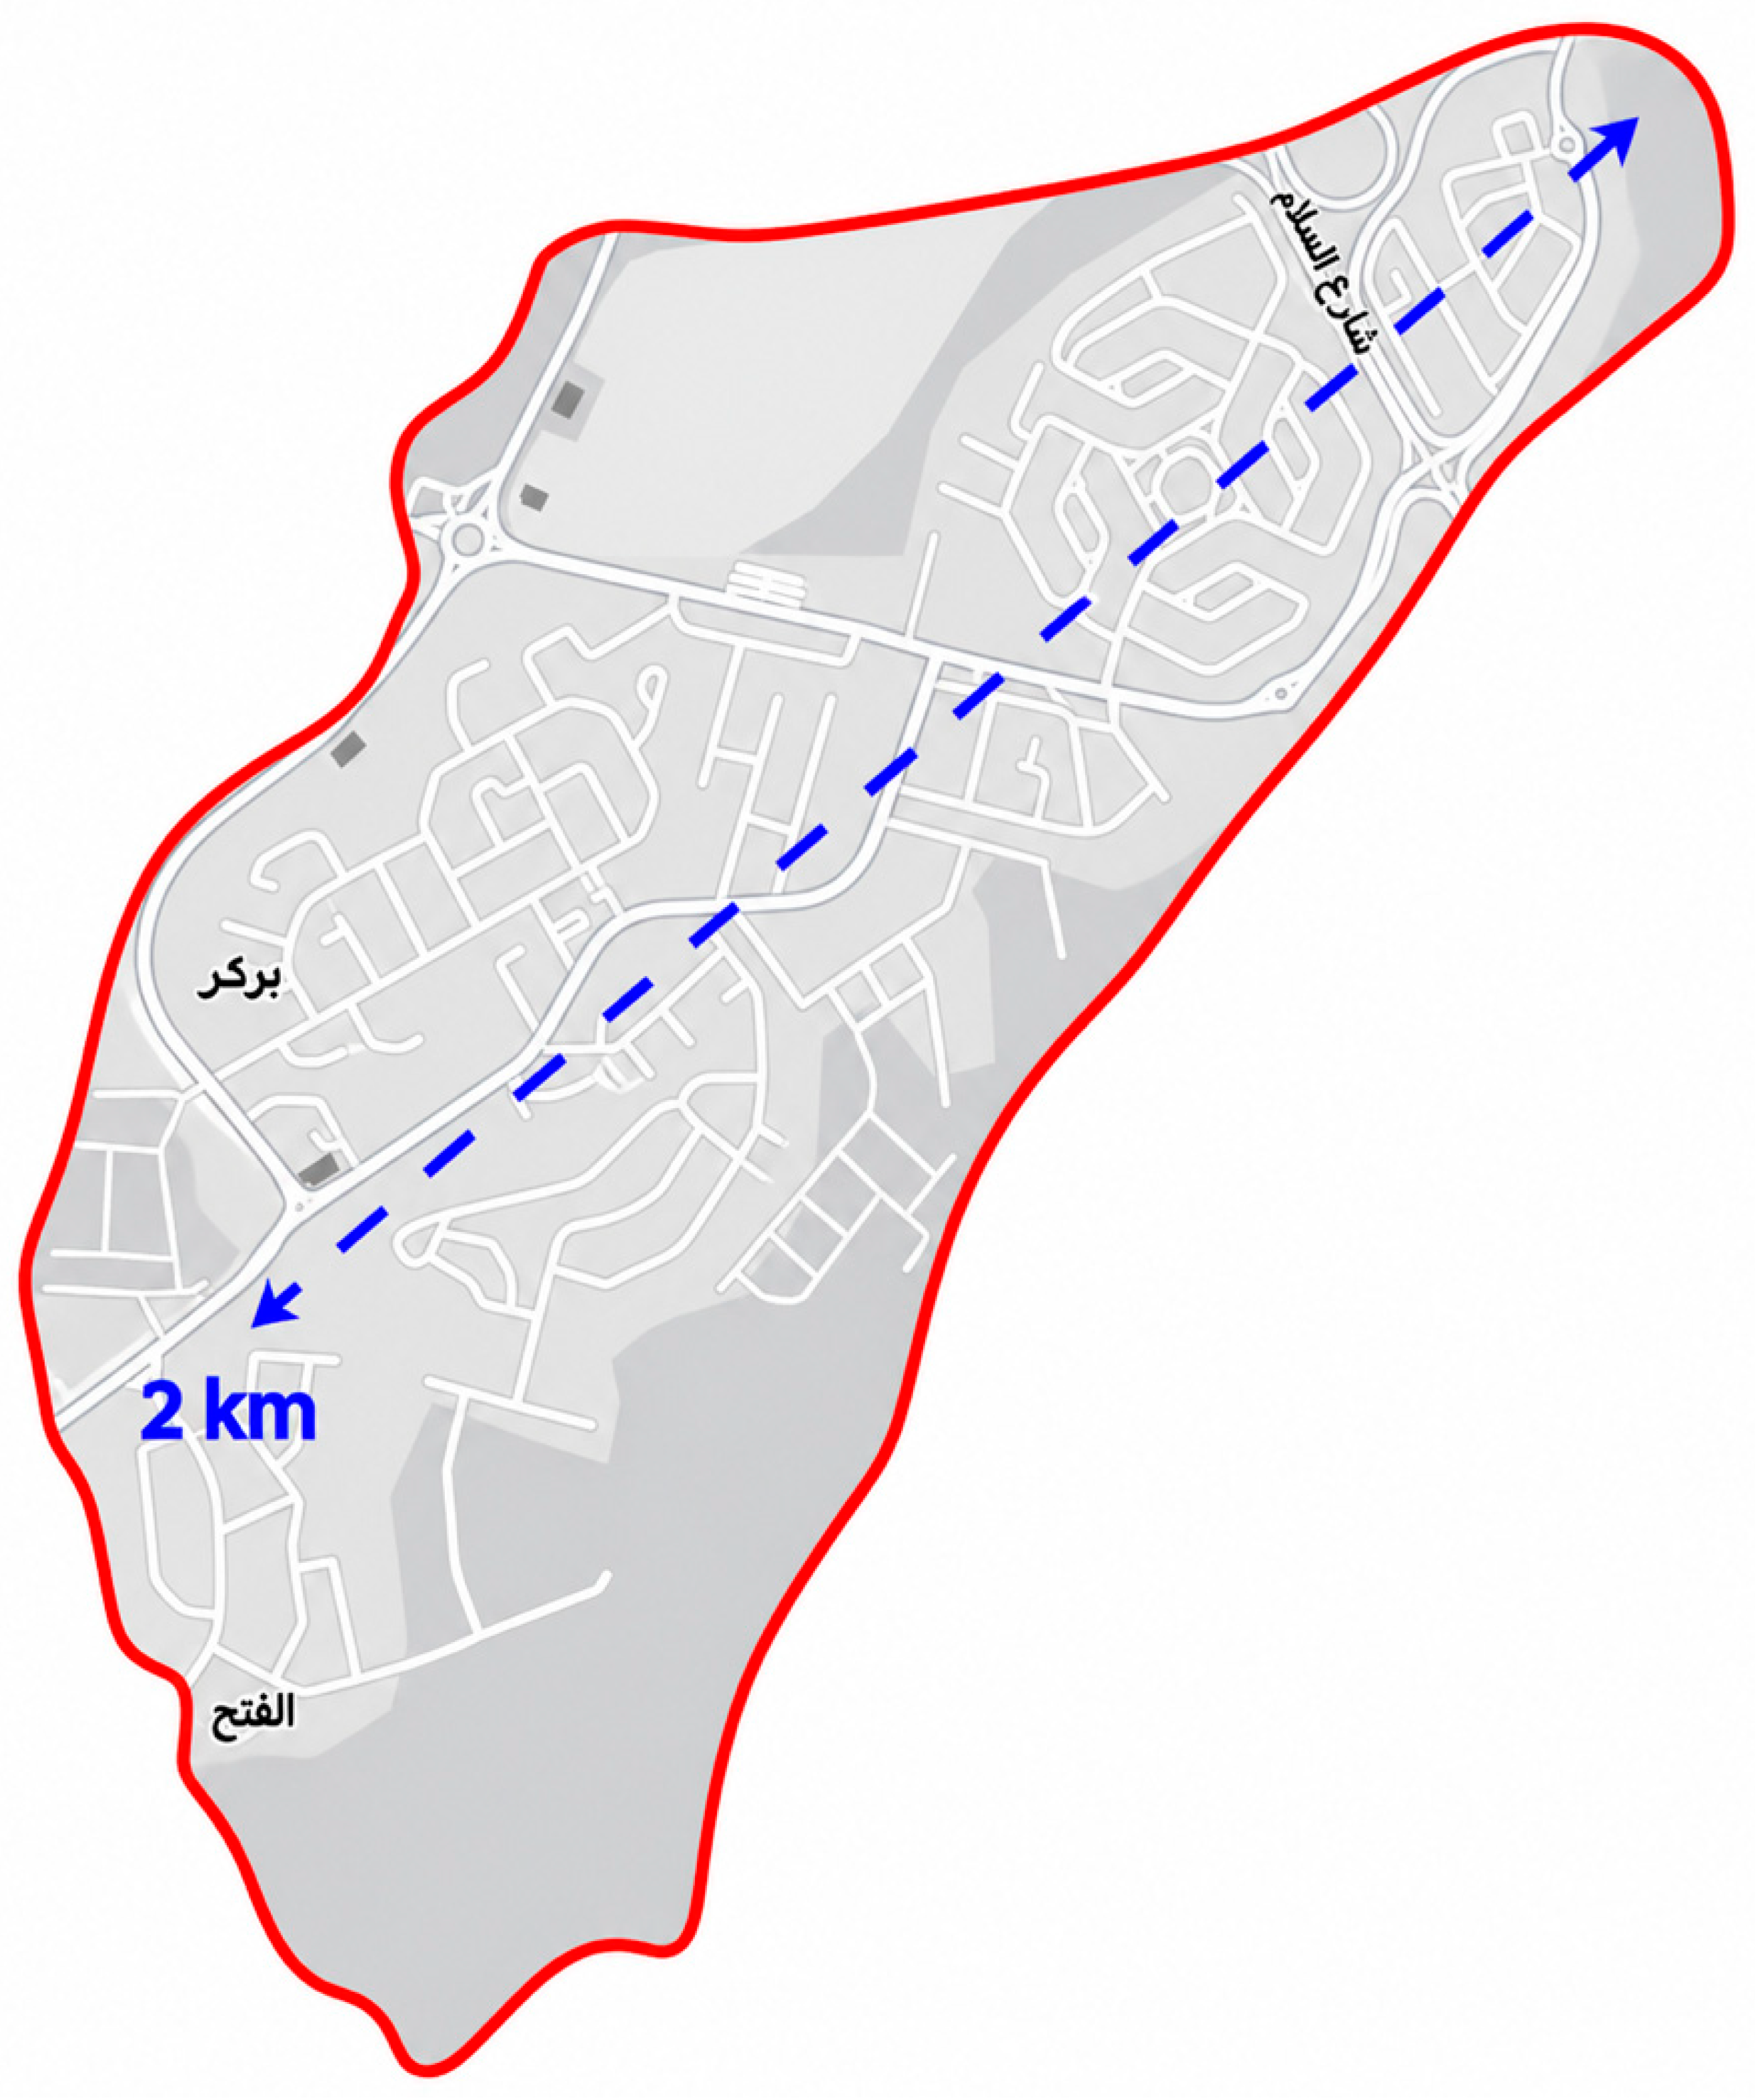
Figure 3.
Cycling environments in Al Baithaa: (A) school-area road; (B) commercial street; (C) residential cycling; and (D) unpaved roadside route.
Figure 3.
Cycling environments in Al Baithaa: (A) school-area road; (B) commercial street; (C) residential cycling; and (D) unpaved roadside route.
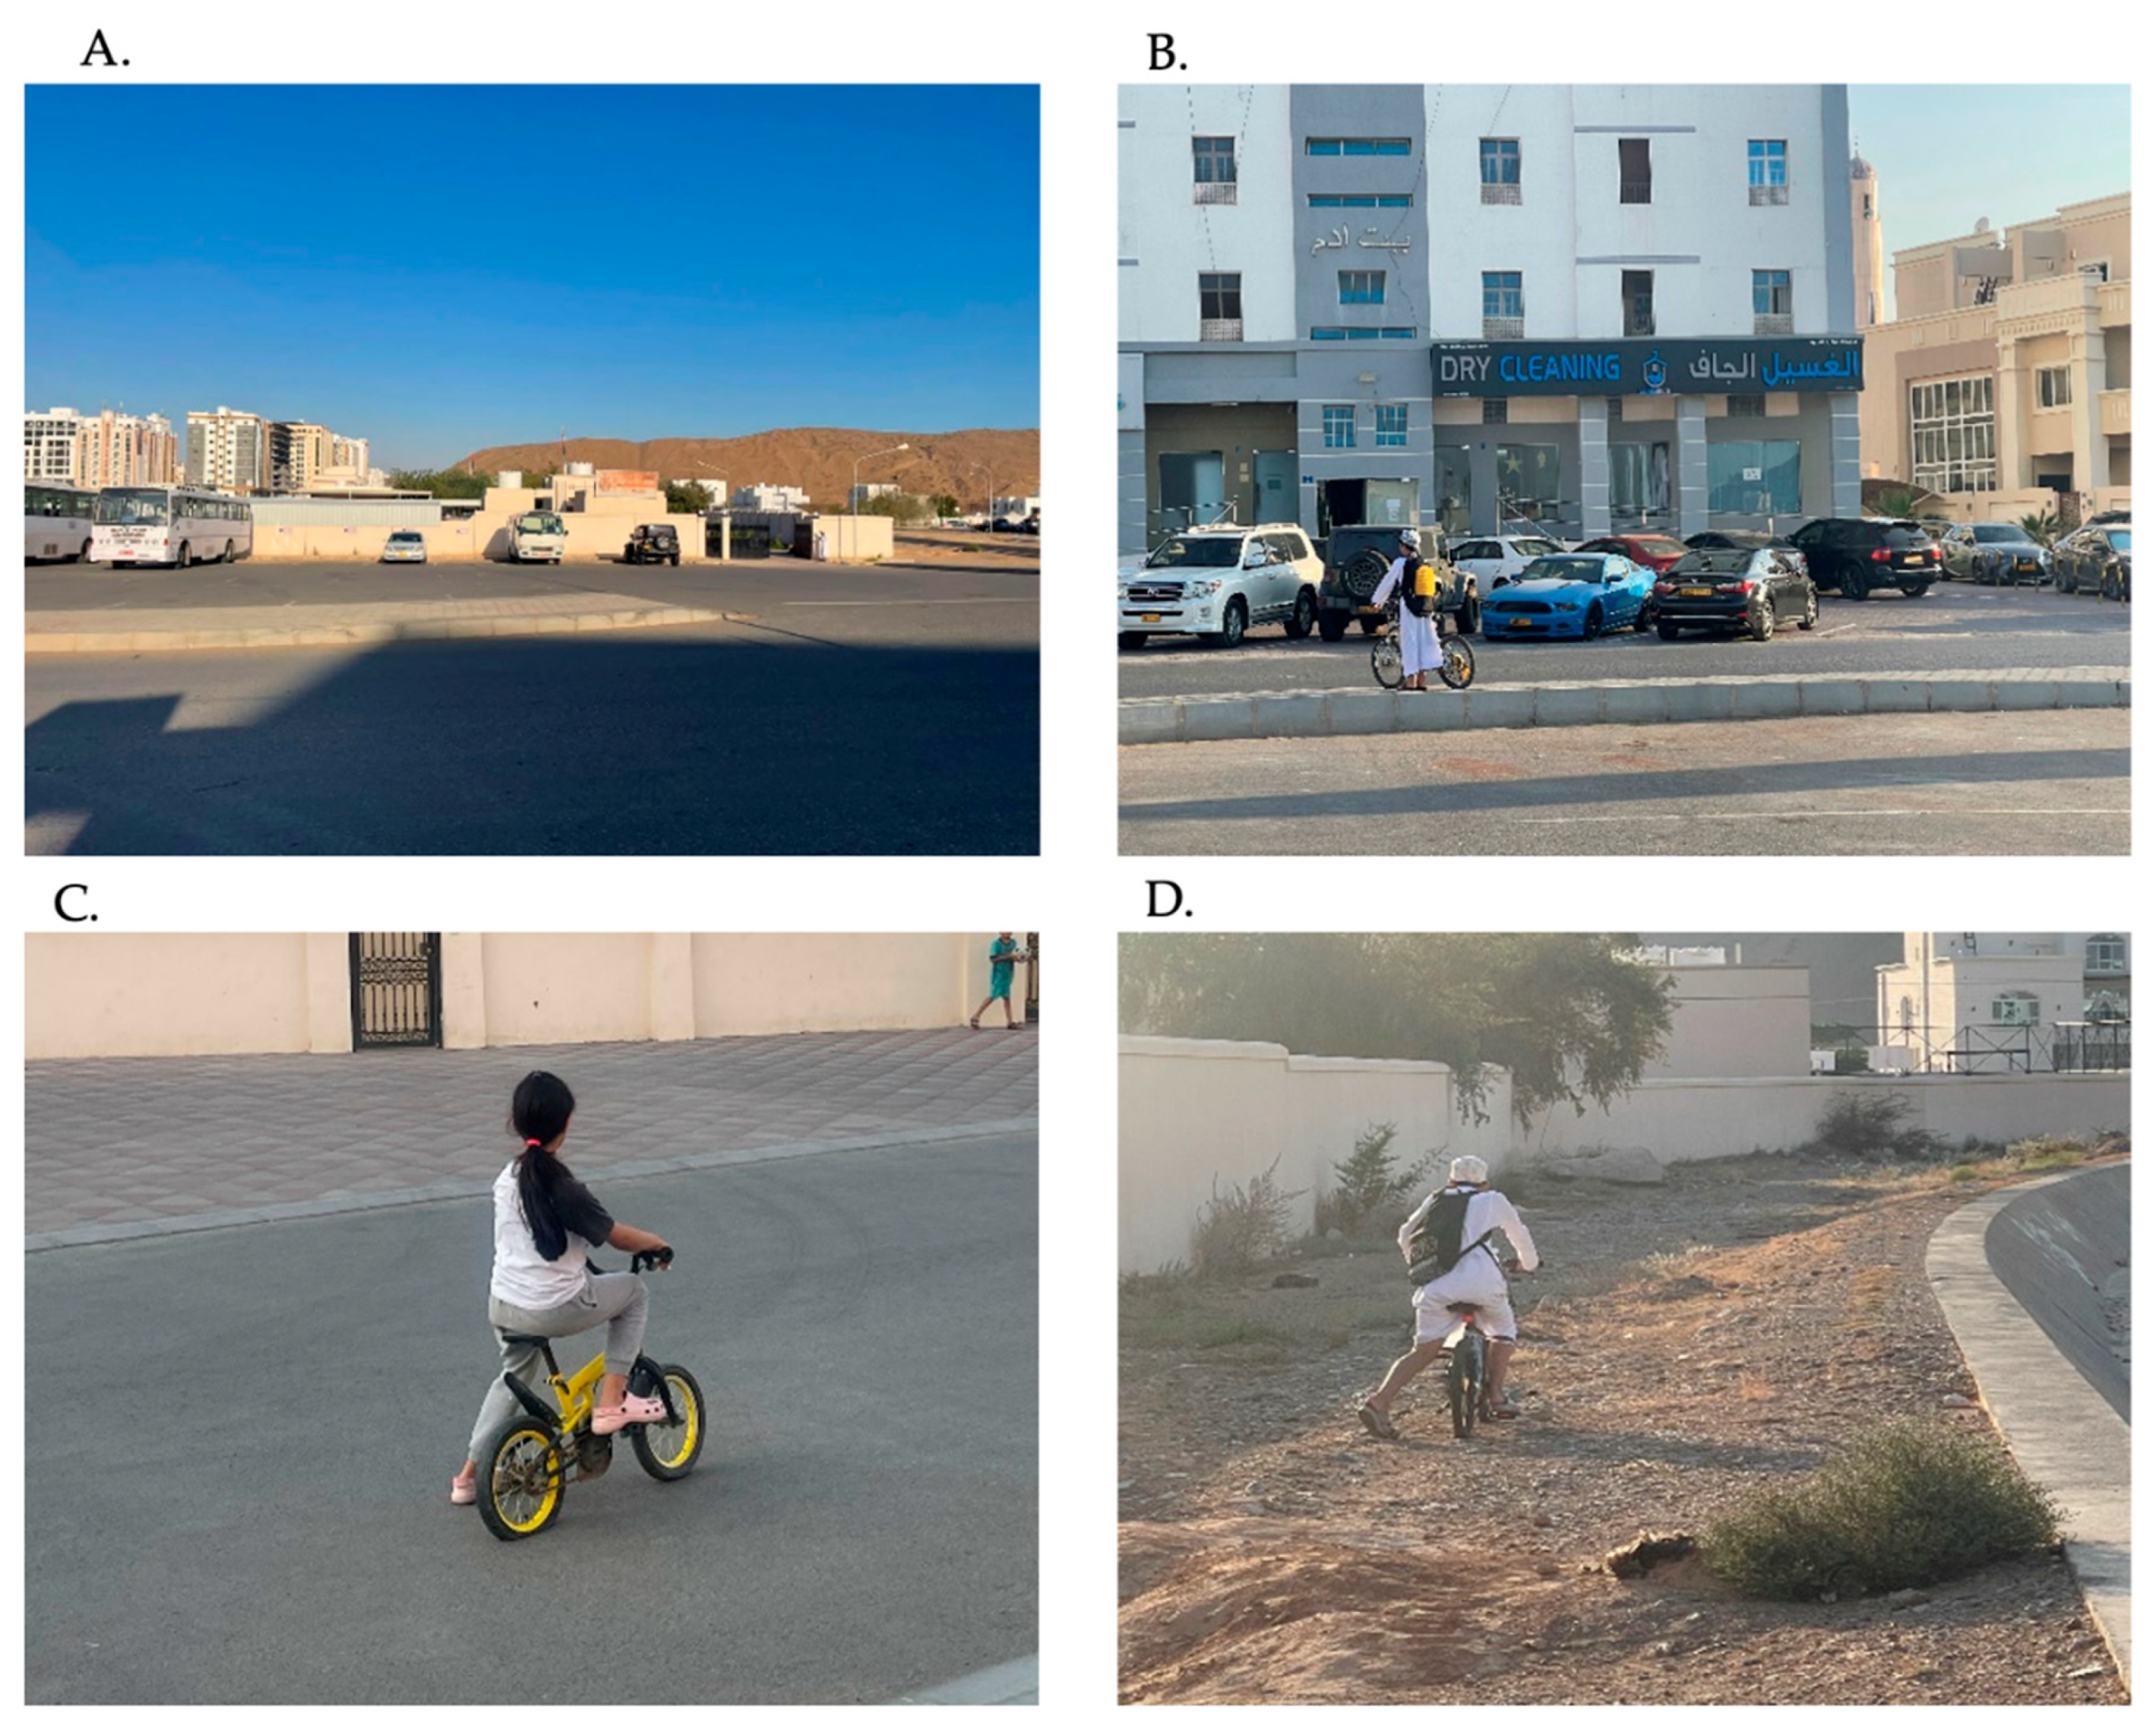
Figure 4.
Adult travel and cycling preferences: (A) infrastructure ratings; (B) estimated odds ratios; (C) heat barriers and willingness; and (D) preferences by age.
Figure 4.
Adult travel and cycling preferences: (A) infrastructure ratings; (B) estimated odds ratios; (C) heat barriers and willingness; and (D) preferences by age.
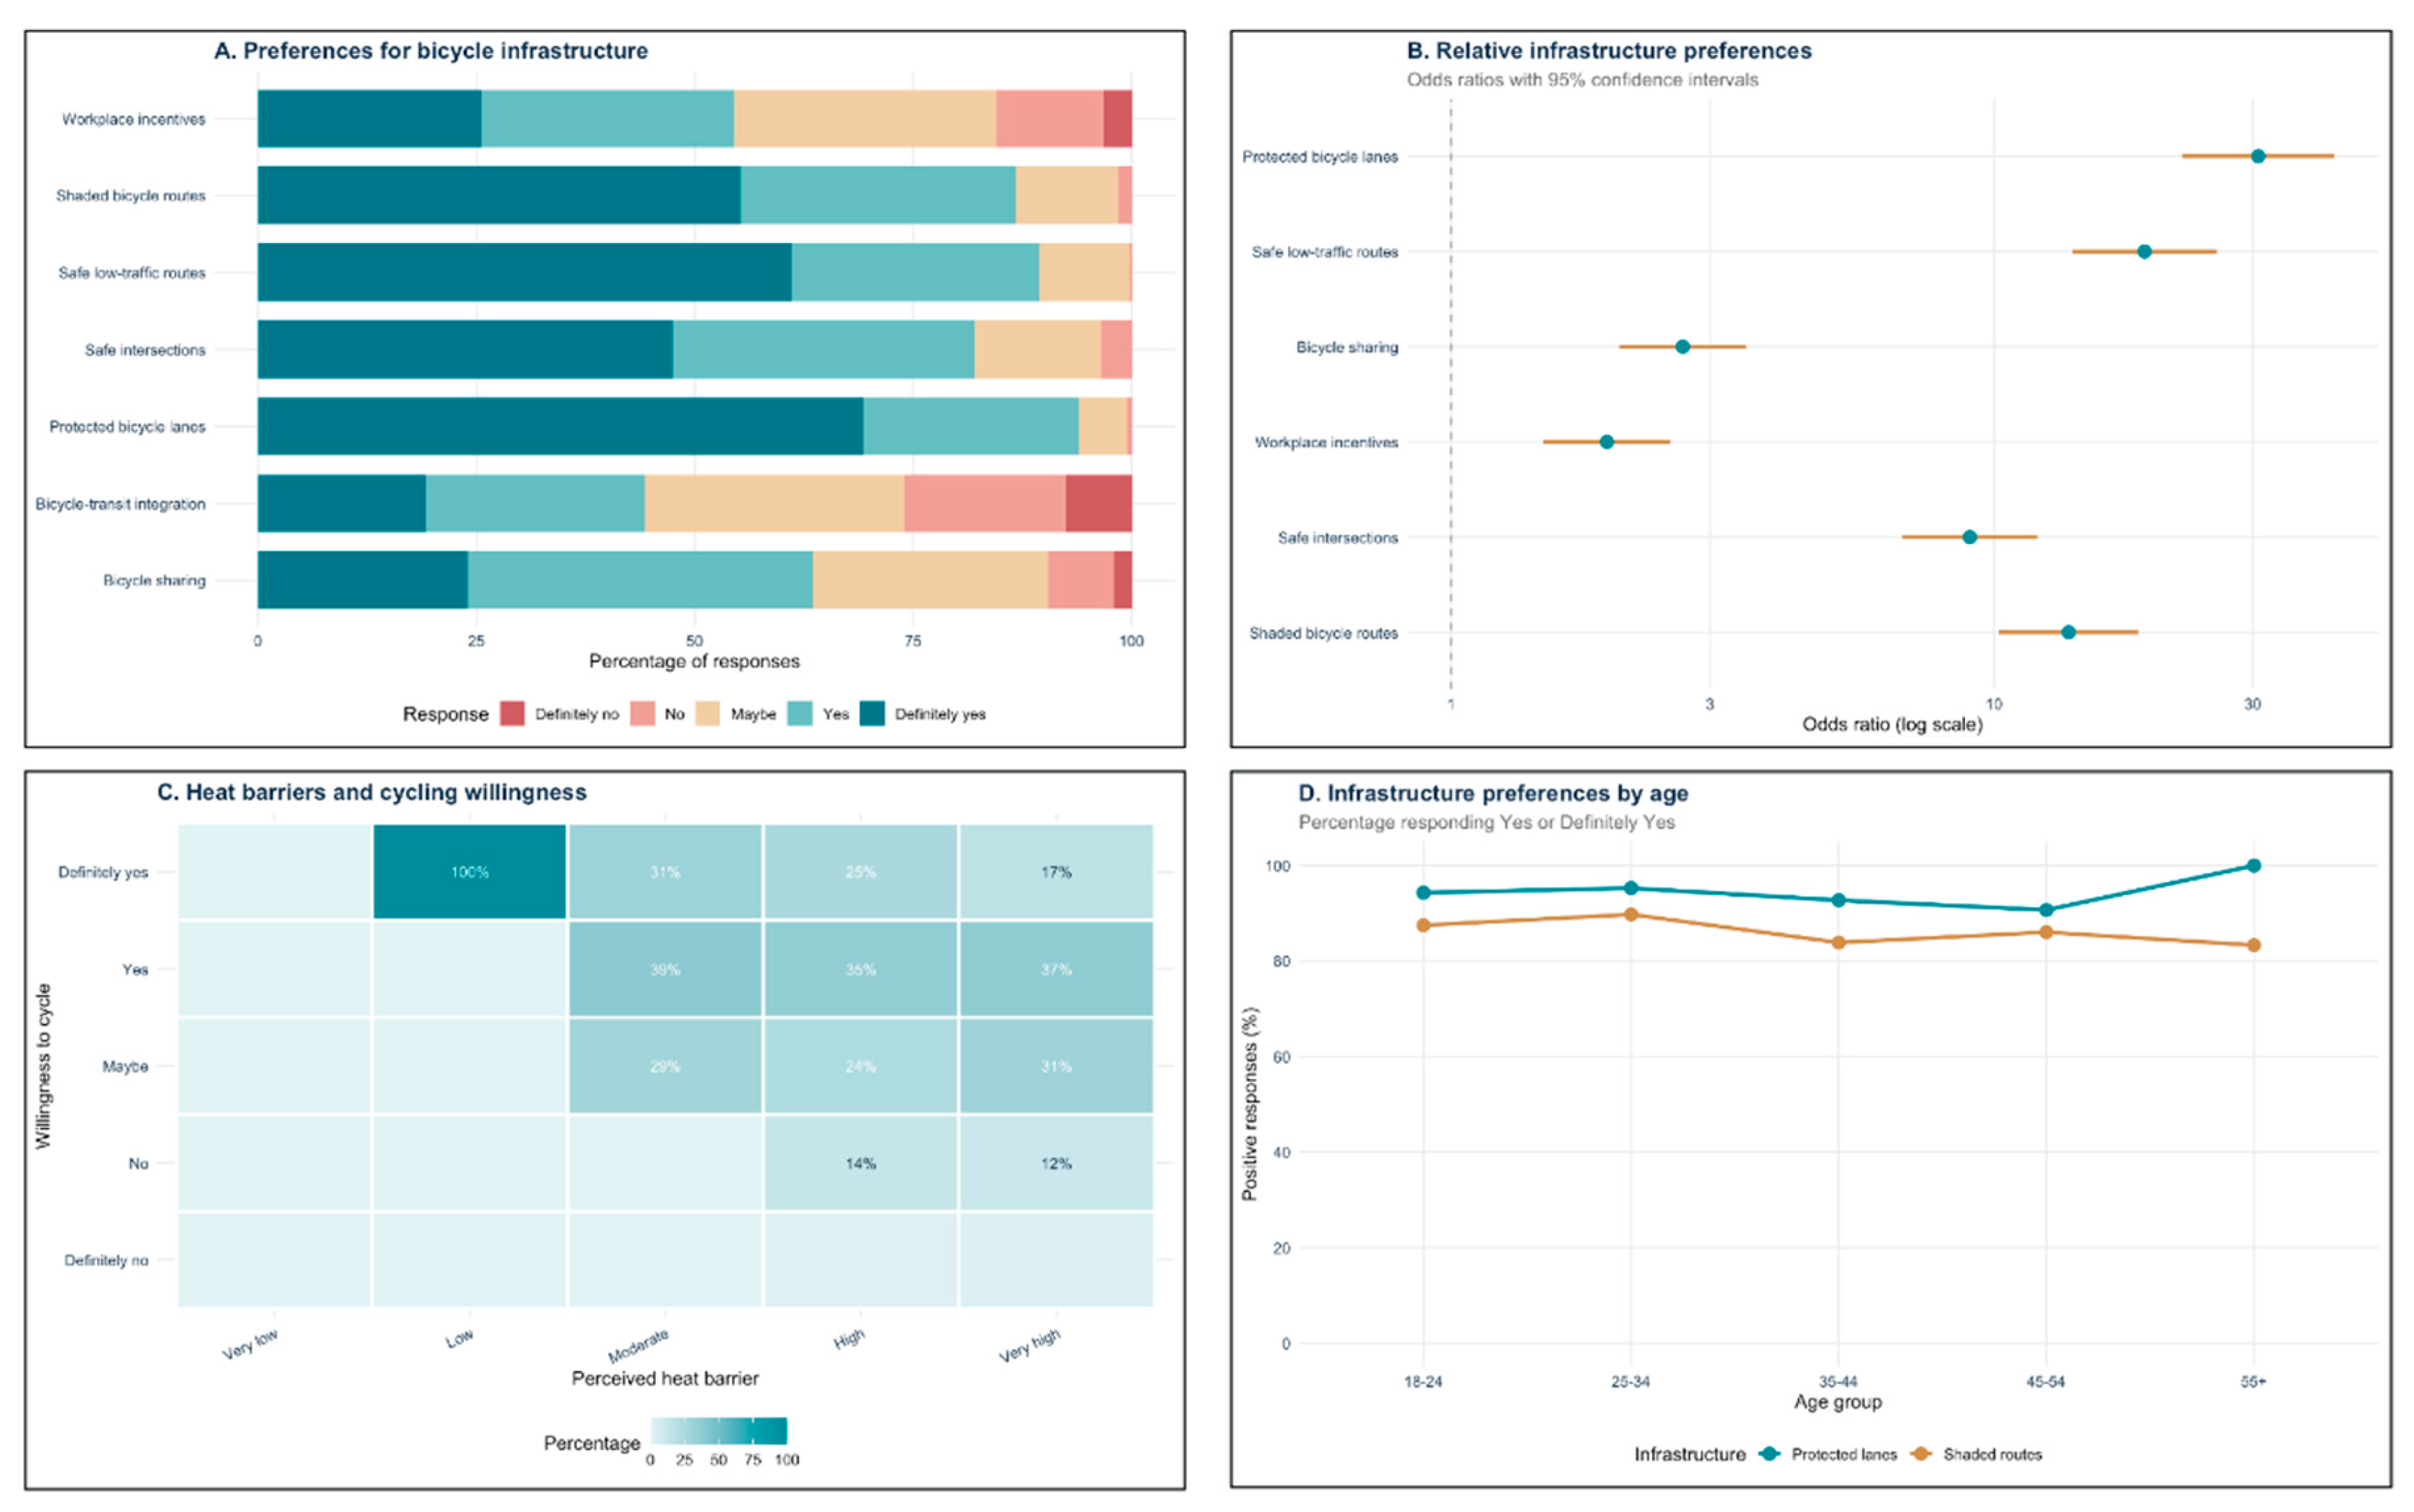
Figure 5.
Principles of traffic differentiation in urban transportation planning. Source: Gunnarsson and Lindström (1970), reproduced in Koglin and Rye (2014) [1].
Figure 5.
Principles of traffic differentiation in urban transportation planning. Source: Gunnarsson and Lindström (1970), reproduced in Koglin and Rye (2014) [1].
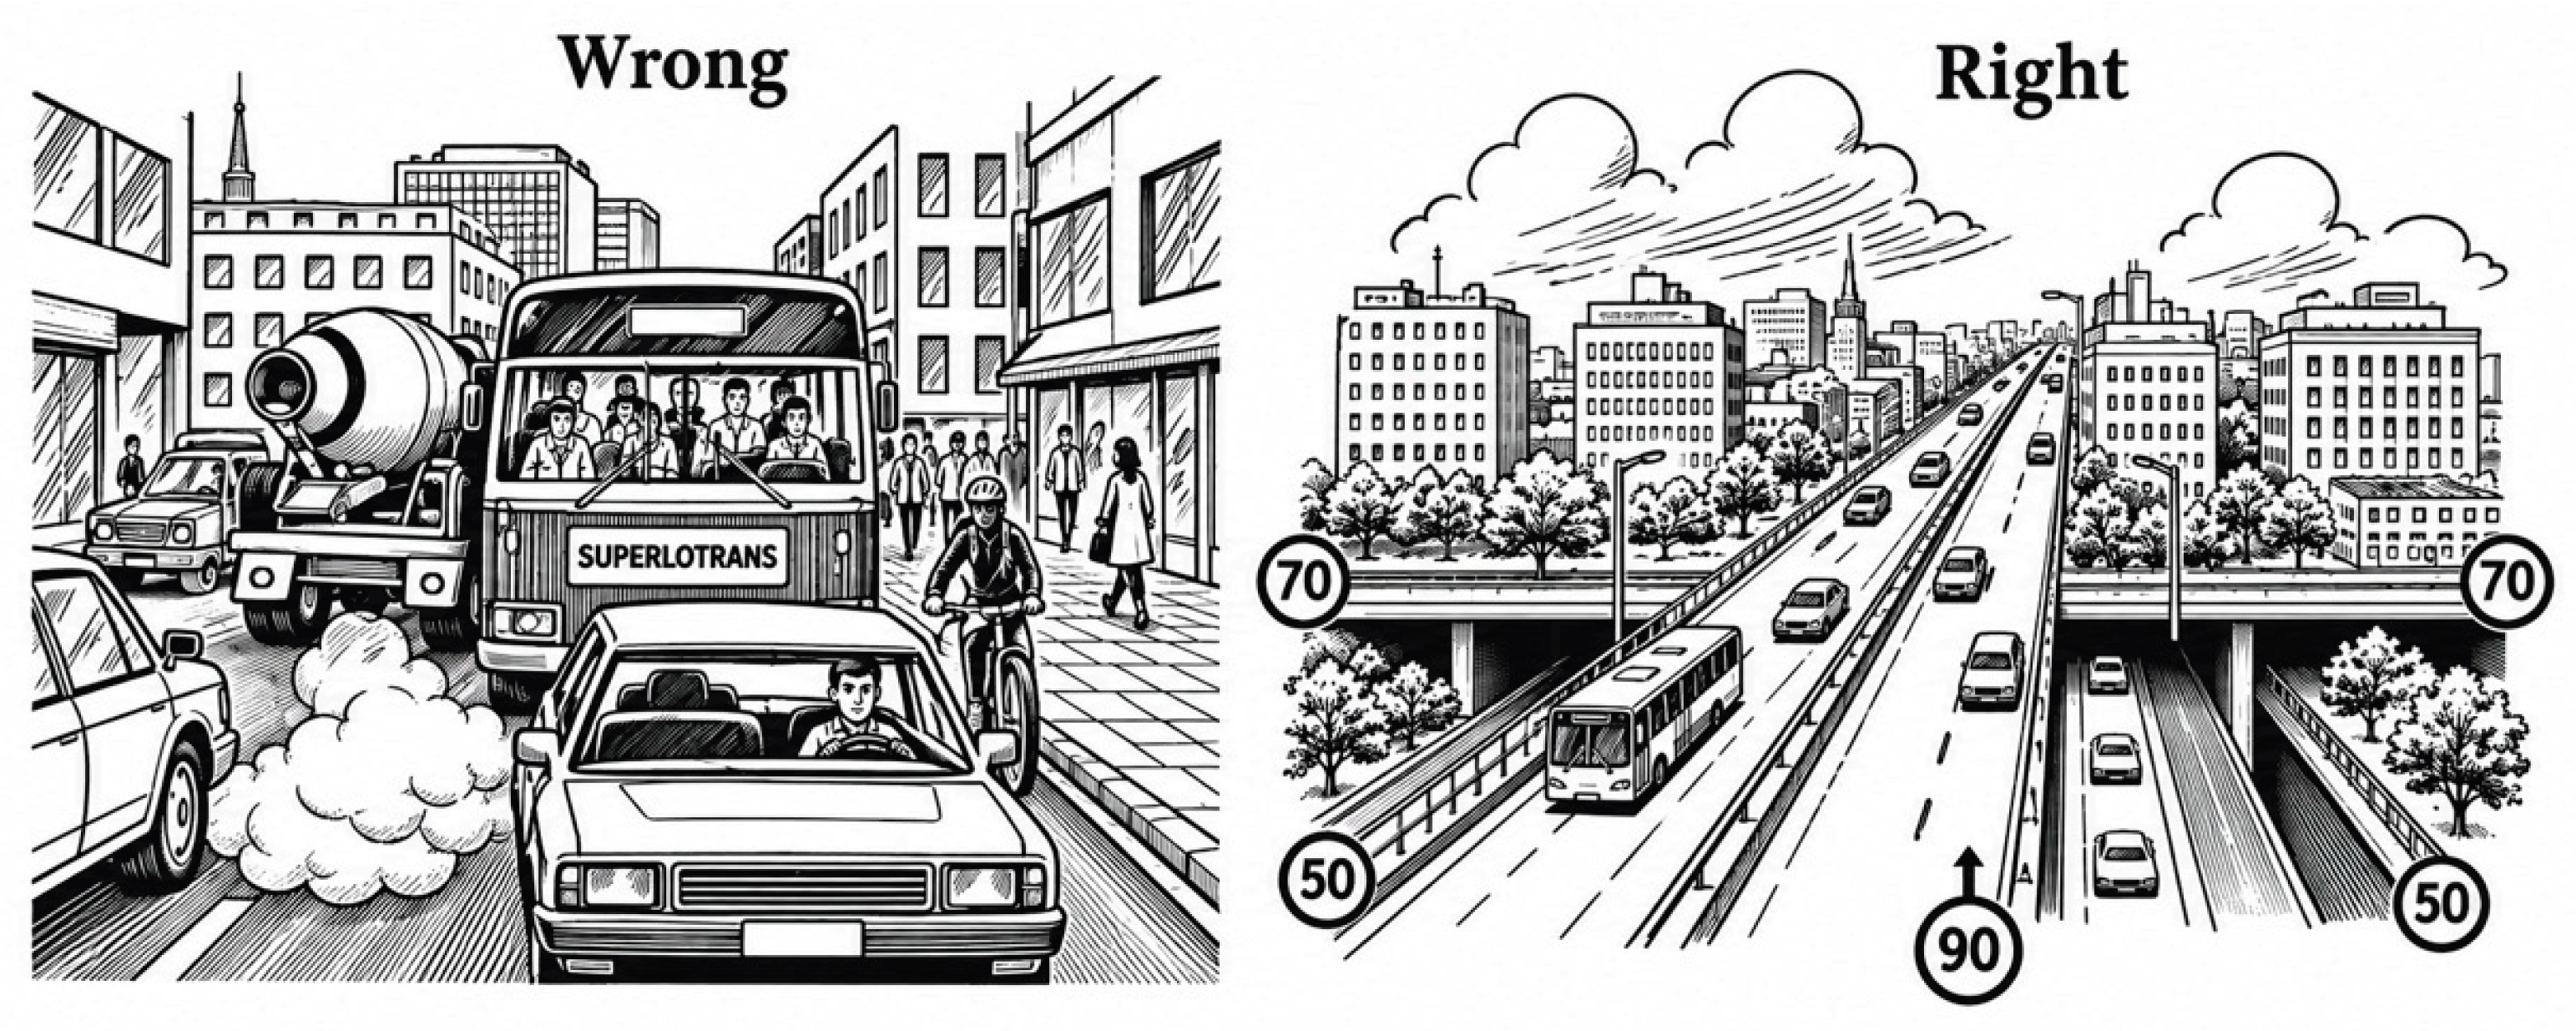

Table 1.
Pairwise ordinal logistic regression estimates of bicycle-friendly infrastructure preferences.
Table 1.
Pairwise ordinal logistic regression estimates of bicycle-friendly infrastructure preferences.
| Model | Infrastructure intervention | β | Odds ratio | Rank |
|---|---|---|---|---|
| 1 | BF1 – Protected bicycle lanes | 2.5111 | 12.32 | 1 |
| 2 | BF2 – Safe low-traffic routes | 2.1517 | 8.60 | 2 |
| 3 | BF3 – Bicycle-sharing services | 0.7251 | 2.06 | 5 |
| 4 | BF4 – Workplace cycling incentives | 0.4683 | 1.60 | 6 |
| 5 | BF5 – Bicycle-friendly intersections | 1.6098 | 5.00 | 4 |
| 6 | BF7 – Shaded bicycle routes | 1.9215 | 6.83 | 3 |
| Reference | BF6 – Bicycle and public transport | — | 1.00 | 7 |
Note: BF6 represents the reference intervention. Preferences were measured on a five-point ordinal scale (1 = Definitely No; 5 = Definitely Yes). Each pairwise model included 800 ratings.
Table 2.
Mixed-effects ordinal logistic regression estimates of bicycle-friendly infrastructure preferences.
Table 2.
Mixed-effects ordinal logistic regression estimates of bicycle-friendly infrastructure preferences.
| Infrastructure | β | SE | z-value | p-value | Odds ratio | 95% CI |
|---|---|---|---|---|---|---|
| BF1 – Protected bicycle lanes | 3.4242 | 0.1647 | 20.793 | <0.001 | 30.70 | 22.23–42.39 |
| BF2 – Safe low-traffic routes | 2.9413 | 0.1562 | 18.832 | <0.001 | 18.94 | 13.95–25.72 |
| BF3 – Bicycle-sharing services | 0.9816 | 0.1375 | 7.139 | <0.001 | 2.67 | 2.04–3.49 |
| BF4 – Workplace incentives | 0.6602 | 0.1369 | 4.821 | <0.001 | 1.94 | 1.48–2.53 |
| BF5 – Bicycle-friendly intersections | 2.1999 | 0.1462 | 15.045 | <0.001 | 9.02 | 6.78–12.02 |
| BF7 – Shaded bicycle routes | 2.6195 | 0.1509 | 17.361 | <0.001 | 13.73 | 10.21–18.45 |
Note: BF6 (bicycle–public transport integration) is the reference category. OR = odds ratio; CI = confidence interval. The model includes a respondent-specific random intercept.
Table 3.
Model-fitting statistics and random-effects parameters.
| Model parameter | Value |
|---|---|
| Model type | Cumulative link mixed model |
| Link function | Logit |
| Estimation method | Laplace approximation |
| Number of observations | 2,800 |
| Number of respondents | 400 |
| Infrastructure alternatives | 7 |
| Log-likelihood | −3,088.26 |
| Akaike Information Criterion (AIC) | 6,198.52 |
| Random-intercept variance | 1.574 |
| Random-intercept standard deviation | 1.255 |
| Maximum absolute gradient | 0.00203 |
| Hessian condition number | 75.0 |
Note: The model was estimated using the clmm() function in the R ordinal package. Respondent ID was included as a random intercept.
Table 4.
Estimated threshold parameters for the cumulative link mixed model.
| Threshold | Estimate | SE | z-value |
|---|---|---|---|
| 1 / 2 | −3.4634 | 0.1783 | −19.420 |
| 2 / 3 | −1.6077 | 0.1275 | −12.604 |
| 3 / 4 | 0.3219 | 0.1204 | 2.674 |
| 4 / 5 | 2.2891 | 0.1291 | 17.735 |
Note: Thresholds represent cut-points separating adjacent preference categories on the latent ordinal scale rather than infrastructure-specific effects.
Disclaimer/Publisher’s Note: The statements, opinions and data contained in all publications are solely those of the individual author(s) and contributor(s) and not of MDPI and/or the editor(s). MDPI and/or the editor(s) disclaim responsibility for any injury to people or property resulting from any ideas, methods, instructions or products referred to in the content. |
© 2026 by the author. Licensee MDPI, Basel, Switzerland. This article is an open access article distributed under the terms and conditions of the Creative Commons Attribution (CC BY) license (http://creativecommons.org/licenses/by/4.0/).
Copyright: This open access article is published under a Creative Commons CC BY 4.0 license, which permit the free download, distribution, and reuse, provided that the author and preprint are cited in any reuse.